Back to Journals » Eye and Brain » Volume 17
Intraocular Pressure and Retinal Nerve Fiber Layer Changes in a Microgravity Mouse Model and Relevance to Spaceflight-Associated Neuro-Ocular Syndrome
Authors Zarrinbakhsh A ![]() , Gupta N, Sinha J, Zhou X, Chen S, Khan HM, Navajas EV, Beg MF, Liang Y, Yucel Y
, Gupta N, Sinha J, Zhou X, Chen S, Khan HM, Navajas EV, Beg MF, Liang Y, Yucel Y
Received 4 March 2025
Accepted for publication 30 October 2025
Published 6 November 2025 Volume 2025:17 Pages 137—149
DOI https://doi.org/10.2147/EB.S526204
Checked for plagiarism Yes
Review by Single anonymous peer review
Peer reviewer comments 2
Editor who approved publication: Dr Rustum Karanjia
Arya Zarrinbakhsh,1,2 Neeru Gupta,1– 6 Jessica Sinha,1 Xun Zhou,1,3 Shuo Chen,7 Haaris Mahmood Khan,4 Eduardo V Navajas,4 Mirza Faisal Beg,7 You Liang,8 Yeni Yucel1– 4,9– 11
1Keenan Research Centre for Biomedical Science, St. Michael’s Hospital, Unity Health Toronto, Toronto, Ontario, Canada; 2Department of Laboratory Medicine and Pathobiology, Temerty Faculty of Medicine, University of Toronto, Toronto, Ontario, Canada; 3Department of Ophthalmology and Vision Sciences, Temerty Faculty of Medicine, University of Toronto, Toronto, Ontario, Canada; 4Department of Ophthalmology and Visual Sciences, Faculty of Medicine, University of British Columbia, Vancouver, British Columbia, Canada; 5Dalla Lana School of Public Health, University of Toronto, Toronto, Ontario, Canada; 6School of Population and Public Health, Faculty of Medicine, University of British Columbia, Vancouver, British Columbia, Canada; 7School of Engineering Science, Faculty of Applied Sciences, Simon Fraser University, Vancouver, British Columbia, Canada; 8Department of Mathematics, Faculty of Science, Toronto Metropolitan University, Toronto, Ontario, Canada; 9Department of Physics, Faculty of Science, Toronto Metropolitan University, Toronto, Ontario, Canada; 10Faculty of Engineering and Architectural Science, Toronto Metropolitan University, Toronto, Ontario, Canada; 11Institute of Biomedical Engineering, Science and Technology (iBEST), St. Michael’s Hospital, Toronto Metropolitan University, Toronto, Ontario, Canada
Correspondence: Yeni Yucel, Keenan Research Centre for Biomedical Science, St. Michael’s Hospital, Unity Health Toronto, 30 Bond Street, Toronto, Ontario, M5B1W8, Canada, Tel +1 416 864 6060 extension 77594, Fax +1 416 864 5648, Email [email protected]
Purpose: Microgravity-induced headward fluid shifts are one of the mechanisms implicated in spaceflight-associated eye conditions, including intraocular pressure (IOP) and retinal nerve fiber layer (RNFL) thickness changes. In this longitudinal study, we investigated IOP and RNFL thickness changes over time in a mouse model of microgravity-induced headward fluid shifts.
Methods: The study involved 20 adult male B6(Cg)-Tyrc− 2J/J mice, randomly assigned to two groups: the hindlimb unloading (HU) mice, unloaded for 21 days followed by 14 days of release, and control mice kept under the same conditions except HU for 35 days. IOP and RNFL thickness in peripapillary and peripheral rings of right and left eyes were measured before and once a week after HU. Our analysis utilized mixed linear models to compare the estimated marginal means of IOP and RNFL thickness on each day with baseline values for each eye. Post hoc splined mixed linear models with a knot at day 14 were employed to assess the rate of IOP change in each segment.
Results: IOP was significantly elevated in both eyes of the HU mice on day 14 compared to baseline. The splined analysis revealed a bilateral positive rate of IOP change up to day 14, followed by a negative rate of change thereafter. In contrast, control mice displayed no significant differences in IOP at any timepoint. RNFL thicknesses of right eye peripapillary and peripheral rings were reduced after 1 week and 2 weeks, respectively. In contrast, left eye RNFL thickness measurements did not show any significant change compared to baseline.
Conclusion: The HU mouse model displays a distinct ocular phenotype that may be useful for understanding IOP and RNFL changes in microgravity and their relevance to Spaceflight-Associated Neuro-ocular Syndrome.
Keywords: hindlimb unloading, spaceflight-associated neuro-ocular syndrome, intraocular pressure, optical coherence tomography, retinal nerve fiber layer, mouse
Introduction
Spaceflight-Associated Neuro-ocular Syndrome (SANS) has been recognized as a pathology of the eye and optic nerve, with up to 45% of astronauts showing some sign of ocular abnormality after 30 days of spaceflight.1–3 It includes signs such as retinal and choroidal thickening and folds, retinal cotton wool spots, globe flattening, hyperopic refractive error shifts and optic disc edema.1,2,4–6 Because of the potential risk for astronauts’ performance and eye health,3 the mechanisms underlying SANS and eye imaging and other biomarkers and countermeasures are being investigated by multiple space agencies.6 While the exact etiology of SANS remains obscure, microgravity-induced headward fluid shifts have been hypothesized to be implicated in the pathophysiology of SANS.1,7
Intraocular pressure (IOP), a crucial parameter for eye health, has been investigated during spaceflight.8 IOP is the hydrostatic pressure that maintains the shape of the eye and ensures optimal optical properties for light transmission to the retina. Elevated IOP is a major risk factor for glaucoma which is the leading cause of irreversible blindness worldwide, estimated to affect more than 100 million people by 2040.9,10 The balance between the inflow and outflow of aqueous humor (AH) maintains the IOP, which plays an important role in ocular perfusion pressure and translaminar pressure difference homeostasis.11–13 Early spaceflight studies revealed an IOP increase of 20% after 44 min of entry into microgravity and 92% after 16 min of entry.14,15 Later spaceflight studies noted an elevated IOP in astronauts for several days before return to baseline,16,17 and parabolic flight studies also observed an increase in IOP in the microgravity phase of the flight.18,19 Despite early and recent observations of IOP fluctuations in microgravity, their relevance to the pathophysiology of SANS has not been systematically studied.
Spaceflight induces other changes in the eye, notably causing retinal nerve fiber (RNFL) changes assessed by optical coherence tomography (OCT).5,20 The RNFL consists of the axons of retinal ganglion cells (RGCs) and astrocytes,21 and changes in its thickness have been implicated in multiple ocular pathologies.22 Microgravity exposure has been shown to cause an increase in RNFL thickness (RNFLT), especially in the peripapillary region.5,20
Ground-analog experiments simulating microgravity-induced fluid shift in healthy volunteers, such as head-down tilt bed rest and dry immersion have been useful to understand physiological changes in microgravity conditions,23,24 and have been used to study SANS.6 Head-down tilt bed rest induced increase in both IOP25,26 and RNFLT,27 while dry immersion led to decrease in IOP28 and increase in RNFLT.29,30 The hindlimb unloading (HU) model in rats, an experimental ground model mimicking human head-down tilt bed rest in humans,31 has shown physiological adaptations of cardiovascular and musculoskeletal systems similar to those seen in astronauts in space.32 It has been adapted to study eye changes in rats.33–35 HU experiments in mice, also useful to understand microgravity-induced changes in astronaut biology,36 present opportunities to study genetically engineered strains and the role of specific molecular pathways in physiological adaptation.37 Although mice are used as an experimental model to understand IOP regulation and retinal function and structure due to similarities to humans,38 mouse HU models to study eye changes in simulated microgravity have not yet been deployed.
In this longitudinal study, we aimed to evaluate IOP and RNFLT changes over time in mice undergoing HU. We hypothesized that chronic HU could result in IOP and RNFLT changes.
Materials and Methods
Ethics Statement
All in vivo experiments complied with the ARVO Statement for the Use of Animals in Ophthalmic and Vision Research.39 Approval for these procedures was obtained from the Unity Health Toronto Animal Care Committee (Protocol #197), which operates in accordance with the standards set forth by the Canadian Council on Animal Care.40
Animals
For this study, twenty male B6(Cg)-Tyrc−2J/J mice aged between 6 and 8 months (The Jackson Laboratory, ME, USA) were utilized. These mice are coisogenic C57BL/6J mice homozygous for a mutated tyrosinase (Tyr) gene, resulting in a lack of pigment in the hair, skin, iris, retinal pigment epithelium (RPE) and choroid.41 Unlike C57BL/6N substrains, C57BL/6J substrains do not carry the rd8 mutation associated with retinal lesions, making them suitable for studies of ocular conditions.42,43 Three days before the experiments, mice were transferred from standard mouse cages (33.7 cm × 18.0 cm × 13.7 cm) to larger standard rat cages (48.3 cm × 26.7 cm × 20.3) for acclimation. The mice were maintained in a controlled environment with a 12-hour light-dark cycle and had ad libitum access to food and water. To prevent dehydration, each mouse received daily subcutaneous injections of 1 mL of 0.9% sodium chloride solution (Baxter Corporation, ON, Canada).
Hindlimb Unloading
Mice were divided into two groups randomly: the HU group (n = 10) and the control group (n = 10), with baseline body weights of 32.7 ± 2.5 g (mean ± standard deviation) and 33.6 ± 2.8 g, respectively. For the HU group, medical tape (3M Canada, ON, Canada) was employed to secure the tails to a custom-designed apparatus which permitted movement within a 360° arc and along the cage’s length. The HU mice were suspended at an approximate 30° angle to induce headward fluid shifts while reducing stress and uneven weight distribution on the forelimbs.31 Following the acclimation period, the HU mice underwent unloading for 21 days to mimic microgravity-induced headward fluid shifts, after which they were released for 14 days to mimic landing (Figure 1). Control mice were not subjected to unloading.
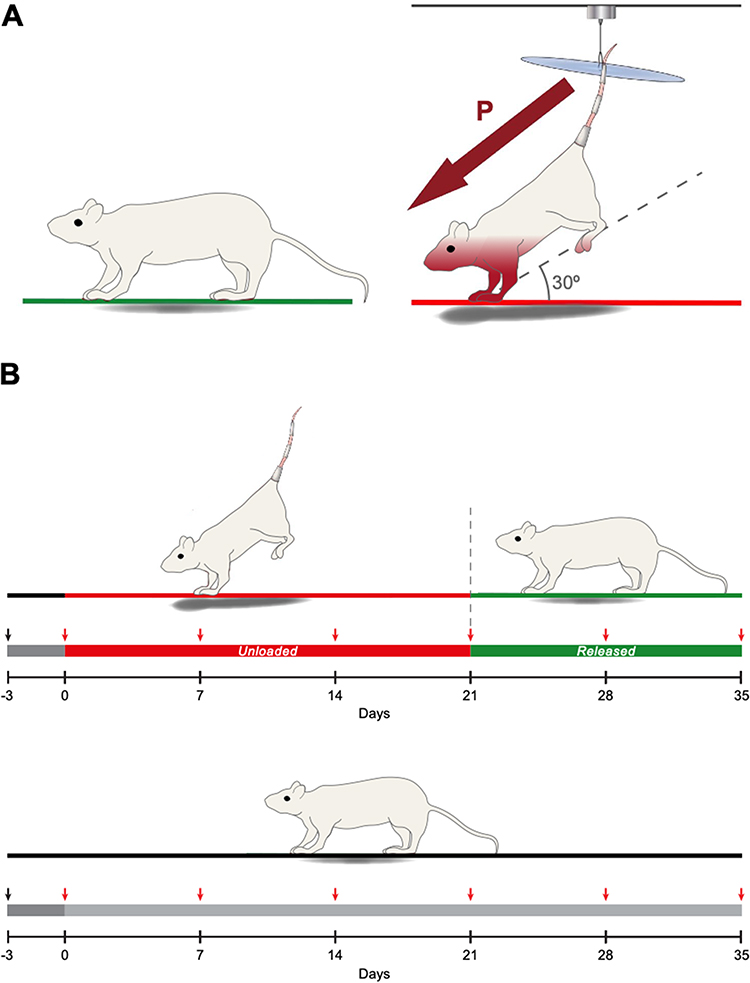 |
Figure 1 Hindlimb unloading paradigm and experimental design (A) Mice were suspended at a 30° angle. Maroon arrow depicts headward fluid pressure shifts. (B) Mice were acclimated for 3 days, then unloaded for 21 days before being released for 14 days. Red arrows depict weekly bilateral measurements to assess IOP and RNFL thickness. Control mice were not unloaded. |
IOP Measurement
IOP of both eyes was measured before (day 0) and weekly after HU until day 35. Under general anesthesia with inhalation of 2% isoflurane (Fresenius Kabi AG, Hesse, Germany) in 100% oxygen at a flow rate of 1 L/min, mice were stabilized in the prone position on a horizontal surface, and IOP was promptly measured within 1 min. IOP measurements were performed using a noninvasive rebound tonometer (TonoLab, Icare Finland Oy, Vantaa, Finland) positioned perpendicularly less than 4 mm from the central cornea.44,45 The first measured eye (right vs left) was randomized to prevent systematic bias.46 Each IOP measurement was determined by averaging six consecutive readings, with each eye being measured twice and averaged for accuracy.
Retinal Nerve Fiber Thickness Measurement
Following IOP measurements, 1% w/v tropicamide ophthalmic solution (Mydriacyl, Alcon, TX, USA) was administered to both eyes of mice for 3 minutes to induce pupil dilation and improve imaging quality. Drops were gently wiped off using a cotton swab, and eyes were washed with lubricant eye drops (Systane Complete, Alcon, TX, USA). Custom plano contact lenses with a diameter of 3.20 mm and back optic zone radius of 1.70 mm (Cantor & Nissel Ltd, Northamptonshire, UK) were fitted on both eyes before imaging. OCT was performed using an HRA+OCT Spectralis system (Heidelberg Engineering GmbH, Baden-Württemberg, Germany) set on the reflectance module at enhanced depth imaging mode with a custom +25 D lens fitted on the objective. Mice were placed in the prone position on a horizontal surface over a heating pad during imaging to prevent cataract formation,47 and volume scans were obtained for each eye in the automatic real-time mode, averaging 30 frames per image. The first imaged eye (right vs left) was randomized in each mouse. Each volume scan centered on the optic disc consisted of 31 B-scan lines with an interscan distance of 72 μm, covering a 30° × 25° area. Follow-up volume scans of each eye at different timepoints were performed using the tracking modality to ensure B-scan alignment. A segmentation deep neural network (DNN) originally trained on 58 human eye volume scans,48 was adapted for mouse eye OCT segmentation. Two segmentation boundaries were delineated: 1) the border between the RGC layer and the RNFL and 2) the border between the RNFL and the internal limiting membrane. The RNFL was defined as the region between boundaries 1 and 2. Following volume scan acquisition, B-scans were exported in TIFF format and cropped into 1536 pixels × 1126 pixels using Fiji image-processing software (version 2.9.0/1.53t).49 A total of 620 cropped B-scans from 20 volume scans were manually segmented using ITK-SNAP image segmentation software (version 3.8.0)50 and used to train the DNN. Peripheral B-scans far away from the papillary region (>720 μm) usually had poor quality and were excluded for segmentation. To avoid low-quality images, only 21 B-scans per volume scan were included for analyses: 10 superior and 10 inferior B-scans to the central B-scan. The central B-scan was defined by the following two criteria: 1) the scan transected the optic nerve head, and 2) the scan showed the largest RPE discontinuity across the optic nerve head. For each eye’s first volume scan, all B-scans transecting the optic nerve head and the B-scan were evaluated in Fiji, and the one with the largest RPE discontinuity was labelled as the central B-scan. Each eye’s central B-scan remained the same for its subsequent volume scans. The center of the RPE discontinuity in the central B-scan was marked as the volume scan center (VSC). The VSC was marked for each eye’s subsequent volume scans by morphological comparison. In total, 5040 B-scans were segmented using the pretrained DNN and subsequently manually corrected using ITK-SNAP to ensure highest level of precision. RNFLT was computed using a 3D k-nearest neighbors method, where each boundary was represented as a 3D point cloud and the nearest point on the adjacent boundary was identified to measure the Euclidean distance. To ensure distances were valid without resampling the intensity volume, the thickness field was directly interpolated, assuming linear variation between adjacent B-scans. This approach fills the space between B-scans, produces a dense isotropic thickness map, and avoids misinterpretation from a 2D per B-scan analysis. Since the optic nerve diameter is approximately 300 μm at the globe level,51,52 an optic nerve head exclusion region was included which consisted of a disc with a diameter of 288 μm centered on the VSC. RNFL thickness values in each eye were averaged within a peripapillary ring centred on the optic nerve head with radii 144 μm to 432 μm, and a peripheral ring with radii 432 μm to 720 μm (Figure 2).
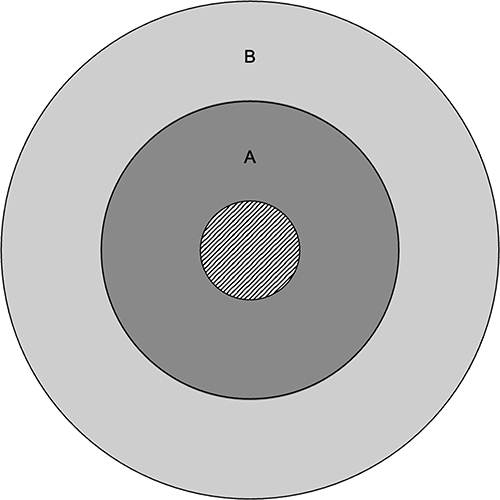 |
Figure 2 RNFLT Regions. Ring A (dark gray) depicts the peripapillary ring spanning the area between the circles with radii 144 μm and 432 μm. Ring B (light gray) depicts the peripheral ring spanning the area between the circles with radii 432 μm and 720 μm. The striped central disc depicts the optic disc. |
Statistical Analysis
All baseline descriptive statistics are presented as mean ± standard deviation (SD). Data were screened for statistical outliers, defined as values exceeding 3 standard deviations from the group mean. Sample size was set at 10 mice per group to balance statistical sensitivity with ethical considerations, with post hoc power analyses indicating moderate to high power across key contrasts, depending on eye, timepoint and outcome. Detailed power estimates are included in Supplementary Table 1. Throughout this study, linear mixed-effects models were implemented for longitudinal analysis of IOP and RNFLT, using R statistical analysis software (version 4.3.1).53 These models were established using the lme4 package (version 1.1.35.1),54 applying restricted maximum likelihood (REML) and considering time as a categorical variable.55 Subsequent analyses involved both between-group and within-group comparisons using t-tests on the estimated marginal means (EMMs) calculated via the emmeans package (version 1.10.0),56 with results presented as EMM ± standard error of the mean (SEM). For the IOP analysis, splined linear mixed-effects models incorporating a knot at day 14 were developed to examine time as a continuous variable, using REML for fitting.55 This specific time point was selected post hoc following the identification of an extremum in the data at day 14. The analysis also included simultaneous general linear hypothesis tests to assess the rate of change in each model, utilizing the multcomp package (version 1.4.25),57 and results were reported as rate of change ± SEM.55 Degrees of freedom were calculated using the Kenward-Roger approximation to ensure optimal control of Type I error rates.58 All statistical tests were adjusted for multiple comparisons using the Benjamini-Hochberg method to control the false discovery rate.59 Significance threshold was set at P < 0.05.
Results
Hindlimb Unloaded Mice Display an Elevated Intraocular Pressure After 14 Days
At baseline, the mean IOP for the HU group was 16.0 ± 1.8 mmHg for the right eye and 15.8 ± 2.1 mmHg for the left eye, while the mean IOP for the control group was 16.4 ± 1.8 mmHg for the right eye and 15.4 ± 2.0 mmHg for the left eye.
On day 0, IOP EMMs showed no difference between HU and control groups in both eyes. In the HU group, IOP EMMs were significantly greater than day 0 only on day 14 for the right eye (18.05 ± 0.57 mmHg, P < 0.05) and the left eye (17.55 ± 0.57 mmHg, P < 0.05) (Figure 3). In the control group, IOP EMMs were not significantly different from day 0 at any timepoint.
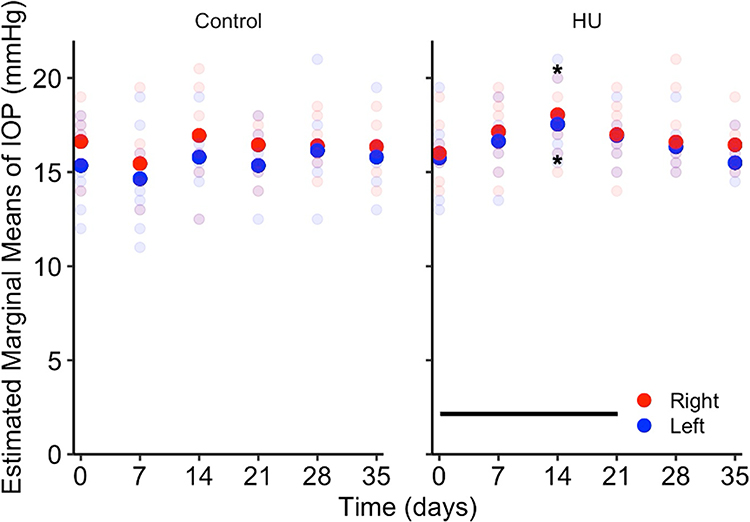 |
Figure 3 IOP in hindlimb unloaded and control mice. Hindlimb unloaded mice have increased IOP in both eyes on day 14 of suspension while control mice show no difference in IOP at any timepoint. Opaque disks denote IOP EMMs and translucent disks denote IOP measurements for each mouse. Horizontal line indicates HU period. *P < 0.05. |
Intraocular Pressure Increases Before Decreasing During Hindlimb Unloading
Given the elevated IOP at day 14 in the HU group, this day was set as a knot for splined linear mixed-effects modelling. In the HU group, simultaneous general linear hypothesis tests revealed a significant bilateral positive IOP rate of change from day 0 to 14 (right eye = 0.127 ± 0.046 mmHg/day, P < 0.05; left eye = 0.132 ± 0.045 mmHg/day, P < 0.01;) and a significant bilateral negative IOP rate of change from day 14 to 35 (right eye = −0.078 ± 0.031 mmHg/day, P < 0.05; left eye = −0.096 ± 0.033 mmHg, P < 0.01) (Figure 4). In the control group, there was no significant difference in IOP rate of change from day 0 to 14, or from day 14 to 35 in both eyes.
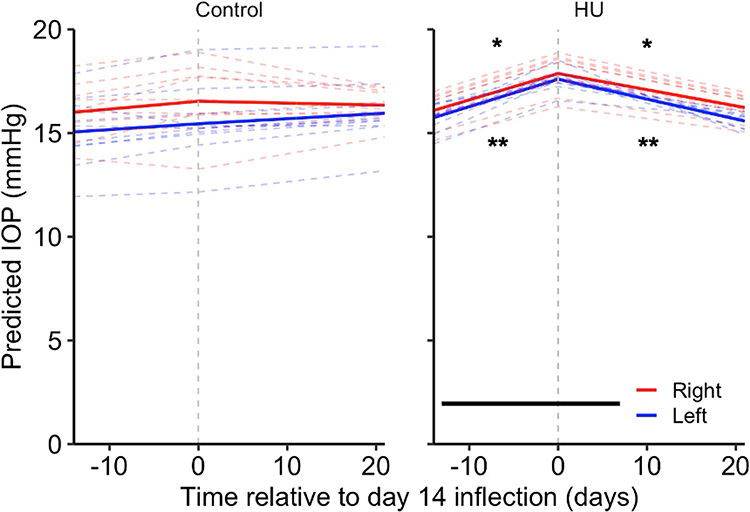 |
Figure 4 IOP rate of change in hindlimb unloaded and control mice. Hindlimb unloaded mice show a positive IOP rate of change in both eyes until day 14 of suspension before showing a negative IOP rate of change in both eyes while control mice show no difference in IOP rate of change. Solid lines denote predicted mean IOP responses and dashed lines denote predicted IOP responses for each mouse. Horizontal line indicates HU period. Time is expressed relative to the day 14 inflection (dashed vertical line), where negative and positive values indicate days before and after day 14 when the peak IOP response was observed, respectively. *P < 0.05, **P < 0.01. |
Hindlimb Unloaded Mice Display Persistent Retinal Nerve Fiber Layer Changes
Peripapillary and peripheral RNFLT measurements of the right eye and left eye are described in Table 1. On day 0, RNFLT EMMs showed no difference between HU and control groups in both regions of each eye. In the HU group, right eye peripapillary RNFLT EMMs were significantly lower than day 0 on day 7 and subsequent days (Figure 5A). Right eye peripheral RNFLT EMMs were significantly lower than day 0 on day 14 and subsequent days (Figure 5A). In the left eye of the HU and control groups, peripapillary and peripheral RNFLT EMMs were not significantly different from day 0 at any timepoint (Figure 5B).
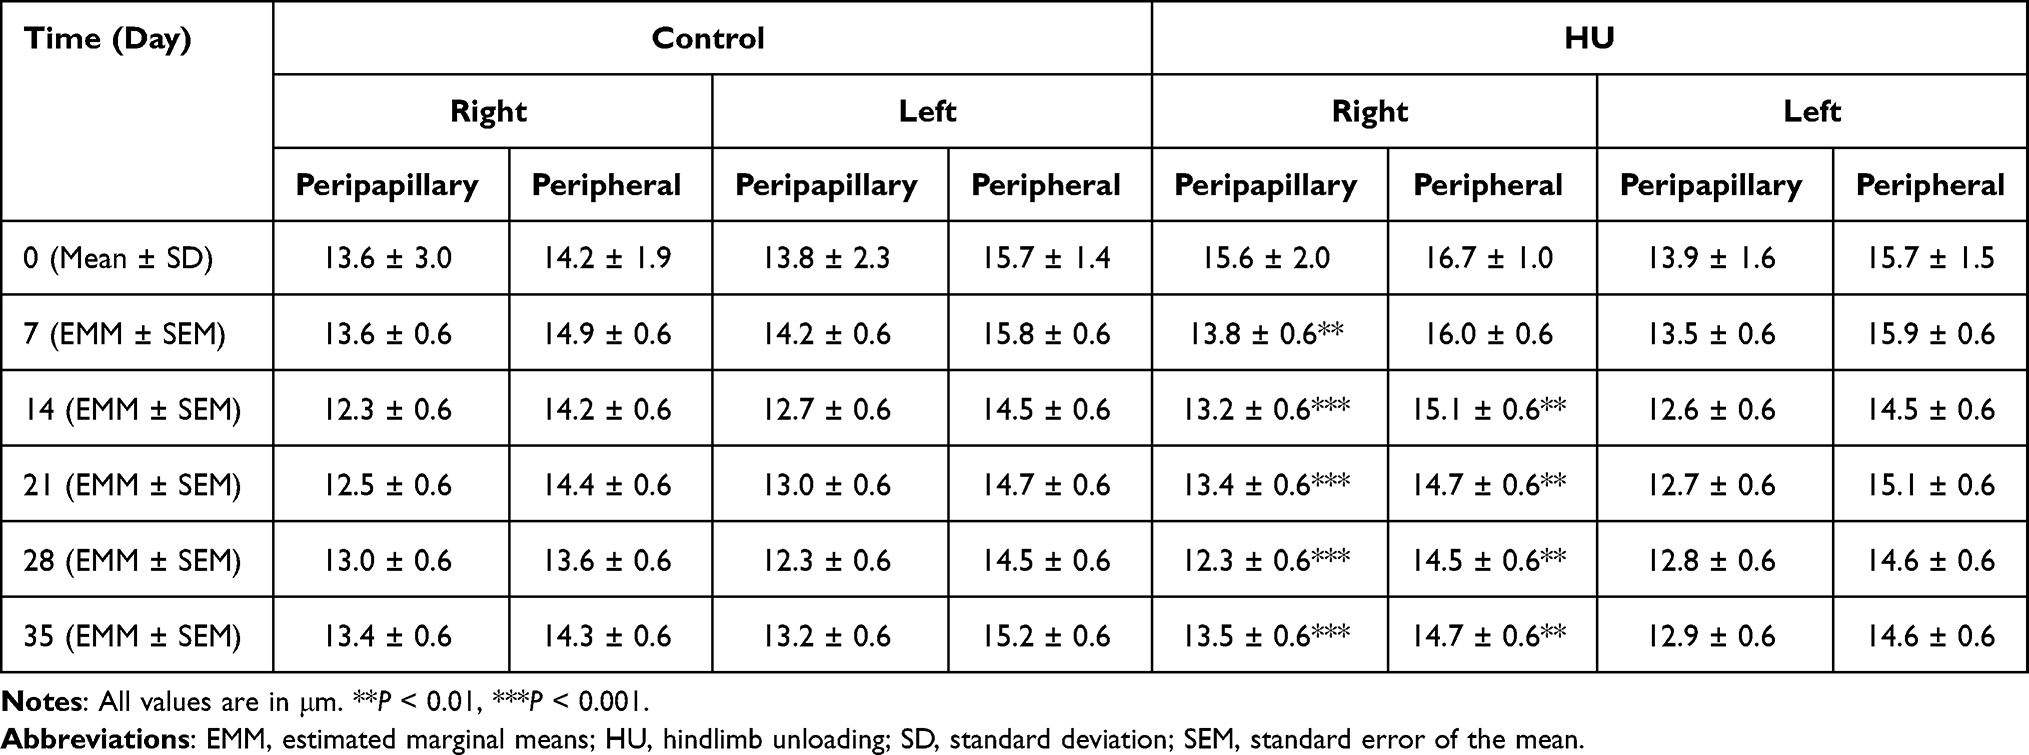 |
Table 1 RNFLT Values for Control and HU Groups in the Peripapillary and Peripheral Rings of the Right and Left Eyes |
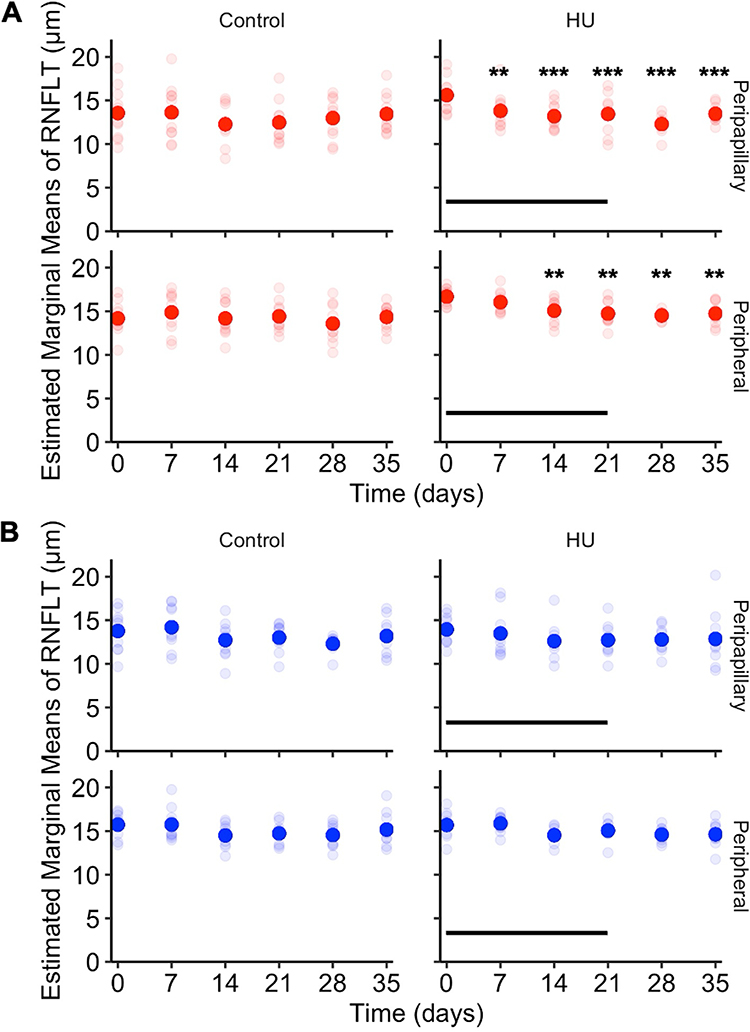 |
Figure 5 RNFLT in hindlimb unloaded and control mice. (A) Right eye RNFLT. Hindlimb unloaded mice have decreased right eye RNFLT in the peripapillary ring on days 7 to 35 and in the peripheral ring on days 14 to 35 while control mice show no difference in RNFLT at any timepoint. (B) Left eye RNFLT. Hindlimb unloaded mice and control mice show no difference in RNFLT at any timepoint. Opaque disks denote RNFLT EMMs and translucent disks denote RNFLT measurements for each mouse. Horizontal lines indicate HU period. **P < 0.01, ***P < 0.001. |
Discussion
Over time, changes in IOP and RNFLT have been shown in this adult mouse model of microgravity. Longitudinal IOP measurements during the HU revealed a significant elevation of IOP after 14 days of HU. This was followed by a progressive decrease during the third week of unloading. In comparison, hindlimb unloaded 3-month-old and 9-month-old male rats showed similar IOP dynamic changes with IOP peak at 45 days and 90 days after unloading, respectively.60 The HU mice in the current study displayed a negative rate of IOP change after 14 days of suspension (Figure 4), but IOP levels were not significantly different from baseline at subsequent measurements (days 21, 28, and 35). This finding is in keeping with progressive IOP decrease observed after landing in the male hindlimb unloaded rats.60 DBA/2J mice placed in a 60° head-down tilt for 30 minutes showed an immediate IOP elevation while the animals remained in the tilted position, that did not persist after a return to a horizontal position.61 By contrast, in the present study, mice were chronically unloaded at 30° for three weeks, and IOP measured in a transient horizontal position remained elevated on day 14 of HU, suggesting that chronic headward fluid shifts may induce a sustained IOP elevation. The subsequent IOP decrease after day 14, despite continued unloading, hints at some time-dependent physiological adaptation. Ten-week-old male C57BL/6 mice showed variable results after 35 days of flight on the International Space Station, with one study showing a significant decrease in left eye IOP compared to preflight baseline,62 and another study from the same group showing no change in IOP compared to baseline.63 Since age seems to affect IOP response as evidenced by the observations in rat HU, the different results between the mice in the present study and the mice sent aboard the International Space Station could in part be caused by differences in age. Different strains of mice also exhibit different IOP profiles,64 which could affect their response to microgravity and explain the difference between the results in this study and the ones acquired after microgravity exposure.62,63 The complexity and cost of such experimentation involving spaceflight highlights the need for ground-based animal models.
Spaceflight studies reveal a sharp but transient increase in IOP immediately after exposure to microgravity, which is then reversed. During the German Spacelab Mission, IOP values surged 92% initially but normalized within 6 h.15 Similarly, astronauts in the Space Shuttle Program showed IOP increases during microgravity exposure.17 Despite differences in tonometry methods – applanation, indentation and rebound – the IOP changes in this study suggest physiological responses rather than methodological artifacts.65 Rebound tonometry, in particular, is widely deployed in rodent studies and has been shown to provide accurate and reproducible IOP measurements in mice.45,66 The mouse model that is described here is an appropriate model to study the transient IOP change observed during spaceflight, characterized by an increase followed by a decrease of IOP.
AH and uveal blood, especially choroidal blood, are the main compartments generating IOP in normal gravity. Mice display similar ocular anatomy and AH dynamics as humans,67,68 making them suitable model organisms for translational IOP research. This mouse HU model would be useful to understand the mechanisms underlying the IOP increase in early microgravity, and the subsequent decrease during spaceflight and after landing.8 IOP is determined by the balance between AH production and drainage, and the observed response in this model may reflect either increased production or reduced outflow.67,68 Intra- or extraocular fluid shifts could disrupt this balance by influencing vascular dynamics governing outflow. Intracranial blood vessels branch into orbital blood vessels which are connected to ocular blood vessels. Notably, the episcleral venous system drains into the superior ophthalmic veins and anterior ciliary veins, which then drain into the cavernous sinus.69 An increase in cephalic blood pressure would propagate into an increase in episcleral venous pressure (EVP), obstructing AH drainage through the conventional outflow pathway and elevating IOP, as described by the Goldmann equation and observed in patients with Radius-Maumenee Syndrome.70,71 Supporting this mechanism, HU in rats has been shown to cause cerebral artery remodeling without affecting mesenteric and splenic arteries, suggesting increased cephalic blood pressure.72 Furthermore, EVP elevation positively correlates with IOP elevation in humans and mice.73,74 It would be possible to investigate the role of changes in the volume of intraocular blood and AH dynamics, including EVP, in the HU mouse model. Non-invasive eye and orbit imaging may be used in this model to assess the variation of intraocular and extraocular blood compartments during the fluctuation of IOP in early and late unloading and after release. Headward fluid shifts due to microgravity, may increase the intraocular blood content, particularly within the choroid, thereby elevating IOP.8 The autonomic nervous system influences both AH production and outflow,75 as well as choroidal blood flow.76,77 Further experiments should be performed to study IOP changes integrated with continuous monitoring of the autonomic nervous system.78
Longitudinal RNFLT measurements during the HU experiments revealed significant changes in the right eye. The right eye peripapillary and peripheral RNFL thinning started on day 7 and day 14 (Figure 5), respectively, and persisted after release. In contrast, left eye RNFL measurements did not show any significant change. The RNFL is composed of the astrocytes in addition to RGC axons, and the thinning of the RNFL in the right eye may be caused by remodeling of astrocytes and extracellular environment changes rather than loss of RGCs or their axons. Astrocytes have mechanosensitive properties and respond to changes in IOP,79,80 as well as aquaporin-4 channels that are involved in fluid exchange with the extracellular space.81,82 Macular thinning occurring during long-duration spaceflight in addition to the increase in peripapillary RNFL thickness83 suggests that microanatomical differences of astrocytes between different parts of the retina21 may be implicated in these observed differences. The fact that HU mice showed RNFL thinning lasting after release only in the right eye, while a transient IOP increase at 14 days was seen in both eyes, suggests that factors other than IOP are implicated in the retinal changes. A recent study showed that attenuation in neuroretinal rim thinning in postural differences from seated to 6° head-down tilt may be due to translaminar pressure difference, the difference between IOP and intracranial pressure.84 It is interesting to note that RNFL thickening persists years after flight in some of the astronauts with an asymmetrical pattern, with predilection in the right eye.85 Longer duration HU studies are needed to determine whether the RNFL thinning is reversible and whether it causes pathological changes such as increased retinal apoptosis observed in rats after 12 weeks of HU35 and in mice after 35 days in microgravity on the International Space Station.62 Moreover, the earlier involvement of the peripapillary ring compared to the peripheral ring (day 7 vs day 14) in this study suggests that effects are most pronounced in peripapillary region. This is consistent with evidence from human imaging studies showing that RNFL thickening during SANS is greatest around the optic nerve head and diminishes toward the periphery of the retina.5 Transient IOP elevation during HU may have contributed to RNFL thinning, as short-term IOP elevation can trigger RNFL thinning, which persisted after IOP reduction in non-human primates.86 Future studies are needed to assess the relative contribution of IOP increase and IOP-independent mechanisms to RNFL thinning in the HU mouse model.
Microgravity leads to a collapse of tissue compressive force. While this HU mouse model mimics microgravity-induced headward fluid shifts, it is unlikely to replicate this loss of mechanical unloading. Furthermore, mouse eyes provide a useful model for investigating ocular changes over time; their translatability is limited by structural differences relevant to this study, including a smaller size, thinner retinae and a lower RGC density compared to humans.87,88
While this study included IOP as a measurable ocular physiological parameter, it is important to note that IOP variations are not currently part of the formal diagnostic criteria for SANS. As SANS is characterized by a constellation of ocular findings, including retinal and choroidal thickening and optic disc edema, future studies should incorporate additional eye imaging parameters (eg, total retinal thickness and choroidal thickness) with larger sample sizes to assess the translational relevance of mouse HU for SANS research. Fluid dynamics in the eye (eg, AH production and outflow pathways) and around it (eg, optic nerve glymphatics, translaminar pressure difference and choroidal circulation) warrant investigation using the HU model.
A previous study in DBA/2J mice showed that IOP elevation induced by short-term head-down body tilt caused reduction of pattern electroretinogram (ERG) amplitude in eyes of DBA/2J mice older than 5 months but not in eyes of younger mice, suggesting age-dependent susceptibility of RGC function.61 Additionally, C57BL/6 mice flown for 35 days aboard the ISS exhibited significant reductions in both ERG a-wave and b-wave amplitudes post-flight, indicating photoreceptor and inner retinal function impairment.63 These findings underscore the importance of complementing IOP and structural measures with retinal functional assessments. Future studies using functional tests of the retina, such as ERG in HU experiments, are needed to reveal whether HU leads to photoreceptor and inner retina dysfunction.
Elevated IOP, as a modifiable risk factor for glaucoma, holds significant potential to exacerbate ocular pathology, especially during long-duration spaceflight. Understanding, prevention, and treatment of elevated IOP during spaceflight could prevent visual impairment during space missions.
Conclusion
The HU mouse model of headward fluid shifts under microgravity conditions showed bilaterally elevated IOP, peaking on day 14 and reduced RNFLT starting on day 7 in the right eye. In our sample, the IOP subsequently decreased, indicating an adaptive response to the initial elevation while the right eye RNFLT did not. These findings reflect the transient IOP changes observed in astronauts during early spaceflight, supporting the relevance of the HU mouse model for investigating ocular responses to microgravity. While this model does not comprehensively replicate spaceflight conditions other than headward fluid shifts, it provides an opportunity for studying some of the ocular responses to microgravity and highlights the need for further studies to explore mechanisms underlying adaptive and maladaptive IOP and retinal changes in microgravity.
Abbreviations
AH, aqueous humor; CI, confidence interval; DNN, deep neural network; EMM, estimated marginal means; ERG, electroretinogram; EVP, episcleral venous pressure; HU, hindlimb unloading; IOP, intraocular pressure; OCT, optical coherence tomography; REML, restricted maximum likelihood; RGC, retinal ganglion cell; RNFL, retinal nerve fiber layer; RNFLT, retinal nerve fiber layer thickness; RPE, retinal pigment epithelium; SANS, Spaceflight-Associated Neuro-ocular Syndrome; SEM, standard error of the mean; VSC, volume scan center.
Acknowledgments
The authors are grateful to Luz Paczka Giorgi, BSc, MDes, for assistance with the design and preparation of Figure 1. This work was supported by the Canadian Space Agency [19HLSRM02; YY, NG]; the Henry Farrugia Ophthalmic Pathology Research Fund (YY); the Canadian Foundation for Innovation Leaders Opportunity Fund [31326; YY, NG]; the Natural Science and Engineering Research Council of Canada – Canada Graduate Scholarships (AZ); and the Vision Science Research Program Award (AZ).
Disclosure
The authors report no conflicts of interest in this work.
References
1. Mader TH, Gibson CR, Pass AF, et al. Optic disc edema, globe flattening, choroidal folds, and hyperopic shifts observed in astronauts after long-duration space flight. Ophthalmology. 2011;118(10):2058–2069. doi:10.1016/j.ophtha.2011.06.021
2. Lee AG, Mader TH, Gibson CR, et al. Spaceflight associated neuro-ocular syndrome (SANS) and the neuro-ophthalmologic effects of microgravity: a review and an update. Npj Microgravity. 2020;6(1):7. doi:10.1038/s41526-020-0097-9
3. Patel ZS, Brunstetter TJ, Tarver WJ, et al. Red risks for a journey to the red planet: the highest priority human health risks for a mission to Mars. Npj Microgravity. 2020;6(1):1–13. doi:10.1038/s41526-020-00124-6
4. Kramer LA, Sargsyan AE, Hasan KM, Polk JD, Hamilton DR. Orbital and intracranial effects of microgravity: findings at 3-T MR imaging. Radiology. 2012;263(3):819–827. doi:10.1148/radiol.12111986
5. Patel N, Pass A, Mason S, Gibson CR, Otto C. Optical coherence tomography analysis of the optic nerve head and surrounding structures in long-duration International Space Station Astronauts. JAMA Ophthalmol. 2018;136(2):193. doi:10.1001/jamaophthalmol.2017.6226
6. Stern C, Yucel YH, Zu Eulenburg P, Pavy-Le Traon A, Petersen LG. Eye-brain axis in microgravity and its implications for Spaceflight Associated Neuro-ocular Syndrome. Npj Microgravity. 2023;9(1):1–8. doi:10.1038/s41526-023-00300-4
7. Lee AG, Mader TH, Gibson CR, Tarver W. Space flight–associated neuro-ocular syndrome. JAMA Ophthalmol. 2017;135(9):992. doi:10.1001/jamaophthalmol.2017.2396
8. Yucel YH, Gupta N. Intraocular Pressure Considerations. In: Michael AP, Otto C, Reschke MF, Hargens AR, editors. Spaceflight and the Central Nervous System. Springer International Publishing; 2022:87–105. doi:10.1007/978-3-031-18440-6_7
9. Tham YC, Li X, Wong TY, Quigley HA, Aung T, Cheng CY. Global prevalence of glaucoma and projections of glaucoma burden through 2040. Ophthalmology. 2014;121(11):2081–2090. doi:10.1016/j.ophtha.2014.05.013
10. Weinreb RN, Aung T, Medeiros FA. The pathophysiology and treatment of glaucoma: a review. JAMA. 2014;311(18):1901–1911. doi:10.1001/jama.2014.3192
11. Kiel JW, van Heuven WA. Ocular perfusion pressure and choroidal blood flow in the rabbit. Investig Ophthalmol Visual Sci. 1995;36(3):579–585.
12. Polska E, Simader C, Weigert G, et al. Regulation of choroidal blood flow during combined changes in intraocular pressure and arterial blood pressure. Investig Ophthalmol Visual Sci. 2007;48(8):3768–3774. doi:10.1167/iovs.07-0307
13. Lee DS, Lee EJ, Kim TW, et al. Influence of translaminar pressure dynamics on the position of the anterior lamina cribrosa surface. Investig Ophthalmol Visual Sci. 2015;56(5):2833–2841. doi:10.1167/iovs.14-15869
14. Draeger J, Wirt H, Schwartz R. “TOMEX”, Messung des Augeninnendrucks unter μG-Bedingungen. Naturwissenschaften. 1986;73(7):450–452. doi:10.1007/BF00367295
15. Draeger J, Schwartz R, Groenhoff S, Stern C. Self-tonometry under microgravity conditions. Clin Investig. 1993;71(9):700–703. doi:10.1007/BF00209723
16. Young CK, Woo SJ, Yi S, et al. Diurnal pattern of intraocular pressure is affected by microgravity when measured in space with the pressure phosphene tonometer (PPT). Journal of Glaucoma. 2011;20(8):488. doi:10.1097/IJG.0b013e3181f464d2
17. Dalal SR, Ramachandran V, Khalid R, Keith Manuel F, Knowles JR, Jones JA. Increased intraocular pressure in glaucomatous, ocular hypertensive, and normotensive space shuttle crew. Aerospace Med Human Performance. 2021;92(9):728–733. doi:10.3357/AMHP.5455.2021
18. Mader TH, Gibson CR, Caputo M, et al. Intraocular pressure and retinal vascular changes during transient exposure to microgravity. Am J Ophthalmol. 1993;115(3):347–350. doi:10.1016/S0002-9394(14)73586-X
19. Anderson AP, Swan JG, Phillips SD, et al. Acute effects of changes to the gravitational vector on the eye. J Appl Physiol. 2016;120(8):939–946. doi:10.1152/japplphysiol.00730.2015
20. Pardon LP, Greenwald SH, Ferguson CR, et al. Identification of factors associated with the development of optic disc edema during spaceflight. JAMA Ophthalmol. 2022;140:1193. doi:10.1001/jamaophthalmol.2022.4396
21. Holden JM, Wareham LK, Calkins DJ. Retinal astrocyte morphology predicts integration of vascular and neuronal architecture. Front Neurosci. 2023;17. doi:10.3389/fnins.2023.1244679
22. Du J, Du Y, Xue Y, Wang H, Li Y. Factors associated with changes in peripapillary retinal nerve fibre layer thickness in healthy myopic eyes. J Ophthalmol. 2021;2021:3462004. doi:10.1155/2021/3462004
23. Pavy-Le Traon A, Heer M, Narici MV, Rittweger J, Vernikos J. From space to Earth: advances in human physiology from 20 years of bed rest studies (1986–2006). Eur J Appl Physiol. 2007;101(2):143–194. doi:10.1007/s00421-007-0474-z
24. Pandiarajan M, Hargens AR. Ground-based analogs for human spaceflight. Front Physiol. 2020;11. doi:10.3389/fphys.2020.00716
25. Chen W, Xiang Y, Deng CH, Zhang H, Wang JM. Analogs of microgravity: the function of Schlemm’s canal, intraocular pressure and autonomic nervous during the head-down tilt test in healthy subjects. Int J Ophthalmol. 2021;14(9):1419–1423. doi:10.18240/ijo.2021.09.19
26. Shinojima A, Ichi IK, Aoki K, Ogawa Y, Yanagida R, Yuzawa M. Subfoveal choroidal thickness and foveal retinal thickness during head-down tilt. Aviat Space Environ Med. 2012;83(4):388–393. doi:10.3357/ASEM.3191.2012
27. Taibbi G, Cromwell RL, Zanello SB, et al. Ocular outcomes comparison between 14- and 70-day head-down-tilt bed rest. Investig Ophthalmol Visual Sci. 2016;57(2):495–501. doi:10.1167/iovs.15-18530
28. Man’ko OM, Smoleevsky AE, Tomilovskaya ES. Change in eye hydrodynamics as a pathogenesis factor of space-flight associated neuro-ocular syndrome (SANS). Hum Physiol. 2022;48(7):856–862. doi:10.1134/S0362119722070131
29. Kermorgant M, Sadegh A, Geeraerts T, et al. Effects of venoconstrictive thigh cuffs on dry immersion-induced ophthalmological changes. Front Physiol. 2021;12. doi:10.3389/fphys.2021.692361
30. Kermorgant M, Chedmail T, Varenne F, et al. Neuro-ophthalmological changes in healthy females exposed to a 5-day dry immersion: a pilot study. Npj Microgravity. 2024;10(1):1–5. doi:10.1038/s41526-024-00344-0
31. Globus RK, Morey-Holton E. Hindlimb unloading: rodent analog for microgravity. J Appl Physiol. 2016;120(10):1196–1206. doi:10.1152/japplphysiol.00997.2015
32. Hawliczek A, Brix B, Al Mutawa S, et al. Hind-limb unloading in rodents: current evidence and perspectives. Acta Astronautica. 2022;195:574–582. doi:10.1016/j.actaastro.2022.03.008
33. Li S, Song Q, Wu B, et al. Structural damage to the rat eye following long-term simulated weightlessness. Exp Eye Research. 2022;223:109200. doi:10.1016/j.exer.2022.109200
34. Mu Y, Wei D, Yao L, et al. Choroidal circulation disturbance is an initial factor in outer retinal degeneration in rats under simulated weightlessness. Front Physiol. 2023;14:1198862. doi:10.3389/fphys.2023.1198862
35. Zhao HW, Zhao J, Hu LN, et al. Effect of long-term weightlessness on retina and optic nerve in tail-suspension rats. Int J Ophthalmol. 2016;9(6):825–830. doi:10.18240/ijo.2016.06.06
36. Powers J, Bernstein D. The mouse as a model of cardiovascular adaptations to microgravity. J Appl Physiology. 2004;97(5):1686–1692. doi:10.1152/japplphysiol.00925.2003
37. Williams RS, Wagner PD. Transgenic animals in integrative biology: approaches and interpretations of outcome. J Appl Physiology. 2000;88(3):1119–1126. doi:10.1152/jappl.2000.88.3.1119
38. McDowell CM, Kizhatil K, Elliott MH, et al. Consensus recommendation for mouse models of ocular hypertension to study aqueous humor outflow and its mechanisms. Investig Ophthalmol Visual Sci. 2022;63(2):12. doi:10.1167/iovs.63.2.12
39. The Association for Research in Vision and Ophthalmology. ARVO statement for the use of animals in ophthalmic and vision research; 2021. Available from: https://www.arvo.org/About/policies/arvo-statement-for-the-use-of-animals-in-ophthalmic-and-vision-research/.
40. Canadian Council on Animal Care. CCAC guidelines: mice; 2022.
41. Le Fur N, Kelsall SR, Mintz B. Base substitution at different alternative splice donor sites of the tyrosinase gene in murine albinism. Genomics. 1996;37(2):245–248. doi:10.1006/geno.1996.0551
42. Mattapallil MJ, Wawrousek EF, Chan CC, et al. The Rd8 mutation of the Crb1 gene is present in vendor lines of C57BL/6N mice and embryonic stem cells, and confounds ocular induced mutant phenotypes. Investig Ophthalmol Visual Sci. 2012;53(6):2921–2927. doi:10.1167/iovs.12-9662
43. Simon MM, Greenaway S, White JK, et al. A comparative phenotypic and genomic analysis of C57BL/6J and C57BL/6N mouse strains. Genome Biol. 2013;14(7):R82. doi:10.1186/gb-2013-14-7-r82
44. Icare. Icare TONOLAB Manual; 2015. Available from: https://tonovet.com/wp-content/uploads/2015/12/TONOLAB_manual_2.2_EN.pdf.
45. Wang WH, Millar JC, Pang IH, Wax MB, Clark AF. Noninvasive measurement of rodent intraocular pressure with a rebound tonometer. Investig Ophthalmol Visual Sci. 2005;46(12):4617–4621. doi:10.1167/iovs.05-0781
46. Pekmezci M, Chang ST, Wilson BS, Gordon MO, Bhorade AM. Effect of measurement order between right and left eyes on intraocular pressure measurement. Arch Ophthalmol. 2011;129(3):276–281. doi:10.1001/archophthalmol.2011.33
47. Bermudez MA, Vicente AF, Romero MC, Arcos MD, Abalo JM, Gonzalez F. Time course of cold cataract development in anesthetized mice. Current Eye Res. 2011;36(3):278–284. doi:10.3109/02713683.2010.542868
48. Ma D, Lu D, Chen S, et al. LF-UNet – a novel anatomical-aware dual-branch cascaded deep neural network for segmentation of retinal layers and fluid from optical coherence tomography images. Computerized Med Imaging Graphics. 2021;94:101988. doi:10.1016/j.compmedimag.2021.101988
49. Schindelin J, Arganda-Carreras I, Frise E, et al. Fiji: an open-source platform for biological-image analysis. Nat Methods. 2012;9(7):676–682. doi:10.1038/nmeth.2019
50. Yushkevich PA, Piven J, Hazlett HC, et al. User-guided 3D active contour segmentation of anatomical structures: significantly improved efficiency and reliability. NeuroImage. 2006;31(3):1116–1128. doi:10.1016/j.neuroimage.2006.01.015
51. Fujita Y, Imagawa T, Uehara M. Comparative study of the lamina cribrosa and the pial septa in the vertebrate optic nerve and their relationship to the myelinated axons. Tissue and Cell. 2000;32(4):293–301. doi:10.1054/tice.2000.0115
52. Tao W, Dvoriantchikova G, Tse BC, et al. A novel mouse model of traumatic optic neuropathy using external ultrasound energy to achieve focal, indirect optic nerve injury. Sci Rep. 2017;7(1):11779. doi:10.1038/s41598-017-12225-6
53. R Core Team. R: a language and environment for statistical computing; 2023. Available from: https://www.R-project.org.
54. Bates D, Mächler M, Bolker B, Walker S. Fitting linear mixed-effects models using lme4. J Stat Software. 2015;67:1–48. doi:10.18637/jss.v067.i01
55. Crippa A. A review of Longitudinal Data Analysis in R; 2022. Available from: https://rstudio-pubs-static.s3.amazonaws.com/980908_7c78b756a2174bddb8a38d3ffd8b5966.html.
56. Lenth R. emmeans: estimated marginal means, aka least-squares means; 2023. Available from: https://CRAN.R-project.org/package=emmeans.
57. Hothorn T, Bretz F, Westfall P. Simultaneous inference in general parametric models. Biometrical J. 2008;50(3):346–363. doi:10.1002/bimj.200810425
58. Luke SG. Evaluating significance in linear mixed-effects models in R. Behav Res. 2017;49(4):1494–1502. doi:10.3758/s13428-016-0809-y
59. Benjamini Y, Hochberg Y. Controlling the false discovery rate: a practical and powerful approach to multiple testing. J R Stat Soc. 1995;57(1):289–300. doi:10.1111/j.2517-6161.1995.tb02031.x
60. Theriot CA, Chevez-Barrios P, Loughlin T, Beheshti A, Mercaldo ND, Zanello SB. The impact of hindlimb suspension on the rat eye: a molecular and histological analysis of the retina. Gravitational Space Res. 2021;9(1):86–103. doi:10.2478/gsr-2021-0007
61. Nagaraju M, Saleh M, Porciatti V. IOP-dependent retinal ganglion cell dysfunction in glaucomatous DBA/2J mice. Invest Ophthalmol Vis Sci. 2007;48(10):4573. doi:10.1167/iovs.07-0582
62. Mao XW, Nishiyama NC, Byrum SD, et al. Characterization of mouse ocular response to a 35-day spaceflight mission: evidence of blood-retinal barrier disruption and ocular adaptations. Sci Rep. 2019;9(1):8215. doi:10.1038/s41598-019-44696-0
63. Mao X, Stanbouly S, Holley J, Pecaut M, Crapo J. Evidence of spaceflight-induced adverse effects on photoreceptors and retinal function in the mouse eye. Int J Mol Sci. 2023;24(8):7362. doi:10.3390/ijms24087362
64. Savinova OV, Sugiyama F, Martin JE, et al. Intraocular pressure in genetically distinct mice: an update and strain survey. BMC Genetics. 2001;2(1):12. doi:10.1186/1471-2156-2-12
65. Kim CY, Kuehn MH, Anderson MG, Kwon YH. Intraocular pressure measurement in mice: a comparison between Goldmann and rebound tonometry. Eye. 2007;21(9):1202–1209. doi:10.1038/sj.eye.6702576
66. Pease ME, Cone FE, Gelman S, Son JL, Quigley HA. Calibration of the TonoLab tonometer in mice with spontaneous or experimental glaucoma. Investig Ophthalmol Visual Sci. 2011;52(2):858–864. doi:10.1167/iovs.10-5556
67. Aihara M, Lindsey JD, Weinreb RN. Aqueous humor dynamics in mice. Investig Ophthal Visual Sci. 2003;44(12):5168–5173. doi:10.1167/iovs.03-0504
68. Lei Y, Overby DR, Boussommier-Calleja A, Stamer WD, Ethier CR. Outflow physiology of the mouse eye: pressure dependence and washout. Investig Ophthalmol Visual Sci. 2011;52(3):1865–1871. doi:10.1167/iovs.10-6019
69. Nassr MA, Morris CL, Netland PA, Karcioglu ZA. Intraocular pressure change in orbital disease. Surv Ophthalmol. 2009;54(5):519–544. doi:10.1016/j.survophthal.2009.02.023
70. de Melo Marques SH, Farinha C, Martins A, Faria P. Radius-Maumenee syndrome: a rare cause of glaucoma. Case Reports. 2018;2018:bcr. doi:10.1136/bcr-2017-223255
71. Toris CB, Gagrani M, Ghate D. Current methods and new approaches to assess aqueous humor dynamics. Expert Rev Ophthalmol. 2021;16(3):139–160. doi:10.1080/17469899.2021.1902308
72. Wilkerson MK, Muller-Delp J, Colleran PN, Delp MD. Effects of hindlimb unloading on rat cerebral, splenic, and mesenteric resistance artery morphology. J Appl Physiol. 1999;87(6):2115–2121. doi:10.1152/jappl.1999.87.6.2115
73. Friberg TR, Sanborn G, Weinreb RN. Intraocular and episcleral venous pressure increase during inverted posture. Am J Ophthalmol. 1987;103(4):523–526. doi:10.1016/j.ajo.2010.03.018
74. Aihara M, Lindsey JD, Weinreb RN. Episcleral venous pressure of mouse eye and effect of body position. Curr Eye Res. 2003;27(6):355–362. doi:10.1076/ceyr.27.6.355.18194
75. Gabelt BT, Kaufman PL. Production and Flow of Aqueous Humor. In: Levin LA, Nilsson SFE, Ver Hoeve J, Wu S, Kaufman PL, Alm A, editors. Adler’s Physiology of the Eye.
76. Kiel JW. The Ocular Circulation. Morgan & Claypool Life Sciences; 2010. http://www.ncbi.nlm.nih.gov/books/NBK53323/.
77. McDougal DH, Gamlin PD. Autonomic control of the eye. Comprehens Physiol. 2015;5(1):439–473. doi:10.1002/cphy.c140014
78. Hélissen O, Kermorgant M, Déjean S, et al. Autonomic nervous system adaptation and circadian rhythm disturbances of the cardiovascular system in a ground-based murine model of spaceflight. Life. 2023;13(3):844. doi:10.3390/life13030844
79. Beckel JM, Argall AJ, Lim JC, et al. Mechanosensitive release of adenosine 5′‐triphosphate through pannexin channels and mechanosensitive upregulation of pannexin channels in optic nerve head astrocytes: a mechanism for purinergic involvement in chronic strain. Glia. 2014;62(9):1486–1501. doi:10.1002/glia.22699
80. Choi HJ, Sun D, Jakobs TC. Astrocytes in the optic nerve head express putative mechanosensitive channels. Mol Vision. 2015;21:749–766.
81. Nagelhus EA, Veruki ML, Torp R, et al. Aquaporin-4 water channel protein in the rat retina and optic nerve: polarized expression in müller cells and fibrous astrocytes. J Neurosci. 1998;18(7):2506–2519. doi:10.1523/JNEUROSCI.18-07-02506.1998
82. Goodyear MJ, Crewther SG, Junghans BM. A role for aquaporin-4 in fluid regulation in the inner retina. Visual Neurosci. 2009;26(2):159–165. doi:10.1017/S0952523809090038
83. Pardon LP, Macias BR, Ferguson CR, et al. Changes in optic nerve head and retinal morphology during spaceflight and acute fluid shift reversal. JAMA Ophthalmol. 2022;140(8):763–770. doi:10.1001/jamaophthalmol.2022.1946
84. Pardon LP, Cheng H, Chettry P, Patel NB. Optic nerve head morphological changes over 12 hours in seated and head-down tilt postures. Invest Ophthalmol Vis Sci. 2020;61(13):21. doi:10.1167/iovs.61.13.21
85. Mader TH, Gibson CR, Barratt MR, et al. Persistent globe flattening in astronauts following long-duration spaceflight. Neuro-Ophthalmology. 2021;45(1):29–35. doi:10.1080/01658107.2021.1902987
86. Pardon LP, Harwerth RS, Patel NB. Neuroretinal rim response to transient changes in intraocular pressure in healthy non-human primate eyes. Exp Eye Res. 2020;193:107978. doi:10.1016/j.exer.2023.109414
87. Huang KC, Tawfik M, Samuel MA. Retinal ganglion cell circuits and glial interactions in humans and mice. Trends Neurosci. 2024;47(12):994–1013. doi:10.1016/j.tins.2024.09.010
88. Grannonico M, Miller DA, Liu M, et al. Comparative in vivo imaging of retinal structures in tree shrews, humans, and mice. eNeuro. 2024;11(3). doi:10.1523/ENEURO.0373-23.2024
 © 2025 The Author(s). This work is published and licensed by Dove Medical Press Limited. The
full terms of this license are available at https://www.dovepress.com/terms
and incorporate the Creative Commons Attribution
- Non Commercial (unported, 4.0) License.
By accessing the work you hereby accept the Terms. Non-commercial uses of the work are permitted
without any further permission from Dove Medical Press Limited, provided the work is properly
attributed. For permission for commercial use of this work, please see paragraphs 4.2 and 5 of our Terms.
© 2025 The Author(s). This work is published and licensed by Dove Medical Press Limited. The
full terms of this license are available at https://www.dovepress.com/terms
and incorporate the Creative Commons Attribution
- Non Commercial (unported, 4.0) License.
By accessing the work you hereby accept the Terms. Non-commercial uses of the work are permitted
without any further permission from Dove Medical Press Limited, provided the work is properly
attributed. For permission for commercial use of this work, please see paragraphs 4.2 and 5 of our Terms.