")
Back to Journals » International Journal of Nanomedicine » Volume 12
Intracellular disposition of chitosan nanoparticles in macrophages: intracellular uptake, exocytosis, and intercellular transport
Authors Jiang LQ , Wang TY, Webster TJ , Duan HJ, Qiu JY, Zhao ZM, Yin XX , Zheng CL
Received 18 May 2017
Accepted for publication 25 July 2017
Published 31 August 2017 Volume 2017:12 Pages 6383—6398
DOI https://doi.org/10.2147/IJN.S142060
Checked for plagiarism Yes
Review by Single anonymous peer review
Peer reviewer comments 4
Editor who approved publication: Professor Lei Yang
Li Qun Jiang,1 Ting Yu Wang,1 Thomas J Webster,2 Hua-Jian Duan,1 Jing Ying Qiu,1 Zi Ming Zhao,1 Xiao Xing Yin,1,* Chun Li Zheng3,*
1Jiangsu Key Laboratory of New Drug Research and Clinical Pharmacy, School of Pharmacy, Xuzhou Medical University, Xuzhou, People’s Republic of China; 2Department of Chemical Engineering, Northeastern University, Boston, MA, USA; 3School of Pharmacy, China Pharmaceutical University, Nanjing, People’s Republic of China
*These authors contributed equally to this work
Abstract: Biodegradable nanomaterials have been widely used in numerous medical fields. To further improve such efforts, this study focused on the intracellular disposition of chitosan nanoparticles (CsNPs) in macrophages, a primary cell of the mononuclear phagocyte system (MPS). Such interactions with the MPS determine the nanoparticle retention time in the body and consequently play a significant role in their own clinical safety. In this study, various dye-labeled CsNPs (about 250 nm) were prepared, and a murine macrophage cell line (RAW 264.7) was selected as a model macrophage. The results showed two mechanisms of macrophage incorporation of CsNPs, ie, a clathrin-mediated endocytosis pathway (the primary) and phagocytosis. Following internalization, the particles partly dissociated in the cells, indicating cellular digestion of the nanoparticles. It was proved that, after intracellular uptake, a large proportion of CsNPs were exocytosed within 24 h; this excretion induced a decrease in fluorescence intensity in cells by 69%, with the remaining particles possessing difficulty being cleared. Exocytosis could be inhibited by both wortmannin and vacuolin-1, indicating that CsNP uptake was mediated by lysosomal and multivesicular body pathways, and after exocytosis, the reuptake of CsNPs by neighboring cells was verified by further experiments. This study, thus, elucidated the fate of CsNPs in macrophages as well as identified cellular disposition mechanisms, providing the basis for how CsNPs are recognized by the MPS; such information is crucial to numerous medical applications of CsNPs.
Keywords: exocytosis, uptake, intercellular transport, chitosan nanoparticles, macrophages
Introduction
Nanomaterials (NMs, such as nanoparticles [NPs], liposomes, and micelles), particularly the biodegradable ones, have been widely used in numerous medical fields because of their special structural and physicochemical properties, which vary from their conventional bulk counterparts.1 When exposed to the blood stream, NMs, in significant quantities, are captured by macrophages of the mononuclear phagocyte system (MPS).2 The intracellular disposition of NMs in these macrophages via, eg, intracellular uptake, exocytosis, and intercellular transport determines the retention time of NMs in the MPS and, thus, their clearance from the body.3,4 Therefore, studies in this aspect are crucial for the clinical safety of NMs and for developing NMs that can be retained in the body for appropriate times to treat various ailments.
The endocytosis of NMs by macrophages has been well documented in the literature,5–9 and it has been reported that NMs with high surface charge and large particle size are phagocytized more efficiently by macrophages.6,7 The shape of NMs has a profound impact on their endocytosis by macrophages as spherical particles have been reported to be taken up more slowly than nanorods.5,9 Besides the physicochemical properties of NMs, the macrophage phenotype also has a great impact on NM endocytosis. For example, it has been reported by Hoppstadter et al8 that the uptake of silica NPs was enhanced by alternatively activated (M2)-polarized primary human monocyte-derived macrophages compared with classically activated (M1) cells. Compared with the endocytosis of NMs, exocytosis and intercellular transport of these NMs have been rarely studied.10 In previous studies, the dependence of calcium, cholesterol, and energy for the exocytosis of some NPs, eg, gold, polysaccharide, and poly(D,L-lactide-co-glycolide), has been reported;11–13 in addition, a study on lanthanide-doped upconverting NPs showed the significance of the microtubule system in NP exocytosis.10,14 Following exocytosis, intercellular transport of mesoporous silica NPs was evident in mammalian cells.15 Compared with the aforementioned inorganic NMs, organic NMs, particularly those that are biodegradable, are more widely used in the medical field. Thus, studies on how such NMs are treated by the MPS are urgently needed. To identify the intracellular disposition of biodegradable NMs, the following needs to be determined: 1) whether NMs can be degraded by macrophages; 2) whether NMs in cells, in intact or in degraded form, can be excreted; and 3) whether after being excreted, can NMs be taken up by neighboring cells.
Among all available materials, chitosan (Cs) has drawn increasing interest for its use in the body because of its biodegradability and low toxicity. The use of CsNMs for drug delivery has been widely studied.16,17 As reported, Cs can be degraded by enzyme catalysis in vivo.18 Nevertheless, for NMs formulated from Cs, clearance by cells and the body remains unclear. Therefore, whether NMs formulated from Cs could be degraded or cleared by cells, specifically by macrophages of the MPS, needs to still be determined.
In the current study, various fluorescent dye-labeled chitosan nanoparticles (CsNPs) were prepared based on the ionic gelation of Cs and pentasodium tripolyphosphate (TPP). The murine macrophage cell line (RAW 264.7) was selected as the MPS macrophage model. Intracellular uptake, degradation, and exocytosis of CsNPs in RAW 264.7 cells were detected, and experiments on its uptake and exocytosis mechanism were conducted. The intercellular transport of CsNPs after exocytosis was also determined in this study.
Materials and methods
Materials
Cs (degree of deacetylation, 90%; viscosity, 10 mPa·s; average MW, ~50 kDa; utilizing shrimp and crab shells as raw materials) was purchased from Zhejiang Golden Shell Pharmaceutical Co., Ltd. (Zhejiang, People’s Republic of China). Sodium TPP (chemical reagent, 56%–60%) and acetic acid (analysis reagent, 99.5%) were supplied by Sinopharm Chemical Reagent Co. Ltd. (Shanghai, People’s Republic of China). Fluorescein isothiocyanate (FITC), rhodamine B isothiocyanate (RBITC), O-phospho-L-serine, primaquine (PRQ), golgicide A (GOL-A), sucrose, and paraformaldehyde were provided by Sigma-Aldrich Co. (St Louis, MO, USA). Vacuolin-1 (VAL-1) and wortmannin (WOT) were supplied by Santa Cruz Biotechnology Inc. (Dallas, TX, USA). Lyso Tracker Red DND-99 was purchased from Thermo Fisher Scientific (Waltham, MA, USA). The 3-(4,5-dimethylthiazol-2-yl)-2,5-diphenyltetrazolium bromide (MTT) kit was purchased from Nanjing Jiancheng Bioengineering Institute supplied by Beyotime Biotechnology (Shanghai, People’s Republic of China). High-glucose Dulbecco’s Modified Eagle’s Medium (DMEM) was purchased from Jiangsu KeyGen Biotech Corp., Ltd (Jiangsu, People’s Republic of China). Fetal bovine serum (FBS) was purchased from Thermo Fisher Scientific.
Preparation and characterization of NPs
Dye-labeled Cs based on a thiourea linkage between the dye and Cs, ie, FITC-labeled Cs (FITC-Cs), and RBITC-labeled Cs (RBITC-Cs) were synthesized by dissolving 500 mg of Cs in 10 mL of acetic acid (1%, w/v) and mixing it with FITC (5 mg) or RBITC (5 mg). After reacting them for 12 h and using dialysis against deionized water for 72 h, FITC-Cs or RBITC-Cs coagulated in water could be obtained by centrifugation and subsequent lyophilization.
NPs formulated from Cs (CsNPs) or dye-labeled Cs (FITC-CsNPs and RBITC-CsNPs) were prepared by ionotropic gelation as described in a study by Calvo et al19 with modifications. Cs was dissolved in 1% w/v acetic acid at concentrations of 3 mg/mL. The solution was stirred overnight at 25°C and filtered through a syringe filter (0.45 μm). A TPP working solution was also prepared in 1% w/v acetic acid. The NPs were formed spontaneously by the dropwise addition of a 2 mL TPP solution into a 5 mL Cs solution using a mass ratio of Cs to TPP (6:1). Gelation was performed under constant magnetic stirring at 25°C for 30 min. NPs were isolated by ultracentrifugation (12,000 rpm, 60 min) and then resuspended in deionized water by ultrasonication. The NPs obtained were cross-linked by glutaraldehyde (glutaraldehyde:Cs =1:10, mg/mg), and the NPs were isolated by ultracentrifugation (12,000 rpm, 60 min) after cross-linking. In the current study, fluorescence resonance energy transfer (FRET)20 was applied for intracellular degradation detection, and the FRET-possessing CsNPs (FRET-CsNPs) were formulated from FITC-Cs and RBITC-Cs (1:9, mg/mg) using the aforementioned method.
The particle size distribution and surface charge of NPs were determined by dynamic light scattering using the PSS NICOMP 380 ZLS Zeta potential/particle sizer (Preferred Systems Solutions, Inc., Santa Barbara, CA, USA) at room temperature. The morphology of NPs was examined by transmission electron microscopy (Tecnai G2 Spirit Twin; FEI Company, Hillsboro, OR, USA).
Physical stability of FITC-CsNPs
To detect the physical stability of FITC-CsNPs, NPs were dispersed in PBS (pH 7.4) at a concentration of 10 mg/mL, and the particle suspensions were kept at 25°C. After various time intervals (1, 2, 3, 6, 12, and 24 days), the diameters of the NPs were determined, and the average count rates, which were shown by the particle sizer, were also recorded to represent the amount of NPs detected in the suspensions.
Cell culture
The murine macrophage cell line (RAW 264.7) was purchased from the Institute of Biochemistry and Cell Biology, Chinese Academy of Sciences (Shanghai, People’s Republic of China). The cells were cultured in high-glucose DMEM supplemented with 10% FBS at 37°C in a 5% CO2 atmosphere.
Fluorescence stability of FITC-CsNPs
Fluorescence stability of FITC-CsNPs in acidic cell lysates
After internalization, NPs might be located in various acidic compartments, including endosomes and other organelles, such as lysosomes, intraluminal vesicles, multivesicular bodies (MVBs), and exosomes, and the fluorescence stability of FITC-CsNPs was evaluated in acidic cell lysates, which was obtained by splitting RAW 264.7 cells via three freeze–thaw cycles (−80 and 37°C) and contained various subcellular compartments. FITC-CsNPs were suspended in cell lysates at a concentration of 1 mg/mL, and the pH was adjusted to 5.0 by acetic acid. After several time intervals (0.5, 1, 2, 4, 8, 12, 24, and 36 h), 50 μL of the sample was withdrawn and added into 1 mL of PBS (pH 8.0). The fluorescence intensity (FI) of the sample was detected by fluorescence spectrophotometry (F-4600; Hitachi Ltd., Tokyo, Japan) with excitation and emission wavelengths of 450 and 508 nm, respectively.
FI of the degraded FITC-CsNPs
To examine the fluorescence change induced by FITC-CsNP degradation, pepsin was used to degrade CsNPs due to its profound chitosanlytic activity.21 Briefly, 1 mg of pepsin was added into a 10 mL FITC-CsNP suspension (1 mg/mL, pH 5.0), and after various time intervals (0.25, 0.5, 1, 2, and 4 h), 50 μL of the sample was withdrawn and added into 1 mL of PBS (pH 8.0). The FI of the sample was detected by fluorescence spectrophotometry.
Release of FITC from FITC-CsNPs in vitro
The release of FITC from FITC-CsNPs was conducted in a cell lysate buffer (pH 5.0) by the dialysis method. Up to 1 mL of the FITC-CsNP suspension (20 mg/mL) was introduced into a dialysis bag (MW: 8,000 Da), and both ends of the bag were hermetically sealed by dialysis clamps. The dialysis bag was submerged into 50 mL of a PBS buffer (pH 5.0) at 37°C while stirring for 12 h. At appropriate time intervals (0.5, 1, 2, 4, 6, 8, and 12 h), 0.5 mL of the aliquots was withdrawn and replaced with an equal volume of fresh medium. After the sample was diluted with the same volume of PBS (pH 8.0), the FI of sample was determined and the accumulated FITC release was calculated.
Cytotoxicity of FITC-CsNPs
To ensure that the macrophages incubated with dye-labeled CsNPs were in a normal state, an MTT assay was employed. RAW 264.7 cells were seeded in a 96-well plate (Excell; Excell Biology, Shanghai, People’s Republic of China) at a density of 2×10⁴/mL in 100 μL of the cell culture medium and were incubated overnight at 37°C in a 5% CO2 atmosphere. Before the measurement, old medium was replaced with 100 μL of FITC-CsNPs (5, 25, 50, 100, 250, and 500 μg/mL) in medium without serum, and the cells were incubated for 36 h. Each well was then added with 50 μL of 1× MTT, and the cells were further incubated for 4 h. The supernatant of each well was completely replaced with 150 μL of dimethyl sulfoxide (DMSO). Finally, the absorbance was measured at 570 nm and expressed as relative values compared with the untreated negative control.
Intracellular uptake of FITC-CsNPs
Dose-dependent uptake
To determine the dose-dependent uptake of CsNPs, FITC-CsNPs diluted with serum-free medium at different concentrations (25, 50, 100, 250, 500, and 750 μg/mL) were incubated with RAW 264.7 cells in 96-well white plates (NY14831; Corning Incorporated, Corning, NY, USA) at 37°C. After incubation for 4 h, the NP-containing medium was removed to abort uptake, and the cells were washed with cold PBS buffer (pH 8.0). Intracellular FI was detected using a multimode microplate reader (Synergy2; BioTek, Winooski, VT, USA) at 480 nm, and qualitative observation was performed by a laser confocal microscope (FV10i; Olympus Corporation, Tokyo, Japan).
Uptake kinetic detection
After cells became confluent in a 96-well plate, FITC-CsNPs (250 μg/mL) were incubated with the cells. After various incubation times (1, 2, 4, 6, 8, and 10 h), the cells were washed with cold PBS three times, and intracellular FI was detected qualitatively and quantitatively as mentioned earlier.
Uptake pathway detection
To detect the mechanisms of intracellular uptake of CsNPs, RAW 264.7 cells seeded in 96-well plates were treated with various chemical inhibitors for 0.5 h at 37°C. Then, FITC-CsNPs (250 μg/mL) were added, and after various incubation periods, the effects of inhibitors on NP uptake were determined by both inverted fluorescence microscopy observation and quantitative measurements using a multimode microplate reader. The chemical inhibitors applied in this test included O-phospho-L-serine (1 mM)22,23 and sucrose (450 mM),24 which were reported to inhibit phagocytosis and clathrin-mediated endocytosis, respectively.
Exocytosis of FITC-CsNPs
Detection of exocytosis kinetics
To detect the exocytosis kinetics of FITC-CsNPs by macrophages, RAW 264.7 cells were pre-incubated with NPs (250 μg/mL) for 2 h. The NP-containing medium was then replaced with fresh DMEM, and this time point was set as the starting time (0 h) for exocytosis detection. Over different time intervals (2, 4, 6, 8, 12, 24, and 36 h), the medium was removed and collected, and the cells were washed with cold PBS buffer (pH 8.0). The FIs of NPs retained in the cells were detected using a multimode microplate reader and a laser confocal microscope. The FIs of the medium collected were also measured using a multimode microplate reader.
Detection of exocytosis pathway
Acidic organelle labeling: To track the exocytosis pathway, after pre-incubation of cells with FITC-CsNPs for 2 h, the NP-containing medium was replaced with fresh medium. At different time points (2, 4, 6, 8, 12, 24, and 36 h), the cells were fixed with paraformaldehyde and labeled with a Lyso Tracker Red DND-99, which was usually used to specifically label acidic compartment cells, eg, lysosomes and other acidic organelles. The location of NPs in the cells was observed using a laser confocal microscopy.
Effects of chemical inhibitors: To detect the exocytosis mechanism of CsNPs in RAW 264.7 cells, a further study on chemical inhibition was conducted. After pre-incubation of cells with FITC-CsNPs (250 μg/mL) for 2 h, the NP-containing medium was replaced with an inhibitor-containing medium, and this time point was set as the starting time (0 h). Qualitative observation was performed using laser confocal microscopy. Quantitative measurements were performed using a multimode microplate reader, and the exocytosis percentages, which were defined as the ratio of FI of NPs retained in the cells to that taken by cells during the pre-incubation of 2 h, were calculated to reflect the effects of chemical inhibitors. The inhibitors used in this section included PRQ (300 μM),25 GOL-A (50 μM),26 VAL-1 (1 μM),27 and WOT (33 μM),28 which could inhibit recycling of endosome-mediated, golgi-mediated, lysosome-mediated, and MVB-mediated exocytosis, respectively.
Intracellular degradation of FITC-CsNPs
The intracellular degradation of CsNPs was detected using the resonance energy transfer (FRET) method established in our previous study.29 FRET-CsNPs were formulated from FITC-Cs and RBITC-Cs (1:9, mg/mg), which were used as the fluorescence donor and acceptor, respectively. After pre-incubation of RAW 264.7 cells with FRET-CsNPs (250 μg/mL) for 2 h, the NP-containing medium was replaced with fresh medium, and this time point was set as the starting time (0 h). At various time points (2, 4, 6, 8, 12, 24, and 36 h), the medium was removed. The FIs in the cells were detected by fluorescence spectrophotometry. The FRET indices were calculated by Equation 1,30 reflecting the efficiency of FITC–RBITC energy transfer and further the degradation of the NPs:
|
|
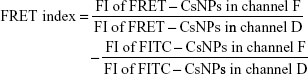
where channel D and channel F represent the different excitation and emission wavelengths in the FI detection, which are listed in Table 1.
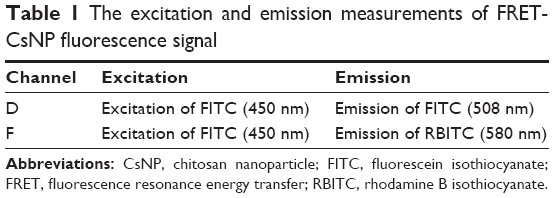 | Table 1 The excitation and emission measurements of FRET-CsNP fluorescence signal |
Intercellular transport of CsNPs
The intercellular transfer of CsNPs was detected using the method reported by Slowing et al.15 In brief, two groups of RAW 264.7 cells seeded in flasks were incubated with FITC-CsNPs and RBITC-CsNPs for 4 h, respectively. The NP-containing medium was then removed, and the cells in each flask were transferred into a culture dish. The cells were further incubated with fresh medium for 2, 6, 12, and 24 h. If NPs excreted from one cell were taken up by the surrounding cells, both FITC and RBITC fluorescence signals could be observed in that certain cell. The fluorescence signals were detected by laser confocal microscopy and flow cytometry.
Statistical analysis
The results were statistically analyzed using Student’s t-tests. Differences in the results were considered statistically significant when P<0.05 and highly significant when P<0.01.
Results and discussion
NP characterization
The CsNPs, FITC-CsNPs, RBITC-CsNPs, and FRET-CsNPs were prepared by an ionotropic gelation method. The intensity-averaged particle size and zeta potentials of these NPs are listed in Table 2. The diameters of all NPs ranged from 241 to 267 nm, and no significant difference in diameters was found. The zeta potential of the dye-labeled NPs was slightly lower than those of the dye-free NPs because of the consumption of amino groups by dye labeling; nevertheless, the zeta potentials of all these NPs ranged from 19 to 23 mV, and the assumption was that the slight decrease in zeta potential could not induce a significant difference in cellular disposition of NPs. The morphologies and structures of these NPs (Figure 1) showed that all these NPs exhibited similar ellipsoidal and spherical structures. These results led to the hypothesis that the dye-labeled NPs (ie, FITC-CsNPs, RBITC-CsNPs, and FRET-CsNPs) possessed similar physicochemical properties and, consequently, similar cellular disposition behavior with CsNPs.
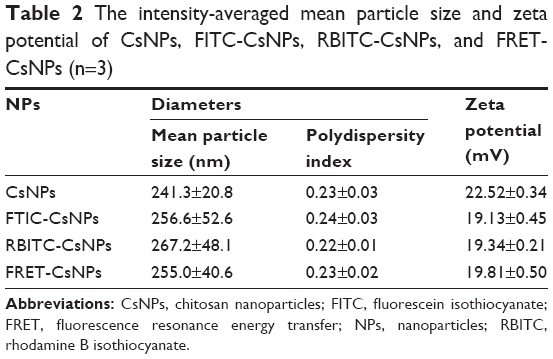 | Table 2 The intensity-averaged mean particle size and zeta potential of CsNPs, FITC-CsNPs, RBITC-CsNPs, and FRET-CsNPs (n=3) |
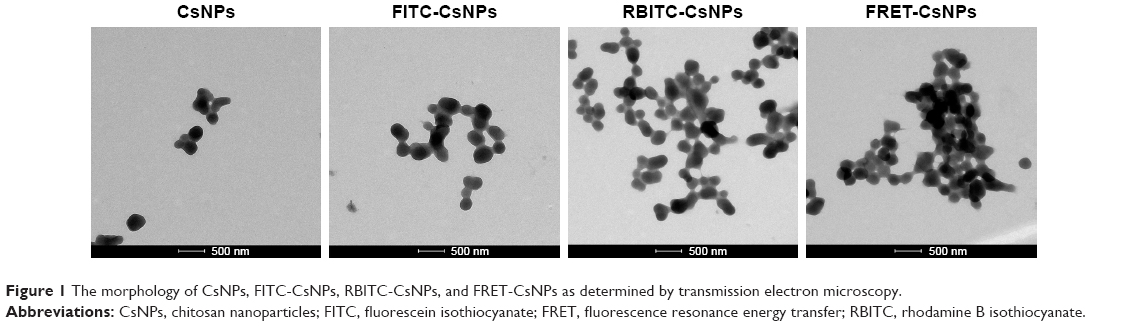 | Figure 1 The morphology of CsNPs, FITC-CsNPs, RBITC-CsNPs, and FRET-CsNPs as determined by transmission electron microscopy. |
Physical stability of FITC-CsNPs
The physical stability of the FITC-CsNPs was determined in PBS (pH 7.4) for 24 days. The results (Figure S1) showed that no significant change in FITC-CsNP diameter was observed within 6 days, and the average count rates for the NP suspensions showed no disassociation of particles within 6 days. At 12 days, however, the FITC-CsNP diameters increased from 242 nm (0 day) to 389 nm; moreover, precipitates appeared in the NP suspension at 24 days. Although these results showed that the FITC-CsNPs were stable in PBS (7.4) for only 6 days, the NPs were always prepared fresh for the cell tests.
Fluorescence stability of FITC-CsNPs
Fluorescence stability in acidic cell lysates
In this study, the amount of NPs in cells was determined by the amount of intracellular FIs of FITC; thus, the fluorescence stability of FITC-CsNPs in cells is a highly significant property. Considering that, after internalization, the NPs might be located in acidic subcellular compartments, the fluorescence stability of FITC-CsNPs was determined in this study in acidic cell lysate buffer solutions (pH 5.0), and the FIs were detected after the pH of the sample was adjusted with PBS (pH 8.0). As shown in Figure 2A, a slight but significant increase in FI of FITC-CsNPs was obtained within 36 h. This increase could be attributed to NPs partially degrading in the cell lysates and the unbound FITC experiencing less quenching than the FITC-CsNPs; thus, the decrease in FI in cells should not be induced by the fluorescence quenching in acidic cellular microenvironments for the following exocytosis experiments.
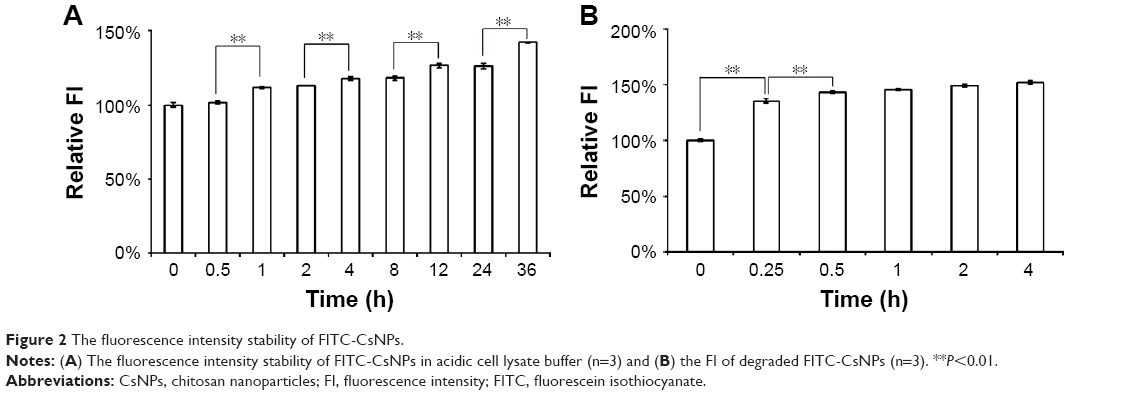 | Figure 2 The fluorescence intensity stability of FITC-CsNPs. |
Change in fluorescence of degraded FITC-CsNPs
After intracellular uptake, NPs could undergo lysosomal degradation in the cells. Thus, whether FITC-CsNPs were quenched after degradation was an important factor to consider for the results of this study. In this section, FITC-CsNPs were degraded by pepsin in PBS buffer solutions (pH 5.0), and the change in fluorescence in this degradation was determined. As shown in Figure 2B, compared with the intact NPs (0 h), the relative FI of NPs treated with pepsin increased by about 35% at 0.25 h and plateaued at 0.5 h. The increase in fluorescence might be attributable to self-quenching31 of the dye-labeled material; the change was consistent with the increase in fluorescence observed in the acidic cell lysate, as shown in Figure 2A. The results revealed in this section indicated that the intracellular degradation of NPs failed to induce a decrease in FI observed in the following exocytosis studies.
Release of FITC from FITC-CsNPs in vitro
In this study, CsNPs were represented by FITC-CsNPs for the determination of intracellular disposition of NPs. For most of the CsNPs located in acidic organelles, which was shown in the following studies, the release of FITC from FITC-CsNPs in vitro was evaluated in acidic PBS buffer (pH 5.0) in this study. As shown in Figure 3, within 6 h, the concentration of FITC in both the dialysis bag and the outside medium was identical, indicating that the unbound FITC could freely penetrate the bag; meanwhile, less than 0.6% of FITC was released from the FITC-CsNPs within 12 h because of the stable covalent bonds between FITC and Cs. These results proved that FITC could hardly be released from the FITC-CsNPs. Thus, the results observed by fluorescence were certainly the cellular disposition of NPs and not of the free dye.
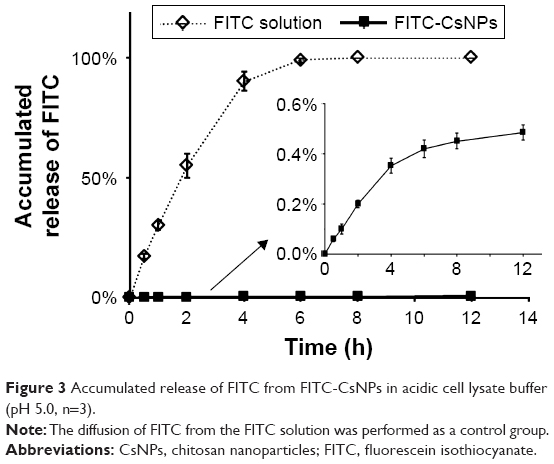 | Figure 3 Accumulated release of FITC from FITC-CsNPs in acidic cell lysate buffer (pH 5.0, n=3). |
Cytotoxicity of FITC-CsNPs
To evaluate the possible toxic effects of FITC-CsNPs on RAW 264.7 cells and to ensure that the cells incubated with NPs were in a normal state, cytotoxicity was assessed using the MTT method. The results (Figure S2) indicated that after incubation for 36 h, with an FITC-CsNP concentration increasing from 5 μg/mL to 500 μg/mL, 100% cell viability was maintained, suggesting that FITC-CsNPs exhibited no significant toxicity to RAW 264.7 cells within the 0–500 μg/mL concentration range.
Intracellular uptake detection
Dose and time dependence
The dose dependence of cellular uptake of FITC-CsNPs is shown in Figure 4A–B. The results showed that the intracellular uptake was almost saturated when the concentration of NPs reached 500 μg/mL. In addition, within the 25–250 μg/mL concentration range, a linear relationship between the NP concentration and intracellular FI was observed (R2=0.9868). This finding indicated that within this concentration range, the uptake of FITC-CsNPs conformed to a linear dynamic behavior and that within the linear dynamic range a concentration of 250 μg/mL was selected for the subsequent tests. The time dependence of endocytosis of FITC-CsNPs in RAW 264.7 cells is illustrated in Figure 4C–D. The intracellular FI increased within 6 h, at which time, the uptake of FITC-CsNPs plateaued, indicating the saturation of cellular uptake; according to this result, the time of pre-uptake was set at 2 h for subsequent exocytosis detection.
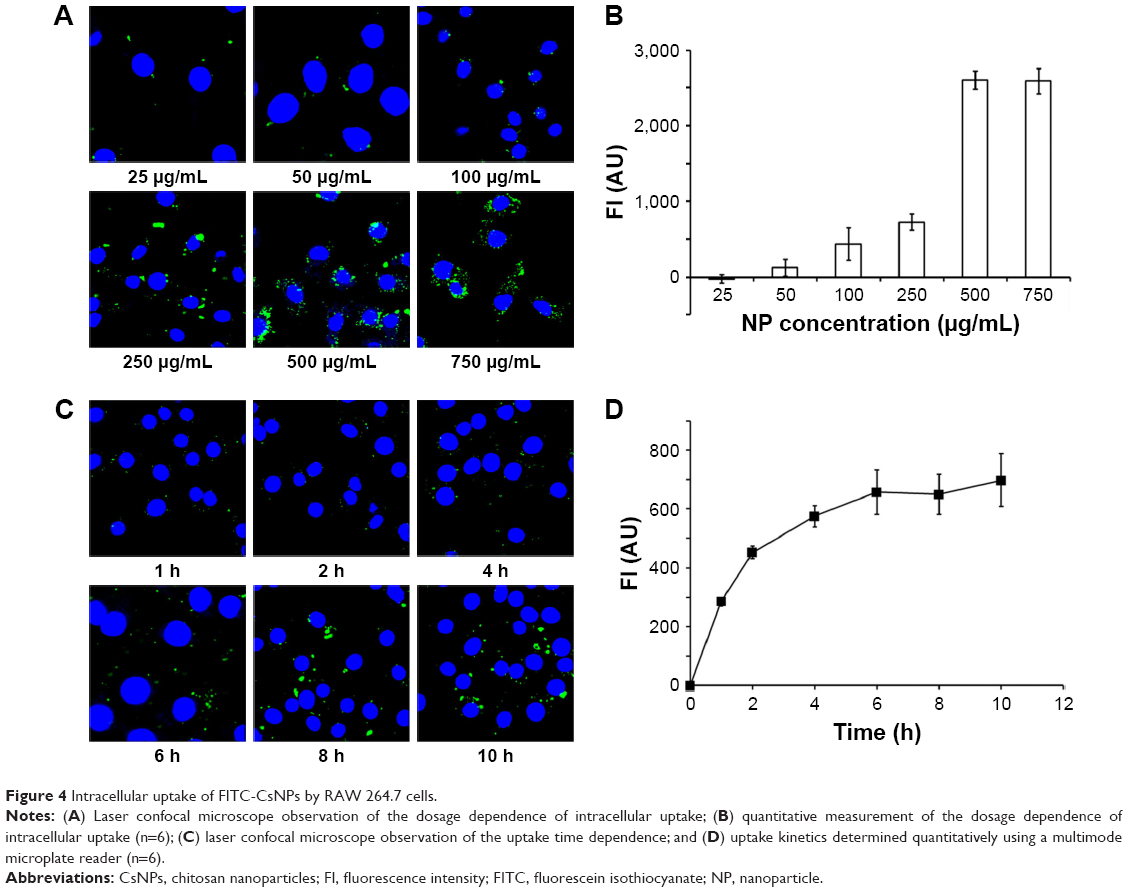 | Figure 4 Intracellular uptake of FITC-CsNPs by RAW 264.7 cells. |
Uptake pathway
For solid particles, apart from clathrin-mediated endocytosis32,33 and caveolae-mediated endocytosis,34,35 which are classical intracellular uptake pathways, phagocytosis36 was regarded as a prevalent mechanism, particularly for macrophages. Among these pathways, the caveolae-mediated pathway mainly contributes to particles with diameters <80 nm, as the caveolar endocytic vesicles are approximately 50–80 nm in diameter.37,38 Therefore, clathrin-mediated endocytosis and phagocytosis were considered as potential mechanisms for the uptake of FITC-CsNPs by RAW 264.7 cells in this study.
For the detection of uptake pathway, sucrose and O-phospho-L-serine were used as the chemical inhibitors. As shown in Figure 5, compared with other groups, sucrose exerted the greatest inhibition effects, reducing the cellular uptake by 72%, 56%, 72%, and 64% at 2, 4, 6, and 8 h, respectively. According to the literature,39,40 the hypertonic sucrose added to the medium could lead to the formation of clathrin microcages on the inner surface of the plasma membrane, which depleted the cytoplasmic pools of clathrin necessary for normal coated pit formation. Thus, we demonstrated that the uptake of FITC-CsNPs was mainly mediated by clathrin, although other potential pathways might also exist.
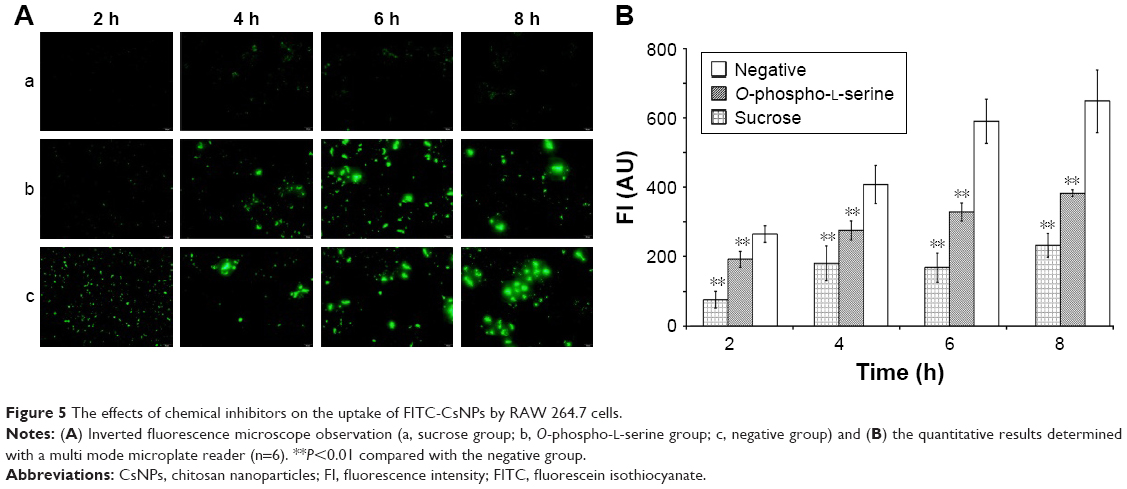 | Figure 5 The effects of chemical inhibitors on the uptake of FITC-CsNPs by RAW 264.7 cells. |
Phagocytosis was regarded as a contributor to the uptake of NPs larger than 500 nm; nevertheless, it was certainly the prevalent pathway for intracellular uptake by macrophages. In this test, when phagocytosis was prevented using O-phospho-L-serine (1 mM),22,23 a significant inhibition of uptake was observed within 8 h relative to that of the negative group; however, the inhibition effect of O-phospho-L-serine was weaker than that of sucrose. Thus, in addition to the clathrin-mediated endocytosis, the internalization of FITC-CsNPs was also regulated by the phagocytosis pathway.
Exocytosis of FITC-CsNPs
For the exocytosis test, after the cells were pre-incubated with FITC-CsNPs for 2 h, the NP-containing medium was replaced with fresh medium, and this time point was set as the start time for the exocytosis study (0 h). To track the intracellular movement of NPs after pre-incubation, laser confocal microscopy was performed (Figure 6). The results indicated that 2 h after pre-incubation, most NPs were located near the plasma membrane (marked with red arrows), and only a small number of NPs were distributed into the perinuclear regions (marked with white arrows). Four hours after pre-incubation, more NPs were diffused far from the plasma membrane. This increase indicated that the NPs were transferred from the cell periphery toward the perinuclear regions within the first 4 h. Within the 4–6 h period, NPs in the cell interior (white arrows) increased, suggesting the accumulation of NPs in the perinuclear region after internalization. After 6 h, the NPs in the perinuclear regions decreased, whereas those near the membrane (red arrows) increased until 12 h. This result showed that the NPs were recycled to the plasma membrane after their accumulation around the nucleus. Within 12–24 h after pre-incubation, the NPs in the plasma membrane decreased, and the NPs in the cells were mainly located in the cell interior, particularly at 24 h. At 36 h, NPs could be observed only in the cell interior. The qualitative observation showed that a proportion of NPs were endocytosed by RAW 264.7 cells and could first be removed from the cell membrane to the perinuclear regions, recycled to the membrane, and finally removed from the cells. Some NPs were retained in the cell interior until 36 h.
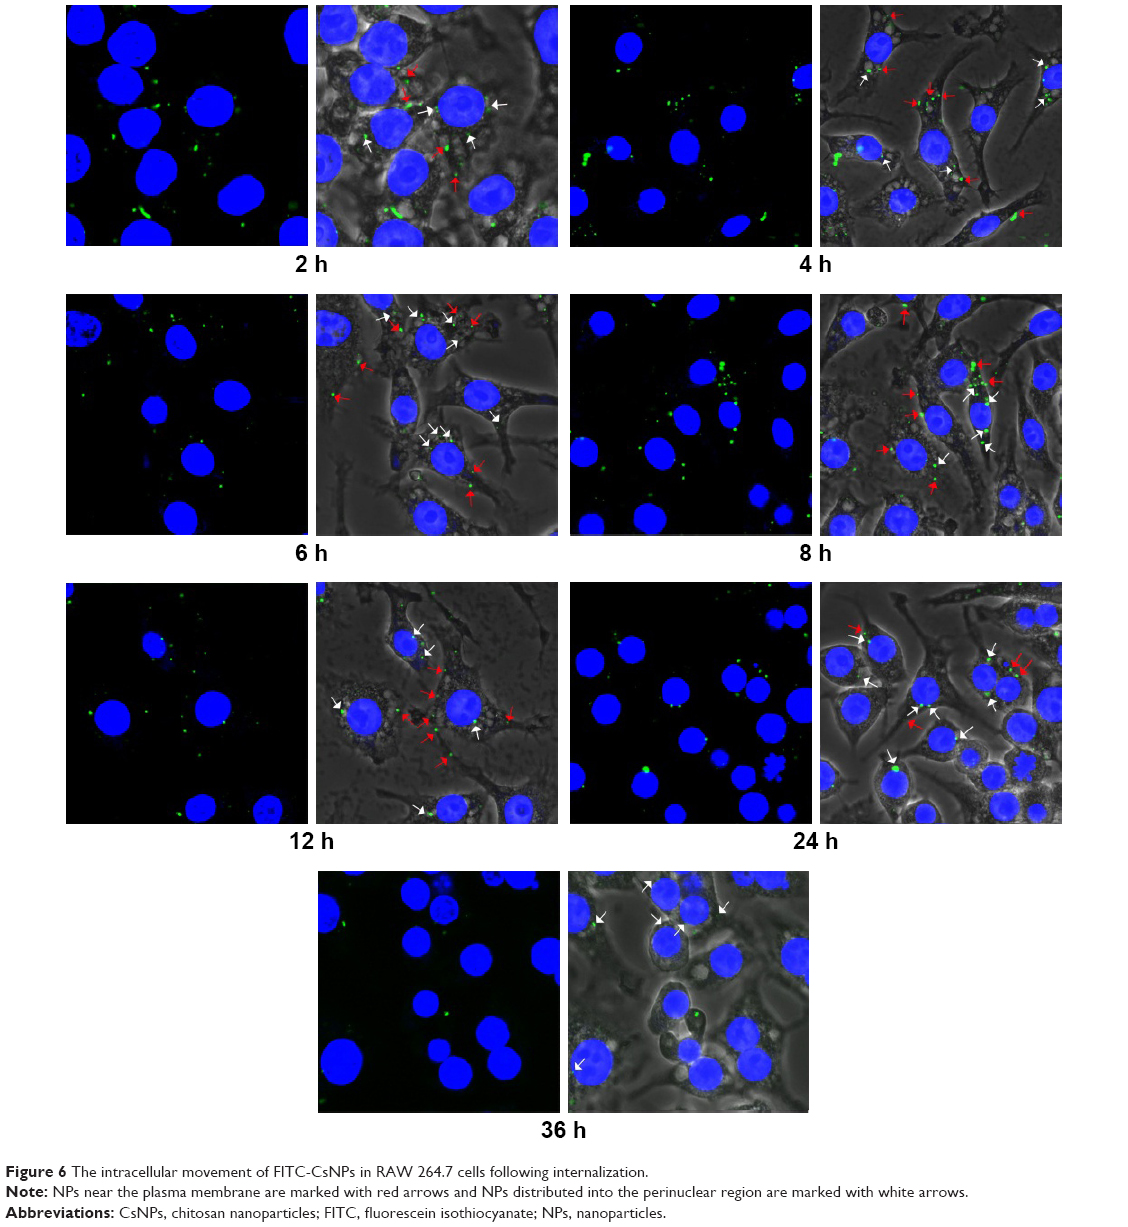 | Figure 6 The intracellular movement of FITC-CsNPs in RAW 264.7 cells following internalization. |
The FIs of FITC-CsNPs retained in the cells and released into the medium were further quantified. As shown in Figure 7A, within 0–2 h after pre-incubation, no significant change (P>0.05) in FI in cells could be found, perhaps because within this period the NPs taken up by the cells were mainly transferred into the cell interior, as shown in Figure 7. Within 4–24 h, the reduction in FI in the cells continued, and at 24 h, the FI decreased by 69%, comparing with that at 0 h. The FI in the cell culture medium within 4–24 h (Figure 7B) showed that the fluorescence outside the cells increased gradually and compensated for the loss of fluorescence in cells with total FI, which included FI inside and outside of the cells, maintaining a stable value. Combining this result with the stability of the FITC-CsNPs in the acidic cell lysate (Figure 2A) and the increase in FI induced by FITC-CsNP degradation, the intracellular FI reduction within 4–24 h should not be induced by fluorescence quenching in acidic cellular environments or NP degradation. The reduction might have been caused by the cellular exocytosis of NPs from the cell interior or unbinding of NPs, which bound with the membrane but did not enter the cells, directly from the membrane. When preventing some physiological functions working within the cells, an FI decrease could be inhibited significantly, as shown in the subsequent “Exocytosis mechanisms” section, and this result excluded the attribution of FI decrease to the separation of NPs from the membrane; thus, the decrease in intracellular FI within 4–24 h was mainly induced by the exocytosis of NPs from the cell interior.
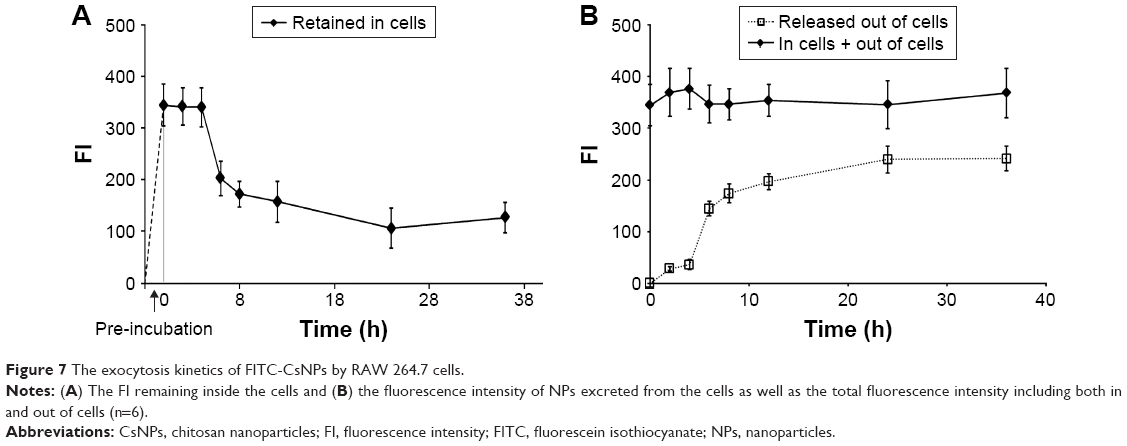 | Figure 7 The exocytosis kinetics of FITC-CsNPs by RAW 264.7 cells. |
The kinetic curve in Figure 7A depicts a fast exocytosis within 4–8 h and a relatively slow exocytosis within 8–24 h, indicating that RAW 264.7 cells might have at least two possible pathways for FITC-CsNP excretion: a rapid pathway and a much slower one. From 24 to 36 h, intracellular fluorescence showed no significant decrease (P>0.05), indicating that a certain number of NPs were retained in the cells, which was consistent with the qualitative results (Figure 6). These NPs might have more difficulty being cleared by the cells.
For the total FI and that in cells, a slight increase was observed at 36 h, which might have been induced by the degradation of NPs, as discussed in the subsequent “Intracellular degradation” section.
Exocytosis mechanisms
To track the exocytosis pathway of FITC-CsNPs in RAW 264.7 cells, the cells were labeled with Lyso Tracker Red DND-99, which was typically used to specifically label lysosomes; however, it could not distinguish between lysosomes and other acidic compartments according to its product manual. Laser confocal microscopy (Figure 8) showed that within exocytosis of 24 h, the green fluorescence was almost entirely located in the red fluorescence regions. This result indicated that FITC-CsNPs were mainly located in the acidic subcellular compartments, which included endosomes with a pH of 5.0–5.5,41 lysosomes with a pH of 4.5–5.0,42 and MVBs with a pH of 5.0–6.0.43 Even NPs trapped in the cells at 24 h remained in the acidic organelles. These results suggested that the acidic compartments could be the primary subcellular organelles responsible for the exocytosis of FITC-CsNPs.
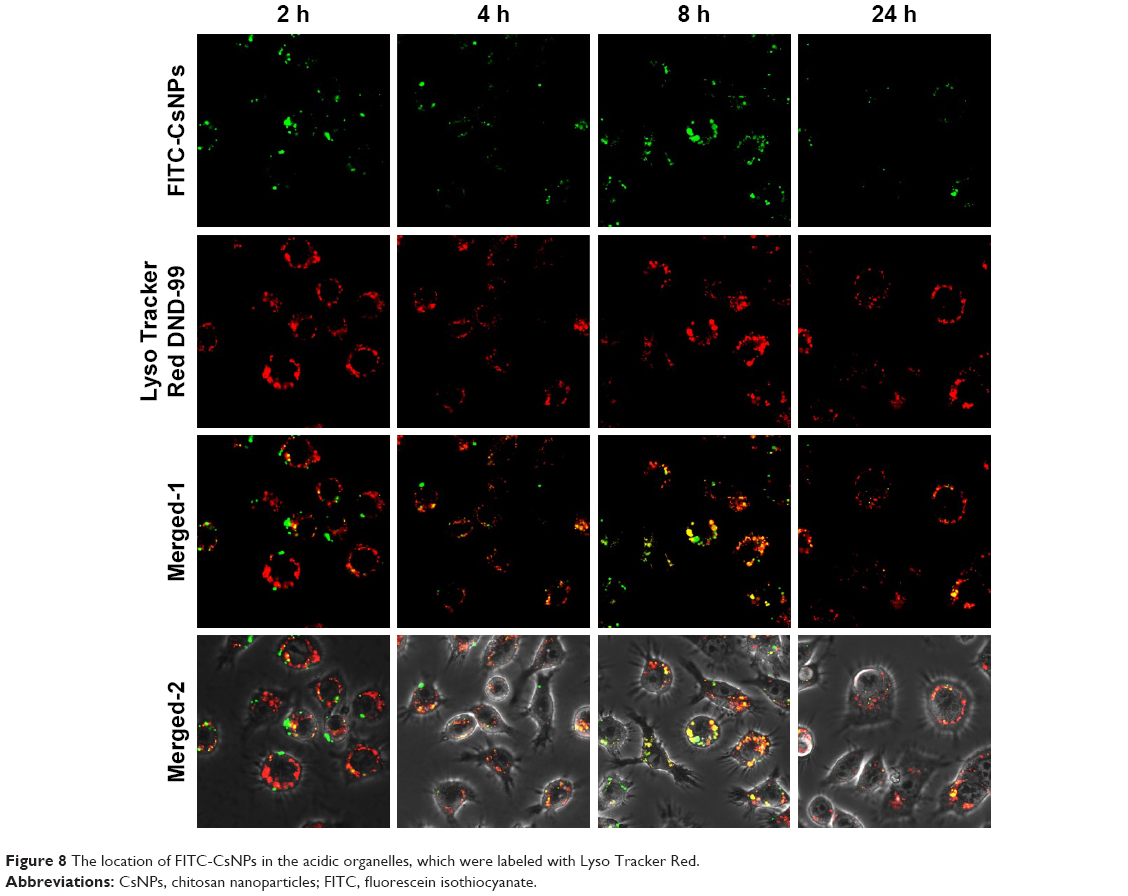 | Figure 8 The location of FITC-CsNPs in the acidic organelles, which were labeled with Lyso Tracker Red. |
To detect the roles of these acidic organelles, such as lysosomes, endosomes, recycling endosomes, and MVBs, the exocytosis percentages of FITC-CsNPs in the presence of various chemical inhibitors (Figure 9A) were further determined, and the results were normalized by the negative group. As shown in Figure 9B, in the presence of vacuolin (VAL), which could inhibit vacuolar ATPase activity and subsequently inhibit lysosomal pH alkalinization,27 exocytosis was significantly inhibited at 6 and 12 h, compared with the negative group, which was performed without any inhibitor. This effect indicated the contribution of the lysosomal pathway to FITC-CsNP exocytosis; however, no significant difference was observed between the VAL group and the negative control group at 24 h, suggesting the presence of a compensatory action of other pathways. When WOT was used to inhibit exocytosis, exocytosis was significantly and almost completely inhibited within 24 h. WOT was able to prevent not only the transport of endosomes to lysosomes but also MVB biogenesis (Figure 9A);44,45 thus, the complete inhibitory effect of WOT indicated the importance of the MVB pathway in NP excretion and that it could compensate for exocytosis when the lysosomal pathway was prevented. In the current study, golgicide (GOL) and PRQ were used as inhibitors of golgi25 and recycling endosomes,26 and no inhibition effects occurred, suggesting that the exocytosis could not be attributed to golgi and recycling endosomal pathways.
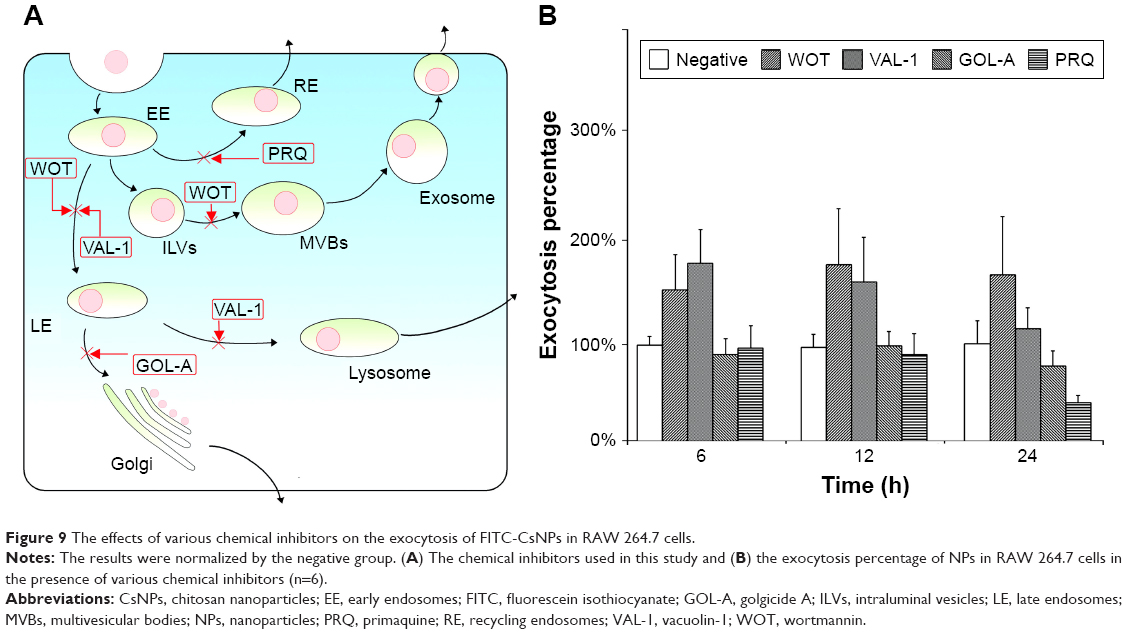 | Figure 9 The effects of various chemical inhibitors on the exocytosis of FITC-CsNPs in RAW 264.7 cells. |
Intracellular degradation
To detect whether the CsNPs in RAW 264.7 cells were degraded, the FRET technology established in our previous study29 was applied, and FRET-CsNPs were formulated from FITC-Cs and RBITC-Cs with a ratio of 1:9 (mg/mg) for the highest FRET index and could be obtained using this mass ratio (Figure S3). The fluorescence emission spectra of the NPs are shown in Figure 10A, and comparing with FITC-CsNPs, the degree of quenching of the donor (FITC) and the enhancement of the accepter (RBITC) of FRET-CsNPs in channels D and F indicated that the NPs prepared in this test exerted FRET effects. This effect ensured a significant change in fluorescence despite the occurrence of slight NP degradation, suggesting high sensitivity to the detection of NP degradation. To quantify NP degradation, the FRET index was calculated, which depended on the distance of the double dyes in the NPs. As shown in Figure 10B, the FRET index of the freshly prepared FRET-CsNPs was 396%±23%, and that of the FITC-CsNPs and RBITC-CsNPs was 0 and negative, respectively; at the start time of the exocytosis study, a significant decrease in FRET index (from 396% to 264%) suggested an increase in the average distance of the double dyes in the NPs and further indicated the immediate degradation of the NPs after internalization. Within 0–8 h, the FRET indices decreased from 264% to 122%, reflecting a gradual degradation of NPs by the cells when the NPs were distributed from the plasma membrane to the cell interior, as shown in Figure 6. Even at 36 h, the FRET effect of the NPs could be observed, and the FRET index was maintained at about 120%; this result indicated that the FRET-CsNPs did not dissociate completely within 36 h in RAW 264.7 cells.
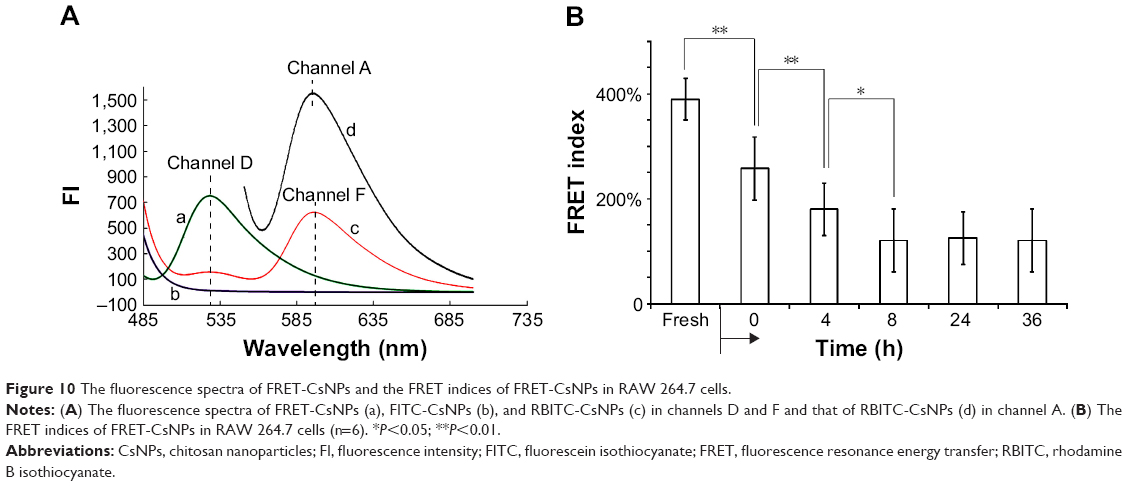 | Figure 10 The fluorescence spectra of FRET-CsNPs and the FRET indices of FRET-CsNPs in RAW 264.7 cells. |
Intercellular transport
The exocytosis tests showed that following internalization, FITC-CsNPs could be excreted by RAW 264.7 cells. On the basis of these results, the uptake of NPs exocytosed from one cell by the neighboring cells was considered. To evaluate this hypothesis, cross-cell experimentation was performed using the method reported by Slowing et al.15 In the first step, two cultures of RAW 264.7 cells were incubated with FITC-CsNPs and RBITC-CsNPs for 4 h; marked fluorescence could be observed in the two cell groups (Figure 11). The cells were then mixed and co-incubated for up to 24 h. Examination under a confocal microscope showed that at 2 h the fluorescence signal of FITC-CsNPs and RBITC-CsNPs was located in different cells because no NPs were excreted from the cells according to the exocytosis tests (Figures 7 and 8); within 6–24 h, an FITC-CsNP signal (marked with white arrows) could be observed in the cells pre-incubated with the RBITC-CsNPs. The RBITC-CsNPs signal (marked with red arrows) could also be observed in the cells pre-treated with FTIC–CsNPs, showing that the NPs exocytosed from one cell could be retaken by other cells.
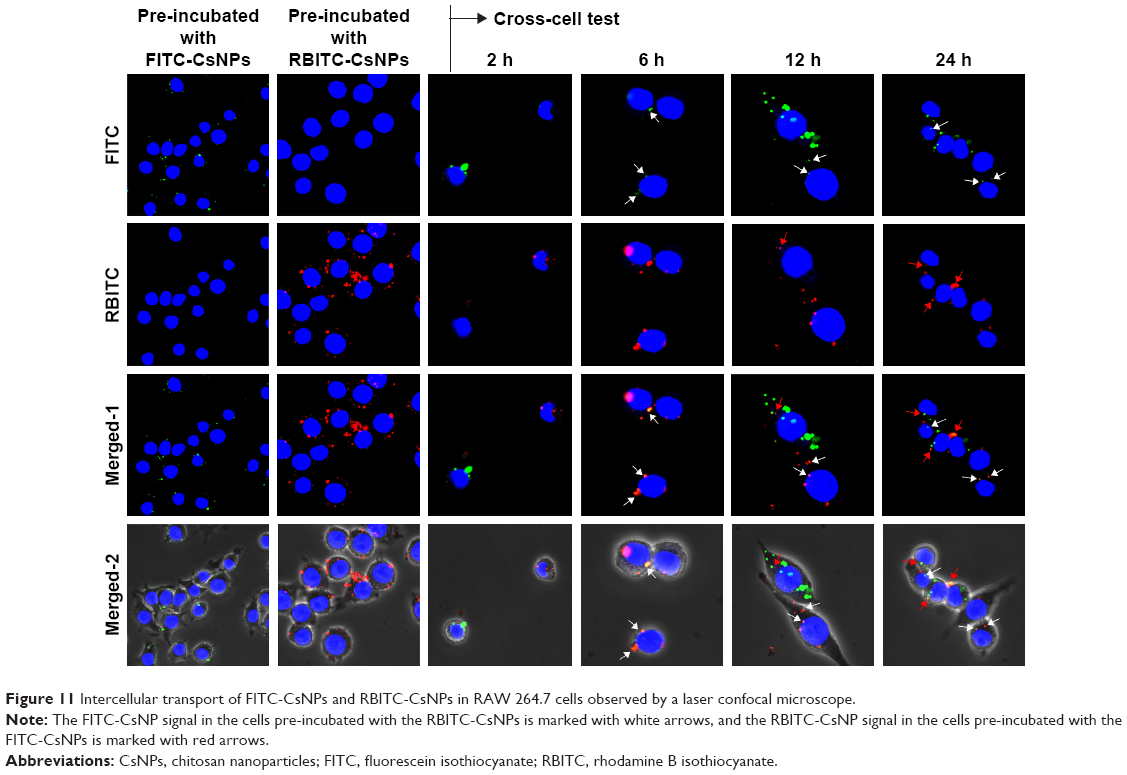 | Figure 11 Intercellular transport of FITC-CsNPs and RBITC-CsNPs in RAW 264.7 cells observed by a laser confocal microscope. |
Microscopic observation was further confirmed by quantitative detection with flow cytometry (Figure 12). The gates were set using negative groups, and the cells were incubated only with FITC-CsNPs and RBITC-CsNPs. At 2 h, the cells were divided into two groups: FITC positive and RBITC positive, and only 0.23% of the cells were FITC and RBITC positive. Within the co-incubation period of 2–24 h, the percentage of double-positive cells gradually increased from 2.27% to 15.5%, verifying the intercellular transport of NPs after exocytosis.
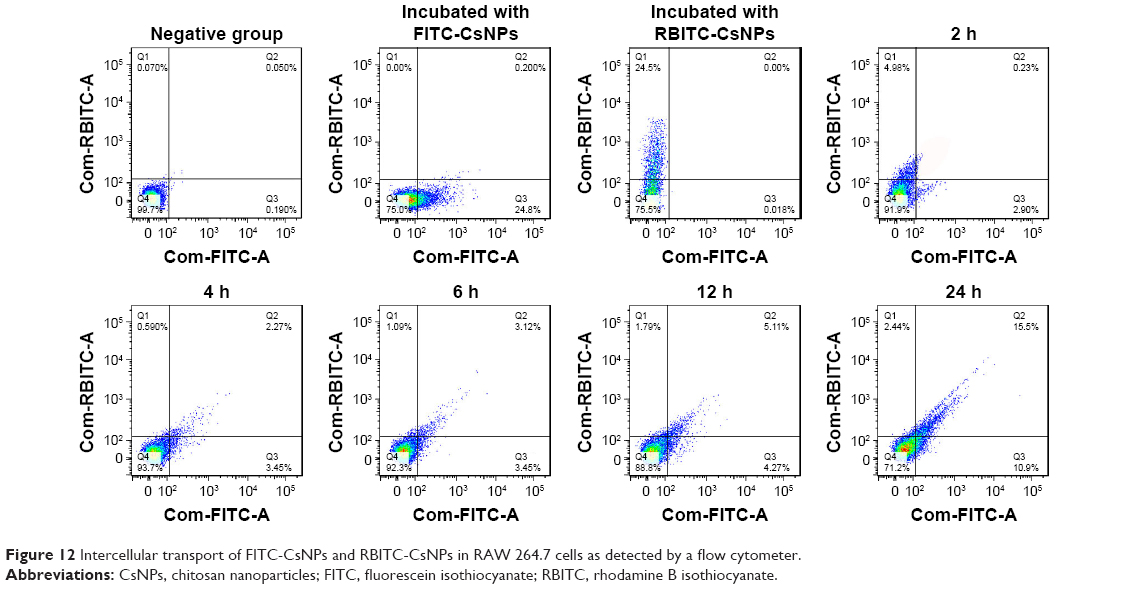 | Figure 12 Intercellular transport of FITC-CsNPs and RBITC-CsNPs in RAW 264.7 cells as detected by a flow cytometer. |
Conclusion
In this study, various dye-labeled CsNPs with diameters of about 250 nm were prepared, and the disposition of these NPs in RAW 264.7 murine macrophages was investigated. Fluorescence stability tests and increases in fluorescence induced by the degradation of NPs proved that the FITC-CsNPs could be used for this cellular disposition study. The intracellular disposition behaviors are illustrated in Figure 13, showing that the uptake of CsNPs by RAW 264.7 cells was mediated by clathrin-mediated endocytosis (the primary mechanism) and phagocytosis. Following internalization, the NPs could partly dissociate, and a large proportion of NPs could be excreted from cells within 24 h by the lysosomal and MVB pathways; this excretion induced a decrease in FI in cells by 69%, with the other particles having difficulty being cleared until 36 h. After being excreted by one cell, NPs could be retaken by the neighboring cells. These results provide the basis for elucidating the disposition of NPs by MPS, and the clearance of CsNPs from the body will be investigated in the future; such information is crucial to numerous medical applications of CsNPs.
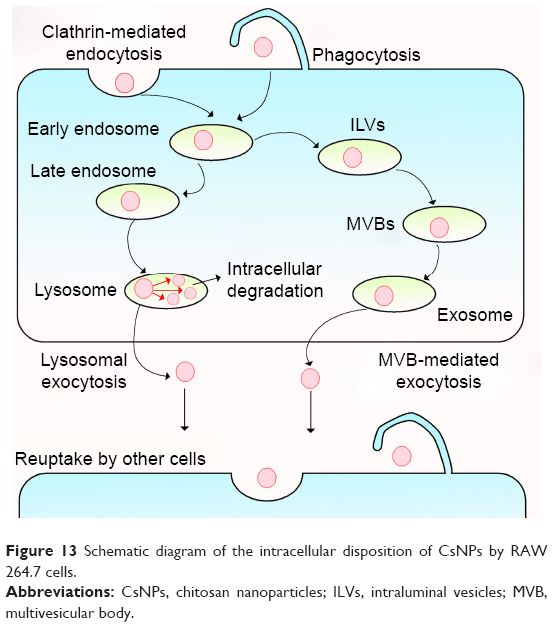 | Figure 13 Schematic diagram of the intracellular disposition of CsNPs by RAW 264.7 cells. |
Acknowledgments
The authors greatly acknowledge Fuxing Dong and Xiangyang Li for their help in the confocal microscope and flow cytometry detection. This work was supported by the National Natural Science Foundation of China (81502995 and 81402878) and the Natural Science Foundation of Jiangsu Province (BK20140223).
Disclosure
The authors report no conflicts of interest in this work.
References
Wang Y, Wu Q, Sui K, et al. A quantitative study of exocytosis of titanium dioxide nanoparticles from neural stem cells. Nanoscale. 2013;5(11):4737–4743. | ||
Oh N, Park JH. Surface chemistry of gold nanoparticles mediates their exocytosis in macrophages. ACS Nano. 2014;8(6):6232–6241. | ||
Cho WS, Cho M, Jeong J, et al. Acute toxicity and pharmacokinetics of 13 nm-sized PEG-coated gold nanoparticles. Toxicol Appl Pharmacol. 2009;236(1):16–24. | ||
Fischer HC, Hauck TS, Gomez-Aristizabal A, Chan WC. Exploring primary liver macrophages for studying quantum dot interactions with biological systems. Adv Mater. 2010;22(23):2520–2524. | ||
Bartneck M, Keul HA, Singh S, et al. Rapid uptake of gold nanorods by primary human blood phagocytes and immunomodulatory effects of surface chemistry. ACS Nano. 2010;4(6):3073–3086. | ||
Champion JA, Walker A, Mitragotri S. Role of particle size in phagocytosis of polymeric microspheres. Pharm Res. 2008;25(8):1815–1821. | ||
He C, Hu Y, Yin L, Tang C, Yin C. Effects of particle size and surface charge on cellular uptake and biodistribution of polymeric nanoparticles. Biomaterials. 2010;31(13):3657–3666. | ||
Hoppstadter J, Seif M, Dembek A, et al. M2 polarization enhances silica nanoparticle uptake by macrophages. Front Pharmacol. 2015;6:55. | ||
Nowacek AS, Balkundi S, McMillan J, et al. Analyses of nanoformulated antiretroviral drug charge, size, shape and content for uptake, drug release and antiviral activities in human monocyte-derived macrophages. J Control Release. 2011;150(2):204–211. | ||
Bae YM, Park YI, Nam SH, et al. Endocytosis, intracellular transport, and exocytosis of lanthanide-doped upconverting nanoparticles in single living cells. Biomaterials. 2012;33(35):9080–9086. | ||
Dombu CY, Kroubi M, Zibouche R, Matran R, Betbeder D. Characterization of endocytosis and exocytosis of cationic nanoparticles in airway epithelium cells. Nanotechnology. 2010;21(35):355102. | ||
Panyam J, Labhasetwar V. Dynamics of endocytosis and exocytosis of poly(D,L-lactide-co-glycolide) nanoparticles in vascular smooth muscle cells. Pharm Res. 2003;20(2):212–220. | ||
Chen R, Huang G, Ke PC. Calcium-enhanced exocytosis of gold nanoparticles. Appl Phys Lett. 2010;97(9):1. | ||
Oh N, Park JH. Endocytosis and exocytosis of nanoparticles in mammalian cells. Int J Nanomedicine. 2014;9(suppl 1):151–163. | ||
Slowing II, Vivero-Escoto JL, Zhao Y, et al. Exocytosis of mesoporous silica nanoparticles from mammalian cells: from asymmetric cell-to-cell transfer to protein harvesting. Small. 2011;7(11):1526–1532. | ||
Li C, Fu R, Yu C, et al. Silver nanoparticle/chitosan oligosaccharide/poly(vinyl alcohol) nanofibers as wound dressings: a preclinical study. Int J Nanomedicine. 2013;8(1):4131–4145. | ||
Ribeiro TG, Franca JR, Fuscaldi LL, et al. An optimized nanoparticle delivery system based on chitosan and chondroitin sulfate molecules reduces the toxicity of amphotericin B and is effective in treating tegumentary leishmaniasis. Int J Nanomedicine. 2014;9(1):5341–5353. | ||
Kean T, Thanou M. Biodegradation, biodistribution and toxicity of chitosan. Adv Drug Deliv Rev. 2010;62(1):3–11. | ||
Calvo P, Remuñán-López C, Vila-Jato JL, Alonso MJ. Novel hydrophilic chitosan–polyethylene oxide nanoparticles as protein carriers. Appl Polym. 1997;63(1):125–132. | ||
Föster T. Intermolecular energy migration and fluorescence. Ann Phys. 1948;437(2):55–75. | ||
Tao H, Wei W, Mao Y, Zhang S, Xia J. Study on degradation characteristics of chitosan by pepsin with piezoelectric quartz crystal impedance analysis technique. Anal Sci. 2005;21(9):1057–1061. | ||
Bailey TJ, Fossum SL, Fimbel SM, Montgomery JE, Hyde DR. The inhibitor of phagocytosis, O-phospho-L-serine, suppresses Muller glia proliferation and cone cell regeneration in the light-damaged zebrafish retina. Exp Eye Res. 2010;91(5):601–612. | ||
Tait JF, Smith C. Phosphatidylserine receptors: role of CD36 in binding of anionic phospholipid vesicles to monocytic cells. J Biol Chem. 1999;274(5):3048–3054. | ||
Antonescu CN, Diaz M, Femia G, Planas JV, Klip A. Clathrin-dependent and independent endocytosis of glucose transporter 4 (GLUT4) in myoblasts: regulation by mitochondrial uncoupling. Traffic. 2008;9(7):1173–1190. | ||
Van Weert AWM, Geuze HJ, Groothuis B, Stoorvogel W. Primaquine interferes with membrane recycling from endosomes to the plasma membrane through a direct interaction with endosomes which does not involve neutralisation of endosomal pH nor osmotic swelling of endosomes. Eur J Cell Biol. 2000;79(6):394–399. | ||
Boal F, Guetzoyan L, Sessions RB, et al. LG186: an inhibitor of GBF1 function that causes Golgi disassembly in human and canine cells. Traffic. 2010;11(12):1537–1551. | ||
Lu Y, Dong S, Hao B, et al. Vacuolin-1 potently and reversibly inhibits autophagosome-lysosome fusion by activating RAB5A. Autophagy. 2014;10(11):1895–1905. | ||
Miao Y, Yan PK, Kim H, Hwang I, Jiang L. Localization of green fluorescent protein fusions with the seven Arabidopsis vacuolar sorting receptors to prevacuolar compartments in tobacco BY-2 cells. Plant Physiol. 2006;142(3):945–962. | ||
Jiang LQ, Zhao X, Zheng CL, et al. The quantitative detection of the uptake and intracellular fate of albumin nanoparticles. RSC Adv. 2015;5(44):34956–34966. | ||
Graham DL, Lowe PN, Chalk PA. A method to measure the interaction of Rac/Cdc42 with their binding partners using fluorescence resonance energy transfer between mutants of green fluorescent protein. Anal Biochem. 2001;296(2):208–217. | ||
Hungerford G, Benesch J, Mano JF, Reis RL. Effect of the labelling ratio on the photophysics of fluorescein isothiocyanate (FITC) conjugated to bovine serum albumin. Photochem Photobiol Sci. 2007;6(2):152–158. | ||
Hirst J, Robinson MS. Clathrin and adaptors. Biochim Biophys Acta. 1998;1404(1–2):173–193. | ||
Mellman I. Endocytosis and molecular sorting. Annu Rev Cell Dev Biol. 1996;12(1):575–625. | ||
Anderson RG, Kamen BA, Rothberg KG, Lacey SW. Potocytosis: sequestration and transport of small molecules by caveolae. Science. 1992;255(5043):410–411. | ||
Schnitzer JE, Oh P, Pinney E, Allard J. Filipin-sensitive caveolae-mediated transport in endothelium: reduced transcytosis, scavenger endocytosis, and capillary permeability of select macromolecules. J Cell Biol. 1994;127(5):1217–1232. | ||
Aderem A, Underhill DM. Mechanisms of phagocytosis in macrophages. Annu Rev Immunol. 1999;17:593–623. | ||
Hillaireau H, Couvreur P. Nanocarriers’ entry into the cell: relevance to drug delivery. Cell Mol Life Sci. 2009;66(17):2873–2896. | ||
Kafshgari MH, Harding FJ, Voelcker NH. Insights into cellular uptake of nanoparticles. Curr Drug Deliv. 2015;12(1):63–77. | ||
Heuser JE, Anderson RG. Hypertonic media inhibit receptor-mediated endocytosis by blocking clathrin-coated pit formation. J Cell Biol. 1989;108(2):389–400. | ||
Stoneham CA, Hollinshead M, Hajitou A. Clathrin-mediated endocytosis and subsequent endo-lysosomal trafficking of adeno-associated virus/phage. J Biol Chem. 2012;287(43):35849–35859. | ||
Geisow MJ, Evans WH. pH in the endosome. Measurements during pinocytosis and receptor-mediated endocytosis. Exp Cell Res. 1984;150(1):36–46. | ||
Mindell JA. Lysosomal acidification mechanisms. Annu Rev Physiol. 2012;74:69–86. | ||
Dobrowolski R, De Robertis EM. Endocytic control of growth factor signalling: multivesicular bodies as signalling organelles. Nat Rev Mol Cell Biol. 2011;13(1):53–60. | ||
Brabec M, Blaas D, Fuchs R. Wortmannin delays transfer of human rhinovirus serotype 2 to late endocytic compartments. Biochem Biophys Res Commun. 2006;348(2):741–749. | ||
Fernandez-Borja M, Wubbolts R, Calafat J, et al. Multivesicular body morphogenesis requires phosphatidyl-inositol 3-kinase activity. Curr Biol. 1999;9(1):55–58. |
Supplementary materials
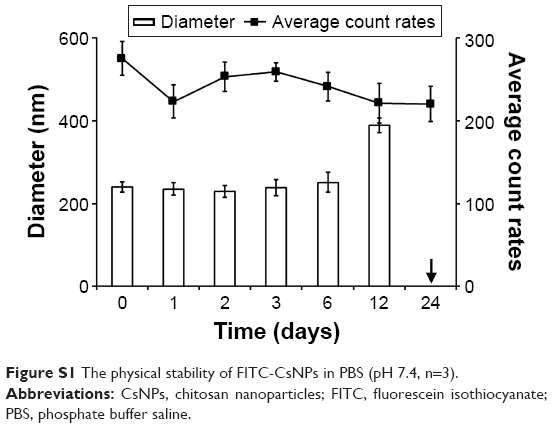 | Figure S1 The physical stability of FITC-CsNPs in PBS (pH 7.4, n=3). |
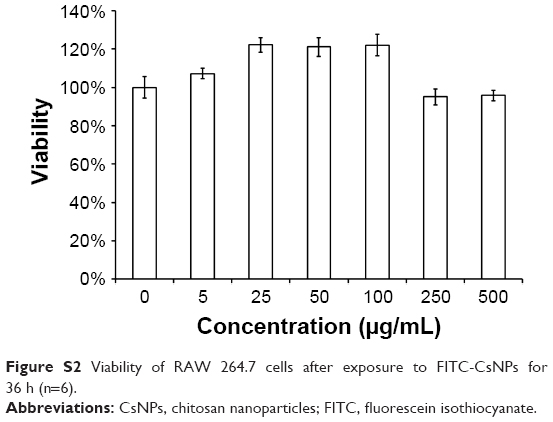 | Figure S2 Viability of RAW 264.7 cells after exposure to FITC-CsNPs for 36 h (n=6). |
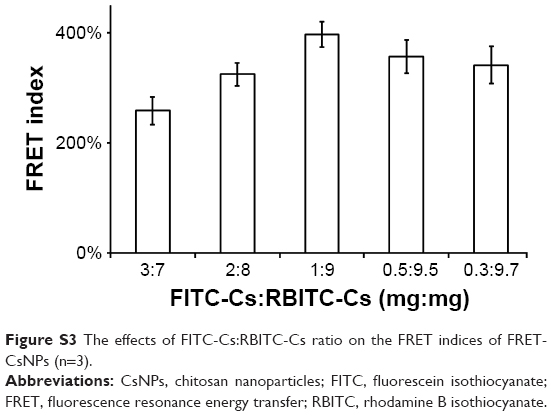 | Figure S3 The effects of FITC-Cs:RBITC-Cs ratio on the FRET indices of FRET-CsNPs (n=3). |
 © 2017 The Author(s). This work is published and licensed by Dove Medical Press Limited. The full terms of this license are available at https://www.dovepress.com/terms.php and incorporate the Creative Commons Attribution - Non Commercial (unported, v3.0) License.
By accessing the work you hereby accept the Terms. Non-commercial uses of the work are permitted without any further permission from Dove Medical Press Limited, provided the work is properly attributed. For permission for commercial use of this work, please see paragraphs 4.2 and 5 of our Terms.
© 2017 The Author(s). This work is published and licensed by Dove Medical Press Limited. The full terms of this license are available at https://www.dovepress.com/terms.php and incorporate the Creative Commons Attribution - Non Commercial (unported, v3.0) License.
By accessing the work you hereby accept the Terms. Non-commercial uses of the work are permitted without any further permission from Dove Medical Press Limited, provided the work is properly attributed. For permission for commercial use of this work, please see paragraphs 4.2 and 5 of our Terms.