Back to Journals » Breast Cancer: Targets and Therapy » Volume 8
Interleukin-6 is a potential therapeutic target in interleukin-6 dependent, estrogen receptor-α-positive breast cancer
Authors Casneuf T, Axel AE, King P, Alvarez JD, Werbeck JL, Verhulst T, Verstraeten K, Hall BM, Sasser K
Received 15 July 2015
Accepted for publication 4 September 2015
Published 3 February 2016 Volume 2016:8 Pages 13—27
DOI https://doi.org/10.2147/BCTT.S92414
Checked for plagiarism Yes
Review by Single anonymous peer review
Peer reviewer comments 4
Editor who approved publication: Professor Pranela Rameshwar
Tineke Casneuf,1 Amy E Axel,2 Peter King,2 John D Alvarez,2 Jillian L Werbeck,3 Tinne Verhulst,1 Karin Verstraeten,1 Brett M Hall,2 A Kate Sasser2
1Janssen Research and Development, Beerse, Belgium; 2Janssen Research and Development, Spring House, PA, 3LabConnect LLC, Seattle, WA, USA
Introduction: Interleukin-6 (IL-6) is an important growth factor for estrogen receptor-α (ERα)-positive breast cancer, and elevated serum IL-6 is associated with poor prognosis.
Methods: The role of the phosphorylated signal transducer and activator of transcription 3 pathway was investigated in ERα-positive breast cancer. A panel of cell lines was treated with exogenous IL-6. An IL-6 specific gene signature was generated by profiling ten ERα-positive breast cancer cell lines alone or following treatment with 10 ng/mL recombinant IL-6 or human marrow stromal cell-conditioned media, with or without siltuximab (a neutralizing anti-IL-6 antibody) and grown in three-dimensional tumor microenvironment-aligned cultures for 4 days, 5 days, or 6 days. The established IL-6 signature was validated against 36 human ERα-positive breast tumor samples with matched serum. A comparative MCF-7 xenograft murine model was utilized to determine the role of IL-6 in estrogen-supplemented ERa-positive breast cancer to assess the efficacy of anti-IL-6 therapy in vivo.
Results: In eight of nine ERα-positive breast cancer cell lines, recombinant IL-6 increased phosphorylation of tyrosine 705 of STAT3. Differential gene expression analysis identified 17 genes that could be used to determine IL-6 pathway activation by combining their expression intensity into a pathway activation score. The gene signature included a variety of genes involved in immune cell function and migration, cell growth and apoptosis, and the tumor microenvironment. Validation of the IL-6 gene signature in 36 matched human serum and ERα-positive breast tumor samples showed that patients with a high IL-6 pathway activation score were also enriched for elevated serum IL-6 (≥10 pg/mL). When human IL-6 was provided in vivo, MCF-7 cells engrafted without the need for estrogen supplementation, and addition of estrogen to IL-6 did not further enhance engraftment. Subsequently, we prophylactically treated mice at MCF-7 engraftment with siltuximab, fulvestrant, or combination therapy. Siltuximab alone was able to blunt MCF-7 engraftment. Similarly, siltuximab alone induced regressions in 90% (9/10) of tumors, which were established in the presence which were established in the presence of hMSC expressing human IL-6 and estrogen.
Conclusion: Given the established role for IL-6 in ERα-positive breast cancer, these data demonstrate the potential for anti-IL-6 therapeutics in breast cancer.
Keywords: breast cancer, estrogen receptor, gene signature, paracrine IL-6, siltuximab
Introduction
It is well established that interleukin-6 (IL-6) plays a key role in oncogenic transformation, invasion, and metastasis, including that of breast cancer cells.1,2 IL-6 also promotes cachexia, and weight loss serves as an important prognostic indicator in patients with cancer3 and in proliferative diseases where the cytokine is expressed at elevated levels.4 It has been shown that exogenous IL-6 dose dependently increases the growth rate and migration of estrogen receptor-α (ERα)-positive breast cancer cells2,5 and also drives epithelial to mesenchymal transition.6,7 The mechanism through which IL-6 exerts its effects on ERα-positive breast cancer cells is through the phosphorylation of tyrosine 705 of signal transducer and activator of transcription (STAT)3 (STAT3-Tyr705).2 However, studies published to date suggest that, in contrast to ERα-negative breast cancer, ERα-positive breast cancer cells produce minimal autocrine IL-6 and are dependent on paracrine IL-6 from within the tumor microenvironment (TME).8,9
There are a number of other cell types that produce IL-6, which could influence ERα-positive breast cancer cell activity. Indeed, IL-6 produced by breast, lung, and bone fibroblasts induces signaling via phosphorylated signal transducer and activator of transcription 3 (pSTAT3)-Tyr705 in ERα-positive breast cancer cells and, consequently, growth and invasion.2 In addition, it has been shown that IL-6 produced by bone marrow mesenchymal stem cells potently induces growth in ERα-positive, but not ERα-negative breast cancer cells.10 Furthermore, IL-6 secreted by adipose stromal cells has been shown to promote the migration and invasion of breast cancer cells both in vitro and in murine xenograft models.11
High serum IL-6 concentrations are associated with poor prognosis in ERα-positive patients with breast cancer, indicated by significantly reduced survival duration in patients with metastatic disease relative to patients with lower IL-6 levels.12,13 Moreover, higher serum concentrations of soluble IL-6 receptor at diagnosis predicted significantly shorter relapse-free survival among ER-positive patients with breast cancer.14 It has also been reported that certain IL-6 polymorphisms that increase IL-6 expression are associated with shorter disease-free survival and overall survival in patients with breast cancer.15–17
Given this role of IL-6 in ERα-positive breast cancer, the availability of anti-IL-6 therapies and predictive biomarkers, to identify patients with IL-6-dependent disease and those with early signs of therapeutic resistance, may be a valuable approach to treating certain subgroups of patients. The aim of the study presented here was to further characterize the effects of IL-6 on breast cancer cell growth and also to determine a gene signature for potential downstream mediators of IL-6 signaling in ERα-positive breast cancer.
Materials and methods
Breast cancer cell line cultures and patient samples
Ten ERα-positive breast cancer cell lines (T47D, MDA-MB-134VI, BT474, BT-483, HCC1428, EFM-19, MCF-7, MDA-MB-175-VII, MDA-MB-415, and ZR-75-1) and three ERα-negative breast cancer cell lines (BT-549, MDA-MB-231, and MDA-MB-468) were used in this study. All cell lines were purchased from American Type Culture Collection (ATCC; Manassas, VA, USA) except for EFM-19, which was obtained from DSMZ (Braunschweig, Germany). The authors advise no ethical approval was sought or required for this study as they used commercially purchased cell lines. Cell lines were authenticated by short tandem repeat DNA typing by the suppliers. All cells were maintained in two-dimensional culture in dishes with Roswell Park Memorial Institute (RPMI)-1640 medium (Thermo Fisher Scientific, Waltham, MA, USA), containing 10% fetal bovine serum (Thermo Fisher Scientific), 1% l-glutamine, 100 U/mL penicillin, and 100 μg/mL streptomycin (Thermo Fisher Scientific).
IL-6 detection, Western blotting, and molecular analyses were performed using three-dimensional (3-D) TME aligned cell cultures. Breast cancer cells were embedded in 3–7 mg/mL laminin-rich basement membrane extract (BME) as previously described,18 with medium and BME prepared with phenol red-free RPMI-1640 containing 6 mM glucose but no l-glutamine at pH 6.8 (Trevigen, Gaithersburg, MD, USA). Cultures were then overlaid with serum-free, phenol red-free RPMI-1640 containing 6 mM glucose, but without l-glutamine at pH 6.8. Cells monitored for growth in 3-D tumor growth assays were labeled using dsRed monomer retrovirus as previously described.18
Matched formalin-fixed paraffin-embedded (FFPE) tissue and serum from 36 ERα-positive breast tumors were purchased from Asterand Bioscience (Detroit, MI, USA).
IL-6 detection: panoptic meso scale detection assay
IL-6 production from breast cancer cell-conditioned media and patient serum was measured with anti-IL-6 capture antibody (clone 5IL6; Thermo Fisher Scientific) and anti-IL-6 detection antibody (clone 505E223C7; Thermo Fisher Scientific).19,20
Conditioned medium from breast cancer cell lines was collected after 24 hours in 3-D cultures and assayed on the same day. Serum samples of patients with breast cancer were frozen and stored at −80°C until required. Samples with <10 pg/mL IL-6 (the lower limit of detection) were designated as paracrine based on published studies in healthy individuals and patients with cancer.21–25
Western blotting
The ERα-positive cell lines MCF-7, T47D, and BT474 do not produce IL-6, but are responsive to IL-6 produced in the 3-D tumor TME-aligned model through phosphorylation of STAT3 and tumor cell growth.10 To determine whether IL-6 responsiveness is applicable across ERα-positive breast cancer, the breast cancer cell lines were characterized for IL-6 production and response. For Western blot analyses, 500,000 cells were harvested from the 3-D TME-aligned cultures.
For pSTAT3-Tyr705 analysis, cells were treated with 1) 0 ng/mL, 10 ng/mL, 50 ng/mL, or 100 ng/mL glycosylated human recombinant IL-6 (Humanzyme, Chicago, IL, USA); 2) 0 μg/mL, 10 μg/mL, 50 μg/mL, or 100 μg/mL siltuximab (an anti-IL-6 monoclonal antibody approved for the treatment of multicentric Castleman’s disease);26 or 3) 50 ng/mL IL-6 with 0 μg/mL, 10 μg/mL, 50 μg/mL, or 100 μg/mL siltuximab. Whole-cell lysates were harvested 24 hours following treatment (the media overlay was removed by aspiration, and the cells plus BME were lysed as previously described6).
Although pSTAT3-Tyr705 is a key downstream factor for IL-6 signaling, other proteins, such as phosphatidyl-inositol-3-kinase (PI3K)/serine-threonine kinase (Akt), mitogen-activated protein kinase (MAPK), extracellular signal regulated kinase (ERK) 1/2, and MAPK/ERK kinase (MEK) 1/2, are also known to be downstream of IL-6 signaling.5,27,28 These proteins were therefore also investigated by Western blot analysis following IL-6 stimulation to determine whether these pathways were important for IL-6 activities in ERα-positive breast cancer.
pSTAT3-Tyr705 was evaluated with rabbit anti-pSTAT3-Tyr705 and goat anti-rabbit immunoglobulin G-horse radish peroxidase (both from Cell Signaling Technology, Danvers, MA, USA). Membranes were stripped and probed with rabbit anti-STAT3 antibody (Cell Signaling Technology). Additional Western blot analysis using anti-phospho-Akt-Ser473, anti-Akt, anti-phospho-p44/42 MAPK, anti-p44/42 MAPK, anti-pMEK1/2, anti-MEK1/2, anti-pSTAT3-Tyr705, and anti-STAT3 was performed following 24 hours of culture. Anti-β-actin (GenWay Biotech, San Diego, CA, USA), goat anti-chicken horse radish peroxidase (EMD Millipore, Billerica, MA, USA), and all other antibodies obtained from Cell Signaling Technology were used for blotting. Total STAT3, Akt, MEK1/2, and ERK1/2 were controls, and β-actin was used as a loading control.
Generation of the IL-6 pathway activation gene signature
Ten ERα-positive breast cancer cell lines were grown in TME-aligned 3-D culture as described earlier. After establishment, cells were grown in triplicate for 6 days in the absence or presence of 10 ng/mL IL-6 added on day 1. Sampling was performed on days 4, 5, and 6. Five additional conditions were investigated in duplicate, as internal validation for the IL-6 pathway activation signature (PAS) and to evaluate treatment with siltuximab: 1) 10 ng/mL IL-6 added on day 0 plus 50 μg/mL siltuximab added on day 1, 2) 10 ng/mL IL-6 added on day 1 plus 50 μg/mL siltuximab added on day 1, 3) 50 μg/mL siltuximab added on day 0, 4) human marrow stromal cell-conditioned media (hMSC-CM), and 5) hMSC-CM plus 50 μg/mL siltuximab. After culturing, the media overlay was removed by aspiration, and 150 μL Qiazol was immediately added to the cells plus BME to achieve lysis. This mixture was combined with an additional 600 μL Qiazol and stored at −80°C until RNA isolation. RNA isolation was performed using the miRNeasy 96 Kit (Qiagen NV, Venlo, the Netherlands). The RNA concentration of all samples was determined on a Nanodrop-8000 UV-Vis Spectrophotometer (Thermo Fisher Scientific).
Biotin-labeled, amplified RNA (aRNA) was synthesized from 200 ng total RNA using the 3′IVT Express Kit (Affymetrix, Santa Clara, CA, USA). The aRNA was then purified using Agencourt RNAClean XP beads (Beckman Coulter Inc., Pasadena, CA, USA) on the BioMek Fx Workstation (Beckman Coulter Inc.). Biotin-labeled aRNA was fragmented using the 3′IVT Express Kit. A total of 4.5 μg fragmented biotin-labeled aRNA was hybridized on an HT human genome (HG)-U219 96-array plate (Affymetrix). The plate was washed, stained, and scanned with the GeneTitan Instrument (Affymetrix).
The microarray data were normalized with robust multiarray analysis29 and summarized with the HG-U219H Sentrezg 15.0.0 chip definition files.30 Single outlier arrays were set aside upon quality assessment with arrayQualityMetrics.31 Genes that showed little expression variation across the samples were filtered out based on informative/noninformative calls,32 omitting 4,442 of the initial 18,567 genes identified. Genes that were changed upon treatment were identified by comparing the days 4, 5, and 6 untreated samples to the IL-6-treated samples using linear models for microarray data analysis (Limma).33 A model, Y = cell line + treatment + time + treatment:time, was fitted, where cell line was a random factor and treatment and time were fixed. This model was run twice, once with treatment and time as a factor variable, where the most interesting genes were selected based on the three pair-wise coefficients, and once with treatment as a factor and time as numeric.
Genes of interest were extracted based on three coefficients: 1) the interaction and treatment coefficient together, 2) the interaction term only, and 3) the treatment term only. The thresholds for selecting genes of interest for these parameters were, respectively, an adjusted P=0.01 for the former two and P=0.05 for the latter two. For inclusion in the signature, genes were required to have an absolute (up- or downregulation) change of ≥1.5-fold in at least six conditions. The derived signature consisted of 17 genes that were all upregulated in the majority of the samples. The IL-6 PAS in a given sample was defined as the mean fold change relative to the reference sample (which was the internal control sample when available, such as the untreated groups in this 10-cell line experiment) or to the geometric center (centroid) of the genes of all samples in the data set (such as the patient screening data set that was used in the evaluation phase of the signature). All data analysis was conducted using the R statistics and Bioconductor packages (http://www.r-project.org/; http://bioconductor.org).
Patient FFPE samples were also utilized for gene expression profiling. From each block, four 10 μm slices were cut and transferred to a 1.5 mL Eppendorf tube. Paraffin was removed using deparaffinization solution (Qiagen NV). The tissue was then lysed in proteinase K digestion buffer (Qiagen NV). RNA isolation was continued using the RNeasy FFPE kit (Qiagen NV) according to the manufacturer’s instructions. The RNA concentration of all samples was determined on a Nanodrop-8000 UV-Vis Spectrophotometer (Thermo Fisher Scientific). For a selection of samples, RNA quality was determined with the RNA 6000 Nano LabChip on an Agilent 2100 Bioanalyzer (Agilent Technologies, Santa Clara, CA, USA) according to the manufacturer’s instructions. SenseRNA was generated from 200 ng total RNA using the Sensation RNA Amplification Kit (Genisphere, Hatfield, PA, USA). A total of 25 μg senseRNA was reverse transcribed, and double-stranded complementary DNA (cDNA) was generated using the Biotin Labeling Kit for ST/Exon Arrays (Genisphere). Using the same kit, 5 μg double-stranded cDNA was fragmented and end labeled with biotin. Biotin-double-stranded cDNA (3.75 μg) was hybridized, washed, stained, and scanned with the Affymetrix GeneTitan Instrument on an Affymetrix Human Gene 1.1 ST array plate. For some samples, 200 ng total RNA, 25 μg senseRNA, or 5 μg double-stranded cDNA were not available. In that case, all available materials were used. Raw Affymetrix gene expression data were preprocessed with robust multiarray analysis29 and summarized using the HU-gene11stv1hsentrezg 15.0.0.30 Array quality was again evaluated with arrayQualityMetrics.31
The PAS was calculated per sample by taking the mean of the fold change of the 17 genes in the signature previously determined in the cell lines, where the fold change was calculated for each gene relative to the centroid of all 36 patient samples. All data analysis was conducted using the R statistics and bioconductor packages (http://www.r-project.org/; http://bioconductor.org).
STAT3 immunohistochemistry
For the patient with breast cancer, tumor biopsy samples were tested using immunohistochemistry for intratumoral pSTAT3-Tyr705, staining with a rabbit monoclonal antibody (Cell Signaling Technology). Slides with 5 μm sections of FFPE tissue were dewaxed, and antigen retrieval was performed in a pressure cooker in ethylenediaminetetraacetic acid (EDTA), pH 8.0 (Abcam, Cambridge, MA, USA). Peroxide block was performed followed by protein block in 5% normal goat serum. Slides were stained on the BioGenex auto stainer using 1:50 diluted antibody followed by anti-rabbit secondary (Cell Signaling Technology) and 3,3′-diaminobenzidine tetrahydrochloride substrate and then counterstained with hematoxylin. Washes were performed using EnVision FLEX buffer (Dako Denmark A/S, Glostrup, Denmark). Flagship Biosciences, LLC (Westminster, CO, USA) utilized digital image analysis software to score nuclear pSTAT3-Tyr705 staining in tumor epithelial cell regions that excluded necrotic regions, areas of heavy inflammation, and tissue artifacts. Stained slides were scored utilizing a standard H-score method. In brief, staining intensity was scored by integers ranging from 0 to 3. The percentage of tumor cells staining at each intensity was multiplied by the intensity score so that the H-score equals (percentage tumor at 1+) ×1+ (percentage tumor at 2+) ×2+ (percentage of tumor at 3+) ×3. Heterogeneity of staining across the entire section (HetCell) and regional heterogeneity (HetTumor) were calculated using digital image analysis algorithms by Flagship Biosciences.
MCF-7 tumor xenografts
All experiments were carried out in accordance with the European Communities Council Directives (86/609/EEC) and were approved by the local ethics committee of Janssen Pharmaceutica N.V., Beerse, Belgium. Four- to 6-week-old nonovariectomized female NOD-SCID (NOD.CB17-Prkdcscid/NcrCrl) mice were obtained from Charles River Laboratories (Erkrath, Germany) and acclimatized for 1 week before use. Xenografts were established by injecting 5×10⁶ MCF-7 cells in the presence or absence of 0.5×10⁶ hMSC in 50 mL medium/BME (1:1 ratio) into the mammary fat pad of the mice. Prior to cell inoculation, mice were implanted with a subcutaneous 0.5 mg, 60-day slow release 17β-estradiol pellet (Innovative Research of America, Sarasota, FL, USA).
hMSCs produce large amounts of paracrine IL-6 and promote IL-6-dependent growth of ERα-positive breast cancer cell lines in 3-D cultures.10 ERα-positive breast cancer cell lines are known for limited engraftment in xenograft models without estrogen supplementation or matrigel implantation, although recent studies demonstrated that hMSCs can promote xenograft engraftment and growth of MCF-7 cells through increased expression of progesterone receptors, stromal cell-derived factor-1, its receptor (CXCR-4), and other unidentified soluble factors.34,35
Additional xenograft experiments were established using MCF-7 plus hMSCs in mice with and without implanted with estrogen pellets. For drug efficacy studies, the highest potential clinical hurdle was modeled for anti-IL-6 therapy (ie, MCF-7 + hMSC (paracrine IL-6) + estrogen supplementation). These mice were treated prophylactically 4 days after cell injection with siltuximab administered intraperitoneally twice weekly (20 mg/kg body weight in Dulbecco’s phosphate-buffered saline [PBS]) alone or in combination with fulvestrant (25 mg/mL; purchased commercially) administered by subcutaneous injection once weekly (200 mg/kg body weight in Dulbecco’s PBS) for 6 weeks. Each treatment group contained ten mice. In a second study, using the same model, tumors were allowed to reach a size of 100–150 mm3 (~3–4 weeks) before the mice were randomized. Treatment schedule and dose were the same as the prophylactic setting. Fulvestrant (200 mg/kg body weight) was administered on day 2, with siltuximab (20 mg/kg) administered on days 1 and 4 each week.
In all studies, body weight and tumor size (using the commonly accepted formula: tumor volume [mm3] = [a × b2/2], where a represents the length and b represents the width of the tumor as determined by caliper measurements), were monitored twice a week, with mice monitored daily for clinical signs of toxicity. Timecourse of tumor growth was expressed as mean tumor volumes ± standard error of the means (SEMs) for each group. For the prophylactic and curative experiments, treatment versus control-treated ratios were calculated from the relative tumor volumes (treatment volume/tumor volume at start of treatment and expressed as mean ± SEM for each group).
Results
ERα-positive breast cancer cells do not produce autocrine IL-6
Only three breast cancer cell lines were found to produce autocrine IL-6 at levels of 0.4–10 pg/mL per 50,000 cells: BT549, MDA-MB-231, and MDA-MB-468 (Table 1 and data not shown). These lines were ERα negative, demonstrated pSTAT3-Tyr705 at baseline, and were unresponsive to further IL-6 stimulation. The remaining cell lines were ERα positive and did not produce autocrine IL-6, confirming the results of our previous study10 and other published studies.36
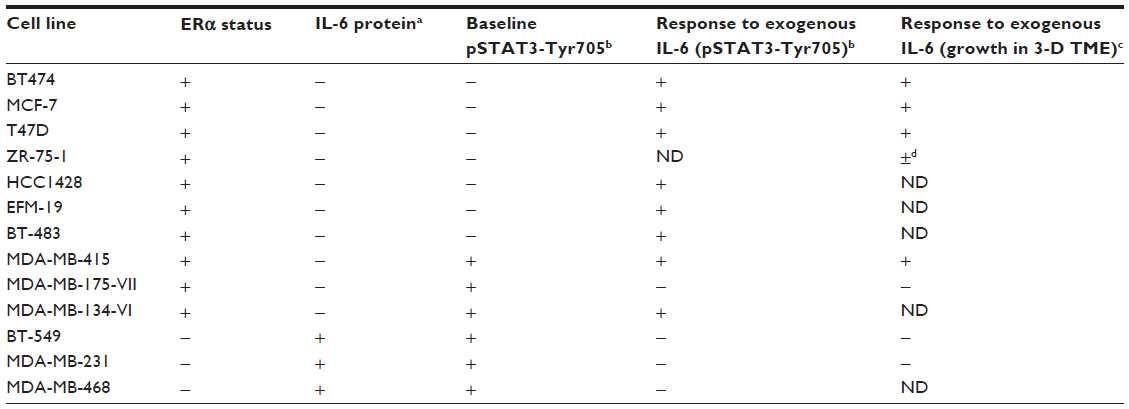 | Table 1 Summary of breast cancer cells lines in 3-D culture |
Recombinant IL-6 (10 ng/mL) increased STAT3-Tyr705 phosphorylation in eight of the nine ERα-positive cell lines evaluated by Western blot analysis (Figure 1 and Table 1). However, IL-6-induced phosphorylation of Akt, MEK1/2, or ERK1/2 was not observed (Figure 2). Six ERα-positive breast cancer cell lines were also assessed for a growth response to human recombinant IL-6 in 3-D TME-aligned models. Of these, four cell lines (66%) demonstrated increased growth when exposed to IL-6; all demonstrated STAT3 phosphorylation in response to IL-6 exposure (Table 1).
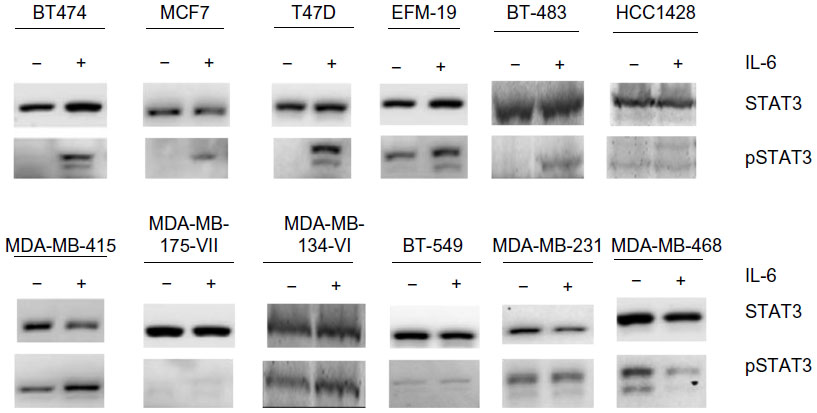 | Figure 1 Effect of recombinant IL-6 on STAT3-Tyr705 phosphorylation in ERα-positive and ERα-negative cell lines. |
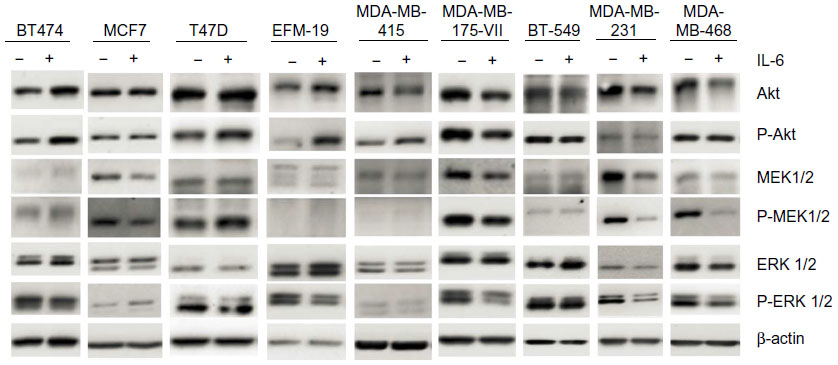 | Figure 2 Effect of recombinant IL-6 on Akt, MEK 1/2, and ERK 1/2 phosphorylation in ERα-positive and ERα-negative cell lines. |
The IL-6 gene signature consists of 17 individual genes
To determine what other specific genes and pathways are associated with IL-6 signaling in ERα-positive breast cancer and to develop a signature to identify IL-6-dependent, ERα-positive breast tumors that could benefit from anti-IL-6 therapy, gene expression profiling was performed on ten ERα-positive breast cancer cell lines alone or following treatment with 10 ng/mL recombinant IL-6 or hMSC-CM, with or without siltuximab, in 3-D TME-aligned cultures for up to 6 days. hMSC-CM contains high levels of IL-6 and promotes ERα-positive breast cancer cell growth mainly through IL-6.2 3-D cultures were digested at multiple time points and, following RNA isolation, gene expression profiling was performed. Differential gene expression analysis of the IL-6-treated and untreated samples at days 4, 5, and 6 identified 17 genes that could be used to determine IL-6 pathway activation by combining their expression intensity into a PAS (Figure 3 and Table 2); these data have been deposited in the NCBI’s Gene Expression Omnibus (GEO)37 and are accessible through GEO Series accession number GSE54329 (http://www.ncbi.nlm.nih.gov/geo/query/acc.cgi?acc=GSE54329). Of the ten ERα-positive breast cancer cell lines, five (BT-483, MDA-MB-175VII, MDA-MB-415, T47D, and ZR-75-1) were highly responsive to IL-6 treatment, with an IL-6 PAS of ≥1; the cell lines were also responsive to hMSC-CM, which produce IL-6. The other five ERα-positive breast cancer cell lines demonstrated an IL-6 PAS between 0 and 1 (Figure 3). For all cell lines, treatment with siltuximab eliminated or greatly reduced responsiveness to IL-6.
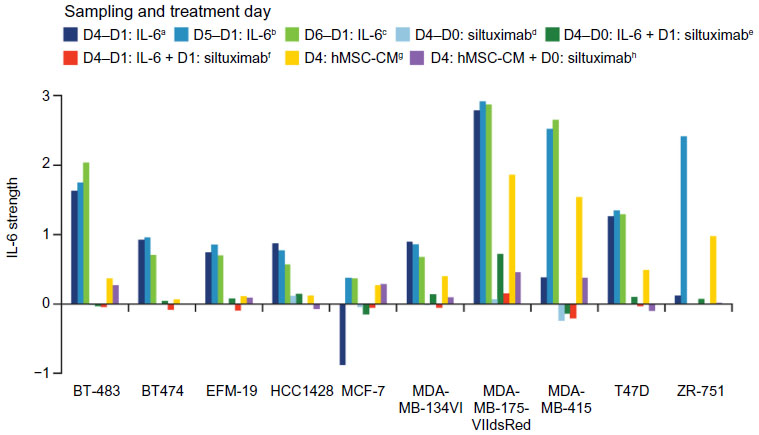 | Figure 3 Strength of the IL-6 signature in ERα-positive breast cancer cell lines at different time points and under different treatment conditions. |
 | Table 2 The identified IL-6 gene signature in ERα-positive breast cancer cell lines |
To further investigate the IL-6 gene signature in human ERα-positive breast tumors and to determine whether IL-6 signature PAS is associated with serum IL-6 levels and intratumoral pSTAT3, we acquired FFPE tumor blocks and matched serum samples from 36 ERα-positive patients with breast cancer. These patients had a median age of 66 years, a median body mass index of 30.2 kg/m2, were Caucasian, and most (86%) were postmenopausal. Most (94%) of the patients had a clinical diagnosis of infiltrated ductal carcinoma; 3% of patients had grade I disease, 56% had grade II, 22% had grade III, and 19% had unknown grade; 70% had progesterone receptor-positive disease and 11% had progesterone receptor-negative disease (19% unknown). According to immunohistochemistry, 17 (47%) of 36 samples were positive (H-score ≥100) for pSTAT3-Ty705. When patients with elevated serum IL-6 (>10 pg/mL) were compared with those with low serum IL-6 (<10 pg/mL), increased pSTAT3 H-scores were associated with elevated serum IL-6 (P=0.04; Wilcoxon rank sum test; Figure 4A).
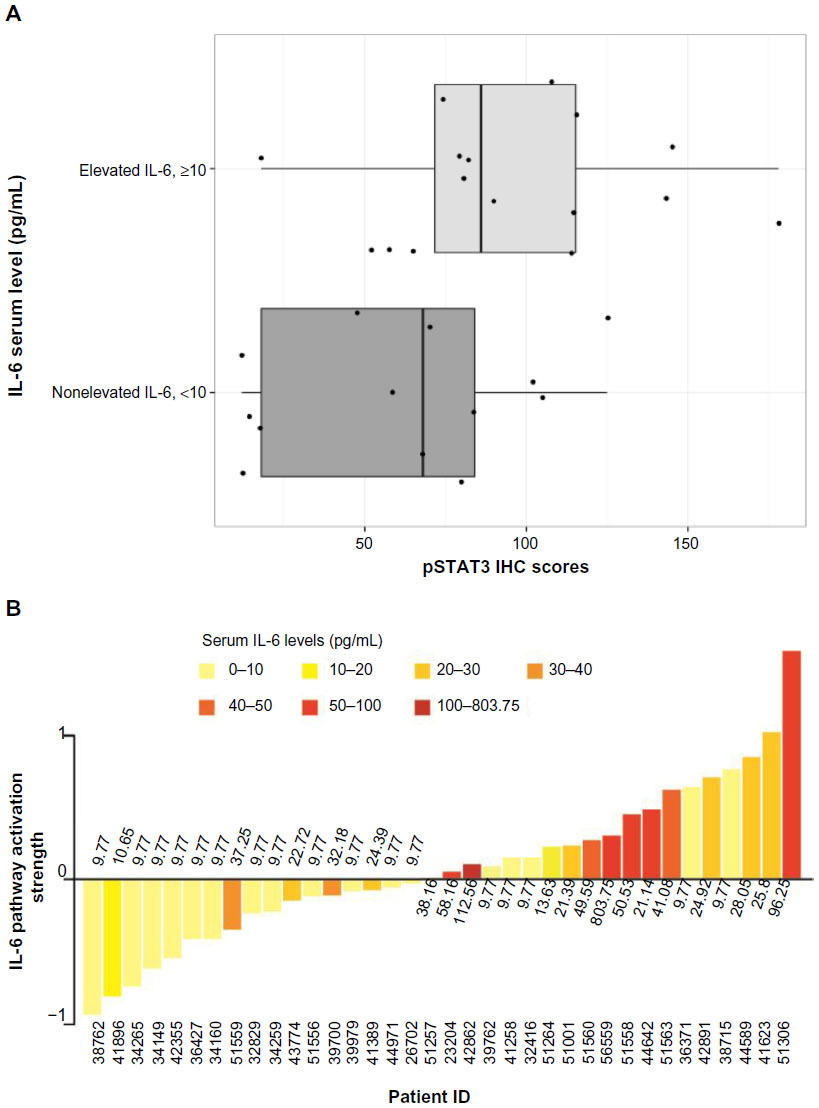 | Figure 4 The relationship between elevated serum IL-6 and increased intratumoral phosphorylated STAT3-Y705 in human breast cancer samples. |
The IL-6 PAS was determined for each patient and compared with the serum IL-6 level from the same patient (Figure 4B); these data have also been deposited in the NCBI’s GEO and are accessible through accession number GSE54330 (http://www.ncbi.nlm.nih.gov/geo/query/acc.cgi?acc=GSE54330). High IL-6 PAS was associated with increased serum IL-6 levels. Fourteen (74%) of 19 patients with a high IL-6 gene PAS also had elevated serum IL-6 (≥10 pg/mL). Similarly, 12 (71%) of 17 patients with a low IL-6 gene PAS also had low serum IL-6 (<10 pg/mL). These results support the hypothesis that IL-6 is biologically relevant in ERα-positive breast cancer. Notably, IL-6-induced phosphorylation of Akt, MEK1/2, or ERK1/2 was not observed, confirming results of a previous study and showing that STAT3 phosphorylation is the primary IL-6-responsive pathway in ERα-positive cell lines.36
IL-6 blockade retards MCF-7 tumor xenograft growth
To determine whether there was additional interplay between IL-6 and estrogen in promoting ERα-positive breast tumor cell growth, 5×10⁶ MCF-7 cells were coinjected into the murine mammary fat pad with either estrogen pellets, hMSCs (0.5×10⁶), or both (Figure 5A). Standard estrogen supplementation alone resulted in 50% (5/10) engraftment and 30% (3/10) of animals obtained an MCF-7 tumor size ≥500 mm3 by a median of 69 days (Figure 5B). MCF-7 cells coinjected with hMSCs with or without estrogen supplementation resulted in 100% (10/10) engraftment in both groups, with all tumors reaching ≥500 mm3 by a median of 33.5 days and 35 days, respectively. This indicates that human IL-6 promotes superior growth of ERα-positive breast tumors and is not further enhanced by exogenous estrogen supplementation.
 | Figure 5 Summary of findings from MCF-7 murine tumor xenograft model. |
To test whether IL-6 was a key driver of ERα tumor cell growth, MCF-7 xenograft models were utilized to evaluate the effects of IL-6 inhibition in tumor cell growth. In a prophylactic setting, MCF-7 xenografts were treated with vehicle, fulvestrant, siltuximab, or combination therapy. In this setting, even in the presence of excess estrogen and human growth factors (from stromal cells), blocking only paracrine IL-6 with siltuximab reduced tumor cell growth by 42% as compared to vehicle (Figure 6A). Fulvestrant decreased the growth of MCF-7 xenografts by 75%, and combination therapy reduced tumor growth by 79%.
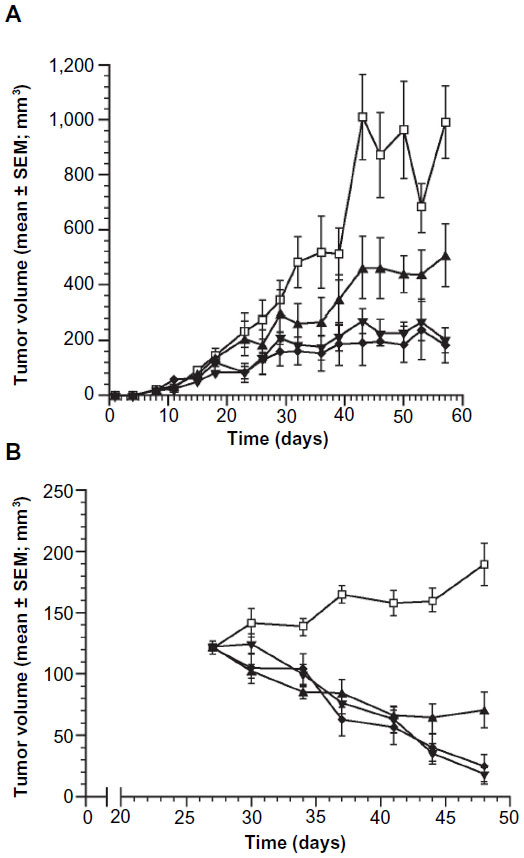 | Figure 6 Changes in tumor volume in the MCF-7 murine tumor xenograft model over a 6-week period. |
 ); 2) siltuximab 20 mg/kg bodyweight twice weekly (▲); 3) fulvestrant 200 mg/kg bodyweight once weekly (▼); or 4) siltuximab + fulvestrant (♦). Each treatment group contained ten mice. (
In a second MCF-7 xenograft model, established tumor xenografts were allowed to reach an average of 122±3 mm3 before treatment was administered. Vehicle-treated animals had tumors that continued to expand through day 48, while siltuximab, fulvestrant, and combination treatment all induced tumor regression in most (29/30) animals through day 41 (Figure 6B). Siltuximab alone demonstrated tumor regressions in 90% (9/10) of tumors; six of these tumors initially regressed followed by eventual regrowth, demonstrating the tumors’ ability to develop IL-6-independent growth, in the presence of exogenous estrogen supplementation. Of interest, a similar but delayed escape (~90 days) has been reported for fulvestrant in a similar model that lacked human IL-6 support from hMSC.38
Discussion
The findings of this study reinforce the relevance of IL-6 in ERα-positive breast cancer. First, the absence of autocrine IL-6 and pSTAT3-Tyr705 in ERα-positive breast cancer cell lines and their response to paracrine IL-6 expand on the results of our previous study10 and another published study.36 Notably, the absence of IL-6-induced phosphorylation of Akt, MEK1/2, or ERK1/2 confirms previous findings showing that STAT3 phosphorylation is the primary IL-6-responsive pathway in ERα-positive cell lines.36
To identify patients more likely to have IL-6-dependent disease and thus who may better respond to anti-IL-6 therapy or in combination with antiestrogens, we developed a 17-gene IL-6 PAS from 10 ERα-positive breast cancer cell lines treated with human recombinant IL-6. This signature enriched for patients with intratumoral pSTAT3 signaling; additionally, increased IL-6 pathway activity in the samples of ERα-positive patients with breast cancer was associated with elevated serum IL-6 levels. Functional interpretation of this gene set revealed that these 17 genes have been documented as part of the Jak-STAT downstream pathway of IL-6 (Figure 7). Notably, many of the genes in the IL-6 signature are involved in innate immunity, cell-cycle regulation, iron trafficking, and immune cell chemotaxis, supporting previous reports of IL-6 driving a TME that supports breast cancer growth (Table 2 and Supplementary material). This gene signature could be utilized in the clinical setting to help identify patients with IL-6-driven disease who might benefit from anti-IL-6 therapy.
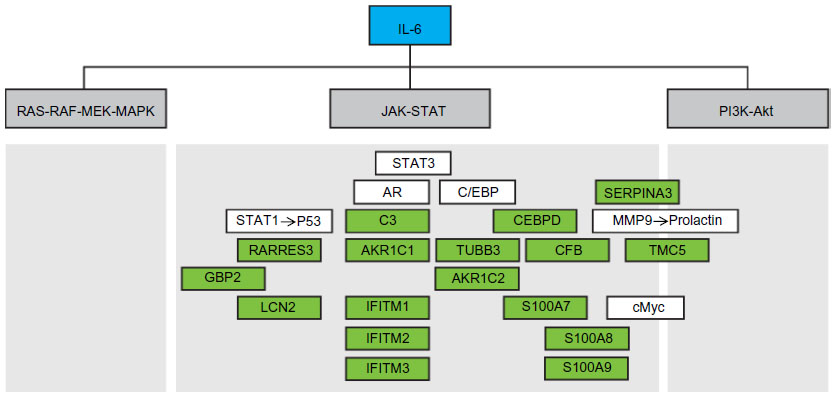 | Figure 7 Functional interpretation of the IL-6 gene signature and its relationship to the three main downstream pathways of IL-6. |
The results of the present study demonstrate that IL-6 neutralization both delayed engraftment of MCF-7 humanized xenograft tumors and elicited tumor xenograft regression in tumors, established in nonovariectomized mice and supplemented with exogenous estrogen. This model ensured maximal estrogen exposure and duration, both local and systemic. Even in this setting, neutralization of IL-6 alone was sufficient to blunt tumor growth (prophylactic) and drive tumor regression (therapeutic). Of the four xenograft models established (Figure 5A), human bone marrow-derived hMSC supplementation and bone marrow-derived hMSC plus estrogen demonstrated 100% engraftment with superior growth kinetics versus estrogen alone. Taken together, these data suggest that IL-6 and estrogen copromote engraftment and growth of MCF-7 xenografts.
From a translational perspective, our collective data demonstrate that ERα-positive breast tumor models, when biased toward estrogen supported growth, demonstrate IL-6 dependency. Additional experiments, beyond the scope of this study, that are designed to reflect a postmenopausal setting will be required to better characterize monotherapy and combination efficacy and therapeutic durability for both siltuximab and fulvestrant. This could be modeled using ovariectomized mice challenged with ERα-positive breast tumors (cell lines or patient-derived xenografts), which are supplemented with hMSC but without exogenous estrogen supplementation (ie, IL-6 biased models reflecting the human postmenopause tumor environment).
Based on this study and a growing body of published evidence, emerging translational implications for women diagnosed with ERα-positive breast cancer are 1) IL-6 is a key factor in the biology of ERα-positive breast cancer, 2) ERα-positive breast cancer is most often diagnosed following menopause, an environment that rich in IL-6 and localized estrogen, and 3) antiestrogen therapy combined with anti-IL-6 therapy may provide significant benefit for a large proportion of these women. Therefore, there is a need for predictive biomarkers to determine patients with IL-6-dependent disease and to monitor for early signs of therapeutic resistance to IL-6- directed therapies. Conversely, identifying patients likely to respond to anti-IL-6 therapies must be rigorously explored in well-designed clinical studies. This could be accomplished through serum IL-6 measurement, pSTAT3 staining in the tumor section or potentially using an IL-6 gene signature.
Acknowledgments
The authors thank the following for their work in performing the experiments and analyses described in this paper: panels of Western blots to address alternate IL-6 pathways were performed by Genway Biotech, Inc; Western blots to assess pSTAT3 signaling were performed by Dr Nick Sullivan at Dr Tania Oberyszyn’s laboratory, Ohio State University; pSTAT3 digital image analyses were performed by Flagship Bioscience LLC. Brenda Hertzog performed pSTAT3 IHC work. Editorial assistance was provided by Christopher J Jones, PhD, of MedErgy and was funded by Janssen Research and Development, LLC. This study was supported by Janssen Research and Development.
Author contributions
Tineke Casneuf, Brett Hall, and Kate Sasser conceived and designed the study. Karin Verstraeten and Amy Axel performed the gene expression experiments. Tineke Casneuf analyzed the gene expression data. Tineke Casneuf, John Alvarez, and Kate Sasser validated the IL-6 pathway activation signature. Peter King and Tinne Verhulst performed the mouse xenograft studies. Jillian Werbeck created the pathway of the IL-6 gene signature. Kate Sasser, Tineke Casneuf, Jillian Werbeck, Brett Hall, and Amy Axel helped to draft the manuscript. All authors contributed toward data analysis, drafting and critically revising the paper and agree to be accountable for all aspects of the work.
Disclosure
JLW was a consultant of Janssen Research and Development. TC, AEA, PK, JDA, TV, KV, AKS are employees of Janssen Research and Development. BMH is a former employee of Janssen Research and Development. No other potential conflicts of interest were disclosed by the other authors.
References
Sansone P, Storci G, Tavolari S, et al. IL-6 triggers malignant features in mammospheres from human ductal breast carcinoma and normal mammary gland. J Clin Invest. 2007;117(12):3988–4002. | |
Studebaker AW, Storci G, Werbeck JL, et al. Fibroblasts isolated from common sites of breast cancer metastasis enhance cancer cell growth rates and invasiveness in an interleukin-6-dependent manner. Cancer Res. 2008;68(21):9087–9095. | |
Tisdale MJ. Cachexia in cancer patients. Nat Rev Cancer. 2002;2(11):862–871. | |
Van Rhee F, Stone K, Szmania S, Barlogie B, Singh Z. Castleman disease in the 21st century: an update on diagnosis, assessment, and therapy. Clin Adv Hematol Oncol. 2010;8(7):486–498. | |
De Luca A, Lamura L, Gallo M, Maffia V, Normanno N. Mesenchymal stem cell-derived interleukin-6 and vascular endothelial growth factor promote breast cancer cell migration. J Cell Biochem. 2012;113(11):3363–3370. | |
Sullivan NJ, Sasser AK, Axel AE, et al. Interleukin-6 induces an epithelial-mesenchymal transition phenotype in human breast cancer cells. Oncogene. 2009;28(33):2940–2947. | |
Xie G, Yao Q, Liu Y, et al. IL-6-induced epithelial-mesenchymal transition promotes the generation of breast cancer stem-like cells analogous to mammosphere cultures. Int J Oncol. 2012;40(4):1171–1179. | |
Chavey C, Bibeau F, Gourgou-Bourgade S, et al. Oestrogen receptor negative breast cancers exhibit high cytokine content. Breast Cancer Res. 2007;9(1):R15. | |
Chiu JJ, Sgagias MK, Cowan KH. Interleukin 6 acts as a paracrine growth factor in human mammary carcinoma cell lines. Clin Cancer Res. 1996;2(1):215–221. | |
Sasser AK, Sullivan NJ, Studebaker AW, Hendey LF, Axel AE, Hall BM. Interleukin-6 is a potent growth factor for ER-alpha-positive human breast cancer. FASEB J. 2007;21(13):3763–3770. | |
Walter M, Liang S, Ghosh S, Hornsby PJ, Li R. Interleukin 6 secreted from adipose stromal cells promotes migration and invasion of breast cancer cells. Oncogene. 2009;28(30):2745–2755. | |
Bachelot T, Ray-Coquard I, Menetrier-Caux C, Rastkha M, Duc A, Blay JY. Prognostic value of serum levels of interleukin 6 and of serum and plasma levels of vascular endothelial growth factor in hormone-refractory metastatic breast cancer patients. Br J Cancer. 2003;88(11):1721–1726. | |
Salgado R, Junius S, Benoy I, et al. Circulating interleukin-6 predicts survival in patients with metastatic breast cancer. Int J Cancer. 2003; 103(5):642–646. | |
Won HS, Kim YA, Lee JS, et al. Soluble interleukin-6 receptor is a prognostic marker for relapse-free survival in estrogen receptor-positive breast cancer. Cancer Invest. 2013;31(8):516–521. | |
DeMichele A, Gray R, Horn M, et al. Host genetic variants in the interleukin-6 promoter predict poor outcome in patients with estrogen receptor-positive, node-positive breast cancer. Cancer Res. 2009;69(10):4184–4191. | |
Snoussi K, Strosberg AD, Bouaouina N, Ben AS, Chouchane L. Genetic variation in pro-inflammatory cytokines (interleukin-1beta, interleukin-1alpha and interleukin-6) associated with the aggressive forms, survival, and relapse prediction of breast carcinoma. Eur Cytokine Netw. 2005;16(4):253–260. | |
Iacopetta B, Grieu F, Joseph D. The -174 G/C gene polymorphism in interleukin-6 is associated with an aggressive breast cancer phenotype. Br J Cancer. 2004;90(2):419–422. | |
Sasser AK, Mundy BL, Smith KM, et al. Human bone marrow stromal cells enhance breast cancer cell growth rates in a cell line-dependent manner when evaluated in 3D tumor environments. Cancer Lett. 2007; 254(2):255–264. | |
Stone K, Woods E, Szmania SM, et al. Interleukin-6 receptor polymorphism is prevalent in HIV-negative Castleman disease and is associated with increased soluble interleukin-6 receptor levels. PLoS One. 2013;8(1):e54610. | |
Chaturvedi S, Siegel D, Wagner CL, et al. Development and validation of panoptic Meso scale discovery assay to quantify total systemic interleukin-6. Br J Clin Pharmacol. 2015;80(4):687–697. | |
Mouawad R, Benhammouda A, Rixe O, et al. Endogenous interleukin 6 levels in patients with metastatic malignant melanoma: correlation with tumor burden. Clin Cancer Res. 1996;2(8):1405–1409. | |
Angstwurm MW, Gartner R, Ziegler-Heitbrock HW. Cyclic plasma IL-6 levels during normal menstrual cycle. Cytokine. 1997;9(5):370–374. | |
Yamamura M, Yamada Y, Momita S, Kamihira S, Tomonaga M. Circulating interleukin-6 levels are elevated in adult T-cell leukaemia/lymphoma patients and correlate with adverse clinical features and survival. Br J Haematol. 1998;100(1):129–134. | |
Jiang XP, Yang DC, Elliott RL, Head JF. Reduction in serum IL-6 after vacination of breast cancer patients with tumour-associated antigens is related to estrogen receptor status. Cytokine. 2000;12(5):458–465. | |
Wong E, Freiberg M, Tracy R, Kuller L. Epidemiology of cytokines: the women on the move through activity and nutrition (WOMAN) study. Am J Epidemiol. 2008;168(4):443–453. | |
van Rhee F, Wong RS, Munshi N, et al. Siltuximab for multicentric Castleman’s disease: a randomised, double-blind, placebo-controlled trial. Lancet Oncol. 2014;15(9):966–974. | |
Wegiel B, Bjartell A, Culig Z, Persson JL. Interleukin-6 activates PI3K/Akt pathway and regulates cyclin A1 to promote prostate cancer cell survival. Int J Cancer. 2008;122(7):1521–1529. | |
Leu CM, Wong FH, Chang C, Huang SF, Hu CP. Interleukin-6 acts as an antiapoptotic factor in human esophageal carcinoma cells through the activation of both STAT3 and mitogen-activated protein kinase pathways. Oncogene. 2003;22(49):7809–7818. | |
Irizarry RA, Bolstad BM, Collin F, Cope LM, Hobbs B, Speed TP. Summaries of Affymetrix GeneChip probe level data. Nucleic Acids Res. 2003;31(4):e15. | |
Dai M, Wang P, Boyd AD, et al. Evolving gene/transcript definitions significantly alter the interpretation of GeneChip data. Nucleic Acids Res. 2005;33(20):e175. | |
Kauffmann A, Gentleman R, Huber W. arrayQualityMetrics – a bioconductor package for quality assessment of microarray data. Bioinformatics. 2009;25(3):415–416. | |
Talloen W, Clevert DA, Hochreiter S, et al. I/NI-calls for the exclusion of non-informative genes: a highly effective filtering tool for microarray data. Bioinformatics. 2007;23(21):2897–2902. | |
Smyth GK. Linear models and empirical bayes methods for assessing differential expression in microarray experiments. Stat Appl Genet Mol Biol. 2004;3:Article3. | |
Rhodes LV, Muir SE, Elliott S, et al. Adult human mesenchymal stem cells enhance breast tumorigenesis and promote hormone independence. Breast Cancer Res Treat. 2010;121(2):293–300. | |
Rhodes LV, Antoon JW, Muir SE, Elliott S, Beckman BS, Burow ME. Effects of human mesenchymal stem cells on ER-positive human breast carcinoma cells mediated through ER-SDF-1/CXCR4 crosstalk. Mol Cancer. 2010;9:295. | |
Berishaj M, Gao SP, Ahmed S, et al. Stat3 is tyrosine-phosphorylated through the interleukin-6/glycoprotein 130/Janus kinase pathway in breast cancer. Breast Cancer Res. 2007;9(3):R32. | |
Edgar R, Domrachev M, Lash AE. Gene expression omnibus: NCBI gene expression and hybridization array data repository. Nucleic Acids Res. 2002;30(1):207–210. | |
Osborne CK, Coronado-Heinsohn EB, Hilsenbeck SG, et al. Comparison of the effects of a pure steroidal antiestrogen with those of tamoxifen in a model of human breast cancer. J Natl Cancer Inst. 1995;87(10):746–750. |
Supplementary material
Summary of role of gene signature components in breast cancer
The expression of some of the genes within the IL-6 signature is known to be altered in breast cancer. The two progesterone-metabolizing enzyme genes in the signature, aldo-ketone reductases 1C1 and 1C2, may be downregulated in some breast tumors. This can lead to reduced progesterone catabolism and ultimately persistent activation of progesterone receptors.1 CCAAT/enhancer binding protein, delta (CEBPδ), a transcription factor, is known to exhibit tumor-suppressing properties;2 however, it is inactivated in many cases of estrogen receptor (ER)-positive breast cancer by methylation, and this is associated with relapse, metastasis, and reduced survival.3,4 Conversely, high expression of interferon-inducible guanylate binding protein 2 (GBP2) is associated with a more favorable prognosis in ER-positive breast cancer and may be predictive of response to anthracycline-based chemotherapy.5
The signature also contains three members of the calcium binding S100 family, S100A7 (psoriasin), S100A8 (calgranulin B), and S100A9; the expression of psoriasin has been observed in ERα-positive breast cancer, but more strongly in ERα-negative breast cancer.6 Psoriasin may enhance metastasis in ERα-negative breast cancer through regulation of matrix metalloproteinase -9 secretion and the actin cytoskeleton.7 Interestingly, expression of psoriasin is induced by epidermal growth factor in breast cancer cells.8 Furthermore, overexpression of calgranulin B and SA100A9 has been observed in ~50% of invasive ductal breast carcinomas, and this was associated with poor tumor differentiation, higher pathologic stage, and node metastasis.9 Lipocalin 2 (LCN2) is also overexpressed in some breast cancers, and it has been suggested that this may promote breast cancer progression by promoting angiogenesis and may indicate poor prognosis10–12; similar findings have been reported for β-tubulin isotype III (TUBB3).13 It has also been shown that in ER-positive breast tumors that exhibited poor response to the aromatase inhibitor letrozole, α-1-antichymotrypsin, a serine proteinase inhibitor (SerpinA3), expression was significantly reduced.14
The expression of complement factor B is upregulated in breast cancer relative to normal breast tissue,15 and has previously been identified within a 76-gene signature of ER-positive primary node-negative breast tumors that may be predictive of metastasis.16 Transmembrane channel-like protein 5 is also upregulated in breast cancer,17 most notably in breast tumors with mutations in PI3K, which is associated with IL-6 downstream signaling.18 To date, no association between transmembrane channel-like protein 5 and outcomes in breast cancer has been reported.
Interferon-inducible transmembrane protein (IFITM) genes 1, 2, and 3 are ubiquitously expressed in humans and are induced by the Jak-STAT pathway signaling downstream of IL-6 and also oncostatin. While IFITM3 is upregulated following viral infection,19 IFITM1, IFITM2, and IFITM3 are also upregulated specifically in colorectal tumors.20 No studies have been published to date that have explored the functions of IFITM genes in breast cancer.
References
Ji Q, Aoyama C, Nien YD, et al. Selective loss of AKR1C1 and AKR1C2 in breast cancer and their potential effect on progesterone signaling. Cancer Res. 2004;64(20):7610–7617. | |
Gery S, Tanosaki S, Hofmann WK, Koppel A, Koeffler HP. C/EBPdelta expression in a BCR-ABL-positive cell line induces growth arrest and myeloid differentiation. Oncogene. 2005;24(9):1589–1597. | |
Palmieri C, Monteverde M, Lattanzio L, et al. Site-specific CpG methylation in the CCAAT/enhancer binding protein delta (CEBPdelta) CpG island in breast cancer is associated with metastatic relapse. Br J Cancer. 2012;107(4):732–738. | |
Naderi A, Teschendorff AE, Barbosa-Morais NL, et al. A gene-expression signature to predict survival in breast cancer across independent data sets. Oncogene. 2007;26(10):1507–1516. | |
Godoy P, Cadenas C, Hellwig B, et al. Interferon-inducible guanylate binding protein (GBP2) is associated with better prognosis in breast cancer and indicates an efficient T cell response. Breast Cancer. 2014;21(4):491–499. | |
Wolf R, Voscopoulos C, Winston J, et al. Highly homologous hS100A15 and hS100A7 proteins are distinctly expressed in normal breast tissue and breast cancer. Cancer Lett. 2009;277(1):101–107. | |
Sneh A, Deol YS, Ganju A, et al. Differential role of psoriasin (S100A7) in estrogen receptor alpha positive and negative breast cancer cells occur through actin remodeling. Breast Cancer Res Treat. 2013;138(3):727–739. | |
Paruchuri V, Prasad A, McHugh K, Bhat HK, Polyak K, Ganju RK. S100A7-downregulation inhibits epidermal growth factor-induced signaling in breast cancer cells and blocks osteoclast formation. PLoS One. 2008;3(3):e1741. | |
Arai K, Takano S, Teratani T, Ito Y, Yamada T, Nozawa R. S100A8 and S100A9 overexpression is associated with poor pathological parameters in invasive ductal carcinoma of the breast. Curr Cancer Drug Targets. 2008;8(4):243–252. | |
Nacht M, Ferguson AT, Zhang W, et al. Combining serial analysis of gene expression and array technologies to identify genes differentially expressed in breast cancer. Cancer Res. 1999;59(21):5464–5470. | |
Yang J, McNeish B, Butterfield C, Moses MA. Lipocalin 2 is a novel regulator of angiogenesis in human breast cancer. FASEB J. 2013;27(1):45–50. | |
Bauer M, Eickhoff JC, Gould MN, Mundhenke C, Maass N, Friedl A. Neutrophil gelatinase-associated lipocalin (NGAL) is a predictor of poor prognosis in human primary breast cancer. Breast Cancer Res Treat. 2008;108(3):389–397. | |
Pentheroudakis G, Batistatou A, Kalogeras KT, et al. Prognostic utility of beta-tubulin isotype III and correlations with other molecular and clinicopathological variables in patients with early breast cancer: a translational Hellenic Cooperative Oncology Group (HeCOG) study. Breast Cancer Res Treat. 2011;127(1):179–193. | |
Miller WR, Larionov A. Changes in expression of oestrogen regulated and proliferation genes with neoadjuvant treatment highlight heterogeneity of clinical resistance to the aromatase inhibitor, letrozole. Breast Cancer Res. 2010;12(4):R52. | |
Doustjalali SR, Yusof R, Yip CH, Looi LM, Pillay B, Hashim OH. Aberrant expression of acute-phase reactant proteins in sera and breast lesions of patients with malignant and benign breast tumors. Electrophoresis. 2004;25(14):2392–2401. | |
Wang Y, Klijn JG, Zhang Y, et al. Gene-expression profiles to predict distant metastasis of lymph-node-negative primary breast cancer. Lancet. 2005;365(9460):671–679. | |
Cizkova M, Cizeron-Clairac G, Vacher S, et al. Gene expression profiling reveals new aspects of PIK3CA mutation in ERalpha-positive breast cancer: major implication of the Wnt signaling pathway. PLoS One. 2010;5(12):e15647. | |
Wegiel B, Bjartell A, Culig Z, Persson JL. Interleukin-6 activates PI3K/Akt pathway and regulates cyclin A1 to promote prostate cancer cell survival. Int J Cancer. 2008;122(7):1521–1529. | |
Diamond MS, Farzan M. The broad-spectrum antiviral functions of IFIT and IFITM proteins. Nat Rev Immunol. 2013;13(1):46–57. | |
Andreu P, Colnot S, Godard C, et al. Identification of the IFITM family as a new molecular marker in human colorectal tumors. Cancer Res. 2006;66(4):1949–1955. |
 © 2016 The Author(s). This work is published and licensed by Dove Medical Press Limited. The
full terms of this license are available at https://www.dovepress.com/terms
and incorporate the Creative Commons Attribution
- Non Commercial (unported, 3.0) License.
By accessing the work you hereby accept the Terms. Non-commercial uses of the work are permitted
without any further permission from Dove Medical Press Limited, provided the work is properly
attributed. For permission for commercial use of this work, please see paragraphs 4.2 and 5 of our Terms.
© 2016 The Author(s). This work is published and licensed by Dove Medical Press Limited. The
full terms of this license are available at https://www.dovepress.com/terms
and incorporate the Creative Commons Attribution
- Non Commercial (unported, 3.0) License.
By accessing the work you hereby accept the Terms. Non-commercial uses of the work are permitted
without any further permission from Dove Medical Press Limited, provided the work is properly
attributed. For permission for commercial use of this work, please see paragraphs 4.2 and 5 of our Terms.