Back to Journals » Nature and Science of Sleep » Volume 18

Integrative Assessment of Cephalometric and Polysomnographic Features in Paediatric Obstructive Sleep Apnea: A Cross-Sectional Study
Authors Liu A, Lu Q, Huang X, Li H, Hou Z, Lin W, Huang T, Cui Y, Wu T, Xiao Y, Patil S ![]() , Yang Q
, Yang Q ![]()
Received 20 October 2025
Accepted for publication 14 December 2025
Published 8 January 2026 Volume 2026:18 574045
DOI https://doi.org/10.2147/NSS.S574045
Checked for plagiarism Yes
Review by Single anonymous peer review
Peer reviewer comments 3
Editor who approved publication: Prof. Dr. Ahmed BaHammam
Ailiang Liu,1 Qinghua Lu,1 Xiao Huang,1 Hairui Li,1 Zhijiang Hou,1 Weinan Lin,1 Ting Huang,1 Yunfei Cui,1 Tao Wu,1 Yaxin Xiao,1 Sandip Patil,2,3,* Qin Yang1,*
1Department of Respiratory Medicine, Shenzhen Children’s Hospital, Shenzhen, Guangdong, People’s Republic of China; 2Department of Haematology and Oncology, Shenzhen Children’s Hospital, Shenzhen, Guangdong, People’s Republic of China; 3Paediatric Research Institute, Shenzhen Children’s Hospital, Shenzhen, Guangdong, People’s Republic of China
*These authors contributed equally to this work
Correspondence: Sandip Patil, Email [email protected] Qin Yang, Email [email protected]
Objective: This study aimed to characterize pediatric patients with suspected sleep-disordered breathing (SDB) and evaluate whether cephalometric features and clinical indicators can predict obstructive sleep apnea (OSA) severity, as confirmed by polysomnography (PSG).
Methods: A cross-sectional study was conducted among 228 children referred for sleep-related breathing concerns. Data collected included demographics, clinical symptoms (snoring, mouth-breathing, open-mouth posture, malocclusion), and cephalometric measurements (ANB, SNA, SNB angles, and nasopharyngeal soft tissue ratio). Overnight PSG assessed apnea–hypopnea index (AHI), rapid eye movement (REM) sleep proportion, and oxygen saturation. Children were classified as OSA-positive (AHI > 1 event/h) or non-OSA. Statistical analyses included t-tests, ANOVA, Pearson correlations, logistic regression, receiver operating characteristic (ROC) analysis, principal component analysis (PCA), and decision-tree modelling to identify predictors and stratify risk.
Results: Among 228 children (mean age 7.4 ± 2.9 years; 62.7% male), 109 underwent PSG. The OSA group showed significantly higher ANB angles (5.8° ± 1.9 vs 3.9° ± 1.4, p < 0.01), increased nasopharyngeal soft tissue ratios (0.72 ± 0.09 vs 0.59 ± 0.07, p < 0.001), and elevated BMI compared with non-OSA children. AHI correlated positively with ANB (r = 0.48) and soft tissue ratio (r = 0.62), and negatively with minimum SaO2 (r = – 0.47). Habitual snoring (OR = 4.3), mouth-breathing (OR = 2.6), and incomplete lip closure (OR = 3.1) independently predicted OSA. A combined clinical–cephalometric model achieved an AUC of 0.86. PCA revealed distinct anatomical–functional clusters, and a decision-tree model using ANB > 5°, tissue ratio ≥ 0.68, and snoring classified OSA with 82% sensitivity and 78% specificity.
Conclusion: Pediatric OSA is strongly linked to craniofacial imbalance, adenoidal hypertrophy, and functional symptoms. Cephalometric parameters, particularly ANB angle and nasopharyngeal soft tissue ratio, combined with simple clinical indicators, offer reliable, low-cost screening for early OSA detection where PSG access is limited.
Keywords: paediatric obstructive sleep apnea, cephalometric analysis, polysomnography, airway anatomy, clinical predictors
Introduction
Sleep-disordered breathing (SDB) in children encompasses a spectrum of respiratory disturbances during sleep, ranging from primary snoring to obstructive sleep apnea (OSA). Habitual snoring is reported in approximately 3–15% of children, and around 20% of habitual snorers have clinically significant OSA.1 The population prevalence of paediatric OSA is 1–5.7%, peaking between 2 and 8 years of age when adenotonsillar tissue is relatively enlarged compared to airway size.2,3 Paediatric OSA is characterized by intermittent upper airway obstruction during sleep, resulting in hypoventilation, oxygen desaturation, sleep fragmentation, and compensatory arousals. These nocturnal abnormalities manifest as daytime symptoms such as inattention, hyperactivity, behavioural dysregulation, and academic underperformance, often mimicking attention-deficit/hyperactivity disorder.4,5 If left untreated, paediatric OSA is associated with significant long-term morbidity, including neurocognitive deficits, behavioural abnormalities, cardiovascular complications (elevated blood pressure, endothelial dysfunction), and impaired somatic growth.6,7 Despite these consequences, OSA in children remains substantially underdiagnosed and undertreated. Polysomnography (PSG), the diagnostic gold standard, provides objective measurements of sleep architecture, respiratory events, and oxygen saturation. However, its high cost, overnight monitoring requirements, and limited availability constrain its use, particularly in low-resource or high-volume clinical settings.8 This diagnostic gap often leads to delays in recognition and treatment of children with moderate-to-severe OSA. The pathophysiology of paediatric OSA differs from adults and is multifactorial. While adenotonsillar hypertrophy is the most common cause in preschool children, craniofacial skeletal morphology increasingly influences airway collapsibility in non-obese children, adolescents, or those with residual OSA post-adenotonsillectomy.9,10 Our study focuses on non-obese children, consistent with the exclusion criteria, to better assess the anatomical contributions to OSA. Structural risk factors such as maxillary retrusion, mandibular retrognathia, increased mandibular plane angle, or a narrow nasopharyngeal airway predispose children to upper airway obstruction during sleep.11 Cephalometric radiography provides reproducible assessment of maxillofacial skeletal and soft tissue relationships. Among several parameters, the ANB angle and nasopharyngeal soft tissue ratio are particularly informative: ANB reflects maxillo-mandibular discrepancy, while the soft tissue ratio quantifies adenoidal obstruction.12,13 Combining these measurements with clinical indicators habitual snoring, mouth-breathing, malocclusion may enhance early risk stratification where PSG is limited. Several studies report that children with OSA often show increased ANB angles (reflecting maxillo-mandibular discrepancy), enlarged adenoids, and narrower posterior airway spaces, though the magnitude and consistency of associations vary across populations.14 Given the limited accessibility of PSG and the influence of craniofacial structure on OSA pathogenesis, there is an unmet need for clinically applicable, cost-effective screening strategies. Combining clinical symptoms (habitual snoring, open-mouth breathing, malocclusion) with cephalometric measurements may enhance early risk stratification. Furthermore, multivariate techniques such as principal component analysis (PCA) and machine learning decision trees can uncover latent patterns among anatomical and clinical predictors, improving diagnostic accuracy beyond conventional linear methods.15,16 The present cross-sectional study aimed to characterize the clinical, cephalometric, and polysomnographic features of children referred for suspected SDB, evaluate the correlation between cephalometric variables and PSG-confirmed OSA severity, and develop an integrated predictive model combining anatomical and clinical factors to screen for moderate-to-severe OSA.
Methods
The study was conducted in accordance with the standard operating procedures of Shenzhen Children’s Hospital and the principles of the Declaration of Helsinki. Ethical approval was obtained from the Institutional Ethics Committee of Shenzhen Children’s Hospital (approval number: 2025048). Written informed consent was obtained from the legal guardians of all participants prior to inclusion.
Study Design and Patient Recruitment
This cross-sectional observational study was conducted at the Sleep Medicine and Orthodontic Units of Shenzhen Children’s Hospital between June 1, 2024, and November 30, 2024. A total of 228 children (age range: 4–16 years) were consecutively enrolled following referral for evaluation of suspected sleep-disordered breathing (SDB). Children with obesity (BMI >95th percentile for age), genetic syndromes affecting craniofacial development, neuromuscular disorders, prior adenotonsillectomy, or incomplete diagnostic data were excluded, resulting in a final non-obese cohort suitable for analysis. The sample size was determined based on an expected OSA prevalence of approximately 30% among referred children, with a 95% confidence level and 5% margin of error. The minimum required sample size was 203; to ensure adequate statistical power for subgroup analyses, 228 participants were included. Of these, 109 children underwent full overnight polysomnography (PSG), while the remaining children had clinically indicated cephalometric and clinical evaluations only. Participants were stratified into two developmental subgroups younger children (4–9 years) and adolescents (10–16 years)—to account for age-related craniofacial variation. Inclusion criteria were: (1) availability of both high-quality lateral cephalometric radiographs and overnight PSG; and (2) no history of surgical intervention for SDB (eg, adenotonsillectomy). Exclusion criteria included genetic syndromes affecting craniofacial development (Down syndrome, craniosynostosis), neuromuscular disorders, obesity (BMI >95th percentile for age), or incomplete diagnostic data (Supplementary Table S1). Three analytical populations were defined: (1) n = 228 for demographic and clinical descriptive analyses; (2) n = 109 for polysomnographic correlations and OSA classification; and (3) n = 98 for integrated cephalometric–polysomnographic modelling, restricted to children with both high-quality lateral cephalograms and complete PSG recordings.
Clinical Evaluation and Data Acquisition
Standardized intake questionnaires and structured interviews were used to document clinical symptoms, including habitual snoring (≥3 nights/week), open-mouth breathing, witnessed apneas, and orthodontic abnormalities. Clinical assessment of dental occlusion status (Class I/II/III malocclusion, crossbite, crowding) was performed by a calibrated orthodontist blinded to PSG outcomes. Demographic variables such as age, sex, and weight-for-age percentiles were extracted from medical records. Both cephalometric and PSG assessments were performed within two weeks of each other at Shenzhen Children’s Hospital to maintain consistency between anatomical and functional measurements. We assessed baseline characteristics (age, sex, BMI, symptom severity) between children who underwent PSG (n=109) and those who did not (n=119) (Supplementary Figure S1). Differences were minor and non-significant for most clinical parameters, suggesting that missingness was likely “missing at random” (MAR) conditional on observed clinical and anatomical predictors rather than “missing completely at random” (MCAR) or “not at random” (MNAR).
Cephalometric Radiography and Analysis
Lateral cephalometric radiographs were acquired using a Planmeca ProMax® digital cephalometric unit (Planmeca Oy, Helsinki, Finland) as part of the hospital’s routine diagnostic protocol for children with suspected SDB and orthodontic concerns. No additional radiographs were taken solely for research purposes, ensuring full compliance with the ALARA (As Low as Reasonably Achievable) radiation principle. Radiographs were obtained in natural head position, with teeth in centric occlusion and lips relaxed. Cooperative positioning techniques were used for younger participants (aged 4–5 years), and images not meeting quality standards were excluded. Acquisition parameters (source-to-mid-sagittal distance and exposure settings) were standardized to minimize magnification error. Digital images were calibrated and analyzed using Dolphin Imaging software (version 11.9; Dolphin Imaging & Management Solutions, Chatsworth, CA, USA) employing Steiner’s cephalometric analysis protocol. Landmark identification and tracking were independently performed by two trained raters blinded to clinical and PSG data. Inter- and intra-rater reliability were assessed using intraclass correlation coefficients (ICC), with all parameters showing excellent agreement (ICC > 0.90). The following cephalometric parameters were extracted and analyzed: SNA angle (°) representing the anteroposterior maxillary position relative to the cranial base; SNB angle (°) indicating the anteroposterior mandibular position relative to the cranial base; and ANB angle (°) denoting the skeletal jaw discrepancy calculated as SNA–SNB. The nasopharyngeal soft tissue ratio was measured at the level of the soft palate as the ratio of soft tissue thickness (from the posterior pharyngeal wall to the posterior nasal spine [PNS] line) to the nasopharyngeal airway depth (PNS to adenoid wall). To assess vertical skeletal dimension, the SN–MP angle (°) (mandibular plane relative to the sella–nasion plane) and FH–MP angle (°) (Frankfort–mandibular plane angle) were also evaluated. Measurements were repeated for 20 randomly selected radiographs after a two-week interval to determine intra-rater reproducibility, with mean error <0.5° for angular and <0.5 mm for linear variables. Definitions of cephalometric landmarks and reference lines followed the Steiner analysis protocol (Steiner, 1953)17 and the American Association of Orthodontists’ Cephalometric Landmark Guidelines (https://www.aaoinfo.org).18
Polysomnographic Assessment
Overnight polysomnography (PSG) was performed in a controlled paediatric sleep laboratory at Shenzhen Children’s Hospital, adhering to the American Academy of Sleep Medicine (AASM) paediatric scoring guidelines. To ensure temporal consistency between anatomical and functional measurements, PSG and cephalometric radiography were conducted within two weeks of each other under the same institutional protocol. Each recording included electroencephalography (EEG), electrooculography (EOG), submental and limb electromyography (EMG), oronasal airflow using a pressure transducer, thoracoabdominal movement by inductive plethysmography, oxygen saturation via pulse oximetry, and snoring detected through a calibrated microphone sensor. From these recordings, the following indices were extracted: the Apnea–Hypopnea Index (AHI), defined as the number of apneas and hypopneas per hour of sleep; the proportion of rapid eye movement (REM) sleep, expressed as a percentage of total sleep time; and the lowest oxyhaemoglobin saturation (SaO2 nadir, %), representing the minimum oxygen saturation during the study period. The diagnosis of obstructive sleep apnea (OSA) was established based on an AHI greater than 1.0 event per hour, consistent with established paediatric diagnostic criteria.19 Adenoid size was quantified using lateral cephalometric radiographs. We measured the adenoid-to-nasopharyngeal airway ratio following standard methods described in prior pediatric OSA literature.20,21
Statistical Analysis
All statistical analyses were conducted using IBM SPSS Statistics version 27.0 (IBM Corp., Armonk, NY, USA) and R software version 4.2.0 (R Foundation for Statistical Computing, Vienna, Austria). The normality of continuous variables was assessed using the Shapiro–Wilk test, which confirmed that all major cephalometric and PSG variables followed a normal distribution (p>0.05). Independent-sample t-tests and χ2-tests were applied to compare the OSA-positive and non-OSA groups, while one-way ANOVA was used to evaluate subgroup differences according to OSA severity (mild: AHI 1–5; moderate: 5–10; severe: >10). Pearson correlation coefficients were computed to assess linear associations between cephalometric parameters and PSG indices. Binary logistic regression analysis was performed to identify independent predictors of OSA, with variables demonstrating p < 0.1 in univariate analysis entered into the multivariate model. Model calibration was evaluated using the Hosmer–Lemeshow goodness-of-fit test, while predictive performance was quantified using receiver operating characteristic (ROC) curves and area under the curve (AUC) values. To further explore anatomical–functional relationships, principal component analysis (PCA) was used to reduce data dimensionality and identify key variable clusters. Additionally, a decision-tree classifier was developed using the classification and regression tree (CART) algorithm with fivefold cross-validation, implemented through the rpart and pROC packages in R. Sensitivity analysis demonstrated comparable model performance with class weighting (AUC = 0.83, 95% CI 0.77–0.89) and without class weighting (AUC = 0.81, 95% CI 0.75–0.88), confirming robustness across this methodological choice. Reporting followed the TRIPOD guidelines. A completed TRIPOD checklist (Supplementary Table S5) and an analysis appendix including software, packages, and reproducible code excerpts are provided in the Supplementary Materials.
Results
Demographic and Clinical Characteristics of the Study Cohort
A total of 228 children (143 boys [62.7%], 85 girls [37.3%]; male-to-female ratio 1.7:1) aged 89.2 ± 34.9 months (7.4 ± 2.9 years) were enrolled (Figure 1). Age distribution peaked at 7–9 years, coinciding with the period of maximal adeno-tonsillar hypertrophy typical of pediatric sleep-disordered breathing (SDB). There was no significant age difference between sexes. Most referrals were for habitual snoring, chronic mouth-breathing, or suspected adenoidal enlargement. The mean body-mass index (BMI) was 16.47 ± 3.46 kg/m2, ranging from underweight to overweight. Children with combined rhinitis and OSA exhibited the highest BMI (18.9 ± 3.2 kg/m2), whereas those with isolated rhinitis or adenoidal hypertrophy were near normative values (15.8 ± 2.7 kg/m2). BMI showed a weak but significant positive correlation with AHI (r = 0.23, p = 0.04), suggesting that even mild adiposity may exacerbate upper-airway collapsibility (Figure 2) Clinical examination revealed open-mouth posture in 43.2% of children at rest and 4.8% during sleep, with caregiver-reported snoring in 22.5%. Additional findings included lip eversion or short upper lip (55.8%), malocclusion (55.9%), and dark periorbital pigmentation (45.8%), indicating chronic oral breathing patterns consistent with airway obstruction.
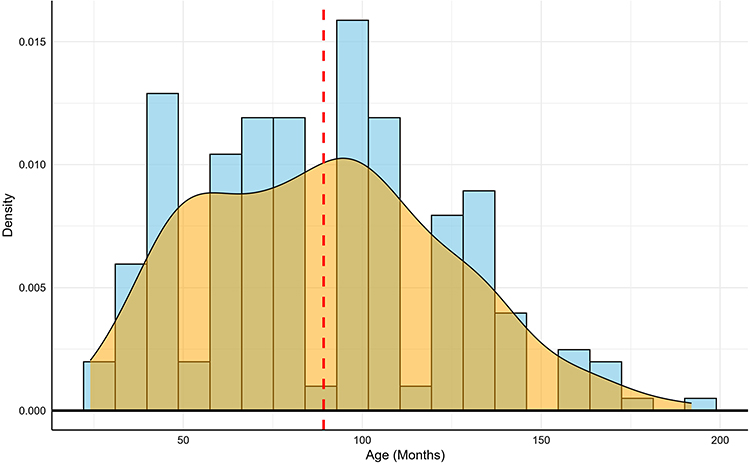 |
Figure 1 Age Distribution in the Cohort. |
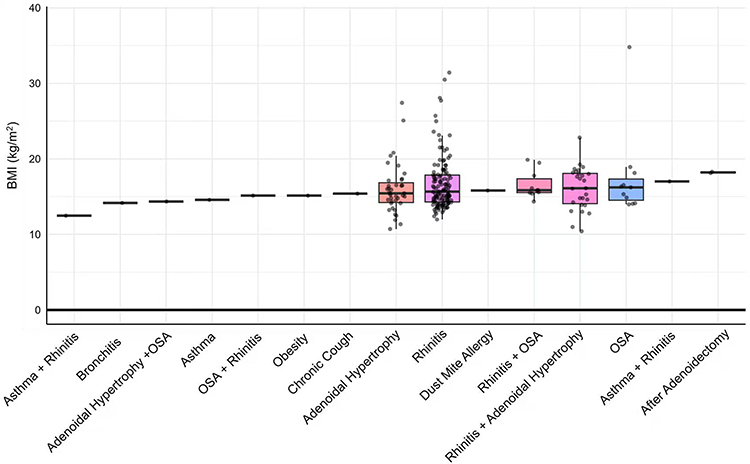 |
Figure 2 BMI and AHI Correlation by Diagnosis. A box plot illustrating the distribution of Body Mass Index (BMI) across various clinical diagnosis groups in the study cohort. Each box represents the interquartile range (IQR), the central line indicates the median, and whiskers extend to 1.5 times the IQR. Individual data points are overlaid to show sample distribution. |
Cephalometric Correlates of OSA and Polysomnographic Findings
High-quality lateral cephalograms were available for 98 children. ANB angle, reflecting sagittal skeletal discrepancy, averaged 4.07±1.97°, consistent with mild Class-II morphology (Figure 3) (Supplementary Figure S2). Subgroup analysis demonstrated greater skeletal imbalance in OSA patients (ANB 5.8 ± 1.9°) compared with non-OSA children (3.9 ± 1.4°, p < 0.01). SNA was increased (82.4 ± 3.2° vs 79.8 ± 2.8°; p = 0.03) and SNB decreased (76.5 ± 2.9° vs 77.8 ± 3.1°; p=0.04), indicating maxillomandibular disharmony predisposing to pharyngeal narrowing. The nasopharyngeal soft-tissue–to-cavity ratio showed a strong association with OSA severity (mean 0.65 ± 0.12; 0.72 ± 0.09 in OSA vs 0.59 ± 0.07 in controls, p<0.001) (Figure 4) This ratio correlated positively with AHI (r=0.62, p<0.001) and inversely with minimum SaO2 (r = –0.47, p = 0.002) (Supplementary Table S2). Children with ratios > 0.70 had mean AHI of 6.9 ± 5.1 events/h versus 2.8 ± 2.3 events/h for ratios < 0.60. Pearson correlations also indicated ANB–AHI r = 0.48 (p < 0.001), SNB–minimum SaO2 r = –0.41 (p = 0.002), and tissue ratio–AHI r = 0.62 (p<0.001), highlighting the dominant structural role of adenoidal hypertrophy alongside craniofacial imbalance. Overnight PSG was completed in 109 children (47.8%). Mean AHI was 9.8 ± 6.4 events/h and ODI 8.6 ± 5.1 events/h. Severity-stratified AHI values were 2.1 ± 1.3 (non-OSA), 6.2 ± 2.7 (mild), 13.1 ± 3.9 (moderate), and 22.4 ± 5.8 events/h (ANOVA p<0.001). Mean SaO2 was 94.2 ± 2.1%, with minimum SaO2 decreasing to 81.5 ± 5.4% in severe cases. The proportion of sleep time with SaO2 < 90% increased from 2.8 ± 1.1% (non-OSA) to 19.4 ± 7.8% (severe OSA, p<0.001) (Figure 5, Supplementary Table S3). Correlation analysis confirmed strong associations: AHI–ODI r = 0.84, AHI–minimum SaO2 r = –0.69, and AHI–% time < 90% SaO2 r = 0.71 (all p<0.001). Sleep architecture analysis revealed a reduced REM proportion in severe OSA (17.3 ± 4.5% vs 21.1 ± 5.8%, p=0.04), reflecting fragmentation secondary to hypoxic arousals (Figure 6).
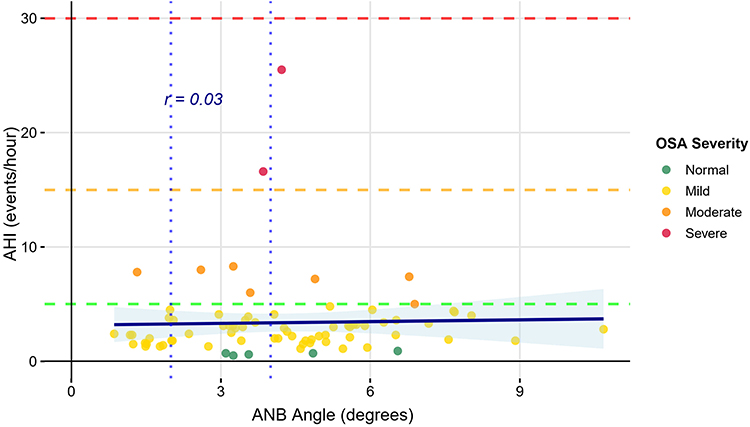 |
Figure 3 Relationship between Apnea-Hypopnea Index (AHI) and ANB Angle Stratified by OSA Severity. A scatter plot of Apnea-Hypopnea Index (AHI) versus ANB angle, with data points colored by Obstructive Sleep Apnea (OSA) severity: Normal (green), Mild (yellow), Moderate (orange), and Severe (red). Horizontal dashed lines indicate clinical AHI thresholds for mild, moderate, and severe OSA. An overall negligible linear correlation was found between the two variables (Pearson’s r = 0.03). |
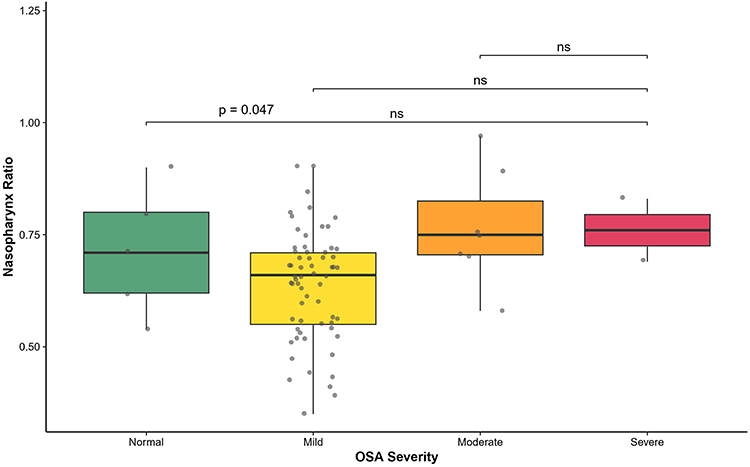 |
Figure 4 Nasopharyngeal Soft-Tissue–to-Cavity Ratio Across OSA Severity Groups. Box plots of nasopharyngeal soft‑tissue–to‑cavity ratio across OSA severity groups (Normal, Mild, Moderate, Severe). Each box shows the median and interquartile range with individual data points overlaid. |
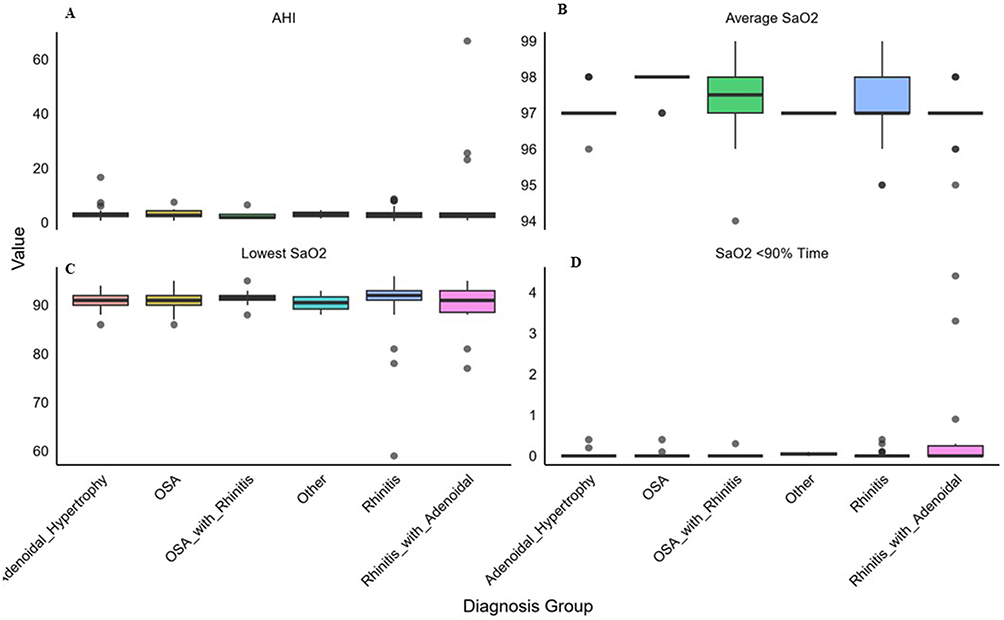 |
Figure 5 Polysomnographic Parameters Across Diagnosis Categories. Faceted box plots comparing key polysomnographic (PSG) metrics— (A) Apnea-Hypopnea Index (AHI), (B) Average SaO2, (C) Lowest SaO2, and (D) Time with SaO2 < 90%—across various clinical diagnosis groups. |
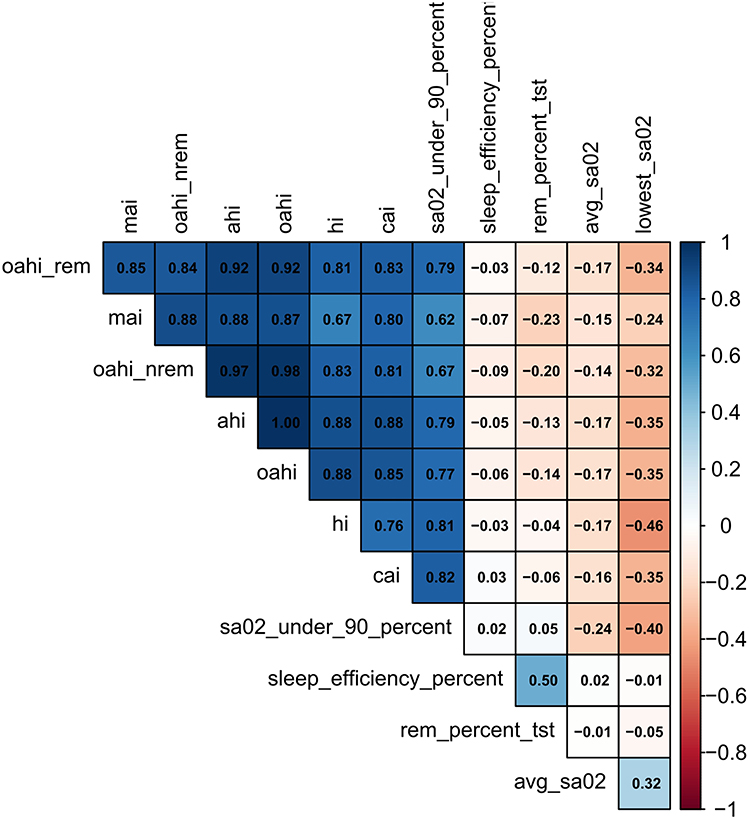 |
Figure 6 Correlation Matrix of Polysomnographic Indices. A heatmap illustrating the Pearson correlation matrix among key polysomnographic (PSG) and sleep architecture variables. The color intensity and value in each cell represent the Pearson correlation coefficient (r), where dark blue indicates a strong positive correlation (r → +1) and dark red indicates a strong negative correlation (r → −1). |
Clinical Predictors of OSA
Clinical features strongly correlated with PSG-defined OSA. Open-mouth posture (43.2%), lip eversion or short upper lip (55.8%), and malocclusion (55.9%) were common (Figure 7A). The frequency of habitual snoring (93% in severe vs 61% in non-OSA; p<0.001), mouth-breathing (84% vs 45%; p=0.002), and incomplete lip closure (67% vs 22%; p = 0.008) increased proportionally with severity (Figure 7B) (Supplementary Table S4). Binary logistic regression identified snoring (OR = 4.3, 95% CI 1.9–9.8; p < 0.001), mouth-breathing (OR = 2.6, 95% CI 1.2–5.5; p = 0.01), and incomplete lip closure (OR = 3.1, 95% CI 1.4–6.9; p=0.005) as independent clinical predictors of OSA. Integrating these parameters with BMI, ANB, and tissue ratio improved diagnostic discrimination, yielding an AUC = 0.82 (95% CI 0.74–0.90) for predicting PSG-confirmed OSA.
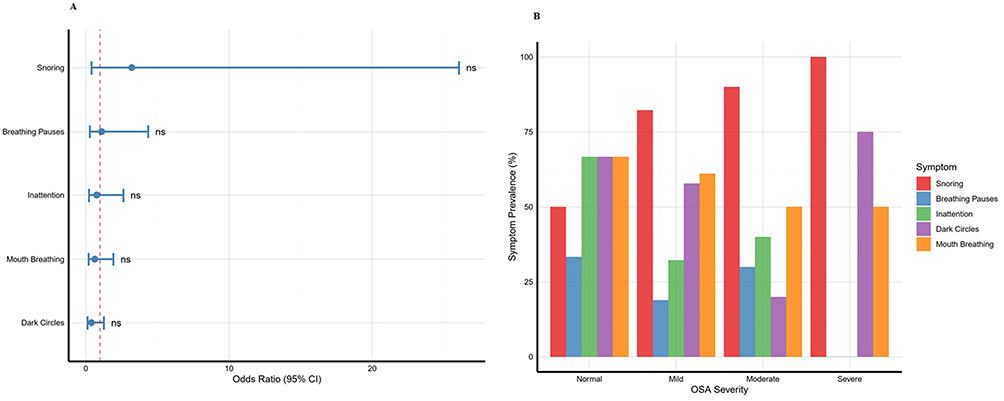 |
Figure 7 Clinical and Symptom-Based Predictors of Pediatric Obstructive Sleep Apnea Severity. (A) Clinical indicators, This chart illustrates the prevalence (%) of key clinical symptoms (Snoring, Breathing Pauses, Inattention, Dark Circles, Mouth Breathing) stratified by Obstructive Sleep Apnea (OSA) severity group (Normal, Mild, Moderate, Severe). (B) Symptom prevalence, This plot displays the odds ratios (OR) and 95% confidence intervals (CI) for five clinical symptoms as predictors of OSA. The vertical dashed line at OR = 1 represents the line of no effect. |
Integrative Pattern Analysis
The combined clinical and cephalometric ROC analysis demonstrated that a clinical-only model achieved AUC 0.82±0.05, whereas adding ANB >5° and tissue ratio >0.65 improved the AUC to 0.89, confirming high predictive accuracy. The ANB and nasopharyngeal tissue ratio thresholds were identified post-hoc during model development. Prospective validation of these operational cutpoints in independent cohorts is required before clinical implementation to verify generalizability and minimize potential overfitting. Principal-component analysis integrating cephalometric, clinical, and PSG variables extracted two dominant components explaining 68.5% of total variance PC1 (44.7%) representing structural–oxygenation features (ANB, tissue ratio, minimum SaO2) and PC2 (23.8%) reflecting clinical symptom burden (snoring, mouth-breathing, BMI). The PCA biplot (Figure 8) delineated distinct clusters corresponding to mild, moderate, and severe OSA phenotypes. A decision-tree model (Figure 9) incorporating ANB, BMI, and tissue ratio correctly classified 82.3% of children with OSA. The primary split at tissue ratio ≥0.68 captured 90% of moderate-to-severe cases. Ten-fold cross-validation confirmed model robustness (mean AUC=0.85 ± 0.03; sensitivity 0.81; specificity 0.78). The hierarchical structure demonstrates that soft-tissue ratio and mandibular position provide the most discriminative cues, supported by secondary anthropometric variables. Model calibration demonstrated good agreement between predicted and observed probabilities of OSA. The Hosmer–Lemeshow goodness-of-fit test indicated no evidence of miscalibration (χ2 = 7.12, p = 0.48). The calibration slope was 0.94, and the calibration intercept was 0.06, reflecting near-ideal alignment between predicted and actual risk estimates. A calibration plot showing predicted versus observed probabilities across deciles of risk has been included in the Supplementary Materials (Supplementary Figure S3).
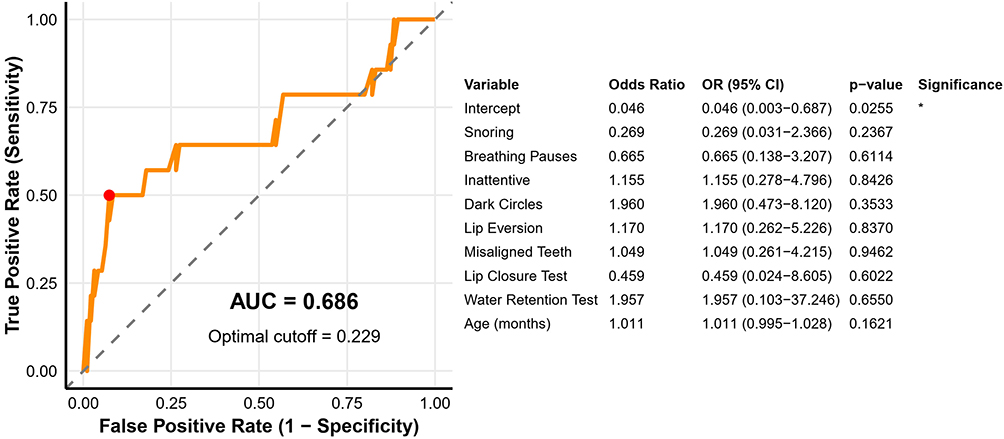 |
Figure 8 ROC Analysis of Clinical and Cephalometric Prediction Models. |
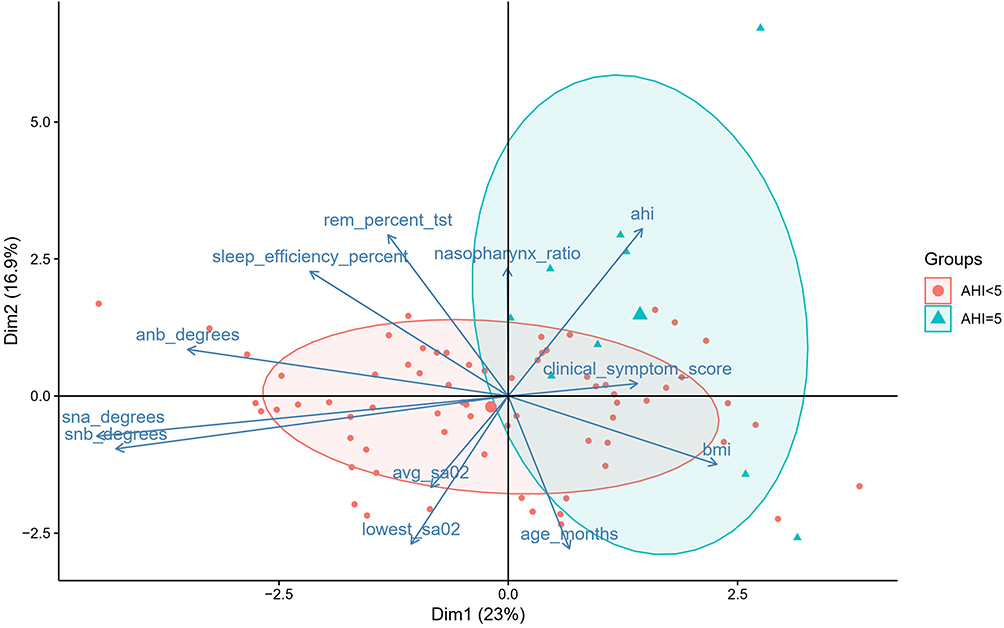 |
Figure 9 PCA Biplot of Integrated Clinical, Cephalometric, and PSG Variables. Red circles (●) represent patients with an AHI < 5 and correspond to the Non-OSA or mild OSA group. Cyan triangles (▲) represent patients with an AHI ≥ 5 and correspond to the OSA group (moderate to severe). |
Phenotypic Risk Stratification
Phenotypic risk stratification using unsupervised k-means clustering (k = 3) identified three distinct OSA phenotypes. Cluster 1, representing low-risk or non-OSA children (n=28; 33%), exhibited normal craniofacial metrics, low BMI, and minimal oxygen desaturation (AHI 4.1 ± 2.3 events/h). Cluster 2, corresponding to intermediate or moderate OSA (n= 35; 41%), was characterized by an elevated nasopharyngeal tissue ratio (0.69±0.05), moderate ANB deviation, and frequent snoring (AHI 11.8 ± 3.9 events/h). Cluster 3, the high-risk or severe OSA group (n=22; 26%), showed pronounced skeletal imbalance (ANB >6°, tissue ratio ≥0.75), higher BMI (≥20 kg/m2), and the lowest mean SaO2 (80.4 ± 4.7%) (Figure 10). Among structural predictors, tissue ratio and ANB demonstrated the strongest associations with AHI and oxygen desaturation, whereas functional indicators such as habitual snoring and mouth-breathing remained robust. Integration of cephalometric and clinical parameters improved classification accuracy to over 80%, and the final decision-tree model indicated that an ANB > 5° identified craniofacial-dominant risk, BMI >19 kg/m2 captured obesity-related risk, and habitual snoring combined with tissue ratio > 0.65 achieved an overall accuracy of approximately 86% for predicting PSG-confirmed OSA.
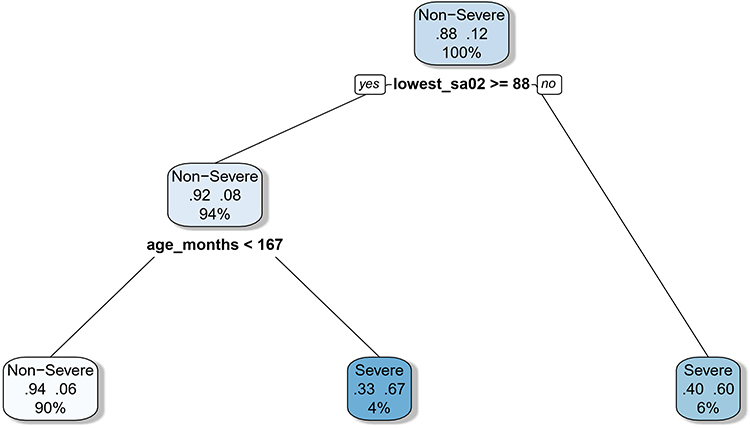 |
Figure 10 Decision-Tree Model for Predicting Moderate-to-Severe Pediatric OSA. |
Integrated Interpretation
Paediatric SDB in this cohort is multifactorial, encompassing skeletal, soft-tissue, and functional determinants. While mean AHI (≈ 4–10 events/h) indicates predominantly mild OSA, over half of children exhibited craniofacial or adenoidal abnormalities. The nasopharyngeal tissue ratio showed the strongest correlation with both AHI and oxygen indices, whereas ANB and BMI enhanced risk prediction. These findings support an integrated, non-invasive screening approach combining clinical inspection and cephalometric assessment, particularly valuable where PSG is not readily accessible.
Discussion
In the present study, we examined a cohort of 228 children with suspected sleep-disordered breathing (SDB), integrating demographic, clinical, cephalometric, and polysomnographic data to characterize the structural and functional determinants of paediatric OSA. The mean age of 7.4 ± 2.9 years with a unimodal peak at 7–9 years aligns with the established window of maximal adeno-tonsillar hypertrophy, a critical developmental period for airway vulnerability.22 The male predominance (male-to-female ratio 1.7:1) is consistent with prior reports in both Chinese and international paediatric populations, where boys are more frequently affected by SDB, possibly due to sex-specific differences in airway anatomy and lymphoid tissue growth patterns.23,24 This sex distribution was similar to the multicentre Chinese study by Xu et al, (2023), which reported a male-to-female ratio of 1.6:1 in children presenting with habitual snoring or suspected OSA. The mean BMI in our cohort was 16.47 ± 3.46 kg/m2, and children with combined rhinitis and OSA exhibited higher BMI values (18.9 ± 3.2 kg/m2), reflecting the additive contribution of adiposity to upper airway collapsibility.11,24 We observed a weak but statistically significant positive correlation between BMI and AHI in children with OSA (r = 0.23, p=0.04). This finding is consistent with previous research indicating that even mild adiposity may exacerbate airway obstruction, particularly in populations where obesity prevalence is moderate.25 However, because children with obesity were excluded from the study, these findings should be interpreted within the context of a non-obese paediatric population, and the role of adiposity in general paediatric OSA cannot be extrapolated from our data. A study by Kang et al, (2021) in Korean children found that BMI remained significantly positively correlated with AHI, REM AHI, and Non-Rapid Eye Movement (NREM) AHI, while it was negatively correlated with total sleep time and minimum oxygen saturation percentage after controlling for age and gender.26 Additionally, a study by Dékány et al, (2023) reported a significant association between higher BMI percentiles and OSA severity in children, with a correlation coefficient of ρ = 0.15 (p < 0.001). We have clarified that these observations represent associations rather than causal pathways, given the cross-sectional design of the study. These studies underscore the role of BMI as an important, albeit secondary, risk factor for paediatric OSA, with adenoidal hypertrophy remaining the primary structural determinant.27 Children with OSA Specifically, 43.2% exhibited an open-mouth posture, 55.8% had lip eversion or a short upper lip, 55.9% presented with malocclusion, and 45.8% displayed dark periorbital pigmentation. These findings align with established associations between chronic mouth breathing and craniofacial remodelling, which have been widely reported in paediatric cohorts. The prevalence of these features underscores the well-established link between chronic mouth-breathing and craniofacial remodelling, which has been widely reported in paediatric cohorts. Previous found that mouth-breathing children exhibited protruded upper lips and shorter lower lips compared to nasal-breathing children, suggesting that mouth breathing can lead to orofacial changes contributing to airway narrowing.28 Additionally, Galeotti et al, (2018) reported that 89.9% of children with OSA had malocclusions, compared to 60.6% in the control group, with posterior crossbite, reduced overbite, and increased overjet being significantly associated with OSA.29 These findings suggest that functional orofacial features may serve as practical clinical markers for early screening, but longitudinal studies are required to determine whether they contribute to OSA development or arise as adaptive responses to chronic obstruction. Our logistic regression analysis identified habitual snoring, mouth-breathing, and incomplete lip closure as independent predictors of OSA. These findings are consistent with studies indicating that functional adaptations such as open-mouth posture and incomplete lip closure reflect chronic upper airway obstruction, with associated orofacial changes contributing to airway narrowing. Recent research has highlighted that mouth breathing in school-aged children is significantly associated with a higher risk of developing sleep-disordered breathing, emphasizing the importance of early screening and timely intervention.30
Cephalometric analyses in our cohort provided further insight into the structural contributors of OSA. Children with OSA exhibited greater skeletal imbalance, as evidenced by increased ANB angles (5.8° vs 3.9° in non-OSA) and altered maxillomandibular relationships (increased SNA 82.4° vs 79.8°, decreased SNB 76.5° vs 77.8°). Although correlations between ANB and AHI were moderate, these skeletal deviations likely predispose to pharyngeal narrowing and synergize with adenoidal hypertrophy to exacerbate airway obstruction. These findings are consistent with prior cephalometric studies in children,31 which report that increased ANB and reduced SNB are associated with OSA severity, reflecting Class-II skeletal patterns that decrease posterior airway space. Similarly, international literature confirms that craniofacial imbalance, particularly retrognathia and maxillary retrusion, increases susceptibility to pharyngeal collapse during sleep.32,33 In the present study, we interpret these findings as structural correlates rather than determinants of disease severity, acknowledging that causality cannot be inferred. Notably, the nasopharyngeal soft-tissue–to-cavity ratio in our cohort emerged as the strongest quantitative structural predictor of OSA, with a positive correlation to AHI (r = 0.62, p < 0.001) and an inverse correlation with minimum SaO2 (r = –0.47, p = 0.002). This reinforces previous observations from both Chinese and Western cohorts that adenoidal size relative to airway space is the dominant anatomical determinant of paediatric OSA.23
Polysomnographic (PSG) findings in 109 children further substantiated the pathophysiological impact of structural and functional traits identified in our cohort. The mean apnea–hypopnea index (AHI) of 9.8 ± 6.4 events/h, along with stepwise increases across severity groups, confirms that obstruction frequency is proportional to both soft-tissue encroachment and craniofacial imbalance. Oxygen desaturation indices (ODI) and the proportion of sleep time with SaO2 < 90% increased with OSA severity, while REM sleep was reduced in severe cases, reflecting sleep fragmentation secondary to hypoxemia. These observations are consistent with multicentre Chinese PSG studies and international reports, which have demonstrated that oxygen desaturation correlates strongly with adenoidal hypertrophy and craniofacial anomalies.34 The strong correlations observed in our cohort between AHI, ODI, and minimum SaO2 reinforce the mechanistic linkage between anatomical obstruction, hypoxic burden, and altered sleep architecture, highlighting their clinical significance for assessing disease severity.12 Integrative modelling combining clinical, cephalometric, and PSG variables revealed that combining functional and structural markers significantly improves OSA prediction. A clinical-only model yielded an area under the curve (AUC) of 0.82, whereas adding ANB > 5° and nasopharyngeal tissue ratio > 0.65 increased the AUC to 0.89, demonstrating superior discriminatory power. However, we now explicitly acknowledge that these predictive models were developed within a single cohort and may be subject to overfitting. External validation in independent populations is required before clinical implementation. For clinical application, the proposed screening model would identify approximately 82 of every 100 children with moderate-to-severe OSA (sensitivity 82%), while correctly classifying 78 of every 100 children without significant OSA (specificity 78%). At the observed OSA prevalence of 53%, the positive predictive value approximates 73%, indicating that approximately 27 of every 100 children flagged as high-risk would represent false positives and may require confirmatory polysomnography. Principal component analysis (PCA) extracted two dominant components: one representing structural–oxygenation features and the other reflecting clinical symptom burden, together explaining 68.5% of total variance. Decision-tree modelling further showed that tissue ratio ≥0.68 captured 90% of moderate-to-severe OSA cases, while ANB >5° and BMI >19 kg/m2 delineated craniofacial-dominant and obesity-related risk, respectively. These findings align with prior research in both Chinese and international paediatric populations, where multivariate frameworks incorporating cephalometric and clinical features consistently outperform single-variable models, providing practical tools for early, non-invasive screening, particularly in resource-limited settings.35 Unsupervised k-means clustering identified three distinct phenotypes: low-risk/non-OSA, intermediate/moderate OSA, and high-risk/severe OSA. Each cluster was defined by a unique combination of craniofacial, soft-tissue, and functional traits, with the high-risk group exhibiting pronounced skeletal imbalance, elevated tissue ratio, and higher BMI. This phenotype mirrors the “complex endotype” described in global paediatric OSA literature, wherein anatomical vulnerability and metabolic factors coexist, highlighting the multifactorial nature of disease expression.36,37 Such phenotypic stratification provides a nuanced understanding of paediatric OSA heterogeneity, emphasizing that no single anatomical or clinical factor suffices to characterize the disorder. Instead, OSA severity arises from the interplay of multiple structural, functional, and anthropometric determinants, underscoring the need for integrated evaluation strategies in both clinical and research settings. We explicitly acknowledge that the exclusion of obese children limits generalizability to the broader paediatric OSA population in which obesity is a major contributor to airway collapsibility. Thus, the results should be interpreted as most applicable to non-obese children with suspected adenoidal or craniofacial airway compromise. The exclusion of children with obesity limits direct applicability to populations where obesity is a major OSA risk factor. In high-obesity prevalence settings, incorporating adiposity-specific markers such as neck circumference or waist-to-height ratio into the screening framework may improve predictive accuracy. Future validation studies should therefore assess model performance across the full BMI spectrum to ensure broader clinical utility.
This study demonstrates that paediatric OSA arises from the interplay of craniofacial imbalance, adenoidal hypertrophy, and functional traits such as mouth-breathing and snoring, with nasopharyngeal tissue ratio emerging as the strongest structural predictor. While only a subset of children underwent polysomnography and lateral cephalometry provides a two-dimensional perspective, these approaches allowed precise, clinically actionable correlations between anatomy, physiology, and symptomatology. The cross-sectional, single-ethnicity design highlights findings most relevant to East Asian populations but underscores the importance of early identification of at-risk children. By integrating simple clinical screening, cephalometric assessment, and targeted polysomnography, clinicians can efficiently stratify risk, optimize resource use, and guide timely interventions including orthodontic, otolaryngologic, or myofunctional therapies to prevent long-term craniofacial and neurocognitive sequelae. Future studies incorporating longitudinal follow-up, volumetric imaging, and multi-ethnic cohorts will further refine predictive models and support the development of personalized, early-intervention strategies for paediatric OSA.
Conclusion
This study reinforces that paediatric OSA is a multifactorial condition influenced by nasopharyngeal soft-tissue hypertrophy, craniofacial skeletal morphology, and functional breathing patterns. The observed relationships among cephalometric measurements, clinical symptoms, and PSG-derived severity indicators support the value of integrating anatomical and clinical assessments when evaluating children with suspected OSA. The predictive screening model combining ANB angle, nasopharyngeal soft-tissue ratio, and key clinical features demonstrated encouraging discriminatory performance; however, these findings should be considered preliminary. The selective availability of imaging and PSG data, exclusion of children with obesity, and lack of external validation limit the immediate generalizability of the model. Therefore, while the present results offer a clinically practical direction for early risk stratification, broader multicentre validation in more diverse paediatric populations as well as incorporation of three-dimensional imaging and longitudinal follow-up is essential before routine clinical implementation. With further refinement, this integrated approach has the potential to support earlier identification and more tailored management of paediatric OSA.
Data Sharing Statement
The datasets generated and analysed during the current study are available from the corresponding author, Qin Yang, upon reasonable request.
Ethical Approval and Patient Consent
This study was approved by the Ethics Committee of Shenzhen Children’s Hospital (Approval No. 2025048). Written informed consent was obtained from the patients’ legal guardians prior to participation.
Author Contributions
AL contributed to data curation, investigation, methodology, and formal analysis. QL was responsible for software development, validation, and visualization. XH participated in investigation and resource provision. HL contributed to methodology and data curation. ZH performed formal analysis and validation. WL assisted with resources and data curation. TH was involved in project administration and supervision. YC contributed to validation and visualization. TW assisted in software and methodological development. YX participated in data curation and investigation. SP was responsible for conceptualization, formal analysis, and writing – original draft and review & editing. QY contributed to conceptualization, funding acquisition, supervision, project administration. All authors contributed to writing – review & editing the final draft. All authors approved the final version submitted for publication; agreed on the journal to which the paper was submitted; agree to be accountable for the content of the paper.
Funding
This study was funded by the National Natural Science Foundation of China (82300030), Guangdong High-level Hospital Construction Fund Clinical Research Project of Shenzhen Children’s Hospital (LCYJ2022097).
Disclosure
The authors have no conflict of interest to declare.
References
1. Mitchell RB. Sleep-disordered breathing in children: are we underestimating the problem? Eur Respir J. 2005;25(2):216–15. doi:10.1183/09031936.05.00124704
2. Petrongari D, Ciarelli F, Di Filippo P, et al. Risk and protective factors for obstructive sleep apnea syndrome throughout lifespan: from pregnancy to adolescence. Children. 2025;12(2):216. doi:10.3390/children12020216
3. Chang SJ, Chae KY. Obstructive sleep apnea syndrome in children: epidemiology, pathophysiology, diagnosis and sequelae. Korean J Pediatr. 2010;53(10):863–871. doi:10.3345/kjp.2010.53.10.863
4. Jadhav U, Bhanushali J, Sindhu A, Reddy BSK, Toshniwal A, Rashmika M. A comprehensive review of pediatric obstructive sleep apnea: from assessment to intervention. Cureus. 2025;17(1):e78051. doi:10.7759/cureus.78051
5. Cohen-Gogo S, Ntc D, Levy D, et al. Sleep-disordered breathing in children. Arch Pediatr. 2009;16(2):123–131. doi:10.1016/j.arcped.2008.11.016
6. Farrell PC, Richards G. Recognition and treatment of sleep-disordered breathing: an important component of chronic disease management. J Transl Med. 2017;15(1):114. doi:10.1186/s12967-017-1211-y
7. Working Group of Chinese Guideline for the Diagnosis and Treatment of Childhood OSA, Subspecialty Group of Pediatrics, Society of Otorhinolaryngology Head and Neck Surgery, Chinese Medical Association, Subspecialty Group of Respiratory Diseases, Society of Pediatrics, Chinese Medical Association, Society of Pediatric Surgery, Chinese Medical Association, Editorial Board of Chinese Journal of Otorhinolaryngology Head and Neck Surgery. [Chinese guideline for the diagnosis and treatment of childhood obstructive sleep apnea (2020)]. Zhonghua Er Bi Yan Hou Tou Jing Wai Ke Za Zhi. 2020;55(8):729–747. doi:10.3760/cma.j.cn115330-20200521-00431
8. Teplitzky TB, Zauher A, Isaiah A. Evaluation and diagnosis of pediatric obstructive sleep apnea—An update. Front Sleep. 2023;2. doi:10.3389/frsle.2023.1127784
9. Kang KT, Chou CH, Weng WC, Lee PL, Hsu WC. Associations between adenotonsillar hypertrophy, age, and obesity in children with obstructive sleep apnea. PLoS One. 2013;8(10):e78666. doi:10.1371/journal.pone.0078666
10. Wang J, Zhao Y, Yang W, et al. Correlations between obstructive sleep apnea and adenotonsillar hypertrophy in children of different weight status. Sci Rep. 2019;9:11455. doi:10.1038/s41598-019-47596-5
11. Xu Q, Wang X, Li N, Wang Y, Xu X, Guo J. Craniofacial and upper airway morphological characteristics associated with the presence and severity of obstructive sleep apnea in Chinese children. Front Pediatr. 2023;11:1124610. doi:10.3389/fped.2023.1124610
12. Dong Z, Wu J, Wu L, Hong H. The association between craniofacial morphological parameters and the severity of obstructive sleep apnea: a multivariate analysis using the apnea-hypopnea index and nocturnal oxygen desaturation. Healthcare. 2025;13(8):913. doi:10.3390/healthcare13080913
13. Meisgeier A, Dürrschnabel F, Pienkohs S, Weiser A, Neff A. Cephalometric screening assessment for superior airway space narrowing-added value of three-dimensional imaging. J Clin Med. 2024;13(9):2685. doi:10.3390/jcm13092685
14. Wang H, Xu W, Zhao A, Sun D, Li Y, Han D. Clinical characteristics combined with craniofacial photographic analysis in children with obstructive sleep apnea. NSS. 2023;15:115–125. doi:10.2147/NSS.S400745
15. Liu K, Geng S, Shen P, Zhao L, Zhou P, Liu W. Development and application of a machine learning-based predictive model for obstructive sleep apnea screening. Front Big Data. 2024;7:1353469. doi:10.3389/fdata.2024.1353469
16. Kim MJ, Jeong J, Lee JW, et al. Screening obstructive sleep apnea patients via deep learning of knowledge distillation in the lateral cephalogram. Sci Rep. 2023;13(1):17788. doi:10.1038/s41598-023-42880-x
17. Steiner CC. Cephalometrics for you and me. Am J Orthodontics. 1953;39(10):729–755. doi:10.1016/0002-9416(53)90082-7
18. AAO Home. American Association of Orthodontists. Available from: https://aaoinfo.org/.
19. AASM Scoring Manual - American Academy of Sleep Medicine. American Academy of Sleep Medicine – association for Sleep Clinicians and Researchers. Available from: https://aasm.org/clinical-resources/scoring-manual/.
20. Adedeji TO, Amusa YB, Aremu AA. Correlation between adenoidal nasopharyngeal ratio and symptoms of enlarged adenoids in children with adenoidal hypertrophy. Afr J Paediatr Surg. 2016;13(1):14–19. doi:10.4103/0189-6725.181701
21. Fujioka M, Young LW, Girdany BR. Radiographic evaluation of adenoidal size in children: adenoidal-nasopharyngeal ratio. AJR Am J Roentgenol. 1979;133(3):401–404. doi:10.2214/ajr.133.3.401
22. Xu Y, Yu M, Huang X, et al. Differences in salivary microbiome among children with tonsillar hypertrophy and/or adenoid hypertrophy. mSystems. 2024;9(10):e00968–24. doi:10.1128/Msystems.00968-24
23. Fagundes NCF, Gianoni-Capenakas S, Heo G, Flores-Mir C. Craniofacial features in children with obstructive sleep apnea: a systematic review and meta-analysis. J Clin Sleep Med. 2022. doi:10.5664/jcsm.9904
24. Yuan Y, Wen WY, Nei LY, et al. A meta-analysis: single or double dartos flap layer in tubularized incised plate urethroplasty to prevent urethrocutaneous fistula? Front Pediatr. 2023:11. doi:10.3389/fped.2023.1091242
25. Al‐Iede M, Rahal R, Al‐Mashaqbeh S, et al. Obstructive sleep apnea in overweight and obese children: factors influencing quality of life. Laryngoscope Investig Otolaryngol. 2025;10(3):e70134. doi:10.1002/lio2.70134
26. Kang EK, Jang MJ, Kim KD, Ahn YM. The association of obstructive sleep apnea with dyslipidemia in Korean children and adolescents: a single-center, cross-sectional study. J Clin Sleep Med. 2021;17(8):1599–1605. doi:10.5664/jcsm.9258
27. Dékány L, Molnár V, Molnár A, et al. Analysis of possible risk factors for the severity of paediatric obstructive sleep apnoea syndrome. Eur Arch Otorhinolaryngol. 2023;280(12):5607–5614. doi:10.1007/s00405-023-08237-w
28. Souki BQ, Lopes PB, Veloso NC, et al. Facial soft tissues of mouth-breathing children: do expectations meet reality? Int J Pediatr Otorhinolaryngol. 2014;78(7):1074–1079. doi:10.1016/j.ijporl.2014.04.008
29. Galeotti A, Festa P, Viarani V, et al. Prevalence of malocclusion in children with obstructive sleep apnoea. Orthod Craniofac Res. 2018;21(4):242–247. doi:10.1111/ocr.12242
30. Primarti RS, Fatma A, Jayanti CNR, Musnamirwan IA, Setiawan AS. Mouth breathing and its impact on sleep breathing disorders in children: a cross-sectional study in Bandung, Indonesia. CCIDE. 2025;17:435–444. doi:10.2147/CCIDE.S536188
31. Su Y, Wang Z, Chang H, et al. Craniofacial development characteristics in children with obstructive sleep apnea for establishment and external validation of the prediction model. Nat Sci Sleep. 2024;16:2151–2170. doi:10.2147/NSS.S492714
32. Emsaeili F, Sadrhaghighi A, Sadeghi-Shabestari M, Nastarin P, Niknafs A. Comparison of superior airway dimensions and cephalometric anatomic landmarks between 8–12-year-old children with obstructive sleep apnea and healthy children using CBCT images. J Dent Res Dent Clin Dent Prospects. 2022;16(1):18–23. doi:10.34172/joddd.2022.003
33. S S, Shetty V, Priya K, Saha S, Jaswanth J, Sethi S. Cephalometry as an aid in the diagnosis of pediatric obstructive sleep apnoea: a systematic review and meta-analysis. J Oral Biol Craniofac Res. 2024;14(5):512–521. doi:10.1016/j.jobcr.2024.06.007
34. Li Y, Tong X, Wang S, et al. Pediatric sleep-disordered breathing in Shanghai: characteristics, independent risk factors and its association with malocclusion. BMC Oral Health. 2023;23:130. doi:10.1186/s12903-023-02810-9
35. Zinchuk A, Gentry M, Concato J, Yaggi K. Phenotypes in obstructive sleep apnea: a definition, examples and evolution of approaches. Sleep Med Rev. 2017;35:113–123. doi:10.1016/j.smrv.2016.10.002
36. Kim K, Kim S, Yoon A. Craniofacial anatomical determinants of pediatric sleep‐disordered breathing: a comprehensive review. J Prosthodont. 2025;34(Suppl 1):26–34. doi:10.1111/jopr.13984
37. Xu Z, Wu Y, Tai J, et al. Risk factors of obstructive sleep apnea syndrome in children. J Otolaryngol Head Neck Surg. 2020;49:11. doi:10.1186/s40463-020-0404-1
 © 2026 The Author(s). This work is published and licensed by Dove Medical Press Limited. The
full terms of this license are available at https://www.dovepress.com/terms
and incorporate the Creative Commons Attribution
- Non Commercial (unported, 4.0) License.
By accessing the work you hereby accept the Terms. Non-commercial uses of the work are permitted
without any further permission from Dove Medical Press Limited, provided the work is properly
attributed. For permission for commercial use of this work, please see paragraphs 4.2 and 5 of our Terms.
© 2026 The Author(s). This work is published and licensed by Dove Medical Press Limited. The
full terms of this license are available at https://www.dovepress.com/terms
and incorporate the Creative Commons Attribution
- Non Commercial (unported, 4.0) License.
By accessing the work you hereby accept the Terms. Non-commercial uses of the work are permitted
without any further permission from Dove Medical Press Limited, provided the work is properly
attributed. For permission for commercial use of this work, please see paragraphs 4.2 and 5 of our Terms.