")
Back to Journals » Cancer Management and Research » Volume 14
Integrative Analysis of Peripheral Blood Indices for the Renal Sinus Invasion Prediction of T1 Renal Cell Carcinoma: An Ensemble Study Using Machine Learning-Assisted Decision-Support Models
Authors Li X, Liu B, Cui P, Zhao X, Liu Z, Qi Y, Zhang G
Received 10 November 2021
Accepted for publication 27 January 2022
Published 15 February 2022 Volume 2022:14 Pages 577—588
DOI https://doi.org/10.2147/CMAR.S348694
Checked for plagiarism Yes
Review by Single anonymous peer review
Peer reviewer comments 2
Editor who approved publication: Professor Seema Singh
Xin Li, Bo Liu, Peng Cui, Xingxing Zhao, Zhao Liu, Yanxiang Qi, Gangling Zhang
Department of Thoracic Oncology, Baotou Cancer Hospital, Baotou, Inner Mongolia, People’s Republic of China
Correspondence: Gangling Zhang, Department of Thoracic Oncology, Baotou Cancer Hospital, Baotou, Inner Mongolia, 014030, People’s Republic of China, Tel +86-138-4827-8198, Email [email protected]
Purpose: Renal sinus invasion is an attributive factor affecting the prognosis of renal cell carcinoma (RCC). This study aimed to construct a risk prediction model that could stratify patients with RCC and predict renal sinus invasion with the help of a machine learning (ML) algorithm.
Patients and Methods: We retrospectively recruited 1229 patients diagnosed with T1 stage RCC at the Baotou Cancer Hospital between November 2013 and August 2021. Iterative analysis was used to screen out predictors related to renal sinus invasion, after which ML-based models were developed to predict renal sinus invasion in patients with T1 stage RCC. The receiver operating characteristic curve (ROC), decision curve analysis (DCA), and clinical impact curve (CIC) were performed to evaluate the robustness and clinical practicability of each model.
Results: A total of 21 candidate variables were shortlisted for model building. Iterative analysis screened that neutrophil to albumin ratio (NAR), hemoglobin level * albumin level * lymphocyte count/platelet count ratio (HALP), prognostic nutrition index (PNI), body mass index*serum albumin/neutrophil-lymphocyte ratio (AKI), NAR, and fibrinogen (FIB) concentration (NARFIB), platelet to lymphocyte ratio (PLR), and R.E.N.A.L score was related to renal sinus invasion and contributed significantly to ML-based algorithm. The areas under the ROC curve (AUCs) of the random forest classifier (RFC) model, support vector machine (SVM), eXtreme gradient boosting (XGBoost), artificial neural network (ANN), and decision tree (DT) ranged from 0.797 to 0.924. The optimal risk probability of renal sinus invasion predicted was RFC (AUC = 0.924, 95% confidence interval [CI]: 0.414– 1.434), which showed robust discrimination for identifying high-risk patients.
Conclusion: We successfully develop practical models for renal sinus invasion prediction, particularly the RFC, which could contribute to early detection via integrating systemic inflammatory factors and nutritional parameters.
Keywords: renal cell carcinoma, renal sinus invasion, machine learning algorithms, peripheral blood indices, prediction model
Introduction
Globally, the incidence of renal cell carcinoma (RCC) is increasing annually. According to statistics from the Global Burden of Disease (GBD) database, nearly half of the diagnoses and more than two-thirds of related deaths occur in low- and middle-income countries, where the prognosis is often far from expected.1,2 Undoubtedly, this increase of RCC is largely attributed to advances in diagnostic imaging techniques, including cross-sectional imaging, especially allowing for the early detection of clinical T1 stage RCC.3 Once diagnosed with T1 stage RCC, clinicians will face a variety of treatment options, including surgical resection and non-surgical treatment.4,5 For the treatment of stage T1 RCC, according to European and American guidelines, Partial nephrectomy (PN) is currently the standard treatment for T1a tumors (≤4cm) and the first choice for T1b tumors (≤7cm).6,7 Alarmingly, up to 4% to 13% of patients with T1 RCC treated with PN may have potential adverse pathological features, such as renal or sinus fat infiltration.8–10 Relatedly, emerging evidence elucidates that renal sinus invasion is tightly associated with inferior oncological outcomes.9,11 Thus far, developing a predictive model is essential for predicting the risk of renal sinus invasion, but insights into its accuracy and practicality to optimize it are limited.
Peripheral blood is routinely used for preoperative examination in clinics to explore potential predictors, which can improve the convenience of diagnosis. Meanwhile, previous analyses have highlighted that systemic inflammatory markers, hepatic synthetase, and kidney secretion have potential value in predicting the prognosis of various tumors.12–15 Here we intend to identify the integrative analysis of peripheral blood indices for the renal sinus invasion prediction. Furthermore, the wide usage of various machine learning (ML) approaches has outperformed conventional statistical analyses, which might be increasingly adapted for use in the medical field because of their high accuracy.16,17 Herein, this study investigated the applicability of machine learning techniques to predict renal sinus invasion in patients with stage T1 RCC.
In the present study, We attempted to integrate these candidate peripheral blood indices to characterize the specific predictive markers that contribute to pathological tumor upstaging, and established multiple predictive models using ensemble analysis, to predict the risk factors for renal sinus invasion. We then analyzed the predictive performance of these machine learning-assisted decision-support models in a deviation cohort and then verified performance in an internal validation cohort.
Patients and Methods
Patients Selection
We retrospectively recruited 1229 cases that had received PN or RN for pathologically confirmed RCC at our center between November 2013 and August 2021, and evaluated their clinicopathological data. The inclusion criteria were as follows: (i) Patients with lesion diameter less than or equal to 7cm, the metastasis of a single regional lymph node cannot be distinguished from that of more than one regional lymph node;18–20(ii) Patients with complete case data, traceable imaging, pathology, and laboratory examination related indicators;(iii) Patients who underwent RN or PN surgery and had sufficient evidence to prove whether there was renal sinus invasion. The exclusion criteria were as follows: (i) Patients who received preoperative treatment, including thermal ablation, neoadjuvant chemotherapy, or radiotherapy;(ii) Patients with other tumors or psychiatric disorders;(3) Bilateral or multiple renal lesions and patients with defective case data. This retrospective study was in line with the declaration of Helsinki and was ethically reviewed and approved by the Institutional Ethics Committee of the Baotou Cancer Hospital (Reference: 2021-IECBCH027). Since the patient information included in this study was anonymous, the written informed consent of all participants was obtained. The detailed research flow chart was summarized in Figure 1.
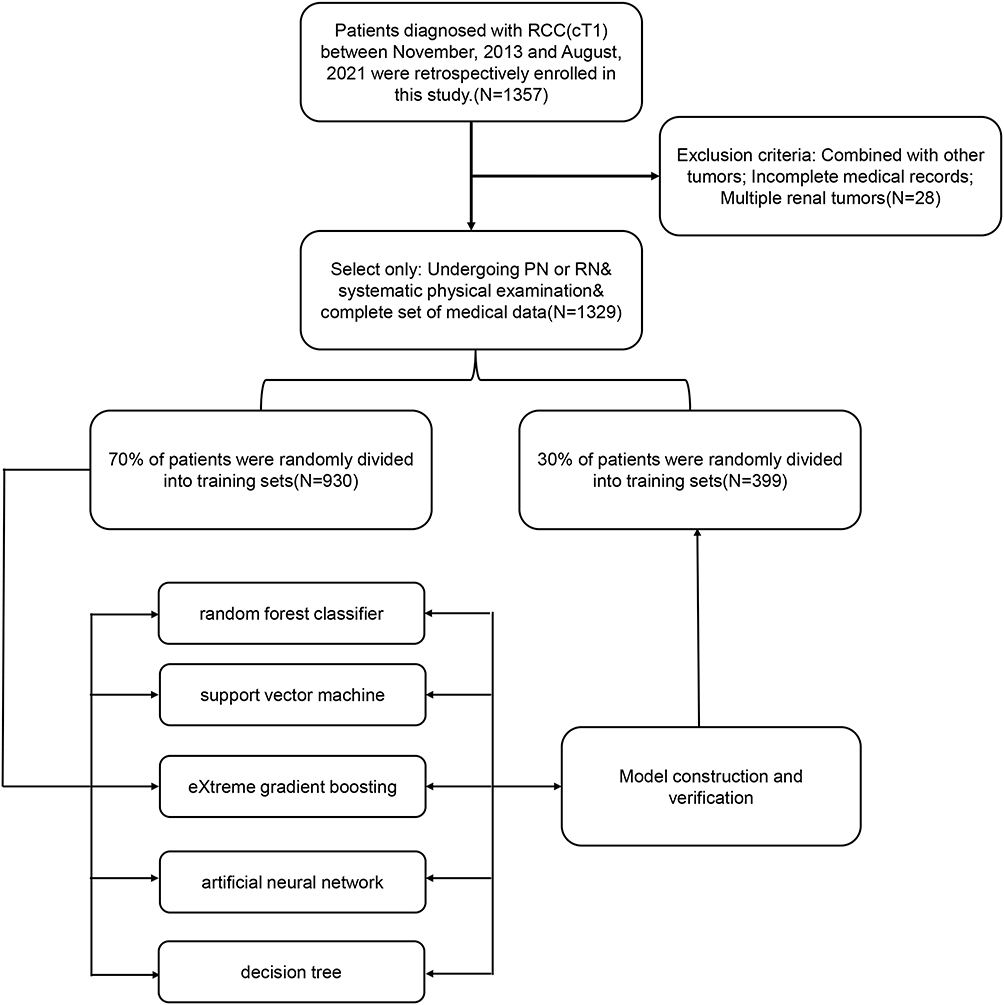 |
Figure 1 The flow chart of patient selection and data process. |
Data Collection and Quality Assessment
According to the principle of inclusion of whole candidate variables, we sorted all the variables that can be collected. Among them, if the missing value of the variable exceeds 15%, it will be regarded as an invalid variable and will not be included in the final variable screening. However, provided that the missing range was within 15%, the median or average value filling method will be used to improve the data dimension.21 We also collected preoperative routine laboratory measurements, defined as follows: (i) PNI=158-16.6(ALB)-0.78(TSF)-0.20(TFN)-5.80(DHST). ALB: serum albumin (unit: G%); TSF: triceps skinfold thickness (unit: mm); TFN: serum transferrin (unit: mg%), dhst: delayed hypersensitive skin reaction test (dhst = 2 for those with induration diameter >5 mm; dhst = 1 for those with induration diameter <5 mm; dhst = 0 for those without reaction); (ii) HALP = hemoglobin level * albumin level * lymphocyte count/platelet count ratio; (iii) AKI=body mass index*serum albumin/neutrophil-lymphocyte ratio (NLR). NARFIB=neutrophil-to-albumin ratio (NAR) and fibrinogen (FIB) concentration. Combining NAR and FIB, we categorized patients into three “NARFIB” groups: NARFIB1 = NAR <0.083 and fibrinogen <2.28g/L, NARFIB1 = either NAR ≥0.083 or fibrinogen ≥2.28g/L. Finally, a total of 21 variables met the inclusion criteria and were used to build the ML-based model.
Development and Validation of ML-Based Models
We used the caret software package to randomly divide the data set into two parts, 70% for model training and 30% for model testing. A total of five mL-based algorithms were implemented to establish the prediction model. According to the principle of “OOB error”,22 we have gradually screened the model variables, as follows:
The characteristic variable is marked as X and the target variable is marked as Y. The X and Y were evenly divided into two parts, namely X1, Y1, and X2, Y2. Gini index measures the purity of data partition or training tuple set D. Briefly, by sorting the intersection of variable sets, the optimal subset modeling is obtained. The model was evaluated by inspection, discrimination, and calibration. The receiver operating characteristic (ROC) curve was used to evaluate the recognition ability of the prediction model in the training data set and the test data set; The discrimination ability of each model was quantified by the area under the ROC curve (AUC), decision curve analysis (DCA), and clinical impact curve (CIC).
Statistical Analysis
For descriptive analysis, median (IQR) and frequencies (%) were assessed for continuous and categorical variables, respectively. The Chi-square test or the Mann–Whitney U-test as appropriate was used to compare the differences of baseline clinical information between the renal sinus invasion and non-renal sinus invasion cohorts. All analysis was performed using the Python programming language (version 3.9.2, Python Software Foundation, https://www.python.org/) and R Project for Statistical Computing (version 4.0.4, http://www.r-project.org/). All tests were two-sided, and P<0.05 was considered statistically significant.
Results
Baseline Clinicopathological Characteristics of the Study Cohort
The detailed clinical characteristics and pathological baseline data of 1329 patients with T1 stage RCC are summarized in Table 1. Of the patients with T1 stage RCC disease, the rate of renal sinus invasion was 6.98% and 5.01% in the training and validation cohorts, respectively. All baseline characteristic data were compared among the groups of the training and validation cohort. Consistent with the results of the inter-group comparison, as shown in Figure 2A, among the included 21 candidate variables, eight showed significant correlation with renal sinus invasion, namely PLR, NLR, HALP, AKI, PNI, NARFIB, R.E.N.A.L, tumor size, and age. Undoubtedly, systemic inflammatory factors and nutritional parameters suggested that they can be potential predictors of renal sinus invasion.
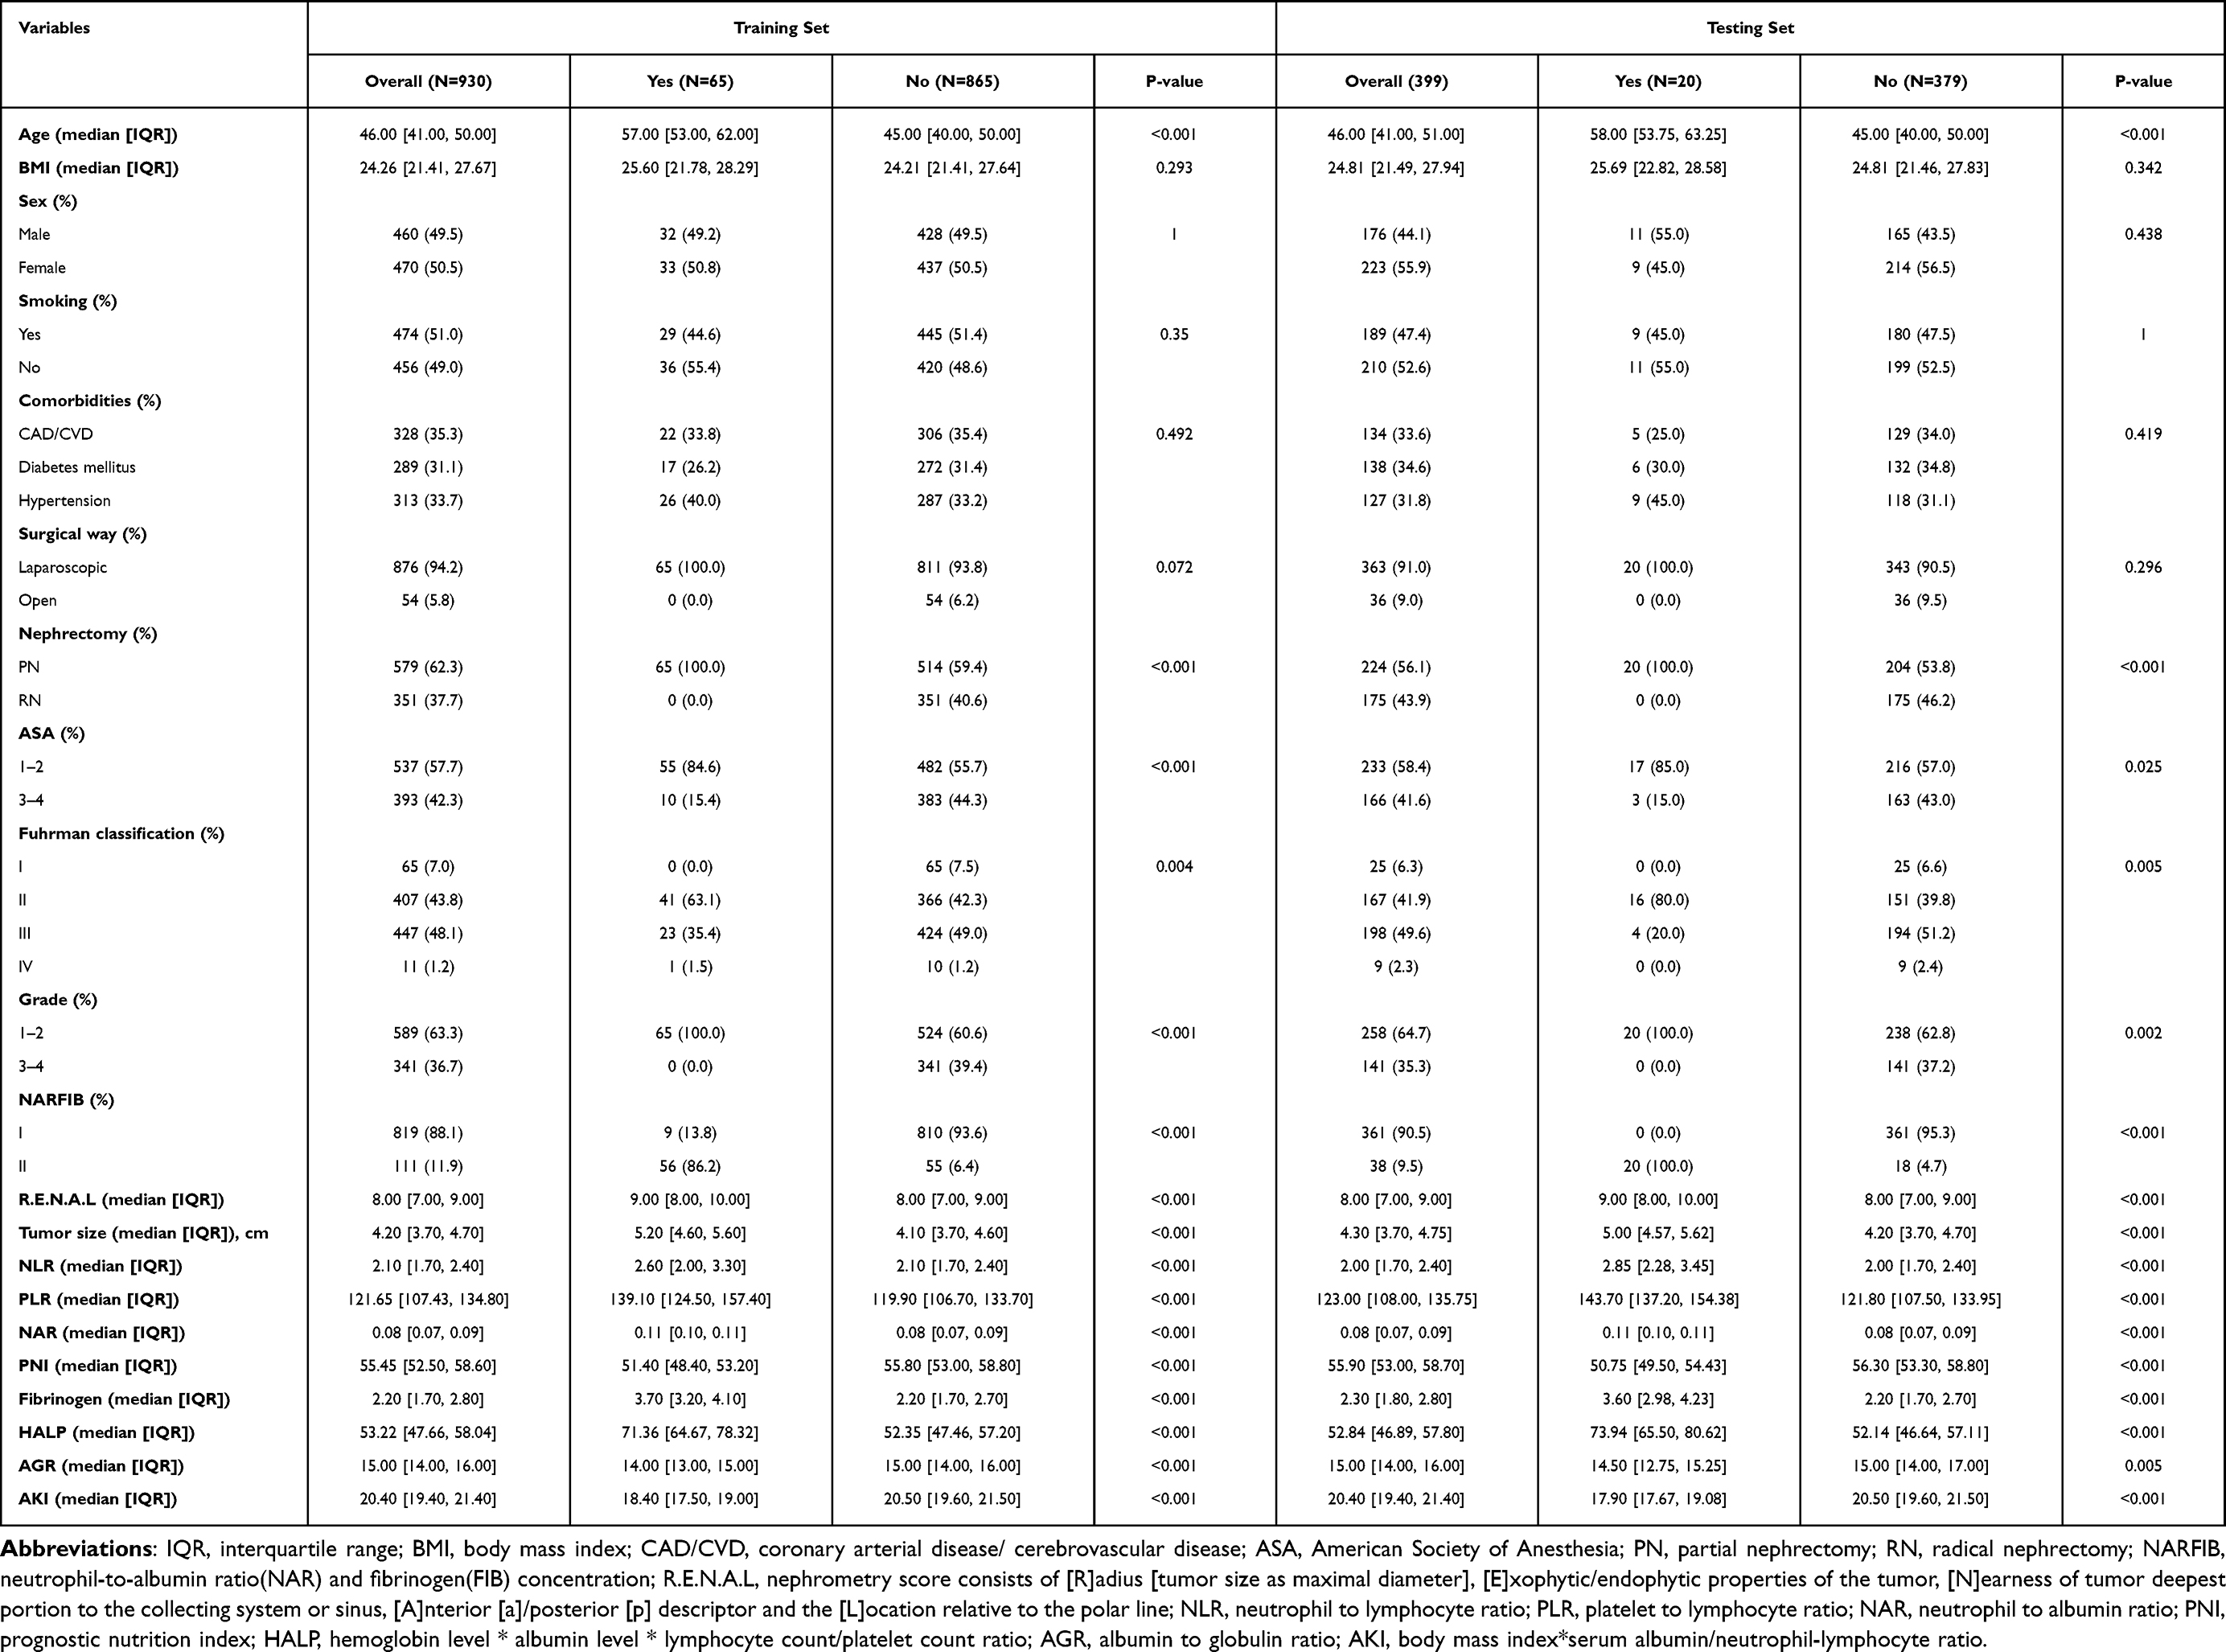 |
Table 1 Baseline Demographic and Clinicopathological Features of Included Patients with RCC Diagnosed with and without Renal Sinus Invasion |
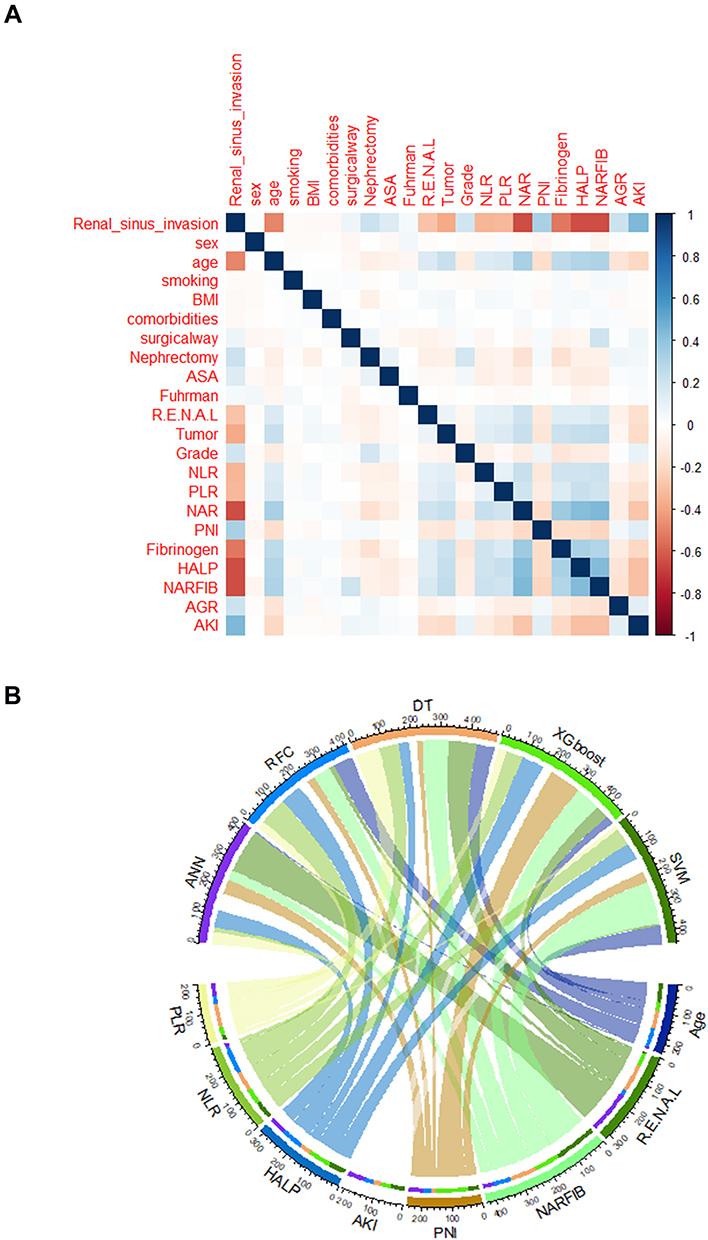 |
Figure 2 Variable screening and weight allocation. (A) Correlation matrix analysis of candidate features. (B) The weight distribution of the candidate variables of each ML-based model. Abbreviations: BMI, body mass index; ASA, American Society of Anesthesia; NARFIB, neutrophil-to-albumin ratio (NAR) and fibrinogen (FIB) concentration; R.E.N.A.L, nephrometry score consists of [R]adius [tumor size as maximal diameter], [E]xophytic/endophytic properties of the tumor, [N]earness of tumor deepest portion to the collecting system or sinus, [A]nterior [a]/posterior [p] descriptor and the [L]ocation relative to the polar line; NLR, neutrophil to lymphocyte ratio; PLR, platelet to lymphocyte ratio; NAR, neutrophil to albumin ratio; PNI, prognostic nutrition index; HALP, hemoglobin level * albumin level * lymphocyte count/platelet count ratio; AGR, albumin to globulin ratio; AKI, body mass index*serum albumin/neutrophil-lymphocyte ratio. |
Selection of Candidate Variables via Different ML-Based Algorithms
According to the variable screening results of different ML-based algorithms, we applied the intersection of meaningful variables of each model (Figure 2B). The flow sorting in the chord graph indicated the contribution of each variable in the model, which can show that PLR, NLR, HALP, AKI, PNI, NARFIB, R.E.N.A.L, and age occupy a high weight in the five models. Consistent with the chord graph results, we found that the intersection variables mentioned above were also in the top 10 rankings of RFC and DT models (Supplementary Table 1). These results suggested that repeated iterative algorithm analysis, including NAR, PLR, NLR, HALP, AKI, PNI, NARFIB, R.E.N.A.L, and tumor size, can be used to further model construction and predict renal sinus invasion.
Construction of ML-Based Renal Sinus Invasion Predictive Model
As representatives of ML-based algorithms, RFC and DT are commonly used modeling schemes in supervised learning. As shown in Figure 3A, the RFC model was constructed using the following formula: I(X=xi)=-log2P(xi), the I(X) was used to represent the information of candidate variables, and P (xi) refers to the probability when xi occurs. Considering the clinical utility, the variables with 10 ranking at the top were determined to construct the optimal RFC prediction model, which included NAR, PLR, NLR, HALP, AKI, PNI, NARFIB, R.E.N.A.L, albumin to globulin ratio(AGR), age, and tumor size. As depicted in Figure 3B, with the addition of inflammatory factor indicators, relevant NLR and NARFIB acted as an irreplaceable weight at the branch of DT. Collectively, using the iterative algorithm analysis of supervised learning, both RFC and DT models were appropriately used to guide renal sinus invasion prediction.
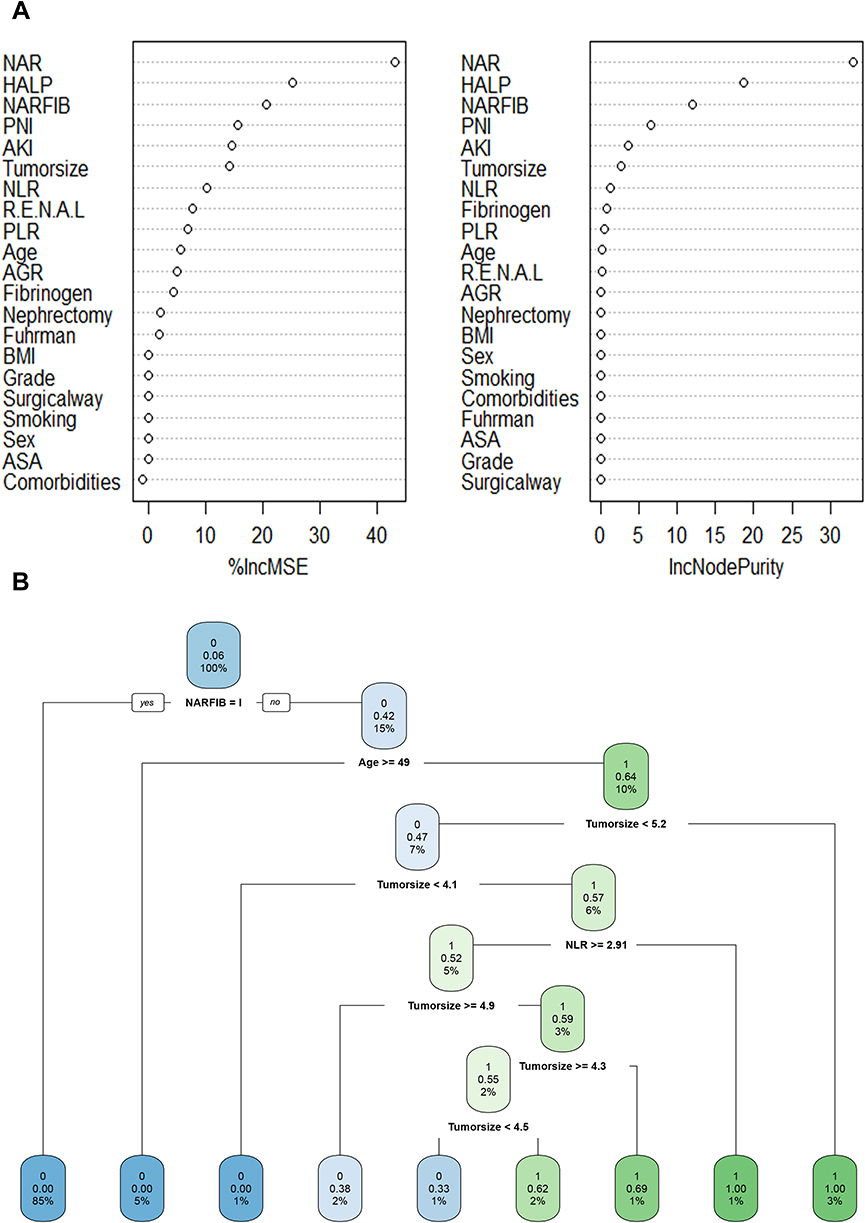 |
Figure 3 Predictive model visualization based on ML-based algorithm. (A) RFC model. (B) DT model. Note: The candidate factors associated with renal sinus invasion were ordered via RFC algorithm(A) and (B)prediction node and weight was allocated via DT algorithm. |
Comparison Between ML-Based Models
Based on the iterative analysis of the baseline characteristics, we further used five supervised learning models for renal sinus invasion risk assessment, attempted to explore whether we can improve the prediction performance. As expected, the RFC model can better distinguish whether patients with LACC showed renal sinus invasion or not. As shown in Figure 4, the DCA also exhibited that the RFC model was equipped with a robust prediction performance in the training and validation cohorts, respectively. Additionally, the AUCs of RFC models reached a plateau when 10 variables were introduced, followed by DT, ANN, SVM, and XGBoost. The detailed predictive performance of ML-based models is summarized in Supplementary Table 2.
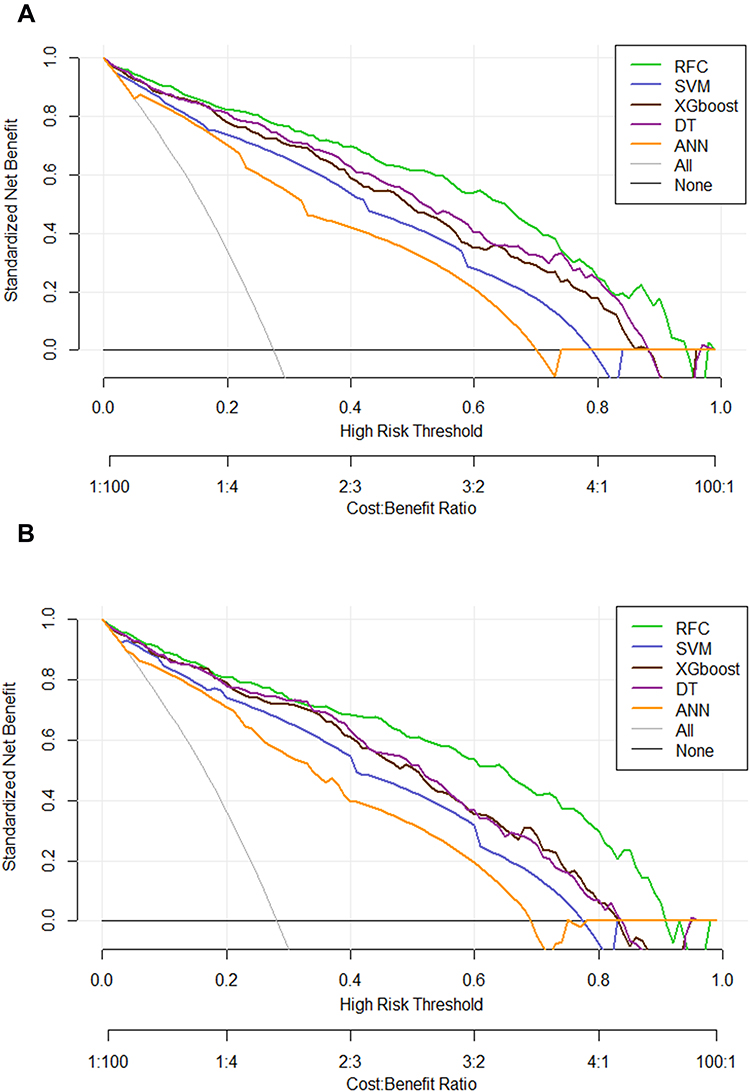 |
Figure 4 Prediction performance of candidate models based on ML-based algorithm. (A) DCA for five ML-based models in the training set. (B) DCA for five ML-based models in the testing set. Abbreviations: RFC, random forest classifier; SVM, support vector machine; DT, decision tree; ANN, artificial neural network; XGboost, eXtreme gradient boosting. |
Internal Validation of the Optimal Renal Sinus Invasion Predictive Model
To further validate the performance of the RFC model, we also adopted CIC to evaluate the prediction efficiency, as illustrated in Figure 5A, the CIC demonstrated that the stratification of renal sinus invasion could be distinguished in the training cohorts. These results were also parallel to risk factors of renal sinus invasion delineated in the validation cohorts (Figure 5B), indicating that the selected features were highly relevant to renal sinus invasion.
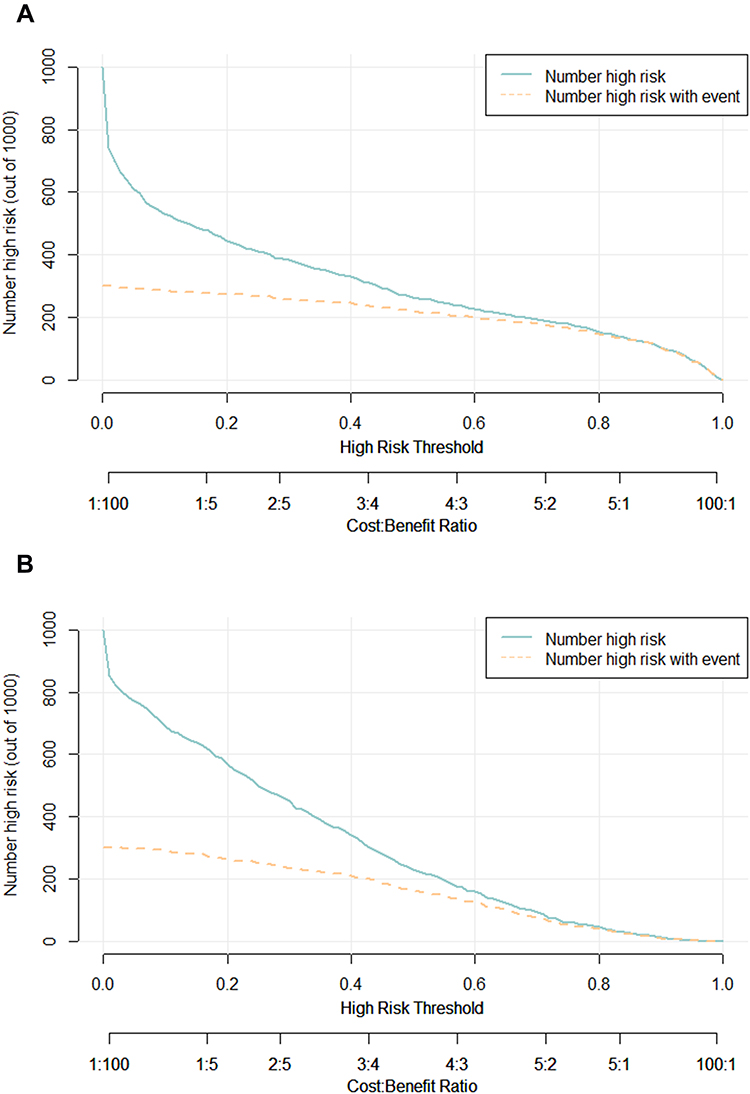 |
Figure 5 Prediction performance of RFC model via CIC. (A) Training set. (B) Validation set. Note: The dark green line predicts the probability of poor renal sinus invasion, and the purple line shows how many patients will be at high risk of non-renal sinus invasion. |
Discussion
Renal sinus invasion is the main way of extrarenal expansion of renal cell carcinoma, and its prognosis may be worse than perirenal fat invasion.23,24 Herein, the preoperative evaluation of renal sinus invasion is of great significance for the selection of radical nephrectomy and nephron-sparing surgery and the prediction of postoperative prognosis. In the present study, using five computational ensemble approaches, we identified 10 associated with pathological tumor upstaging, including NAR, PLR, NLR, HALP, AKI, PNI, NARFIB, R.E.N.A.L, AGR, age, and tumor size, which has, to our knowledge, not previously been tested in predicting renal sinus invasion via ML-based algorithm. We also evaluated the predictive ability of the renal sinus invasion. Notably, we observed high concordance in effect estimates between training and validation datasets, highlighting that R.E.N.A.L alone proved to be a weak predictor (receiver operating characteristics area under the curve (ROC-AUC) 0.65) for renal sinus invasion, but the RFC performed substantially better than conventional predictive models, which is the most robust serological index associated risk factor (ROC-AUC 0.924). Meanwhile, adding systemic inflammatory factors and nutritional parameters to the RFC model appreciably improved the prediction accuracy.
On separate iterative analysis, preoperative collectible clinical indicators were used for variable screening. Previous studies have shown that systemic inflammatory factors and nutritional indicators, as candidate predictive markers, were more convenient and cost-effective than the invasive operation or imaging examination, which have been widely used in clinical practice.25–27 Liu and colleagues et al reported that systemic inflammation response markers and serum lipid parameters in predicting pT3a upstaging may be greatly beneficial to urologists in risk stratification and management decisions, which are similar to the results of this study.28 In contrast, machine learning is superior to the traditional prediction model in screening and using these variables. In this study, we also introduced some classical prediction indicators, including AKI and HALP. Previous studies have shown that HALP can comprehensively reflect the inflammatory response and immune status of tumor patients, which has been reported in the prognosis of various solid tumors, such as renal cell carcinoma, gastric cancer, small cell lung cancer, bladder cancer, pancreatic cancer, rectal cancer, and prostate cancer.29–33 Meanwhile, Jafri and co-workers et al developed the advanced lung cancer inflammation index to evaluate the systemic nutrition and inflammation index in patients with metastatic non-small cell lung cancer at the time of diagnosis.34 Based on this research idea, we created the AKI score to participate in predicting renal sinus invasion. The results revealed that after adding the AKI score, the robustness and accuracy of the prediction model were significantly improved, suggesting that the role of this index in renal sinus invasion should not be underestimated.
Nowadays, to meet the extensive needs of clinicians for auxiliary early diagnosis, machine learning-based classification is the most popular computer development. As an important branch of supervised learning, the RFC model has been successfully applied to high-dimensional multi-source data reduction in many medical fields.35 Robust and reliable supervised learning classifiers, including support vector machine, random forest, convolutional neural network, and decision tree, have been gradually applied to clinical practice and model construction prediction. Consistent with the results of previous research reports, for feature selection and classification, we find that the RFC model is better than the univariate model β non-iterative linear regression model has more prediction advantages.36,37 Based on the candidate value variables obtained by multi-layer iteration, we constructed the relevant prediction model. These algorithms were equipped with more accurate and higher diagnosis and prediction performance than the non-iterative algorithm.
Interestingly, the variables obtained by RFC screening are almost the same as those obtained by the DT algorithm, but the potential prediction performance needs to be further optimized, which is suitable for the optimal strategy of clinical individualized diagnosis and treatment. Moreover, CIC indicated that the ML-based algorithm had a similar performance to an ideal model, and the DCA results also demonstrated that our nomogram had a high potential for clinical utility. Taken together, we found that RFC was more suitable for predicting renal sinus invasion via supervised integrated learning, which can timely predict the risk of renal sinus invasion in patients with RCC, to better obtain the guidance of clinical shunt management and avoid misdiagnosis or excessive medical treatment.
Nevertheless, some issues need to be taken into account. First, since the collection of clinical information for the renal sinus invasion of patients with RCC is difficult, at least data integrity and non-selective offset cannot be guaranteed, as well as perform additional external validations. Second, we obtained the most relevant predictive modules for model building, future studies should explore potential markers for renal sinus invasion prediction, such as proteomics, genomics, and provide new clinical auxiliary strategies for T1 stage RCC treatment and renal sinus invasion prediction. Third, despite a well-established vital predictive model via ML-based algorithm, our conclusion may not be persuasive and still needed more clinical practice to verify its feasibility in the future, especially identifying individuals at high risk of renal sinus invasion.
Conclusion
Collectively, our findings provide insights into the candidate predictive markers associated with a high risk of renal sinus invasion via peripheral blood indices, how they can be manipulated to develop ML-based predictive models, and the prediction performance of these unsupervised ensemble models might be at a population-based level. We anticipate that these findings will extend external studies seeking to strengthen valuable adjunct information and guide treatment decisions.
Acknowledgments
The author thanks all the medical staff who are committed to data collection and collation in this study, as well as Charlesworth Author Services, which provides language touch up for this paper. For this, the author would like to thank all patients who informed consent to participate in this retrospective study and wish you good health and early recovery.
Disclosure
All authors declare that there is no conflicts of interest in this work.
References
1. Trapani D, Curigliano G, Alexandru E, Sternberg CN. The global landscape of drug development for kidney cancer. Cancer Treat Rev. 2020;89:102061. doi:10.1016/j.ctrv.2020.102061
2. Capitanio U, Bensalah K, Bex A, et al. Epidemiology of renal cell carcinoma. Eur Urol. 2019;75(1):74–84.
3. Park JS, Lee HJ, Cho NH, et al. Risk prediction tool for aggressive tumors in clinical T1 stage clear cell renal cell carcinoma using molecular biomarkers. Comput Struct Biotechnol J. 2019;17:371–377.
4. Smaldone MC, Corcoran AT, Uzzo RG. Active surveillance of small renal masses. Nat Rev Urol. 2013;10(5):266–274.
5. Campbell SC, Novick AC, Belldegrun A, et al. Guideline for management of the clinical T1 renal mass. J Urol. 2009;182(4):1271–1279.
6. Campbell S, Uzzo RG, Allaf ME, et al. Renal Mass and Localized Renal Cancer: AUA Guideline. J Urol. 2017;198(3):520–529.
7. Ljungberg B, Albiges L, Abu-Ghanem Y, et al. European Association of Urology Guidelines on Renal Cell Carcinoma: the 2019 Update. Eur Urol. 2019;75(5):799–810.
8. Shah PH, Moreira DM, Patel VR, et al. Partial Nephrectomy is Associated with Higher Risk of Relapse Compared with Radical Nephrectomy for Clinical Stage T1 Renal Cell Carcinoma Pathologically Up Staged to T3a. J Urol. 2017;198(2):289–296.
9. Nayak JG, Patel P, Saarela O, et al. Pathological Upstaging of Clinical T1 to Pathological T3a Renal Cell Carcinoma: a Multi-institutional Analysis of Short-term Outcomes. Urology. 2016;94:154–160.
10. Veccia A, Antonelli A, Minervini A, et al. Upstaging to pT3a disease in patients undergoing robotic partial nephrectomy for cT1 kidney cancer: outcomes and predictors from a multi-institutional dataset. Urol Oncol. 2020;38(4):286–292.
11. Patel SH, Uzzo RG, Larcher A, et al. Oncologic and Functional Outcomes of Radical and Partial Nephrectomy in pT3a Pathologically Upstaged Renal Cell Carcinoma: a Multi-institutional Analysis. Clin Genitourin Cancer. 2020;18(6):e723–e729.
12. Chen Z, Wang K, Lu H, et al. Systemic inflammation response index predicts prognosis in patients with clear cell renal cell carcinoma: a propensity score-matched analysis. Cancer Manag Res. 2019;11:909–919.
13. Long G, Shen J, Zhou L. A-G Score Associated With Outcomes in Solitary Hepatocellular Carcinoma Patients After Hepatectomy. Front Oncol. 2020;10:1286.
14. Dubin RF, Rhee EP. Proteomics and Metabolomics in Kidney Disease, including Insights into Etiology, Treatment, and Prevention. Clin j Am Soc Nephrol. 2020;15(3):404–411.
15. Guzzi F, Cirillo L, Buti E, et al. Urinary Biomarkers for Diagnosis and Prediction of Acute Kidney Allograft Rejection: a Systematic Review. Int J Mol Sci. 2020;21(18):654.
16. Ganggayah MD, Taib NA, Har YC, Lio P, Dhillon SK. Predicting factors for survival of breast cancer patients using machine learning techniques. BMC Med Inform Decis Mak. 2019;19(1):48.
17. Heo J, Yoon JG, Park H, Kim YD, Nam HS, Heo JH. Machine Learning-Based Model for Prediction of Outcomes in Acute Stroke. Stroke. 2019;50(5):1263–1265.
18. Han KR, Bui MH, Pantuck AJ, et al. TNM T3a renal cell carcinoma: adrenal gland involvement is not the same as renal fat invasion. J Urol. 2003;169(3):899–903.
19. Siemer S, Lehmann J, Loch A, et al. Current TNM classification of renal cell carcinoma evaluated: revising stage T3a. J Urol. 2005;173(1):33–37.
20. Altekruse SF, Dickie L, Wu XC, et al. Clinical and prognostic factors for renal parenchymal, pelvis, and ureter cancers in SEER registries: collaborative stage data collection system, version 2. Cancer. 2014;120(23):3826–3835.
21. Miot HA. Anomalous values and missing data in clinical and experimental studies. J vascular brasileiro. 2019;18:e20190004.
22. Fan J, Lv J, Selective A. Overview of Variable Selection in High Dimensional Feature Space. Stat Sin. 2010;20(1):101–148.
23. Kim C, Choi HJ, Cho KS. Diagnostic value of multidetector computed tomography for renal sinus fat invasion in renal cell carcinoma patients. Eur J Radiol. 2014;83(6):914–918.
24. Bolster F, Durcan L, Barrett C, Lawler LP, Cronin CG. Renal Cell Carcinoma: accuracy of Multidetector Computed Tomography in the Assessment of Renal Sinus Fat Invasion. J Comput Assist Tomogr. 2016;40(6):851–855.
25. Mi Q, Meng X, Meng L, Chen D, Fang S. Risk Factors for Systemic Inflammatory Response Syndrome Induced by Flexible Ureteroscope Combined with Holmium Laser Lithotripsy. Biomed Res Int. 2020;2020:6842479.
26. Uchida Y, Takazawa R, Kitayama S, Tsujii T. Predictive risk factors for systemic inflammatory response syndrome following ureteroscopic laser lithotripsy. Urolithiasis. 2018;46(4):375–381.
27. Li F, Wang M, Wang J, Li R, Zhang Y. Alterations to the Gut Microbiota and Their Correlation With Inflammatory Factors in Chronic Kidney Disease. Front Cell Infect Microbiol. 2019;9:206.
28. Liu H, Wang Z, Peng E, Chen Z, Tang K, Xia D. Added Value of Systemic Inflammation Markers in Predicting Clinical Stage T1 Renal Cell Carcinoma Pathologically Upstaged to T3a. Front Oncol. 2021;11:679536.
29. Stotz M, Pichler M, Absenger G, et al. The preoperative lymphocyte to monocyte ratio predicts clinical outcome in patients with stage III colon cancer. Br J Cancer. 2014;110(2):435–440.
30. Jenne CN, Kubes P. Platelets in inflammation and infection. Platelets. 2015;26(4):286–292.
31. Peng D, Zhang CJ, Gong YQ, et al. Prognostic significance of HALP (hemoglobin, albumin, lymphocyte and platelet) in patients with bladder cancer after radical cystectomy. Sci Rep. 2018;8(1):794.
32. Xu SS, Li S, Xu HX, et al. Haemoglobin, albumin, lymphocyte and platelet predicts postoperative survival in pancreatic cancer. World j Gastroenterol. 2020;26(8):828–838.
33. Zhai B, Chen J, Wu J, et al. Predictive value of the hemoglobin, albumin, lymphocyte, and platelet (HALP) score and lymphocyte-to-monocyte ratio (LMR) in patients with non-small cell lung cancer after radical lung cancer surgery. Ann Translational Med. 2021;9(12):976.
34. Jafri SH, Shi R, Mills G. Advance lung cancer inflammation index (ALI) at diagnosis is a prognostic marker in patients with metastatic non-small cell lung cancer (NSCLC): a retrospective review. BMC Cancer. 2013;13:158.
35. Doupe P, Faghmous J, Basu S. Machine Learning for Health Services Researchers. Value Health. 2019;22(7):808–815.
36. Pandis N. Multiple linear regression analysis. Am j Orthodontics Dentofacial Orthopedics. 2016;149(4):581.
37. Hanley JA. Simple and multiple linear regression: sample size considerations. J Clin Epidemiol. 2016;79:112–119.
 © 2022 The Author(s). This work is published and licensed by Dove Medical Press Limited. The full terms of this license are available at https://www.dovepress.com/terms.php and incorporate the Creative Commons Attribution - Non Commercial (unported, v3.0) License.
By accessing the work you hereby accept the Terms. Non-commercial uses of the work are permitted without any further permission from Dove Medical Press Limited, provided the work is properly attributed. For permission for commercial use of this work, please see paragraphs 4.2 and 5 of our Terms.
© 2022 The Author(s). This work is published and licensed by Dove Medical Press Limited. The full terms of this license are available at https://www.dovepress.com/terms.php and incorporate the Creative Commons Attribution - Non Commercial (unported, v3.0) License.
By accessing the work you hereby accept the Terms. Non-commercial uses of the work are permitted without any further permission from Dove Medical Press Limited, provided the work is properly attributed. For permission for commercial use of this work, please see paragraphs 4.2 and 5 of our Terms.