Back to Journals » International Journal of General Medicine » Volume 14
Integrative Analysis of DNA Methylation and Gene Expression Profiling Data Reveals Candidate Methylation-Regulated Genes in Hepatoblastoma
Authors Wang JY, Lao J, Luo Y, Guo JJ, Cheng H, Zhang HY, Yao J, Ma XP, Wang B
Received 30 July 2021
Accepted for publication 9 November 2021
Published 6 December 2021 Volume 2021:14 Pages 9419—9431
DOI https://doi.org/10.2147/IJGM.S331178
Checked for plagiarism Yes
Review by Single anonymous peer review
Peer reviewer comments 3
Editor who approved publication: Dr Scott Fraser
Jian-Yao Wang,1,* Jing Lao,2,* Yu Luo,3 Jing-Jie Guo,2 Hao Cheng,2 Hong-Yan Zhang,2 Jun Yao,4 Xiao-Peng Ma,1 Bin Wang1
1Department of General Surgery, Shenzhen Children’s Hospital, Shenzhen, 518026, Guangdong Province, People’s Republic of China; 2Shenzhen Children’s Hospital of China Medical University, Shenzhen, 518026, Guangdong Province, People’s Republic of China; 3Zhuhai Campus of Zunyi Medical University, Zhuhai, 519090, Guangdong Province, People’s Republic of China; 4Department of Gastroenterology, Jinan University of Medical Sciences, Shenzhen Municipal People’s Hospital, Shenzhen, 518020, Guangdong Province, People’s Republic of China
*These authors contributed equally to this work
Correspondence: Xiao-Peng Ma; Bin Wang Tel +86-075583008073
Email [email protected]; [email protected]
Purpose: This study aimed to identify novel methylation-regulated genes as diagnostic biomarkers and therapeutic targets for hepatoblastoma (HB).
Materials and Methods: The DNA methylation data of 19 HB tumor samples and 10 normal liver samples from the GSE78732 dataset and gene expression profiling data of 53 HB tumor samples and 14 normal liver samples from the GSE131329 dataset and 31 HB tumor samples and 32 normal liver samples from the GSE133039 dataset were downloaded form the Gene Expression Omnibus database. Next, differentially methylated genes (DMGs) and differentially expressed genes (DEGs) were identified. Venn diagrams were used to identify methylation-regulated genes. The VarElect online tool was selected to identify key methylation-regulated genes, and a protein–protein interaction (PPI) network was constructed to show the interactions among key methylation-regulated genes and DEGs. Finally, Gene Ontology annotation and Kyoto Encyclopedia of Genes and Genomes pathway enrichment analysis were performed to investigate the potential regulatory mechanisms of key methylation-regulated genes.
Results: A total of 457 DMGs and 1597 DEGs were identified between the HB and normal liver samples. After DMGs and DEGs overlapping, 22 hypomethylated and upregulated genes and 19 hypermethylated and downregulated genes in HB were screened. Survival analysis revealed that 13 methylation-regulated genes were associated with the prognosis of liver cancer. Moreover, SPP1, UHRF1, and HEY1 were selected as the key DNA methylation-regulated genes. The PPI network revealed that all of them could affect TP53, while both UHRF1 and HEY1 could influence BMP4. Enrichment analysis suggested that the DEGs were involved in TP53-related pathways, including the cell cycle and p53 signaling pathway. Finally, SPP1, UHRF1, and HEY1 were hypomethylated and upregulated in the HB samples compared with those in the normal liver samples.
Conclusion: SPP1, UHRE1, and HEY1 may play important roles in HB and be used as biomarkers for its diagnosis and treatment.
Keywords: DNA methylation, gene, hepatoblastoma, biomarker, tumor
Graphical Abstract:

Introduction
Hepatoblastoma (HB), a type of liver cancer in children and infants, occurs frequently and accounts for approximately 50% of pediatric liver cancers.1 The incidence of HB is approximately 1/1,000,000 in children aged < 15 years, and nearly 20% of them have synchronous metastasis at the first diagnosis.2,3 Although traditional approaches, including chemotherapy, surgical resection, and transplantation, remain the most common and effective treatment options for HB and have greatly progressed in the past 20 years, the prognosis of patients with clinically advanced HB has not improved.2,3 Currently, the lack of effective biomarkers for early HB diagnosis greatly limits the treatment of HB.4 Therefore, it is essential to screen effective biomarkers for the early diagnosis and treatment of HB.
The development of molecular biology has made it possible to diagnose tumors based on biomarkers, which are more specific and sensitive than traditional diagnostic methods.5–7 DNA methylation is a major epigenetic modification that can affect the expression and alternative splicing of genes and maintain the stability of genomes.8 It has been reported that aberrant DNA methylation in various cancers plays a critical role in the occurrence and development of tumors by regulating the expression of many tumor-associated genes.9 For example, some studies have indicated that hypomethylation of oncogenes and hypermethylation of tumor suppressor genes are associated with the occurrence of hepatocellular carcinoma.10–12 In addition, aberrant DNA methylation affects the biological processes of bladder cancer.13,14 Furthermore, DNA methylation of genes can also be selected as a potential biomarker for the diagnosis of tumorigenesis and the prediction of the prognosis of tumors based on their effective diagnostic and prognostic value.15,16 Dulaimi et al revealed that hypermethylation of APC, RASSF1A, and ARF genes can be used for the early diagnosis of bladder cancer.17 Moreover, Zhou et al suggested that CDKN2A methylation has an important impact on the occurrence, development, and metastasis of head and neck squamous cell carcinoma and may serve as a promising diagnostic or prognostic marker.18 Hence, DNA methylation is crucial for the diagnosis and prognosis of tumors and is conducive to improving the treatment strategies for tumors.
Previous extensive studies have revealed that abnormal DNA methylation is related to the prognosis of patients with HB. For instance, Honda et al suggested that increasing GPR180 methylation is associated with a poor prognosis of HB.19 Moreover, Sakamoto et al also found that MT1G hypermethylation can be selected as a prognostic indicator of HB, and patients with HB may benefit from demethylating drug treatments by targeting MT1G.20 In particular, by integrating analyses of DNA methylation, mutation, and gene expression data, Sekiguchi et al revealed the heterogeneity of HB and found that NQO1 and ODC1 can act as novel druggable targets.21 Moreover, combining genomic, transcriptomic, and epigenomic data, Carrillo-Reixach et al also identified choline kinase alpha as a promising therapeutic target for patients with intermediate- and high-risk HB.22 Thus, integrative analysis of DNA methylation and gene expression data for patients with HB may help elucidate the molecular mechanisms and identify novel therapeutic targets for HB.
Our study aimed to identify DNA methylation-regulated genes as novel potential diagnostic biomarkers and treatment targets for patients with HB by integrating methylation and gene expression data from the Gene Expression Omnibus (GEO, https://www.ncbi.nlm.nih.gov/geo/) database,23 which may contribute to the improvement of the molecular diagnosis and clinical treatment of HB.
Materials and Methods
Collection and Processing of Data
DNA methylation data of 19 HB tumor samples and 10 normal liver samples, generated from Illumina Human Methylation 450K BeadChip was obtained from the GSE78732 dataset in the GEO database. The methylation level of each methylated position was normalized using the β-value, which ranged from 0 to 1. The formula for calculating the β-value is M/(M + U + 100), where M represents the methylated allele frequency, and U represents the unmethylated allele frequency. A high β-value implies a high methylation level.
Gene expression profiling data of 53 HB tumor samples and 14 normal liver samples sequenced by an array was obtained from the GSE131329 dataset in the GEO database, and the clinical information of the HB samples is summarized in Table 1. Moreover, gene expression profiling data of 31 HB tumor samples and 32 normal liver samples sequenced by high-throughput sequencing were obtained from the GSE133039 dataset in the GEO database and were used to verify the expression of underlying genes. Raw data was normalized using the fragments per kilobase per million value.
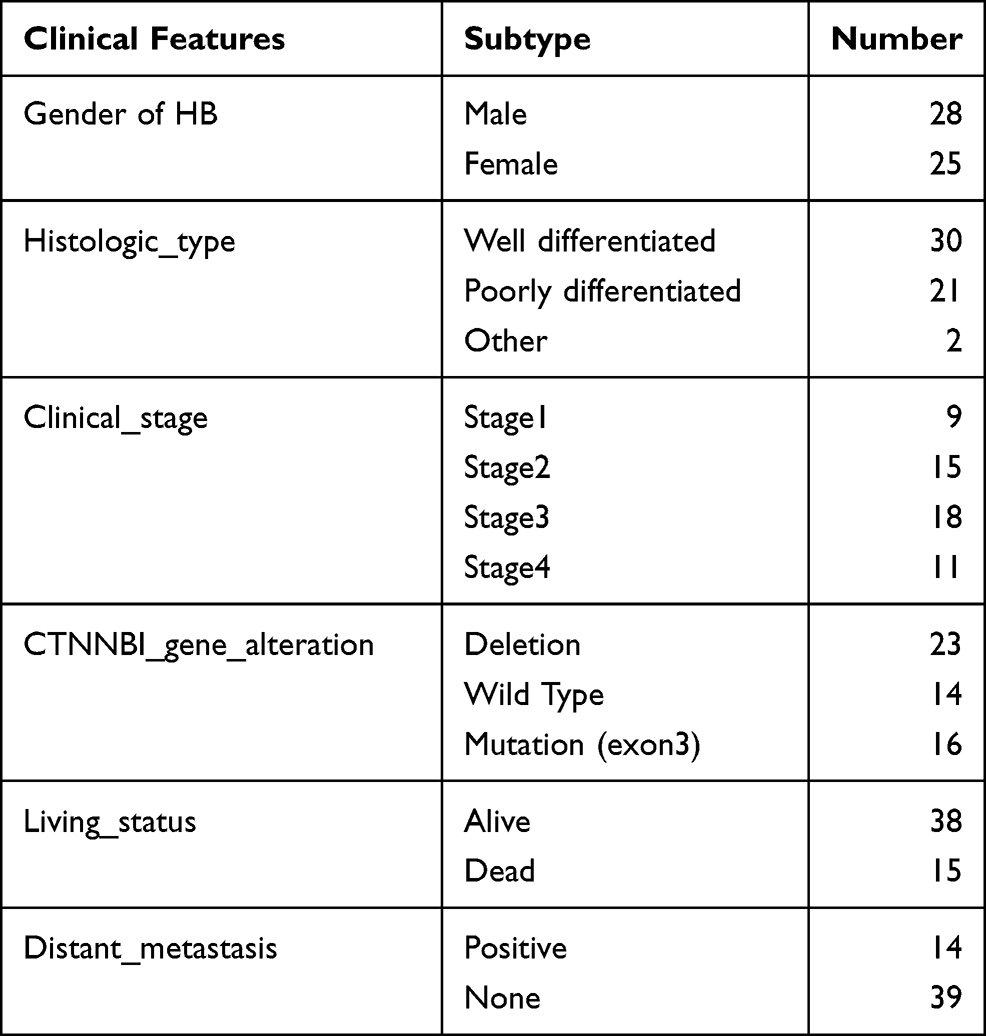 |
Table 1 The Clinical Information of the 53 HB Patients the GSE131329 Dataset |
Identification of Differentially Expressed Genes (DEGs) and Differentially Methylated Genes (DMGs)
Initially, principal component analysis (PCA) was conducted to determine the sample distribution using the gmodels R package. DEGs between the HB and normal liver samples from the GSE131329 dataset were identified using the Limma R package at a cutoff value of |log2 (FC) | ≥ 1 and a P value of < 0.05. Differential DNA methylation sites (DMSs) with a threshold of |log2 (FC) | ≥ 1 and an adjusted P value of ≤ 0.05 and differential DNA methylation regions (DMRs) with a threshold Fisher value of ≤ 0.05 and a |mean difference| of > 0.1 between the HB and normal liver samples were analyzed in the GSE78732 dataset using the methylationArrayAnalysis R package. Genes located in the DMRs were defined as DMGs. The ggplot R package was used to plot volcano plots and heatmaps of the DEGs and DMGs.
Integrative Analysis of DNA Methylation and Gene Expression
Integrative analysis of the DMGs and DEGs was performed to further screen for the methylation-regulated genes in HB. A Venn diagram was used to identify hypomethylated/upregulated genes and hypermethylated/downregulated genes from the DMGs and DEGs, respectively.
Survival Analysis
To screen for potential key genes in HB, we analyzed the correlation between the expression levels of the methylation-regulated genes and survival, including the overall survival (OS) and disease-free survival (DFS) of the patients with liver cancer, using the OncoLnc database (http://www.oncolnc.org/); genes with a P value of < 0.05 were reserved for further analysis.
Disease Association Analysis
To further investigate the association between the potential key genes and HB, we performed disease association analysis using the VarElect online tool. By importing “hepatoblastoma,” “liver cancer,” and “cancer,” we obtained the roles of the key genes in HB, liver cancer, or cancer. Moreover, based on the score, we selected the top three genes as the key DNA methylation-regulated genes.
Construction of the Protein–Protein Interaction (PPI) Network
The interactions among the key DNA methylation-regulated genes and other DEGs were analyzed using the Search Tool for the Retrieval of Interacting Genes (https://string-db.org/). Moreover, we further investigated the biological processes of these genes using the GeneMANIA online database (http://genemania.org/).
Biological Function Analysis
To further investigate the underlying molecular mechanisms of the key DNA methylation-regulated genes, Gene Ontology annotation and Kyoto Encyclopedia of Genes and Genomes (KEGG) pathway enrichment analysis were performed to explore the potential biological functions of the DEGs using the clusterProfiler R package at a cutoff value of P < 0.05.
Methylation Levels of the Key DNA Methylation-Regulated Genes
To further investigate the methylation levels of the key DNA methylation-regulated genes, we first analyzed the methylation sites and methylation regions of these genes. Next, a Circos diagram was plotted to show the DNA methylation and expression of the key DNA methylation-regulated genes using Circos v.0.69-8.
Expression Levels and Diagnostic Significance of the Key DNA Methylation-Regulated Genes
To further validate the expression levels of the key DNA methylation-regulated genes in HB, we first analyzed their expression levels in the HB samples from the GSE131329 dataset. We also validated their expression levels in the HB samples from the GSE133039 dataset. Furthermore, receiver operating characteristic (ROC) curve analysis was conducted to explore whether the key DNA methylation-regulated genes could differentiate the HB samples from the normal liver samples using the pROC R package. Finally, we compared the expression levels of the key DNA methylation-regulated genes among different clinical features.
Statistical Analysis
Statistical analysis was performed using the R software. Differences between the two groups were analyzed using Student’s t-test. Differences were considered statistically significant at P < 0.05.
Results
Identification of the DEGs in HB
To observe the distribution of the samples in the GSE131329 dataset, PCA was performed using the gene expression data of each sample. PCA showed that the HB samples and normal liver samples were distributed on the two flanks of the horizontal axis (Figure 1A), indicating that the samples in each group had good repeatability and could be used for subsequent analysis. A total of 1597 DEGs were identified between the HB and normal liver samples, including 850 upregulated genes and 747 downregulated genes in the HB samples compared with those in the normal liver samples (Figure 1B and C).
 |
Figure 1 Identification of DEGs between HB and normal liver samples in the GSE131329 dataset. (A) PCA showed the distribution of HB and normal liver samples based on overall expression values. (B) volcano plot of DEGs; Red represents upregulated genes and blue represents downregulated genes. (C) heatmap of DEGs; Blue represents downregulated genes, and red represents upregulated genes. |
Analysis of DNA Methylation in HB
Similarly, PCA was performed to observe the distribution of the samples in the GSE78732 dataset using M values of each sample. Clearly, PCA showed that the HB and normal liver samples exhibited distinct clustering (Figure 2A). Further, multidimensional scaling was conducted to evaluate the distribution of the M values in each sample. We found that the M values varied from −5 (hypomethylation) to 5 (hypermethylation) in the HB and normal liver samples (Figure 2B). A total of 24,460 DMSs were identified, including 4209 hypermethylated and 20,251 hypomethylated sites in the HB samples compared with those in the normal liver samples, at a cutoff value of |log2(FC)| ≥ 1 and a P value of ≤ 0.05 (Figure 2C and D). Next, we identified 451 DMRs, including 132 hypermethylated and 319 hypomethylated regions, at a threshold Fisher value of ≤ 0.05 and a |mean difference| of > 0.1. For the DMRs, we found 138 DMGs in the hypomethylated regions and 319 DMGs in the hypermethylated regions.
 |
Figure 2 Analysis of DNA methylation for HB samples in the GSE78732 dataset. (A) PCA showed the distribution of HB and normal liver samples based on methylation M values. (B) The distribution of methylation density; The horizontal axis represents the methylation M value, and the vertical axis represents the methylation distribution density of gene. (C) volcano plot of DMSs between HB samples and normal liver samples; Red represents hypermethylation sites and blue represents demethylation sites. (D) Manhattan plot showed the distribution of DMSs in each chromosome; The vertical axis represents -log10(adj.P.Val), the horizontal axis represents chromosomes, each dot represents a methylation site, and different colors have no practical meaning. |
Integrative Analysis of DNA Methylation and Gene Expression in HB
To identify the genes potentially regulated by DNA methylation, we overlapped the DMGs and DEGs and found 22 hypomethylated and upregulated genes and 19 hypermethylated and downregulated genes (Figure 3A and B). Thus, these genes were defined as the DNA methylation-regulated genes.
 |
Figure 3 Identification of DNA methylation-regulated genes in HB. (A) hypomethylated and upregulated genes in HB samples compared with normal liver samples. (B) hypermethylated and downregulated genes in HB samples compared with normal samples. |
Survival Analysis
To screen for the potential key genes from the DNA methylation-regulated genes in HB, we further examined the associations between these genes and the survival of the patients with liver cancer. We found that 13 of 41 DNA methylation-regulated genes, including ALDOB, CDC20, CXCL2, GC, GPD1, HSD17B13, SLC1A5, SPP1, TTC36, TTYH3, UHRF1, HEY1, and SKA2, were related to the OS or DFS of the patients with liver cancer (Figures S1 and S2). Therefore, these 13 genes were used for subsequent analyses.
Disease Association Analysis
We uploaded the 13 potential key DNA methylation-regulated genes to the VarElect online tool and searched for “hepatoblastoma,” “liver cancer,” and “cancer.” The top three genes were SPP1, UHRF1, and HEY1 (Table 2). In particular, we found that SPP1 and HEY1 were associated with HB (Table 2). Thus, SPP1, UHRF1, and HEY1 were regarded as the key DNA methylation-regulated genes.
 |
Table 2 Correlation Between Genes and Disease |
Construction of the PPI Network and Biological Function Analysis
To further explore the potential molecular mechanisms of SPP1, UHRF1, and HEY1, we first established the PPI network based on SPP1, UHRF1, HEY1, and other DEGs. As shown in Figure 4A, the PPI network included SPP1, UHRF1, HEY1, and 143 other DEGs. Notably, we found that all three key DNA methylation-regulated genes could affect TP53, while both UHRF1 and HEY1 could influence BMP4 (Figure 4A). Moreover, we found that the genes in the PPI network were mainly involved in cell division (Figure 4B).
 |
Figure 4 PPI and GeneMANIA network analysis. (A) PPI network of key DNA methylation-regulated genes and DEGs. (B) GeneMANIA network showed the interactions and biological process of key DNA methylation-regulated genes and DEGs. |
To fully analyze the roles of SPP1, UHRF1, and HEY1 in HB, we further investigated the biological functions of the DEGs. In terms of BPs, the DEGs were mainly involved in small molecule catabolic processes, carboxylic acid biosynthetic processes, and organic acid biosynthetic processes (Figure 5A). In terms of cellular components, the DEGs were mainly related to collagen-containing extracellular matrix, endoplasmic reticulum lumen, and cytoplasmic vesicle lumen (Figure 5A). In terms of molecular function, the DEGs were mainly associated with coenzyme binding, oxidoreductase activity, and iron ion binding (Figure 5A). In terms of the KEGG pathways, the DEGs were mainly related to the cancer-related signaling pathways, such as the cell cycle, PPAR signaling pathway, and p53 signaling pathway (Figure 5B). Notably, we found that both the cell cycle and p53 signaling pathway were related to TP53, which might be regulated by SPP1, UHRF1, and HEY1 (Figures 5B and 6A, B).
 |
Figure 5 GO annotation and KEGG pathway analysis of DEGs. (A) the GO terms related to DEGs. (B) the enriched KEGG pathways in DEGs. |
 |
Figure 6 The regulatory mechanisms of cell cycle and P53 signaling pathway. (A) cell cycle signaling pathway. (B) P53 signaling pathway. |
Methylation Levels of the Key DNA Methylation-Regulated Genes
We further investigated the methylation sites and regions of SPP1, UHRF1, and HEY1. As illustrated in Figure 7, SPP1, UHRF1, and HEY1 exhibited three, four, and five hypomethylated sites, respectively, in the HB samples when compared with those in the normal liver samples. Peculiarly, the methylation sites of UHRF1 and HEY1 were located in the body regions of the genes; the methylation site of SPP1 was located in the 1stExon or 5ʹUTR region; and the cg11701868 site (chr19: 4912006) of SPP1 was located in the transcription enhancer region (Figure 7).
 |
Figure 7 The methylation sites and regions of key DNA methylation-regulated genes and the Circos plot showed the relationship between DNA methylation and gene expression. (A) the methylation sites and regions of SPP1. (B) the methylation sites and regions of UHRF1. (C) the methylation sites and regions of HEY1. (D) the Circos plot showed the relationship between DNA methylation and gene expression; The first layer (outermost) is the chromosome; The second layer is the heatmap of gene expression in HB and normal liver samples with the outer circle as normal liver samples and the inner circle as HB samples; The third layer is the histogram of the gene expression change (logFC) in HB samples compared with normal liver samples, and blue represents downregulation and red represents upregulation; The fourth layer is the histogram of the mean difference of DMRs in in HB samples compared with normal liver samples, and blue represents demethylation and red represents supermethylation; The fifth layer is the number of CpG in the DMR, and the horizontal axis is chromosome and the vertical axis is CpG number. |
Expression Levels and Diagnostic Significance of the Key DNA Methylation-Regulated Genes
We found that SPP1, UHRF1, and HEY1 were upregulated in the HB samples compared with those in the normal liver samples from the GSE131329 dataset (Figure 8A). Moreover, we found that all of them were also upregulated in the HB samples compared with those in the normal liver samples from the GSE133039 dataset (Figure 8B). Next, we investigated whether SPP1, UHRF1, and HEY1 could differentiate the HB samples from the normal liver samples. Interestingly, both the ROC curves for SPP1, UHRF1, and HEY1 from the GSE131329 and GSE133039 datasets showed that all areas under the curves were greater than 0.7 (Figure 8C and D). Furthermore, we found that UHRF1 was upregulated in the HB samples with metastasis compared with that in the HB samples without metastasis (Figure S3).
 |
Figure 8 Expression levels and diagnostic significance of the key DNA methylation-regulated genes. (A) expression levels of key DNA methylation-regulated genes in the GSE131329 dataset. (B) expression levels of key DNA methylation-regulated genes in the GSE133039 dataset. (C) ROC curves in the GSE131329 dataset. (D) ROC curves in the GSE133039 dataset. **P < 0.01, ***P < 0.001, ****P < 0.0001. |
Discussion
HB is a markedly heterogeneous tumor because of its composition, including many tumors originating from different immature liver precursors, such as hepatocytes and biliary and other epithelial or mesenchymal cells.24,25 It has been reported that HB patients with different histological subgroups can have a variety of clinical outcomes.25–28 Moreover, other clinicopathological parameters, including tumor stage, distant metastasis, multifocality, patient age, and birth weight, can also affect the prognosis of HB.29,30 However, the molecular mechanisms underlying HB have not been fully elucidated. Increasing evidence has revealed that comprehensive analysis of DNA methylation and gene expression can provide new insights into the molecular mechanisms of tumorigenesis and tumor development and identify novel biomarkers.31–33 Therefore, we aimed to further analyze the molecular mechanism and screen for novel biomarkers of HB by integrating DNA methylation and gene expression data.
In our study, we first identified 24,460 DMSs, including 4209 hypermethylated and 20,251 hypomethylated sites, in the HB samples compared with those in the normal liver samples (Figure 2C and D), indicating that patients with HB exhibit global DNA hypomethylation, which is consistent with the results of current studies.19,22,34,35 Moreover, 22 hypomethylated and upregulated genes and 19 hypermethylated and downregulated genes were regarded as the DNA methylation-regulated genes (Figure 3A and B). We also found that ALDOB, CDC20, CXCL2, GC, GPD1, HSD17B13, SLC1A5, SPP1, TTC36, TTYH3, UHRF1, HEY1, and SKA2 were associated with the survival of the patients with liver cancer. Thus, we speculated that these genes may play key roles in HB. Finally, we identified three genes (SPP1, UHRF1, and HEY1) as the key DNA methylation-regulated genes based on the correlation found between the genes and diseases. Although methylation and transcriptome data were derived from different samples, we found that SPP1, UHRF1, and HEY1 were upregulated in the HB samples compared with those in the normal liver samples from both the GSE131329 and GSE133039 datasets (Figure 8A and B); this indicates that SPP1, UHRF1, and HEY1 may play important roles in HB. In addition, the ROC curves indicated that SPP1, UHRF1, and HEY1 could be used as diagnostic biomarkers of HB (Figure 8C and D).
To our knowledge, SPP1 has rarely been studied in patients with HB; our study is the first to show that SPP1 might be associated with HB through abnormally methylated regulation. Consistently, it has been suggested to be upregulated in different malignancies, such as colorectal cancer, thyroid cancer, and hepatocellular carcinoma.31,36,37 Interestingly, SPP1 is hypomethylated and upregulated in thyroid cancer and hepatocellular carcinoma.31,37 It can also act as a diagnostic and prognostic biomarker of hepatocellular carcinoma.31 It has been revealed that UHRF1 is overexpressed in HB samples compared with that in control samples and can serve as a prognostic biomarker and potential molecular target for HB.38,39 Similarly, HEY1 has been suggested to play a key role in glioblastoma and act as a potential target for future glioblastoma therapy.40 It is also associated with metastasis of breast cancer.41 In summary, our study found that SPP1, UHRF1, and HEY1 may play key roles in HB, and their expression changes might be caused by methylation.
The PPI network showed that SPP1, UHRF1, and HEY1 could affect TP53 and that both UHRF1 and HEY1 could influence BMP4 (Figure 4A). TP53 has been reported to play a key role in HB.42,43 Moreover, BMP4 has been reported to affect the progression of bladder cancer and breast cancer.44,45 Therefore, we speculated that SPP1, UHRF1, and HEY1 may affect the development of HB by regulating TP53 and BMP4. Conversely, the functional enrichment analysis indicated that all three of them may affect the development of HB by regulating TP53-regulated pathways, such as the cell cycle and p53 signaling pathway (Figures 5B and 6A, B). Thus, SPP1, UHRF1, and HEY1 may affect the development of HB by regulating the cell cycle and p53 signaling pathway.
Conclusion
In conclusion, we identified three key DNA methylation-regulated genes, including SPP1, UHRF1, and HEY1, which may be regarded as novel and potential diagnostic biomarkers and therapeutic targets for HB. However, further studies are needed to concentrate on the regulatory mechanisms of these genes in HB occurrence and development.
Data Sharing Statement
Publicly available datasets were analyzed in this study. This data can be found in GEO database (https://www.ncbi.nlm.nih.gov/geo/). Moreover, the datasets analyzed during the present study were available from the corresponding author based on reasonable request.
Ethics Approval and Consent to Participate
This study was approved by the Ethics Committee of Shenzhen Children’s Hospital.
Acknowledgments
We are grateful for the support from the National Key Clinical Specialty Programs (General Surgery & Oncology) and the Key Laboratory of Early Prevention & Treatment for Regional High-Incidence-Tumor (Guangxi Medical University), Ministry of Education, China.
Author Contributions
All authors made a significant contribution to the work reported, whether that is in the conception, study design, execution, acquisition of data, analysis and interpretation, or in all these areas; took part in drafting, revising or critically reviewing the article; gave final approval of the version to be published; have agreed on the journal to which the article has been submitted; and agree to be accountable for all aspects of the work.
Funding
The study was supported by grants from the Sanming Project of Medicine in Shenzhen (No.SZSM201812055), Medical Scientific Research Foundation of Guangdong Province (A2020629), Shenzhen Key Medical Discipline Construction Fund (No. SZXK035), Shenzhen Fund for Guangdong Provincial High-level Clinical Key Specialties (No. SZXK035), National Nature Science Foundation of China (No.:81800489, 81560535, 81072321, 30760243, 30460143 and 30560133), 2009 Program for New Century Excellent Talents in University (NCET), Guangxi Nature Sciences Foundation (No.: GuiKeGong 1104003A-7), and Guangxi Health Ministry Medicine Grant (Key-Scientific Research-Grant Z201018). The present study is also partly supported by Self-raised Scientific Research Fund of the Health and Family Planning Commission of Guangxi Zhuang Autonomous Region (Z2016318), The Basic Ability Improvement Project for Middle-aged and Young Teachers in Colleges and Universities in Guangxi (2018KY0110), Innovation Project of Guangxi Graduate Education (JGY2018037), and Research Institute of Innovative Think-tank in Guangxi Medical University (The gene-environment interaction in hepatocarcinogenesis in Guangxi HCCs and its translational applications in the HCC prevention).
Disclosure
All authors declare that they are no competing interests.
References
1. Bosman FT, Carneiro F, Hruban RH, Theise ND. WHO Classification of Tumours of the Digestive System. World Health Organization; 2010.
2. Spector LG, Birch J. The epidemiology of hepatoblastoma. Pediatr Blood Cancer. 2012;59(5):776–779. doi:10.1002/pbc.24215
3. Dong R, Jia D, Xue P, et al. Genome-wide analysis of long noncoding RNA (lncRNA) expression in hepatoblastoma tissues. PLoS One. 2014;9(1):e85599. doi:10.1371/journal.pone.0085599
4. Baheti AD, Chapman T, Rudzinski E, Albert CM, Stanescu AL. Diagnosis, histopathologic correlation and management of hepatoblastoma: what the radiologist needs to know. Clin Imaging. 2018;52:273–279. doi:10.1016/j.clinimag.2018.08.009
5. Jost E, Wilop S, Herman JG, Osieka R, Galm O. Aberrant DNA methylation of the transcription factor C/EBPalpha in acute myelogenous leukemia. Leuk Res. 2009;33(3):443–449. doi:10.1016/j.leukres.2008.07.027
6. Galm O, Wilop S, Lüders C, et al. Clinical implications of aberrant DNA methylation patterns in acute myelogenous leukemia. Ann Hematol. 2005;84(Suppl 1):39–46. doi:10.1007/s00277-005-0005-0
7. Liu W, Chen S, Liu B. Diagnostic and prognostic values of serum exosomal microRNA-21 in children with hepatoblastoma: a Chinese population-based study. Pediatr Surg Int. 2016;32(11):1059–1065. doi:10.1007/s00383-016-3960-8
8. Bird A. DNA methylation patterns and epigenetic memory. Genes Dev. 2002;16(1):6–21. doi:10.1101/gad.947102
9. Wilting RH, Dannenberg JH. Epigenetic mechanisms in tumorigenesis, tumor cell heterogeneity and drug resistance. Drug Resist Updat. 2012;15(1–2):21–38. doi:10.1016/j.drup.2012.01.008
10. Huang ZH, Hu Y, Hua D, Wu YY, Song MX, Cheng ZH. Quantitative analysis of multiple methylated genes in plasma for the diagnosis and prognosis of hepatocellular carcinoma. Exp Mol Pathol. 2011;91(3):702–707. doi:10.1016/j.yexmp.2011.08.004
11. Lambert MP, Paliwal A, Vaissière T, et al. Aberrant DNA methylation distinguishes hepatocellular carcinoma associated with HBV and HCV infection and alcohol intake. J Hepatol. 2011;54(4):705–715. doi:10.1016/j.jhep.2010.07.027
12. Yang X, Gao L, Zhang S. Comparative pan-cancer DNA methylation analysis reveals cancer common and specific patterns. Brief Bioinform. 2017;18(5):761–773. doi:10.1093/bib/bbw063
13. Esteller M. Epigenetics in cancer. N Engl J Med. 2008;358(11):1148–1159. doi:10.1056/NEJMra072067
14. Robertson AG, Kim J, Al-Ahmadie H, et al. Comprehensive molecular characterization of muscle-invasive bladder cancer. Cell. 2017;171(3):540–556. e525. doi:10.1016/j.cell.2017.09.007
15. Chung W, Bondaruk J, Jelinek J, et al. Detection of bladder cancer using novel DNA methylation biomarkers in urine sediments. Cancer Epidemiol Biomarkers Prev. 2011;20(7):1483–1491. doi:10.1158/1055-9965.EPI-11-0067
16. Dudziec E, Goepel JR, Catto JW. Global epigenetic profiling in bladder cancer. Epigenomics. 2011;3(1):35–45. doi:10.2217/epi.10.71
17. Dulaimi E, Uzzo RG, Greenberg RE, Al-Saleem T, Cairns P. Detection of bladder cancer in urine by a tumor suppressor gene hypermethylation panel. Clin Cancer Res. 2004;10(6):1887–1893. doi:10.1158/1078-0432.CCR-03-0127
18. Zhu Y, Cao X, Zhang X, Chen Q, Wen L, Wang P. DNA methylation-mediated klotho silencing is an independent prognostic biomarker of head and neck squamous carcinoma. Cancer Manag Res. 2019;11:1383. doi:10.2147/CMAR.S188415
19. Honda S, Minato M, Suzuki H, et al. Clinical prognostic value of DNA methylation in hepatoblastoma: four novel tumor suppressor candidates. Cancer Sci. 2016;107(6):812–819. doi:10.1111/cas.12928
20. Sakamoto LH, De Camargo B, Cajaiba M, Soares FA, Vettore AL. MT1G hypermethylation: a potential prognostic marker for hepatoblastoma. Pediatr Res. 2010;67(4):387–393. doi:10.1203/PDR.0b013e3181d01863
21. Sekiguchi M, Seki M, Kawai T, et al. Integrated multiomics analysis of hepatoblastoma unravels its heterogeneity and provides novel druggable targets. NPJ Precis Oncol. 2020;4(1):1–12. doi:10.1038/s41698-020-0125-y
22. Carrillo-Reixach J, Torrens L, Simon-Coma M, et al. Epigenetic footprint enables molecular risk stratification of hepatoblastoma with clinical implications. J Hepatol. 2020;73(2):328–341. doi:10.1016/j.jhep.2020.03.025
23. Edgar R, Lash A. 6. The Gene Expression Omnibus (GEO): a gene expression and hybridization repository. In: The NCBI Handbook [Internet]. National Center for Biotechnology Information (US); 2003.
24. Rowland JM. Hepatoblastoma: assessment of criteria for histologic classification. Med Pediatr Oncol. 2002;39(5):478–483. doi:10.1002/mpo.10171
25. Stocker JT, Ishak KG. Hepatoblastoma. In: Neoplasms of the Liver; 1987:127–136.
26. Kremer N, Walther AE, Tiao GM. Management of hepatoblastoma: an update. Curr Opin Pediatr. 2014;26(3):362–369. doi:10.1097/MOP.0000000000000081
27. Czauderna P, Lopez-Terrada D, Hiyama E, Häberle B, Malogolowkin MH, Meyers RL. Hepatoblastoma state of the art: pathology, genetics, risk stratification, and chemotherapy. Curr Opin Pediatr. 2014;26(1):19–28. doi:10.1097/MOP.0000000000000046
28. McCarville MB, Roebuck DJ. Diagnosis and staging of hepatoblastoma: imaging aspects. Pediatr Blood Cancer. 2012;59(5):793–799. doi:10.1002/pbc.24221
29. Maibach R, Roebuck D, Brugieres L, et al. Prognostic stratification for children with hepatoblastoma: the SIOPEL experience. Eur J Cancer. 2012;48(10):1543–1549. doi:10.1016/j.ejca.2011.12.011
30. Aronson DC, Schnater JM, Staalman CR, et al. Predictive value of the pretreatment extent of disease system in hepatoblastoma: results from the International Society of Pediatric Oncology Liver Tumor Study Group SIOPEL-1 study. J Clin Oncol. 2005;23(6):1245–1252. doi:10.1200/JCO.2005.07.145
31. Long J, Chen P, Lin J, et al. DNA methylation-driven genes for constructing diagnostic, prognostic, and recurrence models for hepatocellular carcinoma. Theranostics. 2019;9(24):7251–7267. doi:10.7150/thno.31155
32. Bai Y, Wei C, Zhong Y, et al. Development and validation of a prognostic nomogram for gastric cancer based on DNA methylation-driven differentially expressed genes. Int J Biol Sci. 2020;16(7):1153–1165. doi:10.7150/ijbs.41587
33. Cui J, Wang L, Zhong W, et al. Development and validation of epigenetic signature predict survival for patients with laryngeal squamous cell carcinoma. DNA Cell Biol. 2021;40(2):247–264. doi:10.1089/dna.2020.5789
34. Maschietto M, Rodrigues TC, Kashiwabara AY, et al. DNA methylation landscape of hepatoblastomas reveals arrest at early stages of liver differentiation and cancer-related alterations. Oncotarget. 2016;8(58):97871–97889. doi:10.18632/oncotarget.14208
35. Cui X, Liu B, Zheng S, Dong K, Dong R. Genome-wide analysis of DNA methylation in hepatoblastoma tissues. Oncol Lett. 2016;12(2):1529–1534. doi:10.3892/ol.2016.4789
36. Xu C, Sun L, Jiang C, et al. SPP1, analyzed by bioinformatics methods, promotes the metastasis in colorectal cancer by activating EMT pathway. Biomed Pharmacother. 2017;91:1167–1177. doi:10.1016/j.biopha.2017.05.056
37. Tu Y, Fan G, Xi H, et al. Identification of candidate aberrantly methylated and differentially expressed genes in thyroid cancer. J Cell Biochem. 2018;119(11):8797–8806. doi:10.1002/jcb.27129
38. Rivas MP, Aguiar TFM, Fernandes GR, et al. TET upregulation leads to 5-hydroxymethylation enrichment in hepatoblastoma. Front Genet. 2019;10:553. doi:10.3389/fgene.2019.00553
39. Beck A, Trippel F, Wagner A, et al. Overexpression of UHRF1 promotes silencing of tumor suppressor genes and predicts outcome in hepatoblastoma. Clin Epigenetics. 2018;10:27. doi:10.1186/s13148-018-0462-7
40. Tsung AJ, Guda MR, Asuthkar S, et al. Methylation regulates HEY1 expression in glioblastoma. Oncotarget. 2017;8(27):44398–44409. doi:10.18632/oncotarget.17897
41. Park SB, Hwang KT, Chung CK, Roy D, Yoo C. Causal Bayesian gene networks associated with bone, brain and lung metastasis of breast cancer. Clin Exp Metastasis. 2020;37(6):657–674. doi:10.1007/s10585-020-10060-0
42. Ohnishi H, Kawamura M, Hanada R, et al. Infrequent mutations of the TP53 gene and no amplification of the MDM2 gene in hepatoblastomas. Genes Chromosomes Cancer. 1996;15(3):187–190. doi:10.1002/(SICI)1098-2264(199603)15:3<187::AID-GCC8>3.0.CO;2-Z
43. Woodfield SE, Shi Y, Patel RH, et al. MDM4 inhibition: a novel therapeutic strategy to reactivate p53 in hepatoblastoma. Sci Rep. 2021;11(1):2967. doi:10.1038/s41598-021-82542-4
44. Martínez VG, Rubio C, Martínez-Fernández M, et al. BMP4 induces M2 macrophage polarization and favors tumor progression in bladder cancer. Clin Cancer Res. 2017;23(23):7388–7399. doi:10.1158/1078-0432.CCR-17-1004
45. Eckhardt BL, Cao Y, Redfern AD, et al. Activation of canonical BMP4-SMAD7 signaling suppresses breast cancer metastasis. Cancer Res. 2020;80(6):1304–1315. doi:10.1158/0008-5472.CAN-19-0743
 © 2021 The Author(s). This work is published and licensed by Dove Medical Press Limited. The
full terms of this license are available at https://www.dovepress.com/terms
and incorporate the Creative Commons Attribution
- Non Commercial (unported, 3.0) License.
By accessing the work you hereby accept the Terms. Non-commercial uses of the work are permitted
without any further permission from Dove Medical Press Limited, provided the work is properly
attributed. For permission for commercial use of this work, please see paragraphs 4.2 and 5 of our Terms.
© 2021 The Author(s). This work is published and licensed by Dove Medical Press Limited. The
full terms of this license are available at https://www.dovepress.com/terms
and incorporate the Creative Commons Attribution
- Non Commercial (unported, 3.0) License.
By accessing the work you hereby accept the Terms. Non-commercial uses of the work are permitted
without any further permission from Dove Medical Press Limited, provided the work is properly
attributed. For permission for commercial use of this work, please see paragraphs 4.2 and 5 of our Terms.