Back to Journals » Journal of Inflammation Research » Volume 17
Integrative Analyses of Pyrimidine Salvage Pathway-Related Genes Revealing the Associations Between UPP1 and Tumor Microenvironment
Authors Li Y, Jiang M, Wei Y, He X, Li G, Lu C, Ge D
Received 14 September 2023
Accepted for publication 19 December 2023
Published 6 January 2024 Volume 2024:17 Pages 101—119
DOI https://doi.org/10.2147/JIR.S440295
Checked for plagiarism Yes
Review by Single anonymous peer review
Peer reviewer comments 2
Editor who approved publication: Professor Ning Quan
Yin Li,1,* Manling Jiang,2,3,* Yongqi Wei,1,* Xiang He,2 Guoping Li,2,* Chunlai Lu,1 Di Ge1
1Department of Thoracic Surgery, Zhongshan Hospital, Fudan University, Shanghai, People’s Republic of China; 2Laboratory of Allergy and Precision Medicine, Chengdu Institute of Respiratory Health, Affiliated Hospital of Southwest Jiaotong University, The Third People’s Hospital of Chengdu, Chengdu, Sichuan, People’s Republic of China; 3State Key Laboratory of Quality Research in Chinese Medicine, Macau University of Science & Technology, Taipa, Macao Special Administrative Region of China
*These authors contributed equally to this work
Correspondence: Chunlai Lu; Di Ge, Email [email protected]; [email protected]
Background: The pyrimidine salvage pathway plays a critical role in tumor progression and patient outcomes. The roles of pyrimidine salvage pathway-related genes (PSPGs) in cancer, however, are not fully understood. This study aims to depict the characteristics of PSPGs across various cancers.
Methods: An integrative pan-cancer analysis of six PSPGs (CDA, UCK1, UCK2, UCKL1, UPP1, and UPP2) was conducted using TCGA data, single-cell RNA sequencing datasets, and patient samples. Single-cell transcriptome analysis and RT-qPCR were used to validate the relation between UPP1 and cytokines. Flow cytometry was performed to validate the role of UPP1 in immune checkpoint regulation. The correlation between UPP1 and tumor associated neutrophils (TAN) were investigated and validated by single-cell transcriptome analysis and tissue microarrays (TMAs).
Results: PSPGs showed low mutation rates but significant copy number variations, particularly amplifications in UCKL1, UPP1, and UCK2 across various cancers. DNA methylation patterns varied, with notable negative correlations between methylation and gene expression in UPP1. PSPGs were broadly up-regulated in multiple cancers, with correlations to clinical staging and prognosis. Proteomic data further confirmed these findings. Functional analysis revealed PSPGs’ associations with tumor proliferation, metastasis, and various signaling pathways. UPP1 showed strong correlations with the tumor microenvironment (TME), particularly with cytokines, immune checkpoints, and various immune cells. Single-cell transcriptome analysis confirmed these associations, highlighting UPP1’s influence on cytokine expression and immune checkpoint regulation. In esophageal squamous cell carcinoma (ESCC), UPP1-high tumor cells were significantly associated with immunosuppressive cells in the TME. Spatial analysis using TMAs revealed that UPP1+ tumor cells were predominantly located at the invasive margin and closely associated with neutrophils, correlating with poorer patient prognosis.
Conclusion: Our study depicted the multi-dimensional view of PSPGs in cancer, with a particular focus on UPP1’s role in the TME. Targeting UPP1 holds promise as a potential strategy for cancer therapy.
Keywords: pyrimidine salvage pathways, UPP1, microenvironment
Introduction
In non-malignant cells, nucleotide synthesis predominantly depends on the de novo synthesis pathway, which employs amino acids and glucose and is characterized by substantial ATP consumption.1 Interestingly, to circumvent the high energy requirements of replication stress, cancer cells can adapt by shifting their reliance from the de novo synthesis pathway mainly to the salvage pathways.2 Pyrimidine biosynthesis pathways have been viewed as promising targets, and a variety of agents have been developed and applied in cancer treatments.3,4 However, traditional agents that target nucleotide biosynthesis can result in undesirable outcomes due to the activation of nucleoside salvage pathways.5
The pyrimidine salvage pathway employs extracellular nucleosides and nucleobases, as well as intracellularly recycled nucleic acids (UMP, CMP, TMP), to efficiently synthesize nucleotides.6 The initial step of the pyrimidine salvage synthesis involves cytidine deaminase (CDA) catalyzing the deamination of cytidine and deoxycytidine into uridine and deoxyuridine, respectively.7 Following this, uridine-cytidine kinases (UCKs) facilitate the phosphorylation of uridine and cytidine, converting them into uridine monophosphate (UMP) and cytidine monophosphate (CMP) respectively.8,9 Uridine phosphorylases UPP1/UPP2 also contribute to the salvage pathway by cleaving uridine into uracil.10,11 Collectively, these processes enable the pyrimidine salvage pathway to effectively synthesize nucleotides for DNA repair and replication, thereby bolstering the proliferation of cells.
The genes involved in the pyrimidine salvage pathway are often associated with oncogenic functions and are frequently linked with poor prognosis.12–14 For example, Heo et al identified CDA as a key target to overcome ALK inhibitor resistance in ALK fusion-positive non-small-cell lung cancer, highlighting the potential of epigenome-related nucleosides in treating drug-resistant NSCLC.13 Matchett et al revealed that UCKL1 is up-regulated in tumor cells, offering protection against NK cell activity, while inhibiting UCKL1 with siRNA in lymphoma and leukemia cells resulted in reduced cell proliferation and metastasis, positioning UCKL1 as a promising target for tumor growth inhibition and metastasis prevention.15 In addition, Cai et al examined UCK2’s expression patterns and prognostic value in liver cancer clinical samples, revealing that UCK2 not only promoted cell proliferation metabolically but also facilitated liver cancer metastasis non-catalytically through the EGFR-AKT pathway. Recent studies have also shed light on the role of UPP1 in cancer biology. One recent study demonstrated that ribose, liberated by UPP1, fueled central carbon metabolism and supported the growth of pancreatic ductal adenocarcinoma under glucose-restricted conditions. This finding implicated UPP1 in the metabolic adaptation strategies of cancer cells. In addition, the inhibition of UPP1 was observed to increase the infiltration of anti-tumor T cells, pointing towards a significant interaction between UPP1 and the tumor microenvironment (TME).11 This evidence underscored the potential of UPP1 as a therapeutic target within the TME. Another study extended the understanding of UPP1’s role in cancer, discovering an association between UPP1 and markers of immune inhibition in lower-grade glioma.16 These findings collectively emphasize the multifaceted roles of UPP1 in cancer progression and the immune response, warranting further investigation into its therapeutic potential.
Pan-cancer analysis is a comprehensive approach that involves studying and comparing genetic and molecular alterations of genes across various cancer types.17–23 This approach focuses on identifying similarities and differences in genomic and molecular profiles across cancers, aiding in uncovering shared pathways or mechanisms underlying cancer development and progression. It is particularly useful for identifying biomarkers consistent across multiple cancer types, which can be crucial for diagnosis, prognosis, or as therapeutic targets. Additionally, pan-cancer analysis enhances the understanding of cancer biology by providing insights into the collective characteristics of cancers, which might not be evident when examining individual cancer types.
In this study, we included six pyrimidine salvage pathway-related genes (PSPGs), including CDA, UCK1, UCK2, UCKL1, UPP1, and UPP2, and analyzed these genes from a pan-cancer perspective. It was revealed that PSPGs were broadly up-regulated in multiple cancers, with correlations to clinical staging and prognosis. Notably, we found a significant correlation between UPP1 and TME, with its expression showing notable correlations with cytokines and immune checkpoints. In our single-cell RNA sequencing (scRNA-seq) data of esophageal squamous cell carcinoma (ESCC), we discovered a close association between UPP1 and immunosuppressive cell populations within the TME. Additionally, using ESCC tissue microarrays (TMAs), we found a tight connection between UPP1 and neutrophils. These results further emphasized the relationship between UPP1 and TME.
Materials and Methods
Ethics
Patients donating surgical tissues provided informed consent. This study was approved by the ethics committee on human research of Zhongshan Hospital, Fudan University (B2020-332R; B2020-412R), and conducted in accordance with the principles of the Declaration of Helsinki.
ESCC Patient Samples and Single-Cell RNA Sequencing
ESCC samples collected from the clinical site were minced into small pieces and subjected to enzymatic digestion in 5mL of Advanced DMEM/F-12 (Gibco, 12634–010) supplemented with 5mg/mL collagenase II (Gibco, 17101015), and 100ug/mL DNase I (Roche, 11284932001) for 1h at 37°C on a shaking platform (120 rpm). Then, samples were centrifuged at 400xg for 5 minutes. After removing the supernatant, Advanced DMEM/F-12 supplemented with 10% FBS was added to stop the enzymatic digestion. Cells were pipetted up and down to dissociate tissue fragments. Cell suspensions were passed through a 70μm cell strainer and the cells were washed with PBS twice. Then, the cells were resuspended in 1 mL red blood cell lysis buffer. After that, the cells were washed with PBS twice and centrifuged at 400xg for 5 minutes. After removing the supernatant, the pellet was resuspended in 5 mL PBS. Finally, 10μL of suspension was counted. Trypan blue was used to quantify live cells. The cell suspensions were then subjected to Chromium Next GEM Single Cell Reagent Kits with a cell recovery target of 8000, following the manufacturer’s instructions (10X Genomics). Libraries were sequenced on an Illumina NovaSeq 6000 platform.
Tissue microarrays (TMAs) from ESCC patients who underwent radical esophagectomy at Zhongshan Hospital between 2008 and 2009 were used to verify the correlation between UPP1+/UPP1- tumor cells and neutrophils. Follow-up information for these patients were collected as previously described.24
Public Data Collection
The multi-omics data from The Cancer Genome Atlas (TCGA) were obtained from Xena public data hubs.25 This includes somatic mutation data (Gene level non-silent mutation, Pan-Cancer Atlas Hub), copy number variation data (gene-level copy number, GISTIC2_thresholded, TCGA Hub), gene expression data (Batch effects normalized mRNA data, Pan-Cancer Atlas Hub), as well as phenotype and clinical information (Curated clinical data, Pan-Cancer Atlas Hub). DNA methylation data were downloaded from the SMART App.26 Additionally, cancer cell expression data were sourced from the Cancer Cell Line Encyclopedia (CCLE) by the Broad Institute. The proteomic data were sourced from the Clinical Proteomic Tumor Analysis Consortium (CPTAC). In addition, the proteomic data of ESCC (Li et al), LIHC (Gao et al), and LUAD (Xu et al) were collected from previously published proteomic resources.27–29 scRNA-seq data for BRCA was downloaded from ArrayExpress, under accession number E-MTAB-8107. The scRNA-seq data for BLCA was obtained from the Sequence Read Archive (SRA), under BioProject PRJNA662018.30 The scRNA-seq data for LIHC data was sourced from the Gene Expression Omnibus (GEO) database, under the accession number GSE149614.31
Mutation and Copy Number Variation Analysis
The mutation frequency was determined as the fraction of tumor samples carrying a mutation in a specific gene. Non-silent mutations, encompassing Missense_Mutation, In_Frame_Del, Nonsense_Mutation, Splice_Site, In_Frame_Ins, Frame_Shift_Del, Nonstop_Mutation, Frame_Shift_Ins, Translation_Start_Site, and Large deletion, were taken into account in calculating mutation frequency. For the analysis of copy number variations (CNVs), we utilized GISTIC2 thresholded gene-level data. This thresholded data offered five levels of CNV: homozygous deletion (−2), single copy deletion (−1), diploid normal copy (0), low-level copy number amplification (+1), and high-level copy number amplification (+2). In our analysis, genes assigned positive values of +1 and +2 were classified as CNV amplification, while those with negative values of −1 and −2 were categorized as CNV loss. CNV amplification frequency refers to the proportion of samples exhibiting CNV amplification relative to the total number of samples. CNV loss frequency indicates the proportion of samples showing CNV loss out of the total number of samples. The CNV frequency was defined as the difference between the CNV amplification frequency and the CNV loss frequency. A value greater than 0 indicates that copy number amplification predominates, while a value less than 0 suggests that copy number loss is the primary occurrence.18
Functional Enrichment Analysis
For functional enrichment analysis, we used gene sets downloaded from the MSigDB database.32 These gene sets include those from KEGG, HALLMARK, REACTOME, and gene sets curated from various sources, including online pathway databases and the biomedical literature (C2: curated gene sets). We obtained metabolism-related gene sets from the scMetabolism R package.33 The gene sets related to TME cell population were collected from singleR R package. We used the Gene Set Variation Analysis (GSVA) method to calculate the scores of these gene sets, then computed their correlation with PSPGs expression in each tumor.
Single-Cell RNA Sequencing Data Analysis
We used the Cell Ranger toolkit (version 6.1.2), provided by 10x Genomics, to process the raw scRNA-seq data. This toolkit was used to align reads to the human reference genome (GRCh38) to generate cell matrix files. We then loaded the processed data into R using Seurat (version 4.0.5).
Cells with more than 200 detected genes were selected for further analysis. We considered cells with more than 20% of their transcripts derived from mitochondria as apoptotic, so they were excluded. Doublets were removed for each sample using DoubletFinder with default settings.34
After discarding low-quality cells, we applied Harmony to integrate different samples and performed unsupervised clustering using the ‘FindClusters’ function in Seurat.35 This function used the top 30 PCA components with a resolution parameter set to 0.8. The markers for each cell cluster were identified using the Seurat ‘FindAllMarkers’ function. We used SingleR for annotations of cell clusters. For the identification of tumor cells, we used EPCAM+/ALB+ cells from normal samples as a reference. We calculated the copy number variations (CNVs) of other EPCAM+/ALB+ cells from non-normal samples using inferCNV. The top 5% cells with the highest CNV scores were defined as ‘highly-confident’ malignant cells. Subsequently, we calculated the correlation of each cell’s CNV with the average of the top 5% of cells. Cells showing correlation coefficients greater than 0.15 were classified as malignant.36 To analyze the role of UPP1 in tumor cells, we divided the tumor cells into UPP1 high or low expression cell groups based on the median expression of UPP1 in tumor cells.
For the single-cell data analysis of ESCC, we further clustered the immune cell group, fibroblast group, and endothelial cell group. For the further clustering of immune cells, we chose a resolution parameter of 0.6. For fibroblasts, we used a resolution parameter of 0.4, and for endothelial cells, 0.3. We then defined the characteristics of the subgroups based on the marker genes and highly expressed genes of the subgroup cells.
Cell-Cell Communication Analysis
In order to investigate co-occurrence relationship between UPP1high tumor cells and other cell populations within TME in ESCC, we computed the pairwise correlation values by measuring the correlation between the normalized frequency of UPP1high tumor cells and other TME cell populations across various tumor samples. We performed this analysis using the corrtest function, following the methodology stipulated in previously published literature.37 Following this, we ranked each TME cell population based on their correlation with UPP1high tumor cells. The top five cell populations, in terms of correlation, were deemed to have a significant relationship with UPP1high tumor cells. In addition, we used CellPhoneDB to analyze the interactions and cell-cell communication networks between UPP1high tumor cells and MMP11+ CAFs, SPP1+ M2 macrophages, neutrophil, IL1B+ macrophages, and Tregs.
Cell Culture and RNA Interference
Cell lines HCC827, T-24, MDA-MB-231, HuH-7, and TE-1 were cultured in RPMI-1640 media (Gibco, C11875500BT) supplemented with 10% FBS (Gibco, C0235) and 100 U/mL penicillin and 100µg/mL streptomycin, in a temperature-controlled environment at 37°C with 5% CO2. Once the cells reached 30–50% confluence in 6-well plates, they were transfected with either UPP1 siRNA or control siRNA (250 pmol per well) using transfection reagents (TransGen Biotech, FT201-01) for a duration of 24h. Following this, they were washed once with sterile PBS and then re-incubated with the normal culture medium for an additional 48h. 72 hours post-transfection, the expression level of UPP1 was evaluated using RT-qPCR. The sequences of the siRNAs used in this experiment can be found in Table S1.
Quantitative Real-Time PCR (RT-qPCR)
Total RNA was isolated from cultured cells utilizing the total RNA isolation kit (Vazyme, RC112-01), as per the manufacturer’s instructions. The genomic DNA in the total RNA was eliminated, and subsequently, the total RNA from each sample was reverse-transcribed into cDNA. The expression levels of the target mRNA were quantified using RT-qPCR, employing the 2 × Taq SYBR Green qPCR Mix (Vazyme, SQ101). The sequences of primers are shown in Table S1.
Flow Cytometry Experiments
Post 72 hours transfection, adherent cells were digested and then resuspended in PBS for subsequent staining procedures. The cell suspensions were incubated with the following fluorescently conjugated antibodies for 30 minutes: anti-PD-L1-PE (Invitrogen, 12–5982-81), anti-PD-L2-PE (Biolegend, 329606), anti-CD70-FITC (Biolegend, 355106), anti-CD47-AF700 (Biolegend, 323126), and anti-Galectin-9-FITC (Biolegend, 348912). After the staining, cells were washed once with PBS. Subsequently, 7AAD (Biolegend, 420403) was added to discriminate live cells. Flow cytometry analysis was conducted using the MA900 flow cytometer (SONY, Japan). The recorded data were analyzed using FlowJo software (Treestar, Ashland, USA).
Immunofluorescence Staining and Analysis
Paraffin-embedded tissue microarray sections were prepared for immunofluorescence staining through a series of treatments. These included dewaxing, antigen retrieval, permeabilization, and blocking. After these preparatory steps, the sections were incubated with the primary antibody against CD66b (Genetex, GTX19779) overnight. The following day, the sections were incubated with Goat Anti-Mouse IgG H&L (Alexa Fluor 647) (Abcam, ab150115) secondary antibody at room temperature for one hour to bind to the primary antibodies. Subsequently, the sections were incubated with UPP1 (Abcam, ab128854) and PanCK (Proteintech, 26411-1-AP) primary antibodies. These antibodies were conjugated with FlexAble CoraLite® 488 Antibody Labeling Kit (Proteintech, KFA001) and FlexAble CoraLite® Plus 555 Antibody Labeling Kit (Proteintech, KFA002) respectively. The antibody mix was incubated at room temperature for one hour. After the antibody incubation, DAPI was used for nuclear staining.
Slides were scanned using the OLYMPUS VS200 scanner. We then employed Visiopharm software, a leading provider of quantitative digital pathology solutions, for data analysis. The automated segmentation method was applied for TMAs segmentation. Subsequently, cells were identified using the incorporated AI-based recognition algorithm. We utilized the phenotype module to distinguish UPP1+, UPP1- tumor cells, as well as neutrophils. In cases where the proportion of tumor cells was less than 10%, and the proportion of neutrophils was less than 5%, we excluded such samples from further study. Within the remaining samples, we calculated the spatial distance between each UPP1+ or UPP1- tumor cell and the neutrophils within a 200um radius. Finally, a total of 154 patients were enrolled in subsequent analysis. For survival analysis, we used the spatial distance between UPP1+ cells and neutrophils for each patient as the indicator. We then used the survminer R package to transform this continuous distance variable into a binary variable, ie, spatially close or far. Subsequently, we investigated the relationship between spatial distance (close or far) and patient prognosis.
Statistical Analysis
Statistical analysis was performed using R software and Prism software. Differential expression analysis was performed using Wilcoxon rank sum test. Pearson correlation was used to measure the correlation between variables. Survival analysis was conducted based on the Log rank test using the survminer and survival R package. All experiment data values were reported as mean ± SEM, derived from at least three independent experiments. Student’s t-test was used for statistical analysis. All statistical tests were two-sided, and statistical significance was considered when p < 0.05.
Results
Multi-Dimensional Characteristics of Pyrimidine Salvage Pathway-Related Genes in Different Cancer Types
In this study, a total of six pyrimidine salvage pathway-related genes (PSPGs) were included (Figure 1A). First of all, we conducted a comprehensive analysis of their multi-omics features in the TCGA cohort. Overall, the mutation rates of PSPGs were generally low, not surpassing 5% in any of the cancer types (Figure 1B and Table S2). Nevertheless, a slight increase was observed with the UCK2 gene in cases of uterine corpus endometrial carcinoma (UCEC), albeit still limited to only 4% of the patient samples.
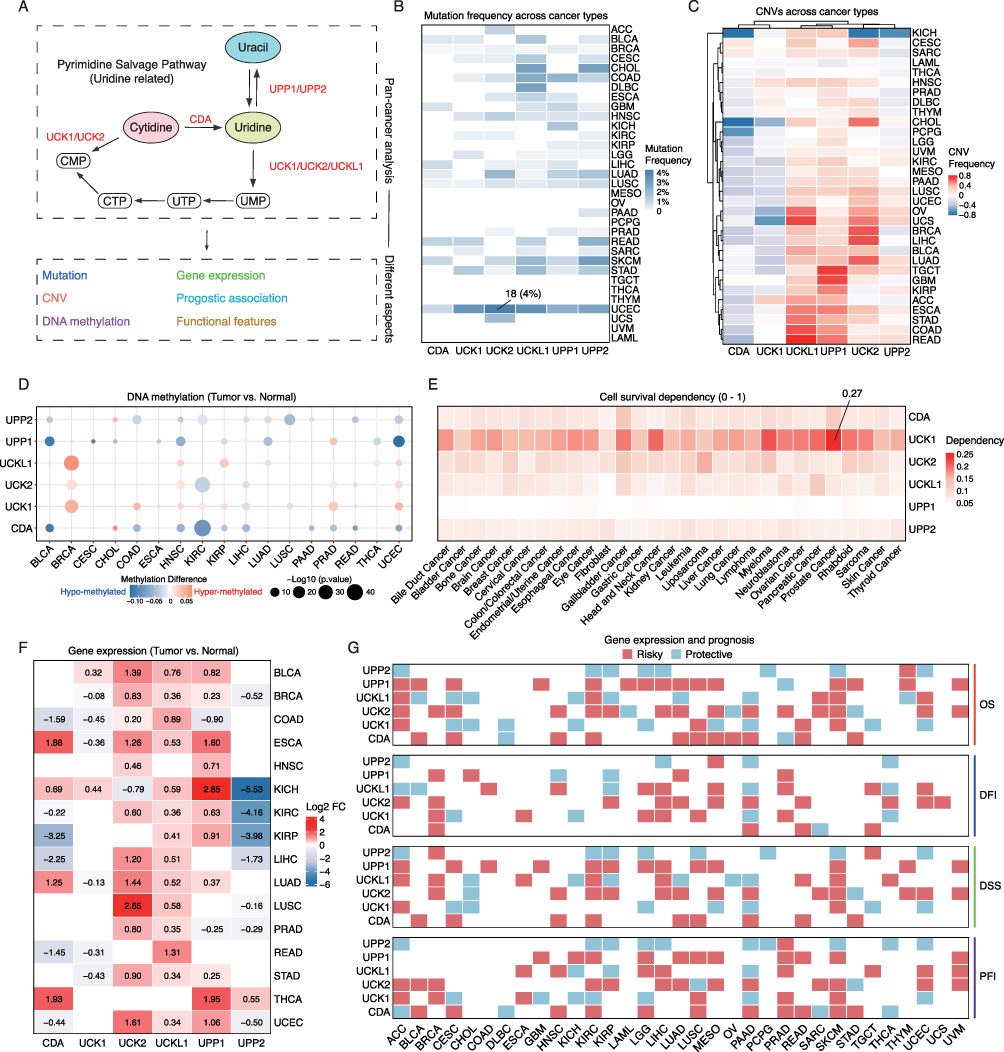 |
Figure 1 Multi-omics features of PSPGs across the pan-cancer cohort. (A) Six PSPGs (CDA, UCK1, UCK2, UCKL1, UPP1, and UPP2) were included, and their genomic features, expression characteristics, and functional relevance were analyzed in this study. (B) The mutation frequency of PSPGs in the TCGA pan-cancer cohort. The mutation frequency was determined as the proportion of tumor samples carrying a mutation in a specific gene. The overall mutation rate of PSPGs is low, with the highest being only 4% for UCK2 in UCEC, and this mutation was found in only 18 samples. (C) Characteristics of CNVs in PSPGs in the pan-cancer cohort. CNV amplification frequency refers to the proportion of samples exhibiting CNV amplification relative to the total number of samples. CNV loss frequency indicates the proportion of samples showing CNV loss out of the total number of samples. The CNV frequency refers to the difference between the CNV amplification frequency and the CNV loss frequency. A value greater than 0 indicates that copy number amplification predominates, while a value less than 0 suggests that copy number loss is the primary occurrence. (D) Comparison of the changes in DNA methylation at the gene level between tumor and normal samples. Methylation difference refers to the difference in methylation levels of a gene between tumor samples and normal samples. A positive methylation difference indicates hypermethylation (represented in red) in the tumor samples, while a negative value indicates hypomethylation (represented in blue) in the tumor samples. In the figure, only genes with a p-value less than 0.05 are displayed with circles. Statistical analysis was conducted using the two-tailed Wilcoxon rank-sum test. (E) Essentiality of PSPGs in cell survival based on CRISPR screening data. Values range from 0 to 1, the higher the value, the greater the cell’s survival dependence on it. (F) Changes in gene expression of PSPGs in the pan-cancer cohort, the numbers in the heatmap represent Log2FC (fold change), red indicated up-regulation, blue indicated down-regulation, only genes with p < 0.05 were shown. Statistical analysis was conducted using the two-tailed Wilcoxon rank-sum test. (G) The relationship between PSPGs and prognosis in different cancer types, including Overall Survival (OS), Disease-Free Interval (DFI), Disease-Specific Survival (DSS), Progression-Free Interval (PFI). Red indicated that this gene was associated with poor prognosis in patients, while blue indicated that this gene was associated with better prognosis in patients (p < 0.05). Statistical analysis was conducted using Log rank tests. |
Investigation of the copy number variations (CNVs) of PSPGs revealed a widespread occurrence of copy number amplifications of UCKL1, UPP1, and UCK2 (Figure 1C and Table S2). For example, UCKL1 was found to have substantial amplifications in gastrointestinal tumors, including colon adenocarcinoma (COAD, with approximately 72% of samples showing copy number amplification), stomach adenocarcinoma (STAD, with about 63% of samples exhibiting amplification), esophageal carcinoma (ESCA, where around 60% of samples had amplification), and rectum adenocarcinoma (READ, with approximately 87% of samples displaying amplification). There was also a strong positive correlation observed between the copy number amplifications and gene expression of UCKL1, for instance, in COAD, the correlation coefficient between copy number and gene expression was approximately 0.54 (Figure S1A and Table S2). Similarly, a notable correlation between copy number variations and gene expression was observed for UPP1 in lung adenocarcinoma (LUAD, correlation coefficient of 0.38) and for UCK2 in bladder urothelial carcinoma (BLCA, correlation coefficient of 0.55) and lung squamous cell carcinoma (LUSC, correlation coefficient of 0.51) (Figure S1A).
Regarding DNA methylation patterns of these PSPGs. UCK1, UCK2, and UCKL1 were hyper-methylated in Breast Invasive Carcinoma (BRCA) (Figure 1D and Table S2). In contrast, the DNA methylation levels of CDA, UPP1, and UPP2 were found predominantly decreased in tumors. Further analysis uncovered that the methylation levels of UPP1 significantly negative correlated with the variations in its gene expression, especially in Low Grade Glioma (LGG, correlation coefficient of −0.65) and Skin Cutaneous Melanoma (SKCM, correlation coefficient of −0.59) (Figure S1B and S1C).
Based on the high-throughput CRISPR screening data provided by DepMap (https://depmap.org/),20,38 the dependence of different tumor cells on these PSPGs for survival was further investigated. The results indicated a notable reliance of tumor cell viability on UCK1, consistent with previous studies wherein inhibiting UCK1 resulted in apoptotic cell responses.15 Interestingly, tumor cells appeared to depend less on UPP1 for their survival, compared to UCK1 (Figure 1E).
In terms of gene expression changes, it was observed that PSPGs demonstrated a broad up-regulation across multiple types of cancer (Figure 1F, G and Table S3 and S4). For instance, UCK2 exhibited significant upregulation in 12 different cancers. Additionally, the expression of UCK2 showed a notable positive correlation with patient staging in multiple cancer types (Figure S1D). Moreover, patients with higher expression levels of CDA tended to have a lower response rate to clinical treatment (Figure S1E).
Proteomic data were also included and changes in these genes at the protein level were compared. Consistent with the transcriptomic data, PSPGs are widely up-regulated at the protein expression level in multiple tumors (Figure S1F). In particular, the protein expression changes of UPP1 and CDA in LUAD are quite noticeable and show a significant correlation with patient prognosis (Figure S1G).
The conducted analyses presented a comprehensive multi-omics view of PSPGs from a pan-cancer perspective. Despite low mutation rates, these genes were found to have prevalent copy number amplifications. A broad up-regulation of PSPGs was observed, and this up-regulation was correlated with the clinical staging and prognosis of cancer in patients. Findings from proteomic data further reinforced these observations. These findings highlighted the important roles of PSPGs in cancer.
Functional Features of Pyrimidine Salvage Pathway-Related Genes
We subsequently performed a detailed analysis on the associations between PSPGs and the biological mechanisms related to tumor progression (Figure 2A, Figure S2 and Table S5). This analysis revealed significant associations of PSPGs with pathways related to tumor proliferation and metastasis. Specifically, UCK2 was significantly correlated with DNA replication in 28 cancer types, cell cycle in 27 cancer types, and tumor metastasis in 26 cancer types. UPP1 showed notable correlations with angiogenesis in 21 cancer types, hypoxia in 26 cancer types, the TNFα signaling pathway in 26 cancer types, and the P53 signaling pathway in 28 cancer types. Regarding metabolic pathways, UCK2 was broadly linked with pyrimidine metabolism in 29 cancer types and purine metabolism in 30 cancer types. UCK1 was associated with oxidative phosphorylation across 24 types of tumors. Furthermore, UPP1 was connected with amino sugar and nucleotide sugar metabolism in 28 cancer types, as well as the biosynthesis of valine, leucine, and isoleucine in 26 cancer types.
 |
Figure 2 Functional enrichment analysis of PSPGs. (A) Functional enrichment analysis of PSPGs in the pan-cancer cohort. In each tumor type, the correlation between each gene and pathway/feature was calculated. The correlation pairs with correlation coefficient greater than 0.2 and the p-value less than 0.05 were considered significantly related. The correlation analysis was conducted using Pearson’s correlation. (B) Upper, the correlation between UPP1 and cytokines across the pan-cancer cohort. The correlation analysis was conducted using Pearson’s correlation (*p < 0.05; **p < 0.01; ***p < 0.001; ****p < 0.0001). Bottom, the average correlation coefficients of cytokines related to UPP1 expression at the pan-cancer level, and the top cytokines 15 are displayed. (C) Inhibition of UPP1 expression in 5 different tumor cell lines resulted in changes of TGFB1 expression (**p < 0.01; ****p < 0.0001). |
Notably, analyzing the correlations between PSPGs and the tumor microenvironment (TME) revealed a significant correlation between UPP1 and TME. Specifically, UPP1 demonstrated strong correlations with cytokines, immune checkpoints, neutrophils, macrophages, T cells, and various other cellular populations within the TME across cancer types, suggesting that UPP1 may play an important role in the TME. The expression and secretion of cytokines in TME are closely related to tumor progression and immune suppression.39 Given the close relationship between UPP1 and cytokines, the focus was directed to the associations between UPP1 expression and cytokines. In various types of cancer, UPP1 exhibited significant correlations with a range of cytokines, including TGFB1, CCLs (such as CCL2, CCL3, CCL4, CCL5), ILs (including IL1B, IL6), and CXCLs (such as CXCL1, CXCL2, CXCL3) (Figure 2B and Table S5). Among the various correlations analyzed, the relationship between UPP1 and TGFB1 stood out as the most significant. This correlation was notably strong across 27 different types of cancer, with an average correlation coefficient of 0.38. This finding highlighted the potential importance of UPP1 in relation to TGFB1 signaling in a wide range of cancer types (Figure 2B). TGFB1 is an important cytokine in the tumor microenvironment, with significant effects on tumor proliferation and immune suppression.40 Therefore, the potential direct influence of UPP1 on the expression of TGFB1 was explored. We included five common tumor cell lines, including HCC827 (lung cancer), T24 (bladder cancer), MDA-MB-231 (breast cancer), Huh-7 (liver cancer), and TE1 (esophageal cancer). Upon suppressing the expression of UPP1 in these cell lines, it was found that UPP1 inhibition can significantly reduce the expression of TGFB1 (Figure 2C).
Validation the Relationship Between UPP1 and Cytokine Expression in scRNA-Seq Data
scRNA-seq has emerged as a critical tool in recent years for tumor research, providing detailed expression information at the individual cell level.37 The correlation between UPP1 expression in tumor cells and cytokine expression was further validated using scRNA-seq data. We here enrolled four common types of tumors: bladder cancer (BLCA), breast cancer (BRCA), liver cancer (LIHC), and esophageal cancer (ESCC), the latter of which was sequenced in-house (Figure 3A and Table S6). Cells were classified into immune cells (PTPRC+/CD45+), EPCAM+ cells (ALB+ hepatocytes for liver cancer), fibroblasts (ACTA2+), and endothelial cells (VWF+) based on canonical markers (Figure S3A). InferCNV41 was then utilized to identify tumor cells within the EPCAM+ cells (ALB+ hepatocytes for liver cancer) (Figure S3B). The first step was to validate whether PSPGs exhibited abnormal expression at the single-cell level. In alignment with bulk results, PSPGs were found to be up-regulated in tumor cells compared to normal cells (Figure S3C). Additionally, in liver cancer, UPP1 expression was observed to be up-regulated at both portal vein tumor thrombus (PVTT) and lymph node metastasis sites.
 |
Figure 3 Validation of the relationship between UPP1 and cytokine expression in scRNA-seq data. (A) scRNA-seq data from 4 types of tumors were included. Cells were annotated based on the expression of marker genes. (B) Based on UPP1 expression, tumor cells were divided into high and low UPP1 expression groups, and the expression of TGFB1 in the two cell populations was compared (****: p < 0.0001). Statistical analysis was conducted using the two-tailed Wilcoxon rank-sum test. (C) Comparison of the expression of cytokines in the high and low UPP1 expression tumor cell groups. Only genes with a p-value less than 0.05 are shown. (D) After inhibiting UPP1 expression in the tumor cell lines, the expression of the corresponding cytokine genes was detected (*p < 0.05; **p < 0.01; ***p < 0.001; ****p < 0.0001). Statistical analysis was conducted using the two-tailed Student’s t-test. |
We further divided the tumor cells based on the median expression of UPP1 into UPP1-high and UPP1-low groups. Comparing the expression of TGFB1 in two groups of tumor cells, we found that tumor cells with higher UPP1 expression also had higher TGFB1 expression (Figure 3B). Additionally, in these four types of tumors, other important cytokines were also validated. In BLCA, CCL26, CXCL3, VEGFB, IL1A, and IL1B were relatively higher in tumor cells with higher UPP1 expression. In breast cancer, except for IL1A, the expression levels of other important cytokines all correlated with UPP1. In esophageal cancer and liver cancer, these cytokines were also correlated with UPP1 expression (Figure 3C), which further supported the results we obtained from the bulk data.
Furthermore, we also validated that suppressing UPP1 expression in corresponding tumor cell lines could indeed affect the expression levels of these cytokines (Figure 3D). In bladder cancer (T-24), inhibition of UPP1 led to a decrease in CCL26, CXCL3, VEGFB, IL1A, and IL1B, with VEGFB showing the most significant reduction. Similarly, in breast cancer (MDA-MB-231), suppression of UPP1 also resulted in the downregulation of multiple cytokines, including CCL2, CCL3, CCL4, CCL5, CXCL3, VEGFB, IL1A, and IL1B. In esophageal cancer (TE-1) and liver cancer (Huh-7), a similar pattern was observed. These results indicated that UPP1 expression in different tumor cell lines had a significant impact on the expression of various cytokines.
Suppression of UPP1 Resulting in Down-Regulation of Immune-Checkpoint Expression
The expression of immune checkpoints is a key process through which tumor cells manage to evade the immune system. It was found that UPP1 was also associated with the expression of immune checkpoints in many cancer types. The focus was then moved to the relationship between UPP1 and immune checkpoints. Analysis based on bulk data revealed that in multiple tumors, UPP1 expression was correlated with immune checkpoints (Figure 4A and Table S5). For example, in LIHC, UPP1 expression was significantly correlated with immune checkpoints such as CD70 and LGALS9 (Galectin-9), in LGG, UPP1 demonstrated a high correlation with CD274 (PD-L1) and CD273 (PDCD1LG2), and in Thyroid Carcinoma (THCA), UPP1 has been found to correlate with multiple immune checkpoints, including VTCN1, SIGLEC15, and CD276. The relationship between UPP1 and immune checkpoints was further validated in the scRNA-seq data used in the study (Figure 4B). In BLCA, tumor cells with higher UPP1 expression showed a higher relative expression of CD276 and LGALS9 (Galectin-9). In ESCC, tumor cells with higher UPP1 expression show higher expression of CD276, CD70, and LGALS9 (Galectin-9). Additionally, in LIHC, tumor cells with higher UPP1 expression also showed higher relative expression of CD274 (PD-L1) and CD273 (PDCD1LG2).
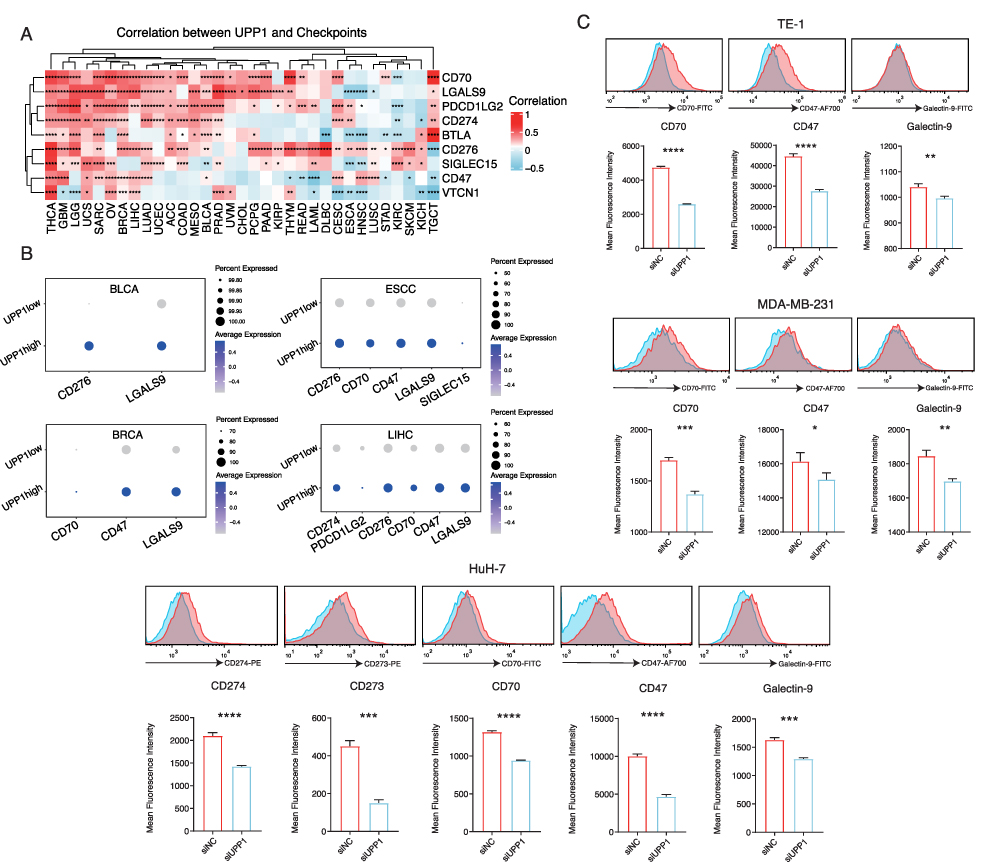 |
Figure 4 The relationship between UPP1 and immune checkpoints. (A) Calculation of the correlation between UPP1 expression and immune checkpoints in the TCGA pan-cancer cohort (*p < 0.05; **p < 0.01; ***p < 0.001; ****p < 0.0001). (B) The relationship between immune checkpoints in cell groups with high and low UPP1 expression, only significantly related immune checkpoints were shown (p < 0.05). (C) Flow cytometry detection of changes in the expression of immune checkpoints on the tumor cell membrane after inhibiting UPP1 expression (*p < 0.05; **p < 0.01; ***p < 0.001; ****p < 0.0001). Statistical analysis was conducted using the two-tailed Student’s t-test. |
To further validate the association between UPP1 expression and immune checkpoints, we inhibited UPP1 in tumor cells and examined the expression of immune checkpoints on the cell membrane using flow cytometry (Figure 4C). In ESCC, BRCA, and LIHC, we observed a downregulation of several immune checkpoints after inhibiting UPP1 expression. In ESCC and BRCA, inhibiting UPP1 significantly down-regulated the expression of CD70, CD47, and Galectin-9. In LIHC, the expression of CD274 (PD-L1) and CD273 (PDCD1LG2) also decreased with the inhibition of UPP1. Collectively, these results indicated that UPP1 expression could also affect the expression of immune checkpoints, further suggesting an association between UPP1 and the tumor microenvironment.
Tumor Cells with High UPP1 Expression Correlated with Immunosuppressive Cells in ESCC Tumor Microenvironment
In China, ESCC is particularly prevalent, contributing to a significant proportion of cancer-related morbidity and mortality.42 However, the function of UPP1 in ESCC remains unclear. Here, we focused on the relationship between UPP1 and ESCC TME based on our scRNA-seq data. In our ESCC scRNA-seq data, 12 groups of immune cells were identified, including IL7R+CD4+ T cells (Naïve CD4+ T cells), cytotoxic GZMB+CD8+ T cells, AFF3+ B cells, CD25+CTLA4+CD4+ T cells (Tregs), IL1B+ macrophages, IL7R+CD8+ T cells (Naïve CD8+ T cells), plasma cells, SPP1+ M2 macrophages, CD86+ macrophages, BANK1+ B cells, neutrophils, and PRPSAP2+ B cells. Additionally, 4 groups of fibroblasts were identified, including LAMA2+ fibroblasts, MMP11+ cancer-associated fibroblasts (CAFs), MYH11+ fibroblasts, and IGFBP6+ fibroblasts. In addition, 3 clusters of endothelial cells were identified, including CCL14+ endothelial cells, ARL5+CXCL12+ endothelial cells, and CCL21+ endothelial cells (Figure 5A, Figure S4 and Table S7).
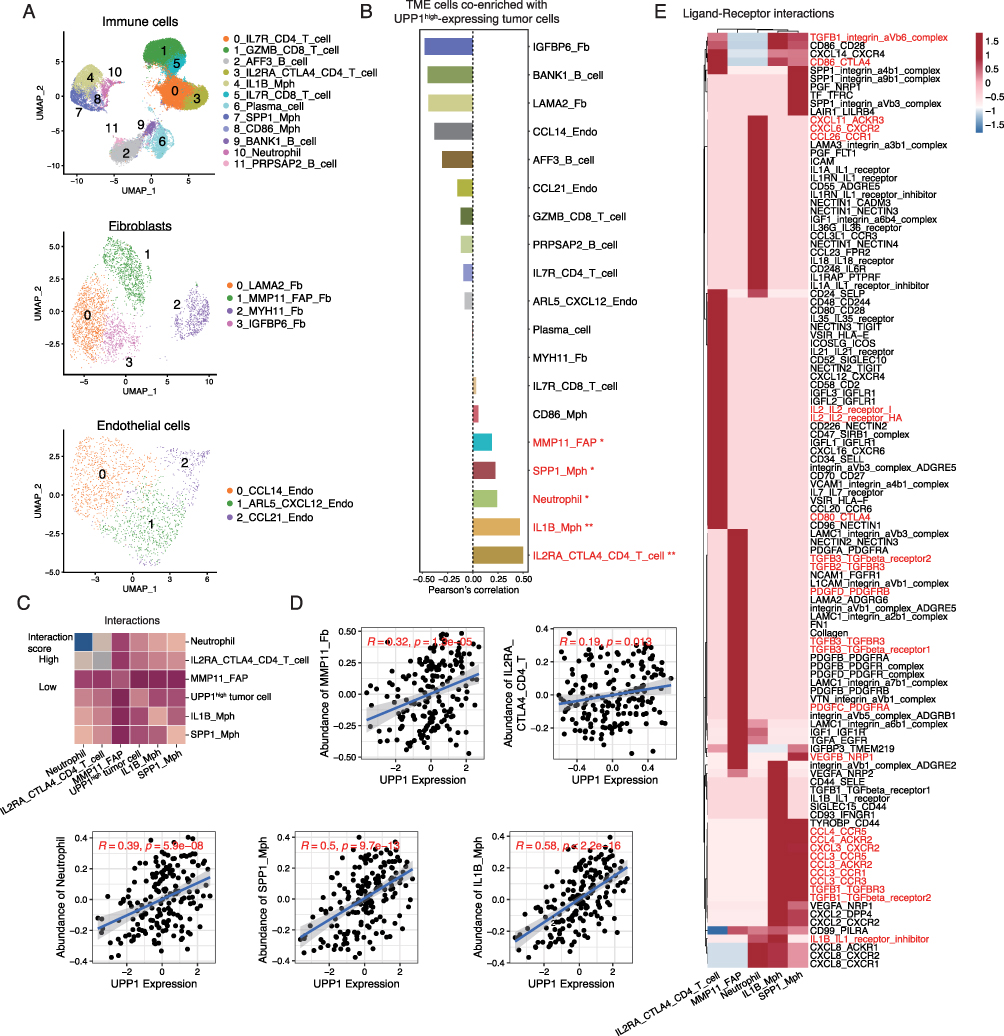 |
Figure 5 Single-cell analysis of ESCC revealing the relationship between high-expressing UPP1 tumor cells and the immune microenvironment. (A) UMAP plot showing the cell types identified in ESCC single-cell RNA sequencing data. (B) Co-existence features of UPP1-high tumor cells with tumor microenvironment (TME) cell populations (*p < 0.05; **p < 0.01). The correlation analysis was conducted using Pearson’s correlation. (C) CellPhoneDB analysis showing the interactions between UPP1high tumor cells and TME cells. (D) Verification of the correlation between UPP1 expression and TME cells in the ESCC bulk cohort. The correlation analysis was conducted using Pearson’s correlation. (E) Cell-cell interaction networks, only significantly ligand-receptor pairs were shown (p < 0.05). |
Next, we divided the tumor cells based on the median expression of UPP1 into UPP1-high and UPP1-low groups, and then calculated the co-occurrence relationship between UPP1-high tumor cells and these TME cells (Figure 5B). Interestingly, it was found that MMP11+ CAFs, SPP1+ M2 macrophages, neutrophil, IL1B+ macrophages, and Tregs exhibited significant co-occurrence characteristics with UPP1 high-expressing tumor cells. According to previous studies, these cell types, which showed correlations with UPP1-high tumor cells, played significant roles in promoting immunosuppression and advancing tumor progression. For instance, MMP11+ CAFs are reported to contribute to the alteration of the extracellular matrix and promote tumor growth.43 SPP1+ M2 macrophages could secrete immunosuppressive cytokines, such as IL-10 and TGF-β, which hinder the function of effector T cells.44 Next, CellPhoneDB analysis was used to investigate the interactions between UPP1-high tumor cells and these TME cells (Figure 5C). The results demonstrated that UPP1-high tumor cells indeed had intercellular communications with these TME cells. Moreover, we calculated the abundance of these cells in an external ESCC bulk cohort (GSE53625) based on their marker genes, then assessed the relationship between these cells and UPP1 expression. The results were also consistent (Figure 5D).
On the other hand, cell-cell communication analyses showed that UPP1-high tumor cells could interact with Treg cells through TGF-β signaling pathway, IL-2 signaling pathway, and CD86-CTLA4 ligand-receptor pairs. Also, UPP1-high tumor cells could communicate with MMP11+ CAFs, neutrophils, IL1B+ macrophages, and SPP1+ macrophages via TGF-β signaling pathway, CCLs, and CXCLs ligand-receptor interactions (Figure 5E). The extensive interactions of UPP1-high tumor cells with these cells further indicated the important association of UPP1 with the immunosuppressive TME.
The Spatial Interaction Between UPP1+ Tumor Cells and Neutrophils Correlated with the Prognosis of ESCC Patients
In the aforementioned analyses, where we explored the relationship between UPP1 and the tumor microenvironment (TME) (Figure 2A), along with the results of single-cell analysis of ESCC, we identified a significant connection between UPP1 and neutrophils (Figure 5B). Recent studies have highlighted the tumor-promoting roles of tumor-associated neutrophils (TANs), along with their prognostic significance.37 Consequently, we decided to focus on the relationship between UPP1 and neutrophils. Based on the marker genes of neutrophils associated with high UPP1-expressing tumor cells that we identified in the ESCC scRNA-seq data, we inferred their abundance in the ESCC bulk cohort (GSE53625) and evaluated its correlation with patient prognosis. Interestingly, it was observed that ESCC patients with a higher proportion of these neutrophils tended to have a poorer prognosis (Figure S5).
Tissue microarrays (TMAs) from patients with ESCC from Zhongshan Hospital were used, and multiplex immunofluorescence staining for UPP1, PanCK, and CD66b (neutrophils) was conducted. Visiopharm software was utilized to process the data. Initially, automated segmentation methods were used for TMAs analysis (Figure 6A). Visiopharm’s AI recognition algorithm and automatic phenotype identification were used to identify UPP1+ and UPP1- tumor cells as well as neutrophils. After the automated cell phenotype identification, the spatial relationships between UPP1+/UPP1- tumor cells and neutrophils were calculated. Interestingly, it was found that UPP1+ tumor cells were primarily located at the invasive margin of the tumor and had a closer spatial distance to neutrophils (Figure 6B and C). Next, to investigate whether the spatial distances of UPP1+ cells to neutrophils related to the patients’ survival, the relation between distances and OS was analyzed. We found that patients where UPP1+ cells and neutrophils were closer in spatial distance tended to have a relatively poorer prognosis (Figure 6D). This suggested that the spatial interaction between UPP1+ tumor cells and neutrophils correlated with the prognosis of ESCC patients.
 |
Figure 6 The relationship between the spatial distance of UPP1+ tumor cells and neutrophils and patient prognosis. (A) TMAs of ESCC patients for the validation of the association between UPP1 and neutrophils. Automatic detection was employed for image recognition. During this process, slides with poor staining quality were excluded from subsequent analysis. (B) Automatic detection of UPP1+/UPP1- tumor cells and neutrophils using Visiopharm. (C) Comparison of the spatial distance from UPP1+/UPP1- tumor cells to neutrophils within each patient sample (****p < 0.0001), Statistical analysis was conducted using the two-tailed Student’s t-test. (D) The association between the spatial distance of UPP1+ tumor cells and neutrophils and patient prognosis. Statistical analysis was conducted using Log rank tests. |
Discussion
In this study, a comprehensive pan-cancer analysis of PSPGs was conducted across multiple omic levels. We observed that, despite PSPGs generally exhibiting low mutation rates, their copy number amplifications in specific cancers were notably significant. CNVs play a pivotal role in tumor biology and the progression of cancer, reflecting changes in the copy numbers of specific genes or genomic regions within a cell. CNVs can significantly influence the course of the disease by modifying gene expression.45 This alteration may manifest as either amplification of oncogenes, which drive cancer development, or deletion of tumor suppressor genes, which ordinarily function to restrain cell proliferation.
For instance, Samulin Erdem et al highlighted the significant correlation between copy number variations and gene expression, demonstrating that frequent copy number gains and increased expression of NFASC in non-small cell lung cancer were linked to enhanced cell motility, suggesting a novel regulatory role for NFASC in NSCLC progression.46 In esophageal cancer, Dong et al revealed a significant association between CNVs and the differential expression of FAM60A, which contributed to the disease’s progression by influencing cell cycle regulation, tumor growth, migration, and invasion.47 In addition, Kwak et al discovered a significant correlation between FGFR1 gene copy number gain, its elevated expression, and the manifestation of more aggressive clinical behavior in colorectal cancer patients, highlighting the profound impact of gene copy number variations on cancer progression and patient prognosis.48
In this research, our investigation into the CNVs of PSPGs highlighted widespread instances of copy number amplifications, notably in genes such as UCKL1, UPP1, and UCK2. Specifically, UCKL1 exhibited significant amplifications in a variety of gastrointestinal tumors, including colon adenocarcinoma, stomach adenocarcinoma, esophageal carcinoma, and rectum adenocarcinoma. A critical aspect of this finding was the observed strong positive correlation between these amplifications and the gene expression of UCKL1. Similarly, for UPP1 in LUAD and UCK2 in BLCA and LUSC, correlations between copy number variations and gene expression were also significant. Our findings of a notable correlation between copy number and gene expression suggested that these genetic alterations may play an essential role in the progression of these tumors.
In our analysis of tumor cell viability dependence, we observed that aside from UCK1, which has been previously reported to be closely associated with cell survival,15 tumor cells demonstrated a relatively lower dependence on other PSPGs, particularly UPP1. This finding suggested that these genes may contribute to tumor progression through mechanisms not solely reliant on cell proliferation, indicating a nuanced role in cancer biology beyond direct support of cell survival.
The observed changes in the gene expression of PSPGs across various cancers provided significant insights into their role in cancer biology. Notably, PSPGs were found to be broadly up-regulated in multiple cancer types. For example, UCK2 was significantly upregulated in 12 different cancers, and this upregulation demonstrated a notable positive correlation with patient staging in multiple cancer types. It had been reported that UCK2 was upregulated across various tumor types and served as an indicator of poor prognosis.49–51 High levels of UCK2 were known to promote cancer cell proliferation and metastasis, primarily by activating key signaling pathways such as Wnt/β-catenin and EGFR–AKT.52,53 This multifunctional nature of UCK2, influencing both the metabolic and signaling aspects of cancer cells, highlighted its potential as a biomarker and therapeutic target in cancer treatment and prognosis. The widespread upregulation of UCK2 underscored its significant impact on cancer progression and patient outcomes.
Additionally, an intriguing observation was made regarding CDA, where higher expression levels were associated with a lower response rate to clinical treatment. This finding could imply that CDA expression levels might be a potential biomarker for predicting treatment response in cancer patients. Complementing the transcriptomic data, proteomic analyses revealed similar up-regulation patterns of PSPGs at the protein expression level in multiple tumors. Notably, the protein expression changes of UPP1 and CDA in LUAD were particularly pronounced and showed a significant correlation with patient prognosis. This correlation could suggest that the protein levels of UPP1 and CDA might serve as prognostic indicators in LUAD, possibly reflecting the impact of these proteins on tumor behavior and patient outcomes.
Previous studies have shown that UPP1 was associated with colorectal cancer and thyroid cancer, and inhibition of UPP1 expression could significantly reduce tumor proliferation and metastasis.54,55 A recent study by Wang et al discovered that UPP1 could decrease the sensitivity of tumor cells to glycolysis inhibitors by driving glycolytic metabolism in lung cancer cells, thereby promoting tumor growth.56 Furthermore, recent findings have shown that in glucose-deprived conditions, pancreatic ductal adenocarcinoma exploits uridine, modulated by UPP1 expression, to sustain survival and proliferation.11 These studies highlighted the significant role of UPP1 in tumors. However, it’s noteworthy that there is relatively limited research on the relationship between UPP1 and the tumor microenvironment, as well as whether UPP1 participates in shaping the tumor immune-suppressive microenvironment.
Here, through functional enrichment analysis of PSPGs, we found a more significant correlation between UPP1 and TME compared to other pyrimidine salvage pathway genes, indicating that UPP1 not only participated in tumor proliferation but may also assist tumor cells in achieving immune escape by regulating the expression of cytokines and immune checkpoints. Building on this, we inhibited UPP1 expression in tumor cells to examine the expression of cytokines and confirmed a correlation between UPP1 and cytokines, including TGF-β. On the other hand, UPP1 also showed correlation with the expression of immune checkpoints in various tumors. Through flow cytometry validation, UPP1 expression significantly correlated with the expression of immune checkpoints, particularly, CD70 and CD47, in esophageal cancer cells, breast cancer cells, and liver cancer cells. CD70, also known as CD27 ligand, is a member of the tumor necrosis factor (TNF) family. Its ectopic expression on malignant cells can play an immunosuppressive role in the tumor microenvironment.57 Tumor-derived CD47 plays a pivotal role in immune escape and is widely known as the “do not eat me” signal. The expression of CD47 impedes phagocytosis, a crucial process wherein cells like macrophages and dendritic cells engulf and eliminate tumor cells.58 The discovered correlation between UPP1 and these immune checkpoints suggested that UPP1 may play a vital role in the mechanism of immune escape.
Based on our scRNA-seq data, we further explored the relationship between UPP1 and the TME in ESCC, and observed a significant correlation between UPP1high tumor cells and immune-suppressive-related cell populations within the TME. Also, extensive intercellular communications between these cells were observed, involving the TGF-β signaling pathway, cytokines, chemokines, and immune checkpoints. These pathways were the ones where UPP1 was enriched in the functional enrichment analysis.
In our analysis of the relationship between UPP1 and TME, and in ESCC single-cell analysis, a significant link between UPP1 and neutrophils was identified. The role of tumor-associated neutrophils (TANs) in promoting tumor progression and their prognostic significance has been highlighted in recent studies,37,59,60 leading us to focus on this specific relationship. Using TMAs, we observed that UPP1+ tumor cells were spatially closer to neutrophils, especially at the invasive edge of the tumor. The spatial proximity between UPP1+ cells and neutrophils correlated with patient outcomes. However, these results represented an observational correlation and the underlying mechanisms driving this correlation remain to be elucidated.
Conclusion
In this study, we conducted a comprehensive analysis of PSPGs from a pan-cancer perspective, revealing substantial alterations of PSPGs at both the gene and protein levels, and their correlations with patient outcomes. Significantly, UPP1 emerged as a critical factor, showing notable correlations with the TME, and influencing cytokine production and immune checkpoint expression. scRNA-seq analysis further highlighted the interaction between UPP1-expressing cells and the TME. Our findings, particularly the association between UPP1 and the TME, highlighted the potential role of UPP1 as an important element in cancer progression and as a possible target for therapeutic intervention.
Abbreviations
ACC, Adrenocortical Carcinoma; BLCA, Bladder Urothelial Carcinoma; BRCA, Breast Invasive Carcinoma; CESC, Cervical Squamous Cell Carcinoma and Endocervical Adenocarcinoma; CHOL, Cholangio Carcinoma; COAD, Colon Adenocarcinoma; DLBC, Lymphoid Neoplasm Diffuse Large B-cell Lymphoma; ESCA, Esophageal Carcinoma; GBM, Glioblastoma Multiforme; HNSC, Head and Neck Squamous Cell Carcinoma; KICH, Kidney Chromophobe; KIRC, Kidney Renal Clear Cell Carcinoma; KIRP, Kidney Renal Papillary Cell Carcinoma; LAML, Acute Myeloid Leukemia; LGG, Brain Lower Grade Glioma; LIHC, Liver Hepatocellular Carcinoma; LUAD, Lung Adenocarcinoma; LUSC, Lung Squamous Cell Carcinoma; MESO, Mesothelioma; OV, Ovarian Serous Cystadenocarcinoma; PAAD, Pancreatic Adenocarcinoma; PCPG, Pheochromocytoma and Paraganglioma; PRAD, Prostate Adenocarcinoma; READ, Rectum Adenocarcinoma; SARC, Sarcoma; SKCM, Skin Cutaneous Melanoma; STAD, Stomach Adenocarcinoma; TGCT, Testicular Germ Cell Tumors; THCA, Thyroid Carcinoma; THYM, Thymoma; UCEC, Uterine Corpus Endometrial Carcinoma; UCS, Uterine Carcinosarcoma; UVM, Uveal Melanoma. PSPGs, pyrimidine salvage pathways-related genes; CNVs, Copy Number Variations; TME, Tumor Microenvironment.
Data Sharing Statement
ESCC scRNA-seq data are available at GSA data repository under the accession number HRA004305.
Ethics Approval and Informed Consent
Patients donating surgical tissues provided informed consent. This study was approved by the ethics committee on human research of Zhongshan Hospital, Fudan University (B2020-332R; B2020-412R), and conducted in accordance with the principles of the Declaration of Helsinki.
Acknowledgments
This work was supported by the Chengdu High-level Key Clinical Specialty Construction Project (ZX20201202020) and the National Nature Science Foundation of China (82270772).
Disclosure
The authors declare that they have no competing interests.
References
1. Vander Heiden MG, Lunt SY, Dayton TL, et al. Metabolic pathway alterations that support cell proliferation. Cold Spring Harb Symp Quant Biol. 2011;76:325–334. doi:10.1101/sqb.2012.76.010900
2. Vander Heiden MG. Targeting cancer metabolism: a therapeutic window opens. Nat Rev Drug Discov. 2011;10(9):671–684. doi:10.1038/nrd3504
3. Shen X, Zhang L, Xing S, et al. Inhibition of pyrimidine biosynthesis by strobilurin derivatives induces differentiation of acute myeloid leukemia cells. Leuk Lymphoma. 2022;63(5):1202–1210. doi:10.1080/10428194.2021.2008382
4. Phan T, Nguyen VH, Buettner R, et al. Inhibition of de novo pyrimidine synthesis augments Gemcitabine induced growth inhibition in an immunocompetent model of pancreatic cancer. Int J Biol Sci. 2021;17(9):2240–2251. doi:10.7150/ijbs.60473
5. Sasada S, Miyata Y, Tsutani Y, et al. Metabolomic analysis of dynamic response and drug resistance of gastric cancer cells to 5-fluorouracil. Oncol Rep. 2013;29(3):925–931. doi:10.3892/or.2012.2182
6. Walter M, Herr P. Re-discovery of pyrimidine salvage as target in cancer therapy. Cells. 2022;11(4). doi:10.3390/cells11040739
7. Demontis S, Terao M, Brivio M, Zanotta S, Bruschi M, Garattini E. Isolation and characterization of the gene coding for human cytidine deaminase. Biochim Biophys Acta. 1998;1443(3):323–333. doi:10.1016/s0167-4781(98)00235-8
8. van Kuilenburg AB, Meinsma R. The pivotal role of uridine-cytidine kinases in pyrimidine metabolism and activation of cytotoxic nucleoside analogues in neuroblastoma. Biochim Biophys Acta. 2016;1862(9):1504–1512. doi:10.1016/j.bbadis.2016.05.012
9. Fu Y, Wei XD, Guo L, et al. The metabolic and non-metabolic roles of UCK2 in tumor progression. Front Oncol. 2022;12:904887. doi:10.3389/fonc.2022.904887
10. Skinner OS, Blanco-Fernández J, Goodman RP, et al. Salvage of ribose from uridine or RNA supports glycolysis in nutrient-limited conditions. Nat Metab. 2023;5(5):765–776. doi:10.1038/s42255-023-00774-2
11. Nwosu ZC, Ward MH, Sajjakulnukit P, et al. Uridine-derived ribose fuels glucose-restricted pancreatic cancer. Nature. 2023;618(7963):151–158. doi:10.1038/s41586-023-06073-w
12. Walter M, Mayr F, Hanna BMF, et al. NUDT22 promotes cancer growth through pyrimidine salvage. Oncogene. 2023;42(16):1282–1293. doi:10.1038/s41388-023-02643-4
13. Heo H, Kim JH, Lim HJ, et al. DNA methylome and single-cell transcriptome analyses reveal CDA as a potential druggable target for ALK inhibitor-resistant lung cancer therapy. Exp Mol Med. 2022;54(8):1236–1249. doi:10.1038/s12276-022-00836-7
14. Wu W, Zhao Y, Qin B, et al. Non-canonical role of UCKL1 on ferroptosis defence in colorectal cancer. EBioMedicine. 2023;93:104650. doi:10.1016/j.ebiom.2023.104650
15. Matchett EC, Ambrose EC, Kornbluth J. Characterization of uridine-cytidine kinase like-1 nucleoside kinase activity and its role in tumor growth. Biochem J. 2022;479(11):1149–1164. doi:10.1042/bcj20210770
16. Wang J, Xu S, Lv W, et al. Uridine phosphorylase 1 is a novel immune-related target and predicts worse survival in brain glioma. Cancer Med. 2020;9(16):5940–5947. doi:10.1002/cam4.3251
17. Shen S, Zhang R, Jiang Y, et al. Comprehensive analyses of m6A regulators and interactive coding and non-coding RNAs across 32 cancer types. Mol Cancer. 2021;20(1):67. doi:10.1186/s12943-021-01362-2
18. Li Y, Lin Y, Aye L, et al. An integrative pan-cancer analysis of the molecular and biological features of glycosyltransferases. Clin Transl Med. 2022;12(7):e872. doi:10.1002/ctm2.872
19. Aaltonen LA, Abascal F, Abeshouse A, et al. Pan-cancer analysis of whole genomes. Nature. 2020;578:82–93. doi:10.1038/s41586-020-1969-6
20. Gonçalves E, Poulos RC, Cai Z, et al. Pan-cancer proteomic map of 949 human cell lines. Cancer Cell. 2022;40(8):835–849.e8. doi:10.1016/j.ccell.2022.06.010
21. Luo H, Xia X, Huang L-B, et al. Pan-cancer single-cell analysis reveals the heterogeneity and plasticity of cancer-associated fibroblasts in the tumor microenvironment. Nat Commun. 2022;13(1):6619. doi:10.1038/s41467-022-34395-2
22. Zheng L, Qin S, Si W, et al. Pan-cancer single-cell landscape of tumor-infiltrating T cells. Science. 2021;374(6574):abe6474. doi:10.1126/science.abe6474
23. Cheng S, Li Z, Gao R, et al. A pan-cancer single-cell transcriptional atlas of tumor infiltrating myeloid cells. Cell. 2021;184(3):792–809.e23. doi:10.1016/j.cell.2021.01.010
24. Li Y, Xu F, Chen F, et al. Transcriptomics based multi-dimensional characterization and drug screen in esophageal squamous cell carcinoma. EBioMedicine. 2021;70:103510. doi:10.1016/j.ebiom.2021.103510
25. Goldman MJ, Craft B, Hastie M, et al. Visualizing and interpreting cancer genomics data via the Xena platform. Nature Biotechnol. 2020;38(6):675–678. doi:10.1038/s41587-020-0546-8
26. Li Y, Ge D, Lu C. The SMART App: an interactive web application for comprehensive DNA methylation analysis and visualization. Epigene Chromat. 2019;12(1):71. doi:10.1186/s13072-019-0316-3
27. Gao Q, Zhu H, Dong L, et al. Integrated proteogenomic characterization of HBV-related hepatocellular carcinoma. Cell. 2019;179(2):561–577.e22. doi:10.1016/j.cell.2019.08.052
28. Xu JY, Zhang C, Wang X, et al. Integrative proteomic characterization of human lung adenocarcinoma. Cell. 2020;182(1):245–261.e17. doi:10.1016/j.cell.2020.05.043
29. Li Y, Yang B, Ma Y, et al. Phosphoproteomics reveals therapeutic targets of esophageal squamous cell carcinoma. Signal Transduct Target Ther. 2021;6(1):381. doi:10.1038/s41392-021-00682-5
30. Chen Z, Zhou L, Liu L, et al. Single-cell RNA sequencing highlights the role of inflammatory cancer-associated fibroblasts in bladder urothelial carcinoma. Nat Commun. 2020;11(1):5077. doi:10.1038/s41467-020-18916-5
31. Lu Y, Yang A, Quan C, et al. A single-cell atlas of the multicellular ecosystem of primary and metastatic hepatocellular carcinoma. Nat Commun. 2022;13(1):4594. doi:10.1038/s41467-022-32283-3
32. Subramanian A, Tamayo P, Mootha VK, et al. Gene set enrichment analysis: a knowledge-based approach for interpreting genome-wide expression profiles. Proc Natl Acad Sci U S A. 2005;102(43):15545–15550. doi:10.1073/pnas.0506580102
33. Wu Y, Yang S, Ma J, et al. Spatiotemporal immune landscape of colorectal cancer liver metastasis at single-cell level. Cancer Discov. 2022;12(1):134–153. doi:10.1158/2159-8290.Cd-21-0316
34. McGinnis CS, Murrow LM, Gartner ZJ. DoubletFinder: doublet detection in single-cell RNA sequencing data using artificial nearest neighbors. Cell Syst. 2019;8(4):329–337.e4. doi:10.1016/j.cels.2019.03.003
35. Korsunsky I, Millard N, Fan J, et al. Fast, sensitive and accurate integration of single-cell data with Harmony. Nat Methods. 2019;16(12):1289–1296. doi:10.1038/s41592-019-0619-0
36. Kim N, Kim HK, Lee K, et al. Single-cell RNA sequencing demonstrates the molecular and cellular reprogramming of metastatic lung adenocarcinoma. Nat Commun. 2020;11(1):2285. doi:10.1038/s41467-020-16164-1
37. Xue R, Zhang Q, Cao Q, et al. Liver tumour immune microenvironment subtypes and neutrophil heterogeneity. Nature. 2022;612:7938):141–147. doi:10.1038/s41586-022-05400-x
38. Dempster JM, Rossen J, Kazachkova M, et al. Extracting biological insights from the project achilles genome-scale CRISPR screens in cancer cell lines. bioRxiv. 2019:720243. doi:10.1101/720243
39. Liu Z, Zhao Y, Kong P, et al. Integrated multi-omics profiling yields a clinically relevant molecular classification for esophageal squamous cell carcinoma. Cancer Cell. 2023;41(1):181–195.e9. doi:10.1016/j.ccell.2022.12.004
40. Lecker LSM, Berlato C, Maniati E, et al. TGFBI production by macrophages contributes to an immunosuppressive microenvironment in ovarian cancer. Cancer Res. 2021;81(22):5706–5719. doi:10.1158/0008-5472.Can-21-0536
41. Tirosh I, Izar B, Prakadan SM, et al. Dissecting the multicellular ecosystem of metastatic melanoma by single-cell RNA-seq. Science. 2016;352(6282):189–196. doi:10.1126/science.aad0501
42. Siegel RL, Miller KD, Fuchs HE, Jemal A. Cancer statistics, 2022. CA Cancer J Clin. 2022;72(1):7–33. doi:10.3322/caac.21708
43. Eiro N, Carrión JF, Cid S, et al. Toll-like receptor 4 and matrix metalloproteases 11 and 13 as predictors of tumor recurrence and survival in stage II colorectal cancer. Pathol Oncol Res. 2019;25(4):1589–1597. doi:10.1007/s12253-019-00611-6
44. Zhang Y, Du W, Chen Z, Xiang C. Upregulation of PD-L1 by SPP1 mediates macrophage polarization and facilitates immune escape in lung adenocarcinoma. Exp Cell Res. 2017;359(2):449–457. doi:10.1016/j.yexcr.2017.08.028
45. Shao X, Lv N, Liao J, et al. Copy number variation is highly correlated with differential gene expression: a pan-cancer study. BMC Med. Genet. 2019;20(1):175. doi:10.1186/s12881-019-0909-5
46. Samulin Erdem J, Arnoldussen YJ, Skaug V, Haugen A, Zienolddiny S. Copy number variation, increased gene expression, and molecular mechanisms of neurofascin in lung cancer. Mol, Carcinog. 2017;56(9):2076–2085. doi:10.1002/mc.22664
47. Dong G, Mao Q, Yu D, et al. Integrative analysis of copy number and transcriptional expression profiles in esophageal cancer to identify a novel driver gene for therapy. Sci Rep. 2017;7:42060. doi:10.1038/srep42060
48. Kwak Y, Nam SK, Seo AN, et al. Fibroblast growth factor receptor 1 gene copy number and mRNA expression in primary colorectal cancer and its clinicopathologic correlation. Pathobiology. 2015;82(2):76–83. doi:10.1159/000398807
49. Huang S, Li J, Tam NL, et al. Uridine-cytidine kinase 2 upregulation predicts poor prognosis of hepatocellular carcinoma and is associated with cancer aggressiveness. Mol Carcinog. 2019;58(4):603–615. doi:10.1002/mc.22954
50. Shen G, He P, Mao Y, et al. Overexpression of Uridine-Cytidine Kinase 2 Correlates with Breast Cancer Progression and Poor Prognosis. J Breast Cancer. 2017;20(2):132–141. doi:10.4048/jbc.2017.20.2.132
51. Wu Y, Jamal M, Xie T, et al. Uridine-cytidine kinase 2 (UCK2): a potential diagnostic and prognostic biomarker for lung cancer. Cancer Sci. 2019;110(9):2734–2747. doi:10.1111/cas.14125
52. Wu H, Xu H, Jia D, Li T, Xia L. METTL3-induced UCK2 m(6)A hypermethylation promotes melanoma cancer cell metastasis via the WNT/β-catenin pathway. Ann Transl Med. 2021;9(14):1155. doi:10.21037/atm-21-2906
53. Cai J, Sun X, Guo H, et al. Non-metabolic role of UCK2 links EGFR-AKT pathway activation to metastasis enhancement in hepatocellular carcinoma. Oncogenesis. 2020;9(12):103. doi:10.1038/s41389-020-00287-7
54. Wang C, Shi Z, Zhang Y, et al. CBFβ promotes colorectal cancer progression through transcriptionally activating OPN, FAM129A, and UPP1 in a RUNX2-dependent manner. Cell Death Differ. 2021;28(11):3176–3192. doi:10.1038/s41418-021-00810-2
55. Guan Y, Bhandari A, Zhang X, Wang O. Uridine phosphorylase 1 associates to biological and clinical significance in thyroid carcinoma cell lines. J Cell Mol Med. 2019;23(11):7438–7448. doi:10.1111/jcmm.14612
56. Wang X, Wang Z, Huang R, Lu Z, Chen X, Huang D. UPP1 promotes lung adenocarcinoma progression through epigenetic regulation of glycolysis. Aging Dis. 2022;13(5):1488–1503. doi:10.14336/ad.2022.0218
57. Wischhusen J, Jung G, Radovanovic I, et al. Identification of CD70-mediated apoptosis of immune effector cells as a novel immune escape pathway of human glioblastoma. Cancer Res. 2002;62(9):2592–2599.
58. Bian HT, Shen YW, Zhou YD, et al. CD47: beyond an immune checkpoint in cancer treatment. Biochim Biophys Acta Rev Cancer. 2022;1877(5):188771. doi:10.1016/j.bbcan.2022.188771
59. Que H, Fu Q, Lan T, Tian X, Wei X. Tumor-associated neutrophils and neutrophil-targeted cancer therapies. Biochim Biophys Acta Rev Cancer. 2022;1877(5):188762. doi:10.1016/j.bbcan.2022.188762
60. Li S, Cong X, Gao H, et al. Tumor-associated neutrophils induce EMT by IL-17a to promote migration and invasion in gastric cancer cells. J Exp Clin Cancer Res. 2019;38(1):6. doi:10.1186/s13046-018-1003-0
 © 2024 The Author(s). This work is published and licensed by Dove Medical Press Limited. The
full terms of this license are available at https://www.dovepress.com/terms
and incorporate the Creative Commons Attribution
- Non Commercial (unported, 3.0) License.
By accessing the work you hereby accept the Terms. Non-commercial uses of the work are permitted
without any further permission from Dove Medical Press Limited, provided the work is properly
attributed. For permission for commercial use of this work, please see paragraphs 4.2 and 5 of our Terms.
© 2024 The Author(s). This work is published and licensed by Dove Medical Press Limited. The
full terms of this license are available at https://www.dovepress.com/terms
and incorporate the Creative Commons Attribution
- Non Commercial (unported, 3.0) License.
By accessing the work you hereby accept the Terms. Non-commercial uses of the work are permitted
without any further permission from Dove Medical Press Limited, provided the work is properly
attributed. For permission for commercial use of this work, please see paragraphs 4.2 and 5 of our Terms.