
Back to Journals » Breast Cancer: Targets and Therapy » Volume 18
Integrating Ultrasound and DCE-MRI Improves Accuracy in Differentiating Breast Adenosis from Carcinoma
Authors Zhang Y, Fan Y, Yao X, Zhou H, Han D  , Xiao Y, Zhong P, Fang J
Received 24 February 2026
Accepted for publication 6 May 2026
Published 14 May 2026 Volume 2026:18 604929
DOI https://doi.org/10.2147/BCTT.S604929
Checked for plagiarism Yes
Review by Single anonymous peer review
Peer reviewer comments 2
Editor who approved publication: Professor Robert Clarke
Yuli Zhang,1,* Yuhong Fan,1,* Xiaojing Yao,1 Haiyan Zhou,1 Dong Han,1 Yao Xiao,1 Peng Zhong,2 Jingqin Fang1
1Department of Ultrasound, Daping Hospital, Army Medical University, Chongqing, 400042, People’s Republic of China; 2Department of Pathology, Daping Hospital, Army Medical University, Chongqing, 400042, People’s Republic of China
*These authors contributed equally to this work
Correspondence: Jingqin Fang, Department of Ultrasound, Daping Hospital, Army Medical University, No. 10 Yangtze Branch Road, Yuzhong District, Chongqing, 400042, People’s Republic of China, Tel +86 023-68746047, Email [email protected]
Background: Discriminating breast adenosis from carcinoma remains challenging due to their overlapping imaging appearances. This study aimed to develop and validate a fusion model combining ultrasound (US) and MRI-based radiomics for improved differentiation.
Methods: In this retrospective study, 260 patients (147 adenosis, 113 carcinoma) with preoperative US and MRI from March 2019 to July 2025 were enrolled and randomly split into training (n=182) and testing (n=78) cohorts at a 7:3 ratio. Radiomic features were extracted from grayscale US images depicting the largest lesion diameter and from the second-phase enhancement of DCE-MRI. After selection via maximum relevance minimum redundancy(mRMR) and Least Absolute Shrinkage and Selection Operator (LASSO) regression, radiomics models (US_Rad, MRI_Rad) were built based on selected features using the optimal algorithm among 12 candidates. A BI-RADS model based on significant US and MRI BI-RADS features was also constructed. A fusion model integrated US_Rad, MRI_Rad, BI-RADS, and age. Receiver operating characteristic (ROC) curves were used to evaluate the predictive performance of the four models.
Results: In the training cohort, the area under the curve (AUC) for BI-RADS and radiomic models based on US (US_Rad) and MRI (MRI_Rad) were 0.89 (95% CI, 0.84– 0.93), 0.84 (95% CI, 0.78– 0.90), and 0.85 (95% CI, 0.79– 0.90), respectively. In the testing cohort, the AUCs were 0.91 (95% CI, 0.83– 0.97), 0.82 (95% CI, 0.73– 0.91), and 0.82 (95% CI, 0.73– 0.90). The fusion model achieved superior AUCs of 0.96 (95% CI, 0.94– 0.98, training) and 0.97 (95% CI, 0.92– 1.00, testing), significantly outperforming both the unimodal radiomic model and the BI-RADS model (all p < 0.01).
Conclusion: Our findings suggest that the US-MRI radiomics fusion model exhibits potential in distinguishing breast adenosis from carcinoma, which may help reduce unnecessary surgeries. However, further multi-center validation is required to evaluate its generalizability before clinical application.
Keywords: breast adenosis, carcinoma, ultrasound, MRI, radiomics, differentiation
Introduction
Breast adenosis is a benign condition characterized by an increased number of acini and glandular structures within the lobular units. Predominantly observed in premenopausal women, it is often attributed to a hormonal imbalance involving excess estrogen and relative progesterone deficiency.1 Although generally benign, certain subtypes, such as sclerosing adenosis, may slightly elevate the likelihood of breast cancer.2 In clinical practice, adenosis presents a significant diagnostic challenge because it frequently mimic breast cancer during both physical examination and imaging. Furthermore, it often coexist with other breast lesions, such as ductal epithelial hyperplasia, fibroadenoma, ductal carcinoma in situ (DCIS), and invasive ductal carcinoma (IDC).3 Due to these overlapping features, adenosis is frequently categorized as BI-RADS 4 or higher, prompting invasive pathological assessment. However, while histopathology is definitive, biopsy or surgery can lead to complications or overtreatment. Moreover, the reliability of core needle biopsy can be limited. For instance, breast carcinoma within sclerosing adenosis is sometimes underestimated as benign adenosis or atypical ductal hyperplasia.4 Consequently, establishing a reliable, non-invasive technique to preoperatively differentiate adenosis from carcinoma is crucial for optimizing clinical decisions and avoiding unnecessary invasive procedures.
Ultrasound (US) is a widely used imaging modality for assessing breast lesions, owing to its widespread accessibility, cost-effectiveness, and non-invasive characteristics. Nevertheless, its dependence on morphological features frequently restricts its ability to accurately distinguish adenosis from breast carcinoma. While some studies suggest that margin and internal echoes may aid in differentiation,3 others point to posterior echoes, vascularity, and calcifications as more discriminative factors.5 Magnetic resonance imaging (MRI), another efficient technology for detecting breast lesions, also faces challenges in accurately distinguishing adenosis from breast carcinoma, as these two entities can be classified into the same Breast ImagingReporting and Data System (BI-RADS) category.6 The area under the ROC curve (AUC) of the BI-RADS classification using US and MRI in diagnosing adenosis with associated malignancy was reported as 0.611 and 0.751, respectively,3 highlighting the need for more accurate diagnostic tools.
Radiomics meets this need by extracting high-dimensional quantitative features from medical images, transforming subjective visual interpretations into mineable, objective data.7 This approach reduces subjectivity and facilitates the development of models for differential diagnosis, prognosis prediction, and therapy response assessment.8,9 Consequently, It is widely used in breast lesion screening, particularly for breast neoplasms, to improve diagnostic accuracy, predict molecular subtypes, and thus support clinical decision-making. Previous studies have developed radiomic models using mammography (MG),10 MRI,6 US,11,12 and the combined MG-US10 to differentiate adenosis from malignancy. However, the potential of integrating US and MRI radiomics for this purpose remains underexplored. Developing a non-invasive, highly accurate diagnostic model is essential not only for reliable differentiation but also for optimizing clinical decision-making.
We hypothesize that the integration of radiomic features from grayscale US and MRI can improve the differentiation between breast adenosis and carcinoma. To this end, this study aims to develop and evaluate diagnostic models based on US and MRI radiomics.
Methods
Study Population
This study was approved by our institution’s Ethics Committee of Daping Hospital [Approval No: 2025 (425)] and was conducted in accordance with the Declaration of Helsinki. The requirement for written informed consent was waived due to the retrospective nature of this study. This study involved 260 patients from March 2019 to July 2025, comprising 147 patients with adenosis and 113 patients with carcinoma. The inclusion criteria were as follows: (1) pathologically confirmed breast adenosis or carcinoma accompanied by adenosis; (2) patients who underwent both US and MRI within one month before surgery; (3) lesions categorized as BI-RADS 4 or higher; (4) availability of US and MRI images for radiomic analysis; and (5) lesions that were visible on both US and MRI. Exclusion criteria were as follows: (1) patients with any treatment before US or MRI examination; (2) poor imaging quality. The flowchart of this study is shown in Figure 1.
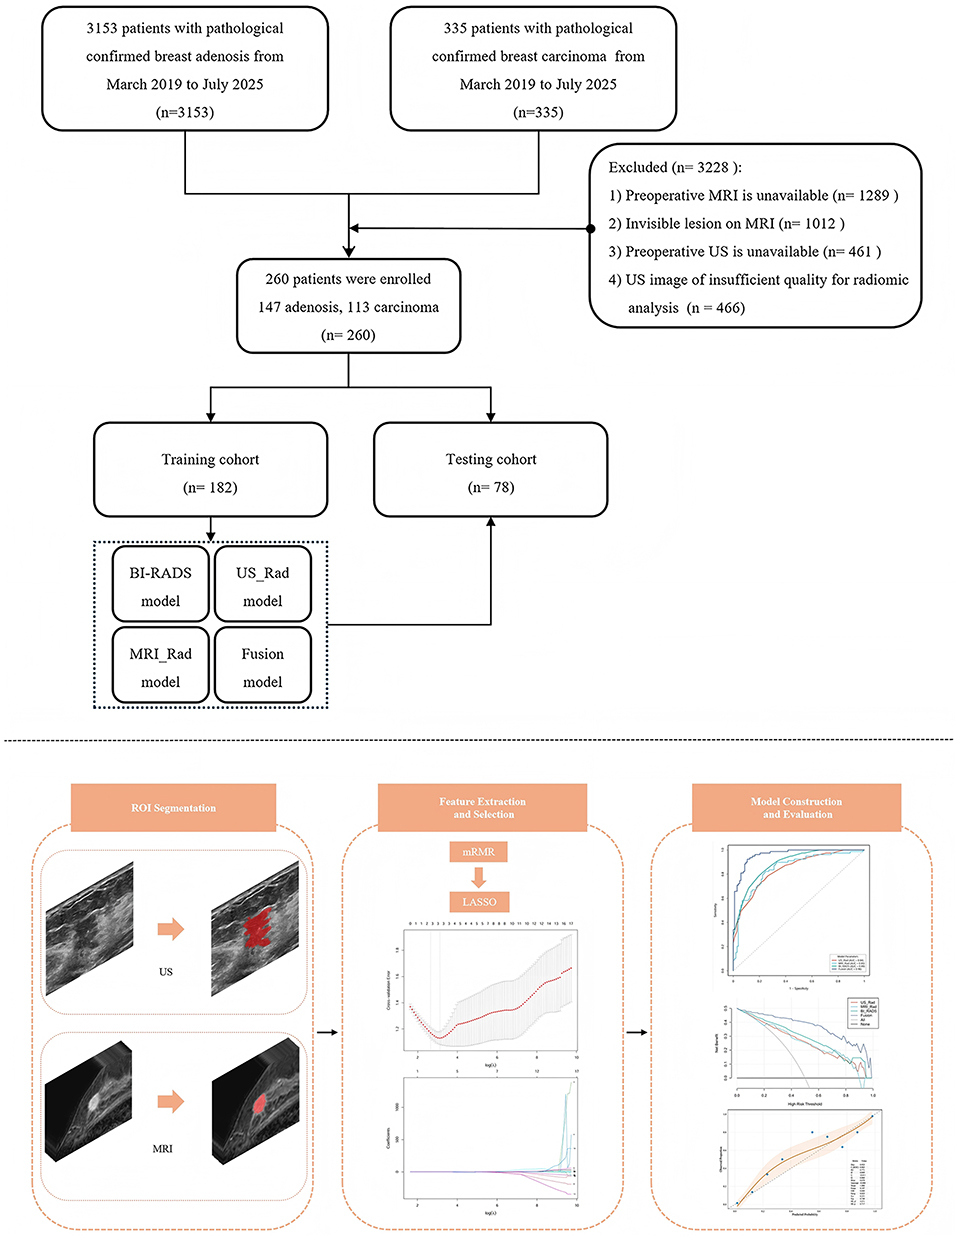 |
Figure 1 Flowchart of this study. The upper panel depicts the patient enrollment process. The bottom panel summarizes the workflow of the radiomic analysis, including image processing, feature extraction and selection, and model development. Abbreviations: US, ultrasound; MRI, magnetic resonance imaging; mRMR, minimum redundancy maximum relevance; LASSO, least absolute shrinkage and selection operator. |
Imaging Acquisition and Interpretation
Breast US images from all patients were obtained using US equipment manufactured by Mindray (DC-8, DC-8s; Mindray Medical International Co., Ltd., Shenzhen, China), Canon (Aplio i800; Canon Medical System, Tochigi, Japan) with linear-array transducer in transverse and longitudinal planes. Representative images depicting the largest diameter of lesions were saved. The radiologists, each with 3–5 years of experience in breast US and blinded to the pathological results, evaluated the US images. According to the 5th edition ACR BI-RADS US lexicon, the US features including shape, margin, orientation, size, internal echo, posterior echo change, microcalcification, and vascularity were analyzed. Any discrepancies in interpretations were resolved through consensus after discussion with a third senior radiologist, who has over 10 years of experience.
MRI examination was performed following the same protocol as previously described.13 All T2-weighted images (T2WI), diffusion-weighted imaging (DWI), apparent diffusion coefficient (ADC) maps, and dynamic contrast-enhanced MRI (DCE-MRI) series were reviewed and analyzed in accordance with the BI-RADS lexicon. Restricted diffusion was defined by the presence of hyperintensity on DWI with corresponding hypointensity on the ADC map. The MRI features included tumor shape (round/oval, irregular), margin (circumscribed, non-circumscribed), restricted diffusion (present, absent), and non-mass enhancement (present, absent). The second phase of T1-weighted contrast-enhanced sequence was selected for the extraction of radiomic features.
Radiomics Analysis
Imaging Pre-Processing and Segmentation
The grayscale US image displaying the lesion’s largest diameter and the second phase of contrast-enhanced MRI imaging were selected and exported in Digital Imaging and Communications in Medicine (DICOM) format. Prior to segmentation, the N4 bias field correction algorithm in SimpleITK was applied to address MRI intensity inhomogeneity. Subsequently, all images were normalized to ensure consistency and comparability across different devices. The regions of interest (ROIs) were manually delineated along the lesion margins by two independent radiologists (each with 3–5 years of experience) using ITK-SNAP software (version 4.2.0, http://www.itksnap.org), while blinded to the clinical data and pathological results. To assess the reliability of feature extraction, intra- and inter-observer agreement was assessed with the intraclass correlation coefficient (ICC) based on a random sample of 50 patients.
Feature Selection
For the selection of US and BI-RADS features, both univariate and multivariate analyses were conducted, retaining those with a p-value<0.05 for the development of the BI-RADS model. Radiomic feature extraction from the US and MRI images was performed using the Pyradiomics package (Python 3.9). The extracted radiomics features were categorized into three groups: (1) first-order statistics (eg, mean, median, standard deviation); (2) texture features, which comprise of features derived from Gray Level Co-occurrence Matrix (GLCM, eg, contrast, correlation, energy), Gray Level Difference Matrix (GLDM, eg, coarseness, busyness), Gray-level Size Zone Matrix (GLSZM), and Neighbouring Gray Tone Difference Matrix (NGTDM);14–16 and (3) shape features (eg, volume, surface area). Dimensionality reduction of radiomic features was initiated by Z-scores normalization. This was followed by the utilization of the maximum relevance minimum redundancy (mRMR) algorithm, which yield 50 highest-ranked features. From this subset, the features identified as top-ranked by the Least Absolute Shrinkage and Selection Operator (LASSO) regression were utilized in constructing the radiomic models.
Model Construction
Optimal features with nonzero coefficients were selected using LASSO to calculate the US radiomic score (US_rad) and the MRI radiomic score (MRI_rad). Twelve machine learning models, including support vector machine (SVM), multilayer perceptron (MLP), stochastic gradient descent (SGD), logistic regression (LR), TabPFN, Extra Trees, AdaBoost, k-Nearest neighbors (KNN), CatBoost, LightGBM, Random Forest, and XGBoost, were applied to develop the BI-RADS, US_Rad, and MRI_Rad models based on the optimal BI-RADS features, US_rad, and MRI_rad, respectively. The optimal model was identified based on its performance in both cohorts. Subsequently, a post-fusion strategy was employed to construct a combined diagnostic model for patients with both US and MRI examinations available. To develop the fusion model, the prediction scores from the US_Rad, MRI_Rad, and BI-RADS models, along with patient age, were used as input variables for a LR algorithm.
Model Evaluation
Model performance was evaluated using multiple metrics, including the area under the receiver operating characteristic (ROC) curve (AUC), accuracy, sensitivity, specificity, positive predictive value (PPV), and negative predictive value (NPV). Calibration curve and decision curve analysis (DCA) were performed to evaluate the calibration performance and clinical utility. The DeLong test was employed to compare the efficacy of different models in distinguishing adenosis from carcinoma.
Statistical Analysis
Statistical analyses were performed using Python (version 3.9) and MedCalc software (version 20.010). Continuous variables were summarized as mean ± standard deviation if normally distributed, or as median (25th-75th percentiles) otherwise. Group comparisons for continuous variables were conducted using independent samples t-tests (for normally distributed data) or the Mann–Whitney U-test (for non-normally distributed data). Categorical variables were expressed as numbers (percentages) and compared using the chi-square test or Fisher’s exact test, as appropriate. A p-value < 0.05 was considered statistically significant.
Results
Patients Characteristics
A total of 260 lesions from 260 patients (age range: 20–83 years; mean age: 47.76 ± 12.25 years) were included in this study. Among these lesions, 147 were confirmed as adenosis with a mean age of 43.20 ± 10.63 years, while 113 were identified as carcinoma with a mean age of 52.66 ± 11.81 years. To maintain the proportion distribution of positive events, the patients were randomly divided into a training cohort (n = 182) and a testing cohort (n = 78) at a 7:3 ratio via stratified random sampling. The clinical baseline characteristics of the patients, including age, US features, and MRI features, are detailed in Table 1. In both cohorts, patients with adenosis were significantly younger than those with carcinoma (all p < 0.01; Tables 2 and 3). The US features of the two lesions differed significantly in both cohorts regarding margin, shape, calcification, and vascularity (all p < 0.05; Tables 2 and 3), while a difference in orientation was noted only in the training cohort (p < 0.05; Table 2). In terms of MRI features, significant differences between the two lesion types in both cohorts were identified in shape, margin, and restricted diffusion (Tables 2 and 3). Representative US and MRI features of breast adenosis and carcinoma are presented in Supplementary Figures S1 and S2, respectively.
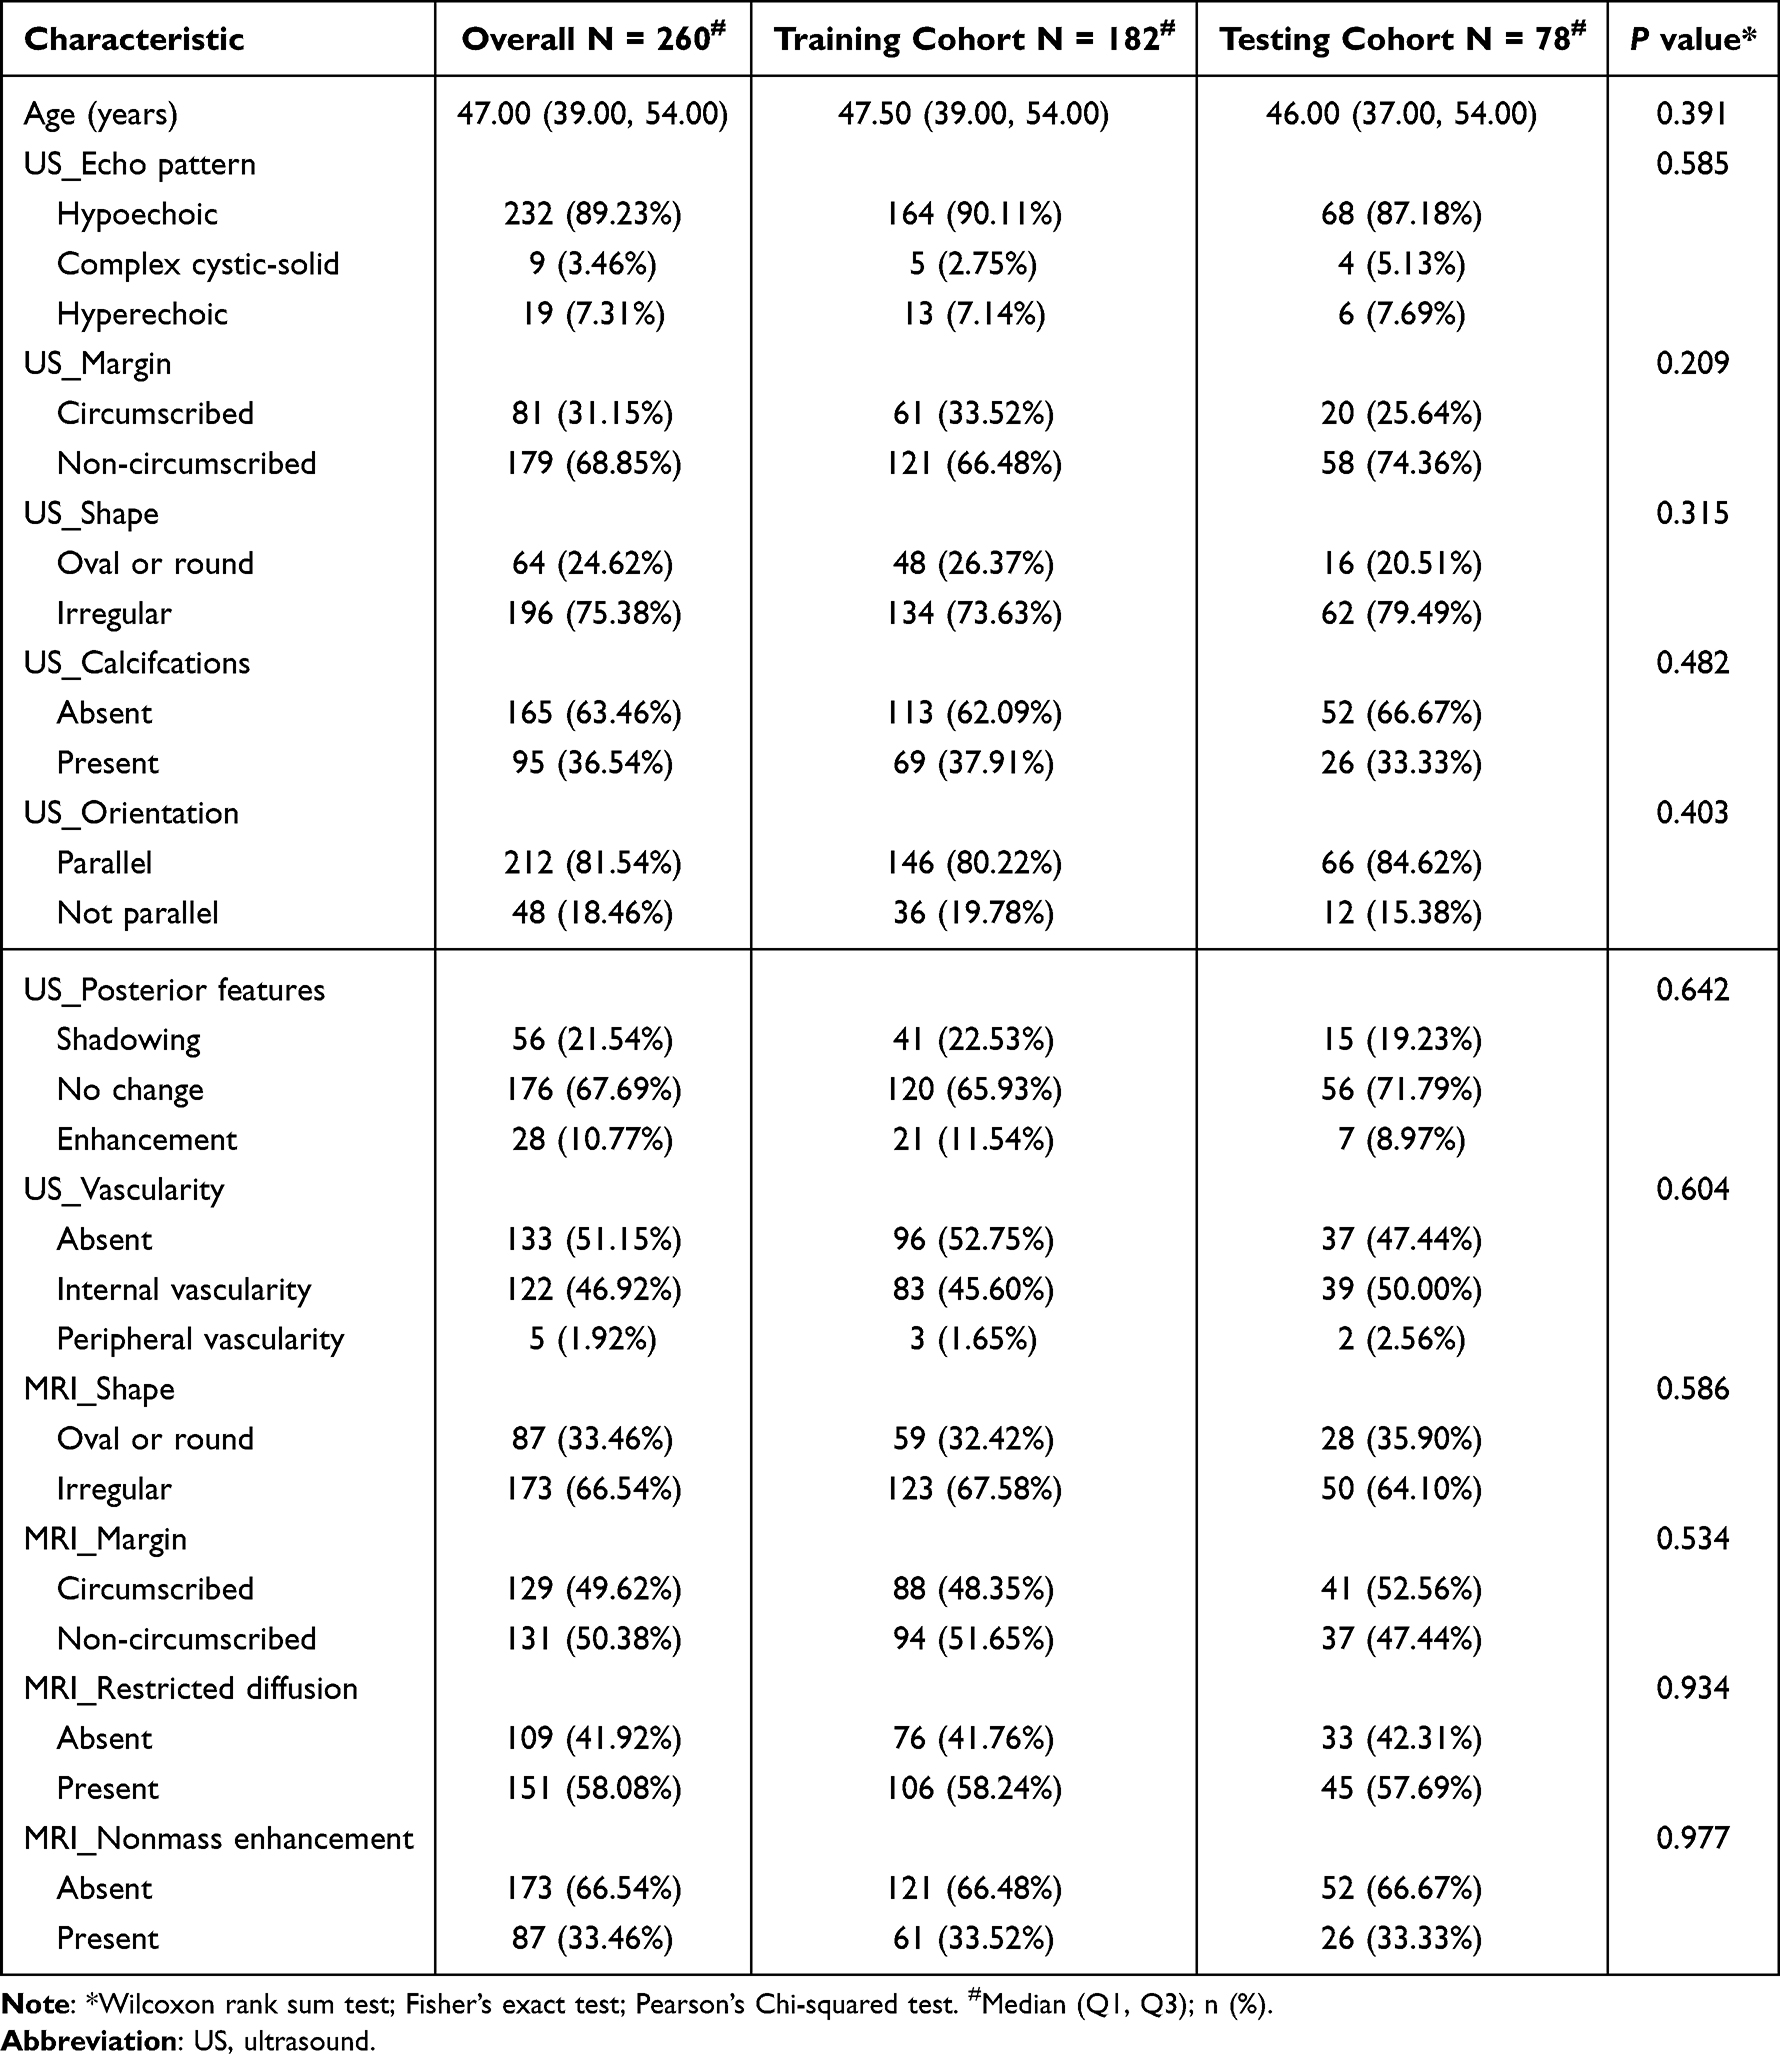 |
Table 1 Baseline Patients Clinical Characteristics |
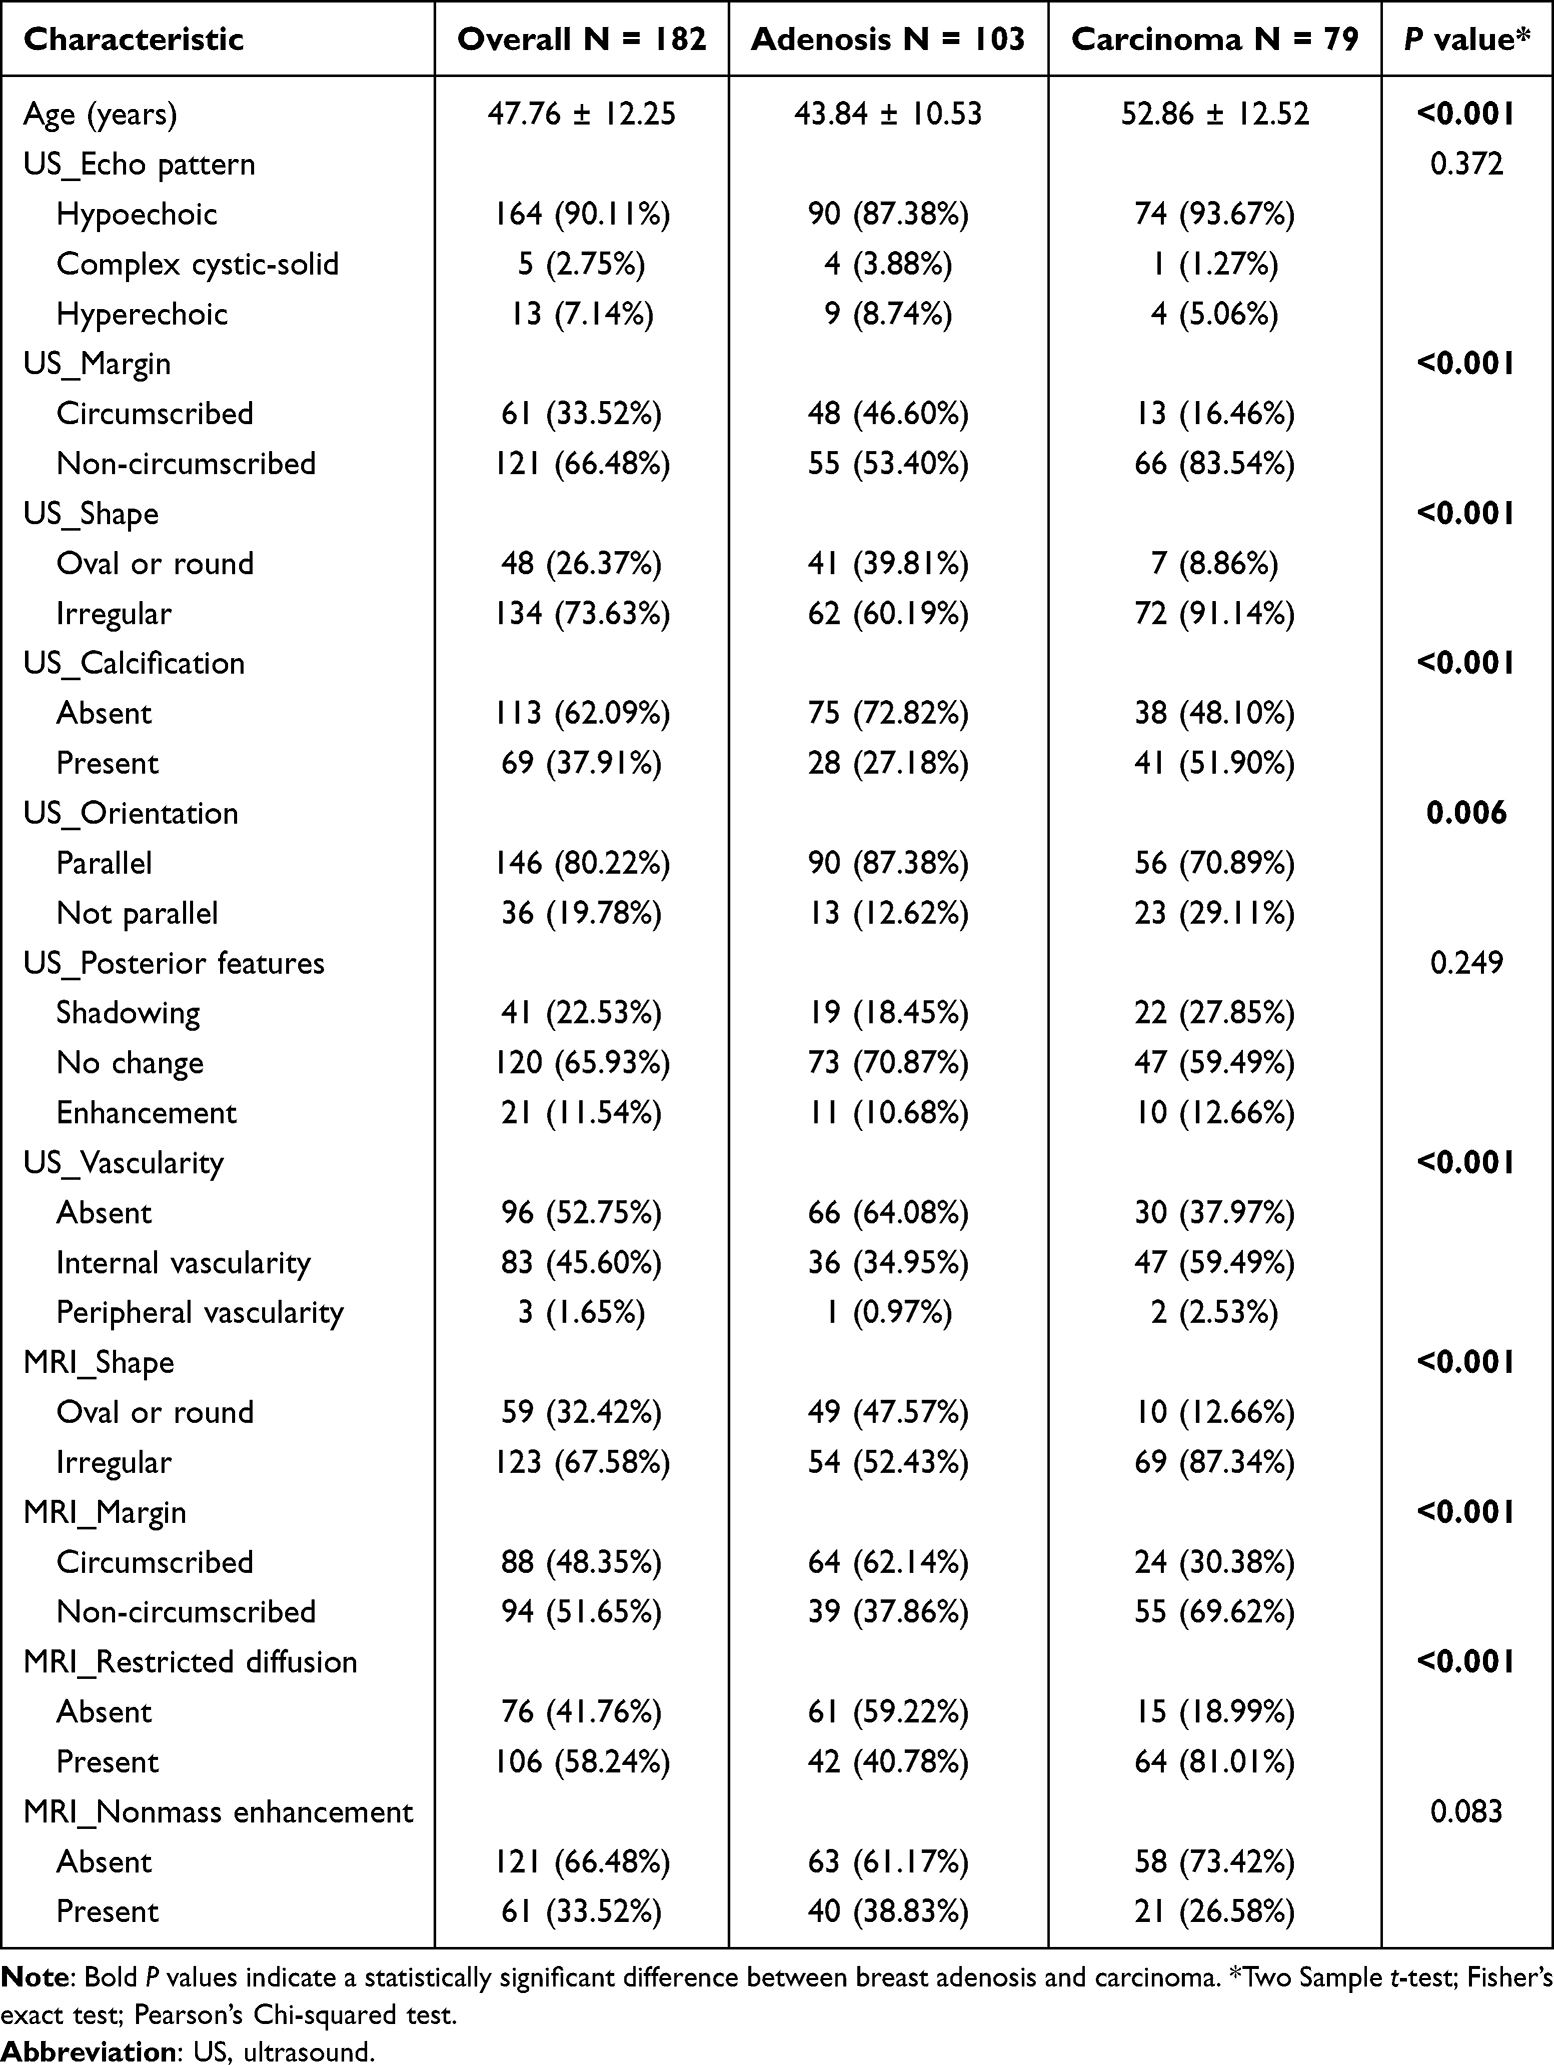 |
Table 2 Clinical Characteristics of Patients in the Training Cohort |
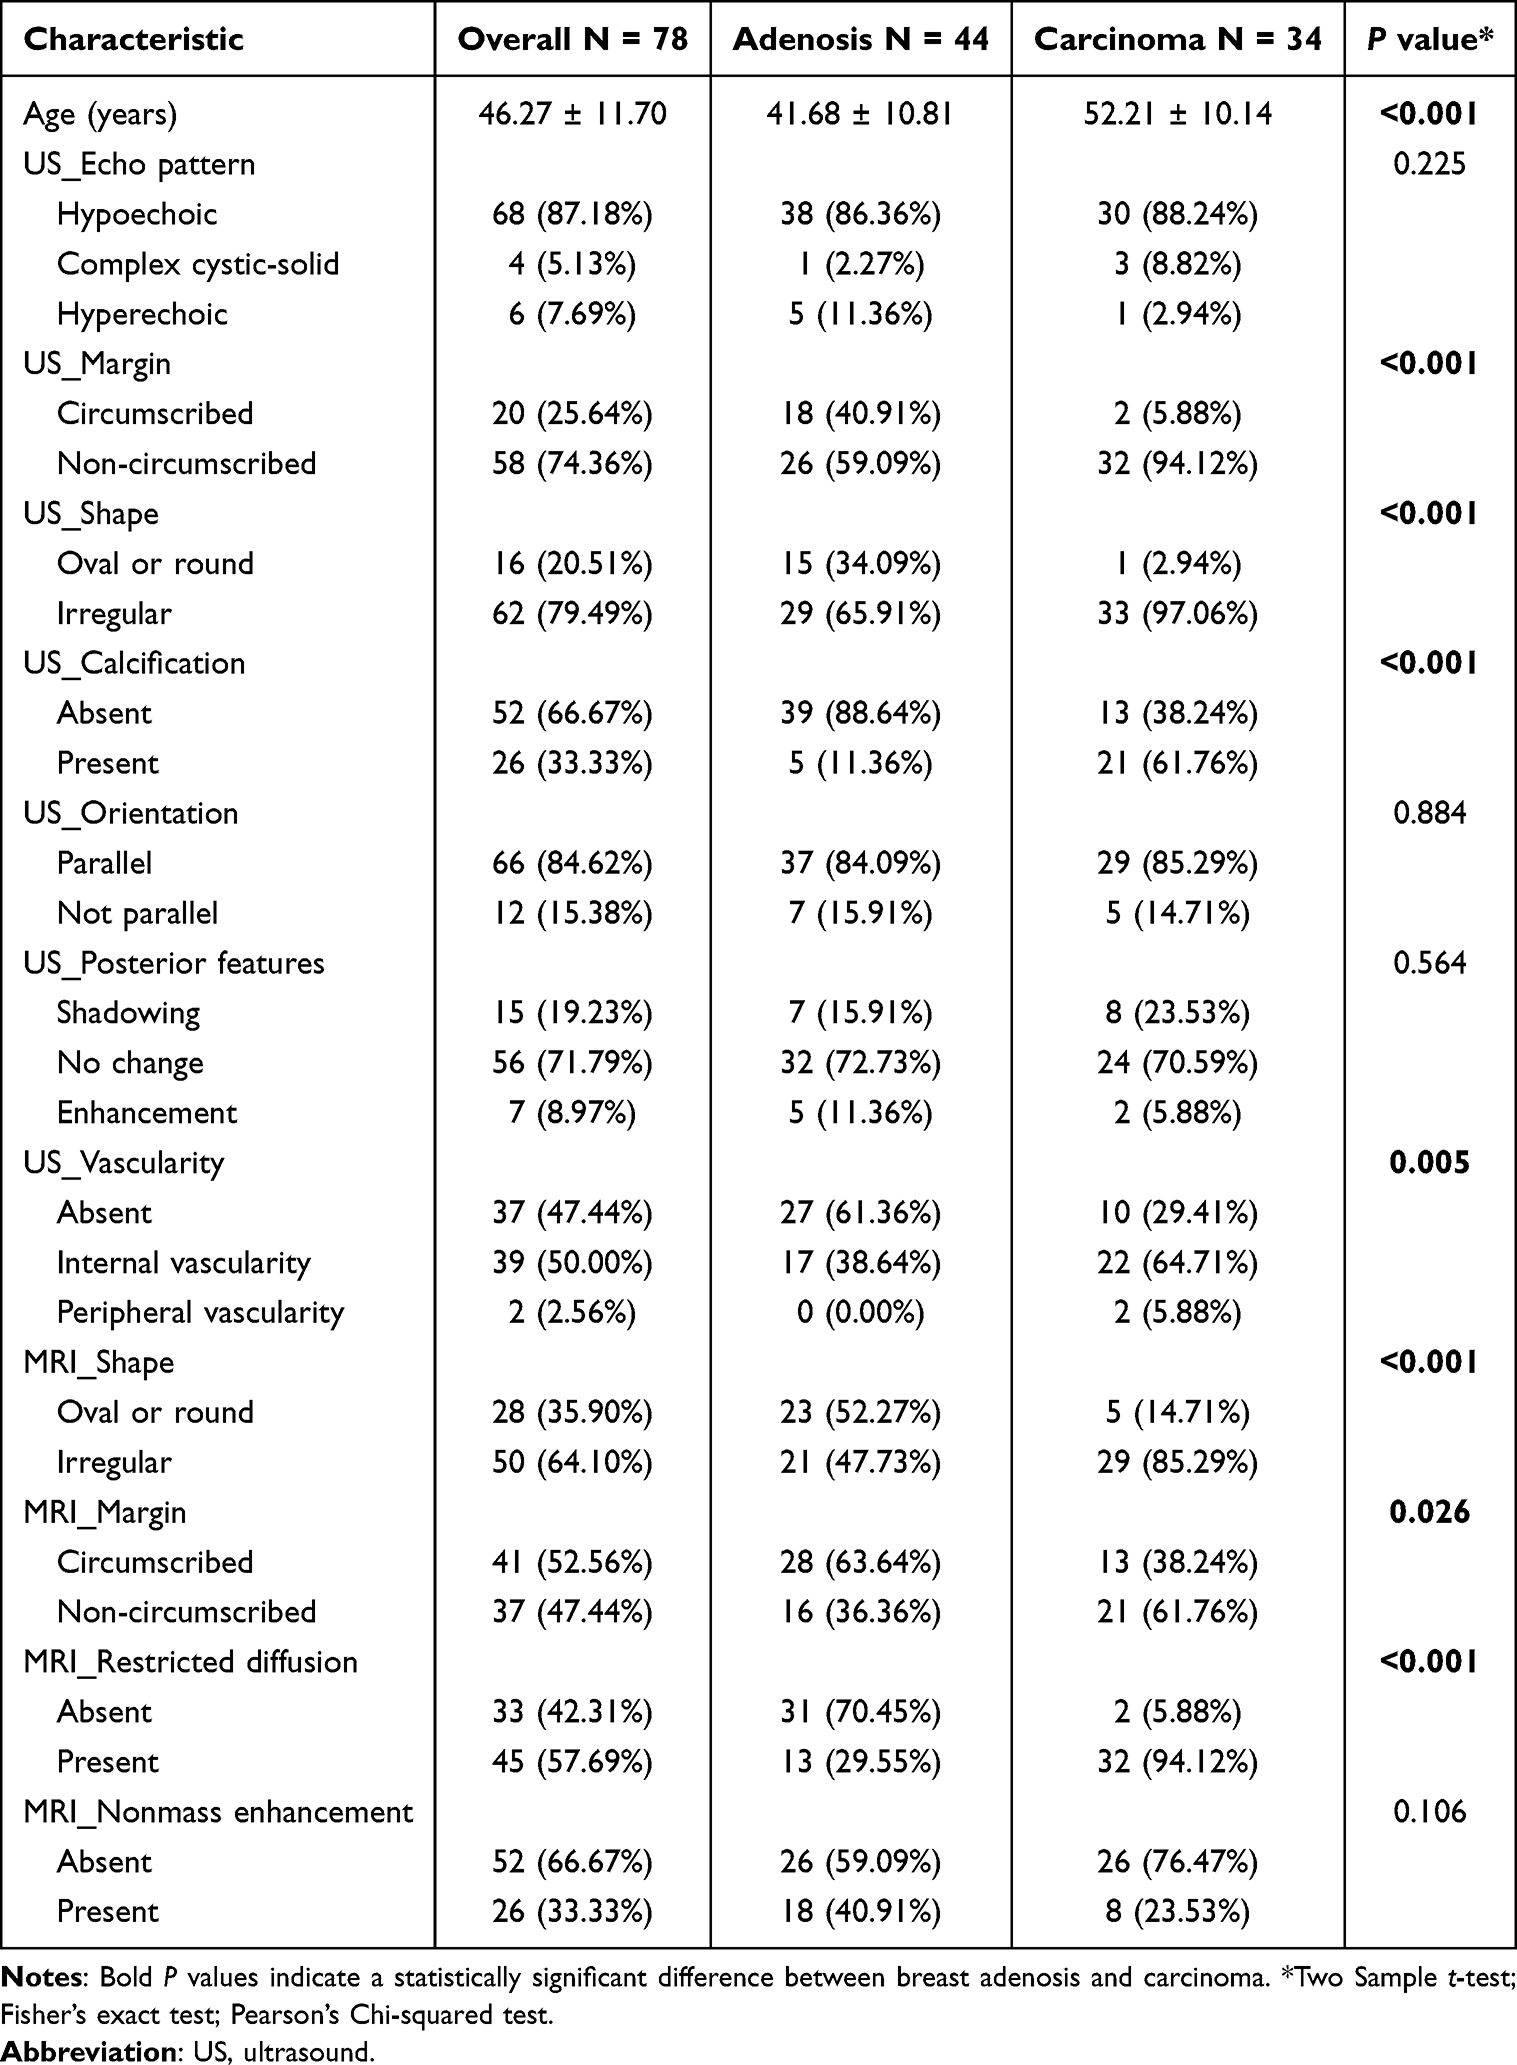 |
Table 3 Clinical Characteristics of Patients in the Testing Cohort |
Performance of BI-RADS Model
Multivariate analysis identified five BI-RADS features, which included three US features (margin, calcification, vascularity) and two MRI features (shape, restricted diffusion), that were incorporated into the final BI-RADS model (Figure 2). The model was constructed using the CatBoost algorithm, which demonstrated the best performance among 12 tested algorithms for differentiating breast adenosis from carcinoma in the training cohort. It achieved an AUC value of 0.89 [95% confidence interval (CI), 0.84–0.93], with accuracy, sensitivity, specificity, PPV, and NPV of 0.80, 0.78, 0.81, 0.76, and 0.83, respectively (Supplementary Figure S3a and Table 4). In the testing cohort, the BI-RADS model also showed a great performance with an AUC of 0.91 [95% CI, 0.83–0.97] and an accuracy, sensitivity, specificity, PPV, and NPV of 0.86, 0.85, 0.86, 0.83, and 0.88, respectively (Supplementary Figure S3b and Table 4).
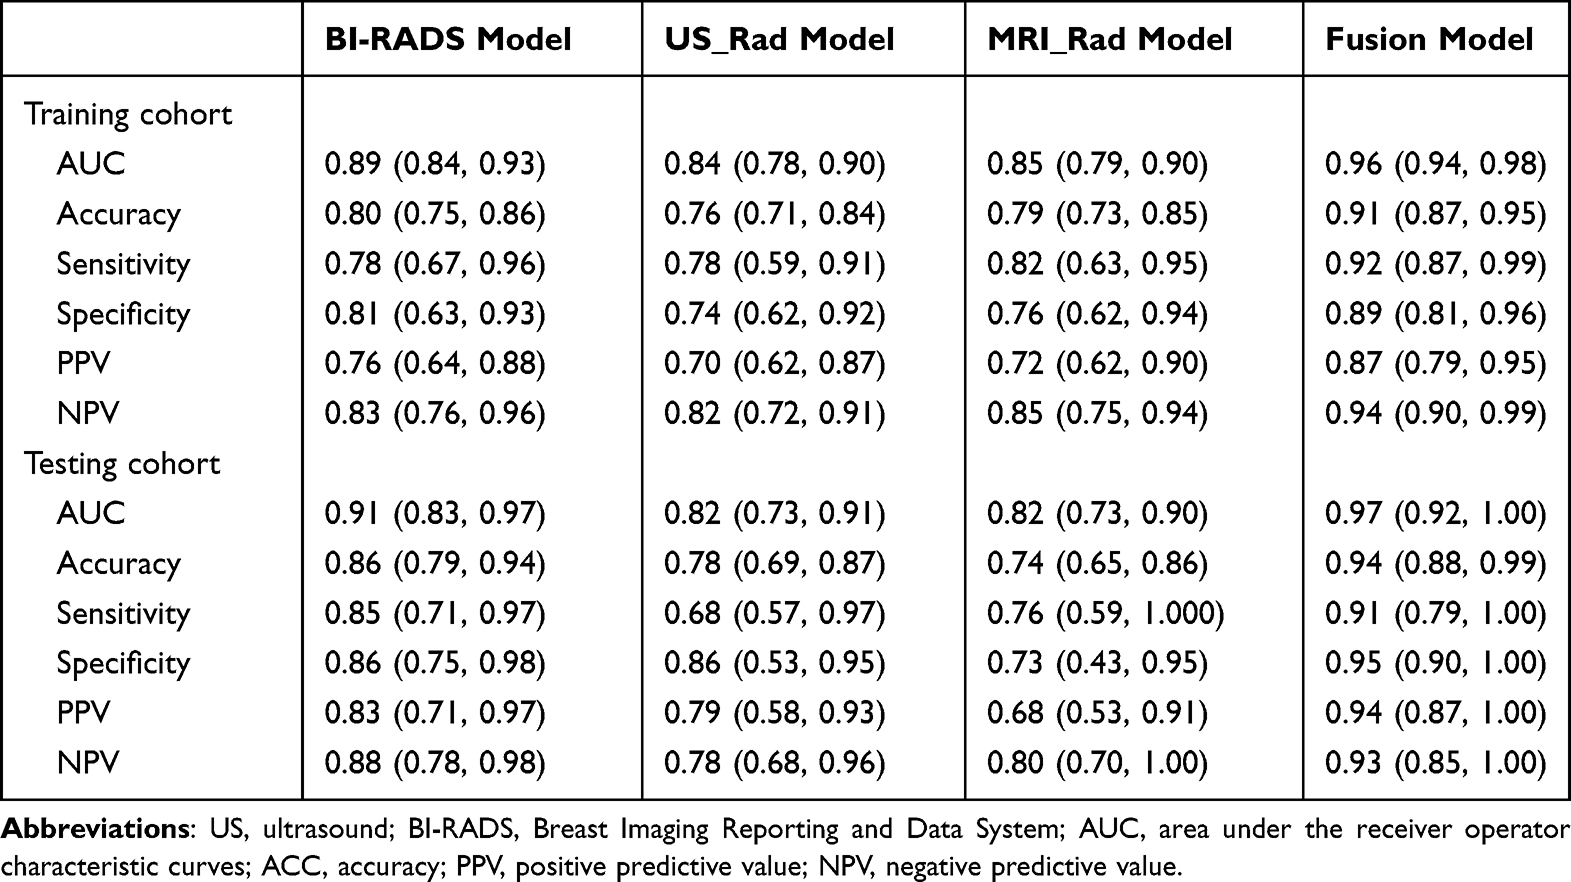 |
Table 4 Performance of Models for Discriminating Breast Adenosis from Carcinoma |
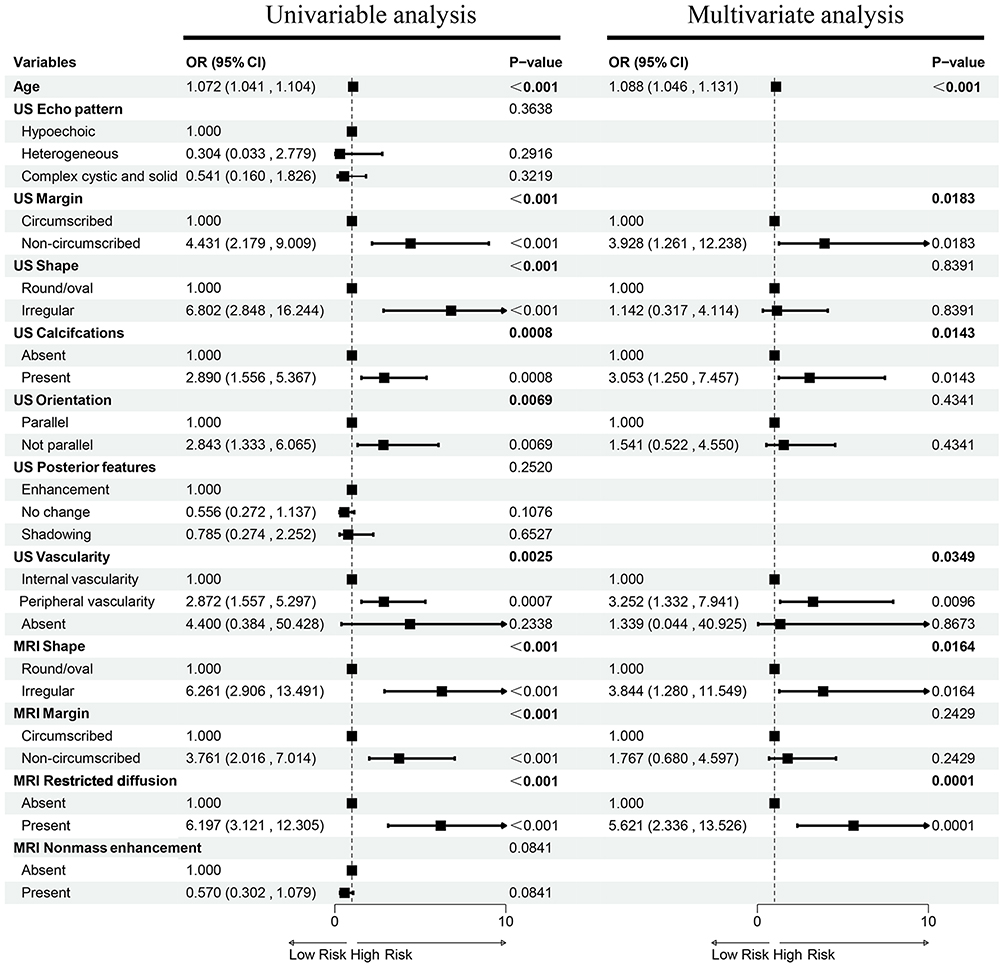 |
Figure 2 Forest plot of the multivariate logistic regression analysis identifying independent US (margin, calcification, and vascularity) and MRI (shape and restricted diffusion) BI-RADS features associated with breast carcinoma. Other US features (echo pattern, shape, orientation, and posterior features) and MRI features (margin and nonmass enhancement) showed no significant difference between breast adenosis and carcinoma. Bold P values indicate statistical significance. Abbreviations: US, ultrasound; MRI, magnetic resonance imaging. |
Performance of Radiomic Model
Following feature selection, five and three radiomic features were retained to calculate the US_rad and MRI_rad, respectively. Definitions of features used in the radiomics signatures are provided in Supplementary Table 1, while detailed formulas are presented in Supplementary Equations 1 and 2. For the US_Rad model, CatBoost was identified as the optimal algorithm, achieving an AUC value of 0.84 (95% CI, 0.78–0.90) in the training cohort and 0.82 (95% CI, 0.73–0.91) in the testing cohort (Supplementary Figure S4). For the MRI_Rad model, SVM algorithm demonstrated the best performance, with AUCs of 0.85 (95% CI, 0.79–0.90) and 0.82 (95% CI, 0.73–0.90) in the training and testing cohorts, respectively (Supplementary Figure S5).
Performance of Fusion Model
The fusion model, which incorporated age, US_Rad, MRI_Rad, and BI-RADS models, demonstrated an AUC of 0.96 (95% CI, 0.94–0.98) and an accuracy, sensitivity, specificity, PPV, and NPV of 0.91, 0.92, 0.89, 0.87, and 0.94, respectively, in the training cohort (Figure 3a and Table 4). The fusion model also showed a excellent performance in the testing cohort, with an AUC of 0.97 (95% CI, 0.92–1.00) and an accuracy, sensitivity, specificity, PPV, and NPV of 0.94, 0.91, 0.95, 0.94, and 0.93, respectively (Figure 3b and Table 4). The performance of different models in seven evaluating metrics in both cohorts was shown in radar chart (Figure 3c and d), which demonstrated a higher AUC, F1 score, accuracy, PPV, and specificity of fusion model. Delong test revealed that the AUC of the fusion model is markedly higher than any individual model within training cohort (all p < 0.05). DCA demonstrated that fusion model produces greater net gains compared to other models over the relevant threshold range among the entire cohort (Figure 4a and b). The calibration curve illustrated a significant agreement between the predicted probability as determined by the fusion model and the observed outcomes in both cohorts (p>0.05; Figure 4c and d).
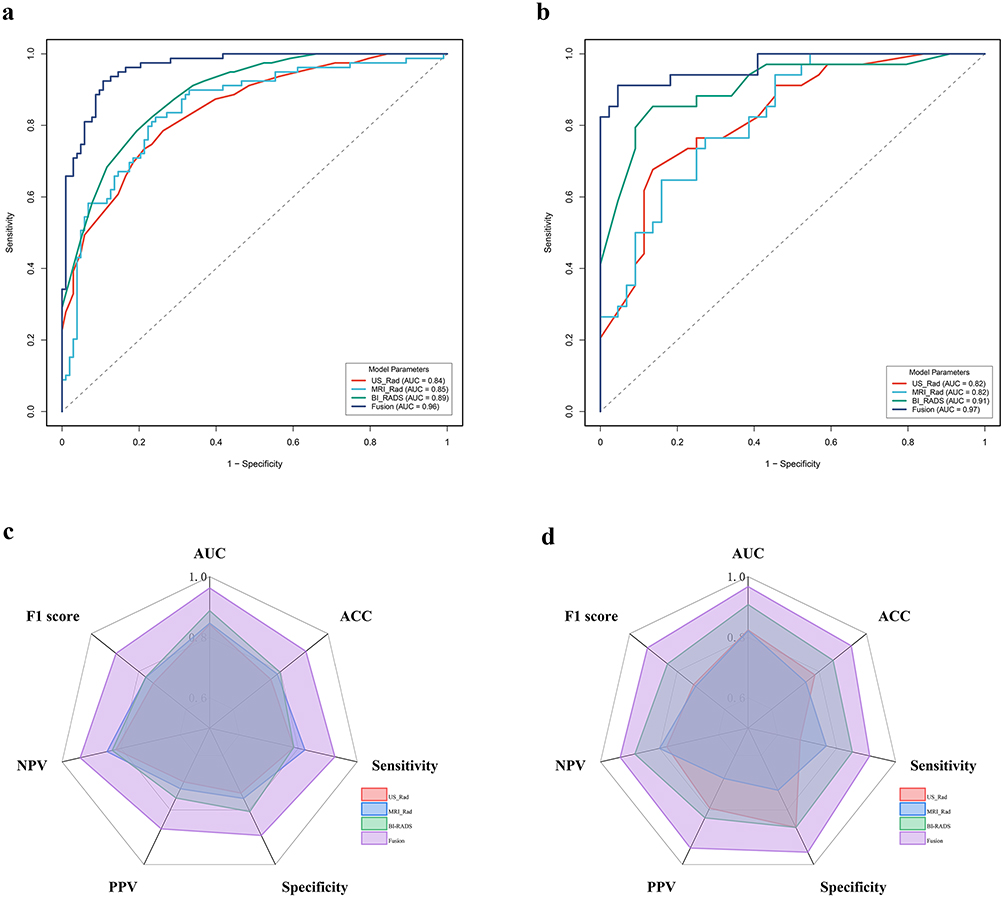 |
Figure 3 Performance evaluation of the US_Rad, MRI_Rad, BI-RADS, and Fusion models in differentiating breast adenosis from carcinoma. (a and b) Receiver operating characteristic (ROC) curves and (c and d) radar plots of seven evaluation metrics for the training and testing cohorts, respectively. Abbreviations: AUC, area under the receiver operator characteristic curves; ACC, accuracy; PPV, positive predictive value; NPV, negative predictive value. |
 |
Figure 4 Decision curve analysis of the US_Rad, MRI_Rad, BI-RADS, and Fusion models in the training and testing cohorts, respectively (a and b). Calibration curves of the fusion model in the training and testing cohorts (c and d). |
A heat map was constructed to clearly illustrate the key clinical characteristic and BI-RADS features of each patient, including age, US_margin, US_calcification, and others. Furthermore, it summarizes the predictive probabilities for breast carcinoma versus adenosis based on various model outputs (Figure 5).
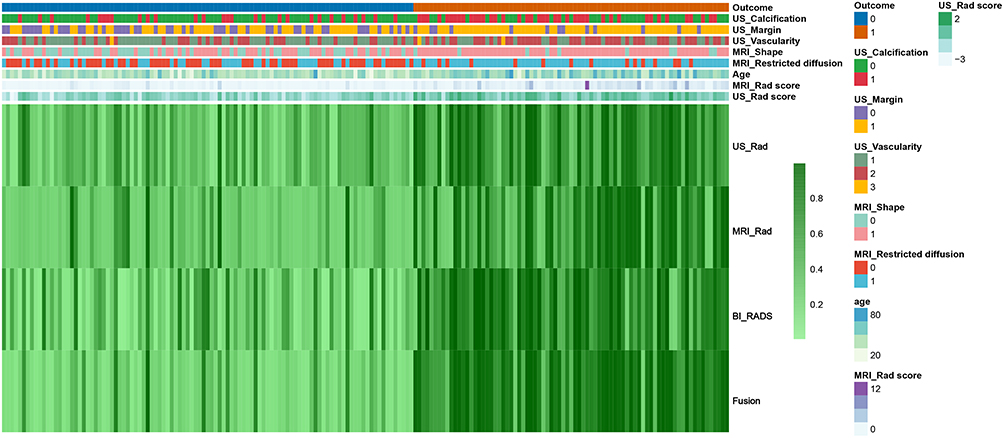 |
Figure 5 Heatmap displaying key clinical and BI-RADS features for each patient, alongside the predicted probability of breast carcinoma from different models. |
Discussion
Accurate differentiation of breast adenosis from carcinoma using radiological modality, such as US, MG, or MRI remains challenging. To address this, we developed and validated a fusion model that combines radiomic features from both US and MRI. The fusion model exhibited better diagnostic performance than either the radiomic models, or BI-RADS model in each evaluating metrics. This finding highlighted the superiority of integrating multimodal information over depending on unimodality for distinguishing breast adenosis from carcinoma.
Univariate analysis revealed that breast adenosis was more prevalent among younger women, consistent with previous studies.17–19 In our training cohort, adenosis more frequently exhibited a regular shape (oval or round), circumscribed margins, and parallel orientation, but less frequently exhibited calcification and high (II–III) vascularity grades on US compared to carcinoma, which is consistent with previous studies.5,20 Compared with US, studies on MRI for differentiating adenosis from carcinoma remain limited, leaving its distinguishing features incompletely understood. This study therefore evaluated MRI BI-RADS features and found that adenosis more frequently presents with regular shape, well-defined margins, and less restricted diffusion. On breast MRI, non-mass enhancement is a nonspecific finding observed in both benign and malignant conditions.21,22 Although it was more frequent in adenosis (38.83%) than in carcinoma (26.58%), the difference was not statistically significant, which is consistent with its non-specific nature. Although adenosis in our cohort showed fewer malignancy-associated BI-RADS features than carcinoma on both US and MRI, such suspicious findings were still common, underscoring its potential to mimic cancer. For example, on US, irregular shape and non-circumscribed margins were observed in 61.90% and 55.10% of adenosis cases, respectively, while on MRI, 51.02% exhibited an irregular shape. Utilizing those informative US and MRI BI-RADS features, our study developed a BI-RADS model to differentiate adenosis from carcinoma, yielding an AUC of 0.91 in the testing cohort. This performance surpasses that reported by Lin et al, who developed a modality-specific enhancement breast network model using multimodal US images (B-mode US, color Doppler flow imaging, and contrast-enhanced ultrasound) and achieved an AUC of 0.87.12 The superior performance of our model can be attributed to the synergistic effect of US and MRI feature. While US excels at capturing high-resolution morphological changes, MRI provides functional and hemodynamic insights. For instance, although adenosis (especially sclerosing adenosis) can mimic the morphology of malignancy, it generally lacks the higher cellularity (restricted diffusion on MRI). However, it should be noted that the evaluation of these BI-RADS features relies on subjective assessment, which is inherently prone to bias.
Unlike conventional qualitative BI-RADS assessment, radiomics provides objective and quantifiable features. Increasing evidence supports the value of US and MRI radiomic models in diagnosing and characterizing breast lesions, including molecular subtyping and prognosis prediction, especially for breast neoplasms.9,23–25 In the present study, five texture features (GLCM_MaximumProbability, GLCM_Autocorrelation, GLDM_DependenceEntropy, NGTDM_coarseness, and GLSZM_ GrayLevelNonUniformityNormalized) demonstrated the highest discriminative power between breast adenosis and carcinoma. This discriminatory ability can be attribute to the underlying histopathological differences between the two entities. Adenosis, characterized by preserved architecture and uniform cellularity, presents with homogeneous and repetitive local textures, corresponding to higher GLCM maximum probability, higher NGTDM coarseness, and more uniform gray-level distributions (lower GLSZM gray-level non-uniformity). Conversely, carcinoma exhibits marked architectural distortion, heterogeneous cellularity, nuclear pleomorphism, and increased microvascular density. These malignant characteristics produce more heterogeneous and disordered tissue patterns, reflected by lower GLCM_maximum probability, higher GLDM_dependence entropy (indicating greater randomness in gray-level dependencies), and higher gray-level non-uniformity. Leveraging these biologically meaningful features, we constructed US_Rad and MRI_Rad model. The US_Rad model achieved an AUC of 0.84 and 0.82 in the training and testing cohorts, respectively. This performance was slightly lower than that reported by Li et al11 who constructed a convolutional neural network (CNN) model based on US images for differentiating sclerosing adenosis from breast cancer, which attained an AUC of 0.87. The performance difference may be attributed to the model algorithms. Unlike the traditional radiomics using in our US_Rad model, the deep-learning radiomics employed by Li et at. can provide high-level self-study features and prospective diagnostic ability for the classification of breast masses.26,27 Beyond US, MRI-based radiomic analysis has also been employed to identify adenosis. For instance, Ruan et al constructed a radiomic model using dynamic contrast-enhanced MRI to identify adenosis. In singlephase analysis, the second enhanced phase radiomic signature achieved the highest AUC of 0.88.6 This result is comparable to the performance of our MRI_Rad model, which was also developed using radiomic features extracted from the second enhanced phase and achieved an AUC of 0.85.
Previous studies indicate that multimodal radiomic models combining features from US with MG or MRI outperform single-modality approaches in tumor classification, treatment response prediction, and molecular subtyping.28,29 Therefore, we also developed a fusion model integrating BI-RADS, US_Rad, and MRI_Rad model to improve diagnostic performance. The fusion model indeed demonstrated robust performance, with AUCs of 0.96 in the training cohort and 0.97 in the testing cohort, representing the highest performance in distinguishing adenosis from carcinoma. Besides AUC, the fusion model also exhibit a higher value in other evaluation metrics, including F1 score, accuracy, sensitivity, specificity, PPV, and NPV. The integration of US and DCE-MRI for discriminating adenosis from carcinoma remains less explored. A study employed a radiomic model merging US and mammography, yielding an AUC of 0.949 for distinguishing adenosis from invasive ductal carcinoma.10 Ruan et al’s study, while the combination of multi-phase radiomic features and two dynamic radiomic features showed the highest AUC (0.92), this performance is inferior to that of the fusion model presented in our study.6 These findings indicate that the fusion model developed in our study may serve as a valuable tool for distinguishing adenosis from true malignancy in lesions categorized as BI-RADS 4 or higher.
This study has several limitations. First, as a retrospective study conducted at a single center, it is inherently susceptible to selection bias. Additionally, the relatively small sample size may lead to class imbalance. Although the stratified random sampling approach used in the present study may help to eliminate this imbalance, the sample size remains a constraint. Therefore, future validation in multi-center studies with larger sample sizes is necessary to evaluate the generalizability of the proposed fusion model. Additionally, epidemiological characteristics could not be evaluated due to incomplete patient data. Finally, variations in equipment and scanning parameters may limit the generalizability of the results.
Conclusions
In conclusion, the integration of US and MRI radiomic features demonstrates potential to aid in distinguishing breast adenosis from carcinoma. This approach may provide valuable supplementary information to improve diagnostic accuracy and aid clinical decision-making. However, to bridge the gap between these preliminary findings and clinical application, rigorous validation across multi-center cohorts is essential to verify the model’s generalizability.
Data Sharing Statement
The original contributions presented in the study are included in the article/supplementary material. Further inquiries can be directed to the corresponding author (Jingqin Fang, [email protected]).
Ethics Approval and Informed Consent
This study was approved by the institutional ethics committee of Daping Hospital of Army Medical University (Ratification No:2025-425), and informed consent was waived due to the retrospective character of the study.
Author Contributions
JQ Fang contributed to the conception and design of this work. YL Zhang and YH Fan participated to US imaging and data analysis. XJ Yao, HY zhou, D Han, and Y Xiao participated to data collection. YH Fan and JQ Fang contributed to article writing. YL Zhang and JQ Fang contributed to article revision. All authors contributed to the article and approved the submitted version. All authors made a significant contribution to the work reported, whether that is in the conception, study design, execution, acquisition of data, analysis and interpretation, or in all these areas; took part in drafting, revising or critically reviewing the article; gave final approval of the version to be published; have agreed on the journal to which the article has been submitted; and agree to be accountable for all aspects of the work.
Funding
This work was supported by the Innovation Ability Enhancement Project of Daping Hospital (Grant Number: ZXZYTSLC07), and Chongqing medical scientific research project (Joint project of Chongqing Health Commission and Science and Technology Bureau) (Grant Number: 2026MSXM145).
Disclosure
The authors declare that they have no competing interests.
References
1. Stachs A, Stubert J, Reimer T, Hartmann S. Benign breast disease in women. Deutsches Arzteblatt International. 2019;116(33–34):565–15. doi:10.3238/arztebl.2019.0565
2. Visscher DW, Nassar A, Degnim AC, et al. Sclerosing adenosis and risk of breast cancer. Breast Cancer Res Treat. 2014;144(1):205–212. doi:10.1007/s10549-014-2862-5
3. Chen H, Bao L, Yu L, et al. Value of multimodal imaging in the diagnosis of breast sclerosing adenosis associated with malignant lesions. Clin Ultrasound. 2023;51(3):485–493. doi:10.1002/jcu.23376
4. Yu BH, Tang SX, Xu XL, et al. Breast carcinoma in sclerosing adenosis: a clinicopathological and immunophenotypical analysis on 206 lesions. J Clin Pathol. 2018;71(6):546–553. doi:10.1136/jclinpath-2017-204751
5. Liu W, Li W, Li Z, et al. Ultrasound characteristics of sclerosing adenosis mimicking breast carcinoma. Breast Cancer Res Treat. 2020;181(1):127–134. doi:10.1007/s10549-020-05609-2
6. Ruan M, Ding Z, Shan Y, et al. Radiomics based on DCE-MRI improved diagnostic performance compared to BI-RADS analysis in identifying sclerosing adenosis of the breast. Front Oncol. 2022;12:888141. doi:10.3389/fonc.2022.888141
7. Roisman LC, Kian W, Anoze A, et al. Radiological artificial intelligence - predicting personalized immunotherapy outcomes in lung cancer. NPJ Precis Oncol. 2023;7(1):125. doi:10.1038/s41698-023-00473-x
8. Chen Y, Huang Y, Li W, et al. Intratumoral microbiota-aided fusion radiomics model for predicting tumor response to neoadjuvant chemoimmunotherapy in triple-negative breast cancer. J Transl Med. 2025;23(1):352. doi:10.1186/s12967-025-06369-7
9. Qi YJ, Su GH, You C, et al. Radiomics in breast cancer: current advances and future directions. Cell Rep Med. 2024;5(9):101719. doi:10.1016/j.xcrm.2024.101719
10. Li W, Song Y, Qian X, et al. Radiomics analysis combining gray-scale ultrasound and mammography for differentiating breast adenosis from invasive ductal carcinoma. Front Oncol. 2024;14:1390342. doi:10.3389/fonc.2024.1390342
11. Li C, Zhang H, Chen J, et al. Deep learning radiomics of ultrasonography for differentiating sclerosing adenosis from breast cancer. Clin Hemorheol Microcirc. 2023;84(2):153–163. doi:10.3233/CH-221608
12. Lin Z, Chen L, Wang Y, Zhang T, Huang P. Improving ultrasound diagnostic precision for breast cancer and adenosis with modality-specific enhancement (MSE) - breast net. Cancer Lett. 2024;596:216977. doi:10.1016/j.canlet.2024.216977
13. Fan Y, Li X, Zhong P, et al. Radiological features for predicting the status of CD8-positive lymphocytes in HER2 positive breast cancer. Balkan Med J. 2024;41(3):213–221. doi:10.4274/balkanmedj.galenos.2024.2024-2-64
14. Haralick RM, Shanmugam K, Dinstein I. Textural features for image classification. IEEE Trans Syst Man Cybern Syst. 1973;SMC-3(6):610–621. doi:10.1109/TSMC.1973.4309314
15. Sun C, Wee WG. Neighboring gray level dependence matrix for texture classification. Comput Vision Graphics Image Process. 1983;23(3):341–352. doi:10.1016/0734-189X(83)90032-4
16. Thibault G, Fertil B, Navarro CL, et al. Texture indexes and gray level size zone matrix. Application to cell nuclei classification. 2009.
17. Liang T, Cong S, Yi Z, et al. Ultrasound-based nomogram for distinguishing malignant tumors from nodular sclerosing adenoses in solid breast lesions. J Ultrasound Med. 2021;40(10):2189–2200. doi:10.1002/jum.15612
18. Liu L, Hao X, Song Z, Zhi X, Zhang S, Zhang J. Correlation between family history and characteristics of breast cancer. Sci Rep. 2021;11(1):6360. doi:10.1038/s41598-021-85899-8
19. Liu H, Chen Y, Zhang Y, et al. A deep learning model integrating mammography and clinical factors facilitates the malignancy prediction of BI-RADS 4 microcalcifications in breast cancer screening. Eur Radiol. 2021;31(8):5902–5912. doi:10.1007/s00330-020-07659-y
20. Li Y, Wei XL, Pang KK, et al. A comparative study on the features of breast sclerosing adenosis and invasive ductal carcinoma via ultrasound and establishment of a predictive nomogram. Front Oncol. 2023;13:1276524. doi:10.3389/fonc.2023.1276524
21. Goksu K, Vural A, Kahraman AN. Characteristics of non-mass enhancement in contrast-enhanced breast mri and associations with malignancy. J Cancer. 2025;16(10):3103–3111. doi:10.7150/jca.114087
22. Uematsu T, Kasami M. High-spatial-resolution 3-T breast MRI of nonmasslike enhancement lesions: an analysis of their features as significant predictors of malignancy. AJR. 2012;198(5):1223–1230. doi:10.2214/AJR.11.7350
23. Jiang M, Li CL, Luo XM, et al. Ultrasound-based deep learning radiomics in the assessment of pathological complete response to neoadjuvant chemotherapy in locally advanced breast cancer. Eur. J. Cancer. 2021;147:95–105. doi:10.1016/j.ejca.2021.01.028
24. Yu Y, Chen R, Yi J, et al. Non-invasive prediction of axillary lymph node dissection exemption in breast cancer patients post-neoadjuvant therapy: a radiomics and deep learning analysis on longitudinal DCE-MRI data. Breast. 2024;77:103786. doi:10.1016/j.breast.2024.103786
25. Ramtohul T, Djerroudi L, Lissavalid E, et al. Multiparametric MRI and radiomics for the prediction of HER2-zero, -low, and -positive breast cancers. Radiology. 2023;308(2):e222646. doi:10.1148/radiol.222646
26. Guo X, Liu Z, Sun C, et al. Deep learning radiomics of ultrasonography: identifying the risk of axillary non-sentinel lymph node involvement in primary breast cancer. EBioMedicine. 2020;60:103018. doi:10.1016/j.ebiom.2020.103018
27. Zhang X, Liang M, Yang Z, et al. Deep learning-based radiomics of B-mode ultrasonography and shear-wave elastography: improved performance in breast mass classification. Front Oncol. 2020;10:1621. doi:10.3389/fonc.2020.01621
28. Kim R, Chang JM, Lee HB, et al. Predicting axillary response to neoadjuvant chemotherapy: breast MRI and US in patients with node-positive breast cancer. Radiology. 2019;293(1):49–57. doi:10.1148/radiol.2019190014
29. Xiong L, Tang X, Jiang X, et al. Automatic segmentation-based multi-modal radiomics analysis of US and MRI for predicting disease-free survival of breast cancer: a multicenter study. Breast Cancer Res. 2024;26(1):157. doi:10.1186/s13058-024-01909-3
 © 2026 The Author(s). This work is published and licensed by Dove Medical Press Limited. The
full terms of this license are available at https://www.dovepress.com/terms
and incorporate the Creative Commons Attribution
- Non Commercial (unported, 4.0) License.
By accessing the work you hereby accept the Terms. Non-commercial uses of the work are permitted
without any further permission from Dove Medical Press Limited, provided the work is properly
attributed. For permission for commercial use of this work, please see paragraphs 4.2 and 5 of our Terms.
© 2026 The Author(s). This work is published and licensed by Dove Medical Press Limited. The
full terms of this license are available at https://www.dovepress.com/terms
and incorporate the Creative Commons Attribution
- Non Commercial (unported, 4.0) License.
By accessing the work you hereby accept the Terms. Non-commercial uses of the work are permitted
without any further permission from Dove Medical Press Limited, provided the work is properly
attributed. For permission for commercial use of this work, please see paragraphs 4.2 and 5 of our Terms.
Recommended articles
The Depiction of Hypertension in Heart Imaging Examinations: An Up-to-Date Review of the Evidence
Vasileiadis K, Antza C, Kotsis V
Vascular Health and Risk Management 2023, 19:789-796
Published Date: 28 November 2023
Machine Learning-Based CEMRI Radiomics Integrating LI-RADS Features Achieves Optimal Evaluation of Hepatocellular Carcinoma Differentiation
Liu HF, Lu Y, Wang Q, Lu YJ, Xing W
Journal of Hepatocellular Carcinoma 2023, 10:2103-2115
Published Date: 29 November 2023


Enhancement Pattern Mapping for Early Detection of Hepatocellular Carcinoma in Patients with Cirrhosis

Nikzad N, Fuentes DT, Roach M, Chowdhury T, Cagley M, Badawy M, Elkhesen A, Hassan M, Elsayes KM, Beretta L, Koay EJ, Jalal PK
Journal of Hepatocellular Carcinoma 2024, 11:595-606
Published Date: 20 March 2024
Preoperative Prediction of Breast Cancer Histological Grade Using Intratumoral and Peritumoral Radiomics Features from T2WI and DWI MR Sequences
Guo Y, Liao J, Li S, Shang Y, Wang Y, Wu Q, Wu Y, Wang M, Yan F, Tan H
Breast Cancer: Targets and Therapy 2024, 16:981-991
Published Date: 19 December 2024
Radiomics of Dynamic Contrast-Enhanced MRI for Predicting Radiation-Induced Hepatic Toxicity After Intensity Modulated Radiotherapy for Hepatocellular Carcinoma: A Machine Learning Predictive Model Based on the SHAP Methodology
Liu F, Chen L, Wu Q, Li L, Li J, Su T, Li J, Liang S, Qing L
Journal of Hepatocellular Carcinoma 2025, 12:999-1015
Published Date: 17 May 2025