Back to Journals » Journal of Inflammation Research » Volume 16
Integrating Bulk and Single-Cell RNA Sequencing Reveals Heterogeneity, Tumor Microenvironment, and Immunotherapeutic Efficacy Based on Sialylation-Related Genes in Bladder Cancer
Authors Tan Z ![]() , Chen X, Zuo J, Fu S, Wang J, Wang H
, Chen X, Zuo J, Fu S, Wang J, Wang H
Received 11 May 2023
Accepted for publication 24 July 2023
Published 14 August 2023 Volume 2023:16 Pages 3399—3417
DOI https://doi.org/10.2147/JIR.S418433
Checked for plagiarism Yes
Review by Single anonymous peer review
Peer reviewer comments 2
Editor who approved publication: Dr Tara Strutt
Zhiyong Tan,1– 3,* Xiaorong Chen,4,* Jieming Zuo,1– 3,* Shi Fu,1– 3,* Jiansong Wang,1– 3 Haifeng Wang1– 3
1Department of Urology, the Second Affiliated Hospital of Kunming Medical University, Kunming, Yunnan, People’s Republic of China; 2Urological Disease Clinical Medical Center of Yunnan Province, the Second Affiliated Hospital of Kunming Medical University, Kunming, Yunnan, People’s Republic of China; 3Scientific and Technological Innovation Team of Basic and Clinical Research of Bladder Cancer in Yunnan Universities, the Second Affiliated Hospital of Kunming Medical University, Kunming, Yunnan, People’s Republic of China; 4Department of Kidney Transplantation, the Third Hospital of Sun Yat-Sen University, Guangzhou, People’s Republic of China
*These authors contributed equally to this work
Correspondence: Jiansong Wang; Haifeng Wang, Department of Urology, the Second Affiliated Hospital of Kunming Medical University, Yunnan Institute of Urology, Kunming, 650101, People’s Republic of China, Email [email protected]; [email protected]
Background: As known abnormal sialylation exerts crucial roles in the growth, metastasis, and immune evasion of cancers, but the molecular characteristics and roles in bladder cancer (BLCA) remain unclear. This study intends to establish BLCA risk stratification based on sialylation-related genes and elucidate its role in prognosis, tumor microenvironment, and immunotherapy of BLCA.
Methods: Bulk RNA-seq and scRNA-seq data were downloaded from open-access databases. The scRNA-seq data were processed using the R package “Seurat” to identify the core cell types. The tumor sub-typing of BLCA samples was performed by the R package “ConsensusClusterPlus” in the bulk RNA-seq data. Signature genes were identified by the R package “limma” and univariate regression analysis to calculate risk scores using the R package “GSVA” and establish risk stratification of BLCA patients. Finally, the differences in clinicopathological characteristics, tumor microenvironment, and immunotherapy efficacy between the different groups were investigated.
Results: 5 core cell types were identified in the scRNA-seq dataset, with monocytes and macrophages presenting the greatest percentage, sialylation-related gene expression, and sialylation scores. The bulk RNA-seq samples were classified into 3 tumor subtypes based on 19 prognosis-related sialylation genes. The 10 differential expressed genes (DEGs) with the smallest p-values were collected as signature genes, and the risk score was calculated, with the samples divided into high and low-risk score groups. The results showed that patients in the high-risk score group exhibited worse survival outcomes, higher tumor grade, more advanced stage, more frequency of gene mutations, higher expression levels of immune checkpoints, and lower immunotherapy response.
Conclusion: We established a novel risk stratification of BLCA from a glycomics perspective, which demonstrated good accuracy in determining the prognostic outcome, clinicopathological characteristics, immune microenvironment, and immunotherapy efficacy of patients, and we are proposing to apply it to direct the choice of clinical treatment options for patients.
Keywords: bladder cancer, bulk RNA-seq, scRNA-seq, sialylation, tumor microenvironment, immunotherapy
Introduction
Bladder cancer (BLCA) is one of the most prevalent malignancies of the urinary system, with an estimated 573,000 new cases and 213,000 deaths worldwide in 2020.1 Depending on the tissue type, it can be classified into urothelial and non-urothelial cancers, out of which urothelial cancer is the most frequent pathological type of BLCA, accounting for about 90%.2 Upon the invasion depth, it can be divided into non-muscle invasive bladder cancer (NMIBC) and muscle-invasive bladder cancer (MIBC), and their ratio is about 3:1 in patients with BLCA at the first consultation.3 Risk factors in developing BLCA include smoking, and exposure to cyclic chemicals, dyes, and paints. Despite the accelerated development of comprehensive treatment with multiple therapies in recent years, including surgery, chemotherapy, radiotherapy, and immunotherapy. However, the high recurrence rate and high infiltration of BLCA have resulted in a poor prognostic outcome of patients with a median survival of merely 14 months.4 Thus, a more in-depth investigation of the underlying mechanisms of BLCA is required to unlock new openings and identify more sensitive biomarkers for early diagnosis, individualized treatment, and prognostic outcomes of BLCA patients. The aberrant salivary acidification was observed in preceding research to play a critical role in the growth, metastasis, and immune evasion of several tumors5,6 and could be applied as a biomarker for specific tumors.7
Sialylation is a type of glycosylation that covalently attaches sialic acid to the terminal glycans of glycoproteins and glycolipids to produce sialic acid-containing sialoglycans,8 which usually covers the surface of tumor cells and can be adopted as tumor-associated antigens serving as biomarkers for the detection and monitoring of cancer, including sialyl-Tn (sTn), sialyl-T (sT) and sialyl-Lewis antigens et al.9 Numerous pieces of evidence have shown that the dense sialoglycans coat on the surface of tumor cells has significant implications in promoting tumor growth, metastasis, and immune evasion.10,11 Sialylation of integrins and selectins can interfere with cell adhesion molecules and promote the metastasis of neoplasm cells to distant sites,12,13 alternatively in ovarian cancer sialyltransferase ST3GAL1 (ST3 β-Galactoside α-2,3-Sialyltransferase 1) can also promote tumor metastasis through the TGF-β1 (Transforming growth factor-β1) signaling pathway induces EMT (Epithelial-Mesenchymal Transition) to promote tumor metastasis.14 Hypersialylation of cell death receptors inhibits apoptosis and promotes the growth of colon cancer cells.15 In terms of immune evasion, intensive sialoglycans on the surface of tumor cells conceal the underlying glycan and protein epitopes, rendering immune cells unable to recognize antigens;16 they can also avoid immune cell attack by decorating themselves with sialic acid-bound antigens17 or by mimicking the cell surface glycosylation of healthy cells.18 Elevated sialoglycans levels have also been detected in BLCA and the sTn antigen associated with BLCA grade and muscle invasion is a hallmark of poor prognosis.19 Nevertheless, there are relatively scarce studies on BLCA, so the exact role and mechanism of sialoglycans in BLCA remain uncertain. In this study, we analyzed sialylation-related gene expression heterogeneity in urothelial carcinoma cells by scRNA-seq data and integrated bulk RNA-seq to screen prognosis-related sialylation signature genes for risk stratification of BLCA patients by calculating risk scores. Then, we conducted a comparative analysis of various aspects including tumor microenvironment and immunotherapy efficacy in patients with high and low-risk groups to reveal the effects and potential mechanisms of sialylation-related genes in BLCA for providing more sensitive prognostic biomarkers and therapeutic targets for BLCA patients.
Materials and Methods
Data Sources and Processing
A total of 934 BLCA samples diagnosed as urothelial carcinoma and 26 melanoma samples from open-access datasets were included, which contained complete information on gene expression, clinical features, survival, and treatment. The scRNA-seq dataset GSE145281 containing 10 peripheral blood mononuclear cells (PBMCs) samples from BLCA patients treated with atezolizumab (anti-PD-L1 mAb) was used to reveal the core cell types and the expression of sialylation gene in the cells of BLCA patients. The transcriptomic and clinical data (including age, grade, TNM stage, survival status, and survival time, etc.) from the TCGA-BLCA dataset of 411 samples and the GSE13507 dataset of 165 samples were downloaded from UCSC Xena (https://xenabrowser.net/) and the Gene Expression Omnibus (GEO) database (http://www.ncbi.nlm.nih.gov/geo/) as the bulk RNA-seq training dataset by merging and correcting batch effects using the R packages “limma” and “sva”,20 which was applied to construct sialylation-related risk model. To evaluate the predictive potential of sialylation-related genes on the efficacy of immunotherapy in BLCA patients, we first obtained transcriptomic and matched clinical data from the IMvigor210 cohort (n=348) of patients with locally advanced/metastatic urothelial carcinoma all treated with anti-PD-L1 by using the “IMvigor210CoreBiologies” package (http://research-pub.gene.com/IMvigor210CoreBiologies).21 For the enhancement of the predictive stability of risk stratification, we also included melanoma patients receiving anti-PD1 therapy obtained from the GSE78220 dataset (n=26) as a supplement.
ScRNA-Seq Analysis
ScRNA-seq data were filtered and analyzed using the R package “Seurat”.22 First, we conducted quality control of single-cell data by the following criteria: 1) exclusion of genes covered by less than 3 cells, 2) removal of cells expressing less than 200 genes, 3) retained cells with less than 5% of the mitochondrial gene, and 4) included cells with less than 7500 genes. In the subsequent processing, we reduced the batch effect between samples by R package “harmony” and normalized the scRNA-seq data by “ScaleData”, then principal component analysis (PCA) was performed, the “RunUMAP”23 function to reduce the dimensionality and “FindAllMarkers” for finding differentially expressed genes in different clusters. Finally, the R package “singleR”24 combined with manual adjustment for cluster annotation, leading to the acquisition of the core cell types of BLCA patients.
Gene Sets Variation Analysis (GSVA)
We downloaded the HALLMARK pathway data from the Msigdb database (http://www.gsea-msigdb.org/gsea/index.jsp) and utilized the R package “GSVA”25 for scoring the pathway in each cell type. To investigate the heterogeneity of sialylation-related genes in the expression of BLCA patient cells, we accessed 105 sialylation-related genes from the study of Zhou et al26 and calculate the sialylation score of each cell by the ssGSEA method in the R package “GSVA”. Furthermore, to examine the correlation between sialylation scores and function among cell types, we also performed a correlation analysis and divided the patients into high and low-score groups based on the median value of sialylation scores, with comparing the differences in HALLMARK pathway enrichment between the two groups.
Consensus Clustering Analysis
Univariate Cox proportional risk regression analysis was performed in the training set and extracted the genes with p-values < 0.05 as prognostic genes, whereby we conducted consensus cluster analysis using the R package “ConsensusClusterPlus”27 to identify tumor subtypes. Followed by the Kaplan-Meier survival curve plotted by the R package “survminer” (https://CRAN.R-project.org/package=survminer) and the Log rank test to ascertain the prognostic differences between subtypes. To detect the underlying mechanisms leading to the differences in prognosis among the different tumor subtypes, we downloaded the HALLMARK pathway, KEGG pathway, and Reactome pathway data from the Msigdb database, and used the R package “GSVA” to verify the discrepancies in the pathways among the 3 subtypes and visualized with heatmaps by the R package “pheatmap”.28
Analysis of Immune Cell Infiltration and Functional Enrichment Analysis
To analyze the immune cell characteristics between 3 tumor subtypes, we adopted the R package “ESTIMATE”29 and the ssGSEA method in the R package “GSVA” to measure immune cell infiltration fractions for each sample. Differential analysis was performed between subtypes using the “limma” package, and genes that exhibited a |log2 (fold change)|>1 and p-value<0.05 were considered as DEGs, visualized with heatmaps by the R package “ggplot2”.30 Subsequently, functional enrichment analysis of DEGs was investigated through the Kyoto Encyclopedia of Genes and Genomes (KEGG) and Gene Ontology (GO) analyses using the R package “clusterProfiler”.31
Risk Stratification and Clinicopathological Characteristics of BLCA Patients
Given the DEGs, the top 10 genes were ultimately integrated into the signature geneset by univariate analysis and ranking p-values, then the secondary consensus clustering analysis was performed, it turned out that a good clustering effect and significant differences in survival outcomes between subtypes and eventually accepted as the result of BLCA patient subtypes. For more accuracy in risk stratification of BLCA patients, we calculated risk scores based on the signature genes via the R package “GSVA”, classified the training set samples into high and low-risk score groups by the optimal cut-off values, and drew survival curve and heatmap to demonstrate the differences in survival outcomes and clinical characteristics between the two groups of patients. More specifically, the clinicopathological characteristics of the samples included fustat, gender, grade, stage, N stage, and T stage. The distribution of clinicopathological characteristics among groups was assessed using the Kruskal–Wallis test or the Wilcoxon rank test.
Immune Microenvironment Analysis
Initially, we measured the differences in gene mutations between patients in high and low-risk groups using the R package “maftools”,32 which may be partly responsible for the variable immune response in tumor patients. Afterward, we extracted the expression of 5 immune check loci (CD274, CTLA-4, LAG3, PDCD1, and TIGIT) and multiple chemokines for comparison between the two groups of patients by Wilcoxon test to reveal the relationship between risk score and immune microenvironment. In parallel, Pearson correlation analysis was undertaken to evaluate the association between risk scores and the HALLMARK pathways. p-value<0.05 was considered as a significant correlation and visualized by bar plots with the R package “ggplot2”.
Evaluation and Validation of Immunotherapeutic Efficacy
To further explore the potential guidance of risk scores for immunotherapy, we collected 2 tumor immunotherapy datasets, including the GSE78220 dataset of melanoma patients treated with anti-PD1 and IMvigor210 cohort of bladder urothelial carcinoma patients treated with anti-PDL1, and divided the samples of the 2 datasets into high and low-risk score groups in terms of the optimal cut-off value of risk score, followed by comparing the differences in survival outcomes and response to immunotherapy between the two groups. Meanwhile, we validated the potential of the risk score in immunotherapy in the scRNA-seq dataset GSE145281 by the R package “ggplot2” to show the expression of signature genes in each core cell type and then using the R package “Seurat” to assess the relationship between the distribution of immunotherapeutic response and risk scores in patients. Moreover, we calculated the IC50 values of each sample for multiple anti-cancer drugs using the R package “pRRophetic”33 for targeted drug prediction in two groups, with absolute values of correlation greater than 0.4.
Results
Identification of BLCA Core Cell Subtypes
We followed the scRNA-seq data quality control procedure to discard low-quality cells and genes, as shown in Supplementary Figure 1: the number of cellular genes was mostly concentrated below 3000, the number of transcripts was under 4000, the percentage of mitochondrial content in each sample was extremely low, while the top 10 highly variable genes were labeled. Finally, 13,502 genes and 14,474 cells were captured for subsequent analysis. The 12 clusters were identified after umap dimensionality reduction, and annotation of clusters yielded 5 core cell types through the “singleR” package including CD4 T cells, CD8 T cells, NK cells, monocytes and macrophages, and B cells (Figure 1A).34 Detailed cell counts for each cell type were displayed in Figure 1B, and it can be seen that monocytes and macrophages accounted for the highest percentage, over 58%, and B cells accounted for the lowest percentage, less than 5%. The differentially expressed genes of each core cell type were searched by the FindAllMarkers algorithm, and the top 5 genes with up- and down-regulated expression for each cell type are indicated in Figure 1C, and the full list of differential genes can be found in Supplementary Table 1. For clarifying the functions of each cell and the biological processes participated in, we performed GSVA pathway scoring for each cell and discovered that monocytes and macrophages were involved in almost all HALLMARK pathways, including tumor growth promotion, cell cycle, energy metabolism, and immune response (Figure 2).
 |
Figure 1 Identification of core cell subtypes in BLCA based on scRNA-seq data. (A) 12 cell clusters and 5 core cell subtypes visualized by the UMAP algorithm in GSE145281. (B) Quantity and belonging of cells of each cluster. (C) Identification of top 5 differential genes for each cell subtype by FindAllMarkers. |
 |
Figure 2 HALLMARK pathway enrichment for 5 core cell subtypes by GSVA analysis. |
Expression Characteristics of Sialylation Genes in scRNA-Seq Data
Upon acquisition of the sialylation geneset, we evaluated the expression of each gene in diverse cell types and showed in a scatter plot in Figure 3A that the expression levels of PSAP and FCN1 were significantly higher in monocytes and macrophages than in other genes. To more specifically measure the heterogeneity of sialylation gene expression in individual cells, we calculated the sialylation score of each cell and found that monocytes and macrophages had the highest sialylation gene expression level and sialylation score, while the lowest sialylation score occurred in CD4 T cells (Figure 3B). All cells were classified into high- and low-sialylation score groups determined by the median value of sialylation score, it can be observed that the high-sialylation score group contained more monocyte and macrophages but fewer CD4 and CD8 T cells, suggesting that the patients in the high-sialylation score group may suffer from the immunosuppressed situation (Figure 3C and D). Hence, to explore the underlying explanations for the differences in immune status between the two groups, we performed GSVA enrichment analysis, which resulted in markedly higher enrichment of the HALLMARK pathway in the high-sialylation score group, particularly in the complement pathway and oxidative phosphorylation pathway (Figure 4A). Similarly, sialylation scores were significantly correlated with HALLMARK pathway scores in all cell types (p<0.05), with stronger positive correlations in B cells, monocytes, and macrophages (Figure 4B).
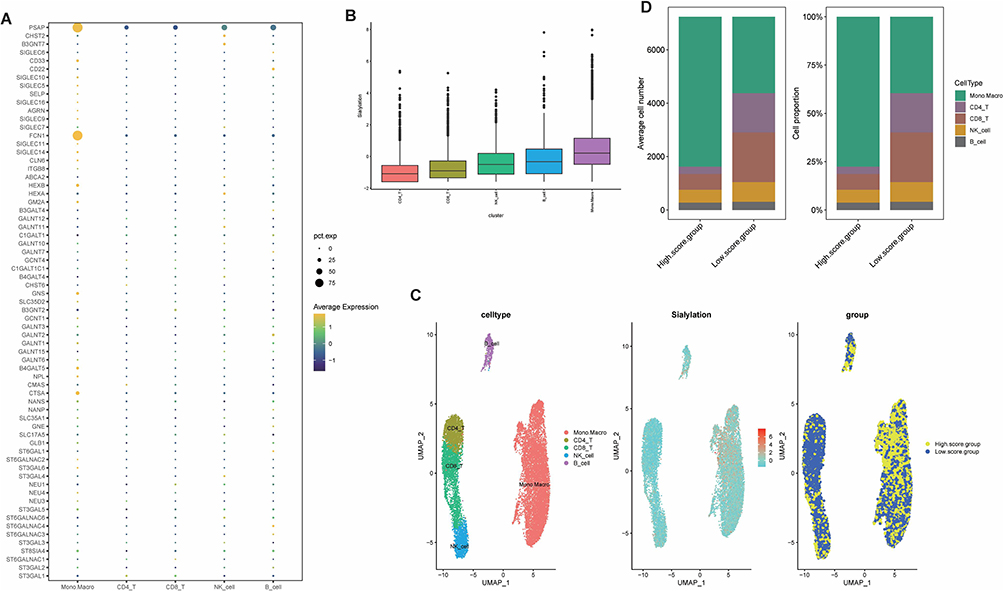 |
Figure 3 Expression characteristics of sialylation genes in scRNA-seq data. (A) Expression of sialylation genes in the individual cell types. (B) Sialylation scores for each cell subtype with GSVA. (C) Sialylation score expressing profile in individual cells and the distribution of cells in high- and low-sialylation score groups in the umap plot. (D) The proportion and count of each cell subtype in the high- and low-sialylation score groups. |
 |
Figure 4 Correlation between sialylation score and HALLMARK pathway enrichment. (A) Heatmap of the HALLMARK pathway in high- and low-sialylation score groups by R package pheatmap. (B) Association of hallmark pathway scores with sialylation scores among different cell subtypes. (*p value < 0.05; **p value < 0.01; ***p value < 0.001; ****p value < 0.0001). |
Screening for Prognosis-Related Sialylation Genes and Tumor Subtypes in Bulk RNA-Seq Data
Aiming to provide more stability and general application of the findings, we extracted bulk RNA-seq data from the TCGA-BLCA and GSE13507 dataset after removing batch effects and then combined them into a training set, and the PCA plots of the merged samples showed an even distribution between the two sets, with a total of 17,147 genes and 576 samples obtained (Figure 5A and B). In addition, we performed correlation analysis and univariate regression analysis across 19 prognosis-related sialylation genes (Figure 5C). We subjected the sialylation genes to univariate Cox regression analysis in the training set and identified 19 sialylation genes that were significantly associated with prognosis (p<0.05), out of which 5 were prognostic favorable factors, including B3GNT3, NPL, ST3GAL4, ST3GAL5, and GALNTL6, and the rest were risk factors (Supplementary Table 2), with Kaplan-Meier survival curve for each gene shown in Supplementary Figure 2. Immediately after, BLCA samples were classified into 3 tumor subtypes based on prognostic genes (Figure 6A), and the survival curves indicated significant differences in prognostic outcomes between subtypes (p<0.001), where median survival was significantly higher in cluster C than in the other two subtypes, and the worst in cluster A (Figure 6B). When comparing the expression of sialylation prognostic genes in the 3 subtypes, as shown in Figure 6C: except for SIGLEC6, there were remarkable differences in the expression of all genes in each subtype (p<0.05). The majority of risk factors in cluster C were expressed at low levels, whereas favorable factors were expressed at high levels, especially B3GNT3, ST3GAL4, and ST3GAL5. The distribution of the remaining clinical characteristics of gender, age, grade, stage, T stage, M stage, N stage, and fustat among the 3 subtypes is shown in Figure 6D.
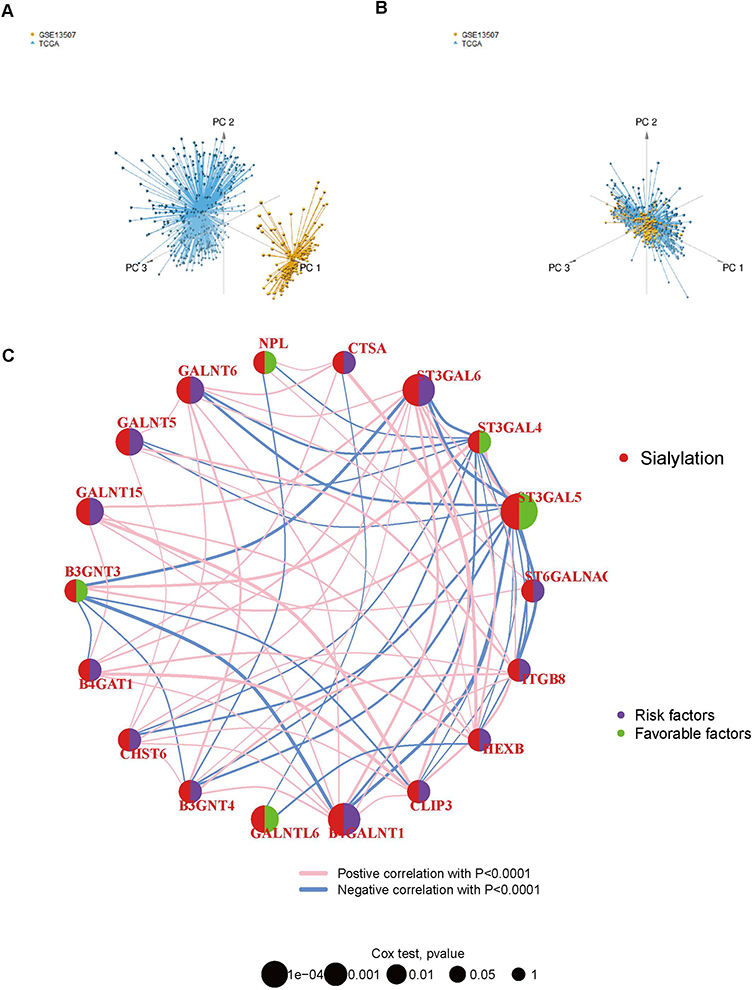 |
Figure 5 Significant correlation between sialylation-related genes and prognosis of BLCA patients. (A and B) PCA plots of TCGA-BLCA and GSE13507 datasets before and after integration by limma and sva packages. (C) Correlation analysis and Univariate regression analysis across 19 prognosis-related sialylation genes. Lines indicate a significant correlation between sialylation-related genes (p < 0.0001); purple indicates risk factors and green indicates favorable factors for OS. |
 |
Figure 6 Identification of 3 tumor subtypes by consensus clustering analysis based on prognosis-related sialylation genes. (A) Consensus matrix plots. K = 3 was determined as the optimal clustering number. (B) Kaplan-Meier survival analysis in clusters (A-C). (C) Differential expression of prognosis-related sialylation genes in tumor subtypes. (D) Heatmap of the interaction between prognosis-related sialylation genes and clinicopathological features among distinct tumor subtypes in BLCA. (*p value < 0.05; **p value < 0.01; ***p value < 0.001). |
Functional Enrichment and Immune Infiltration Analysis of Tumor Subtypes
To investigate the hidden motives for the different prognostic and clinicopathological characteristics between subtypes, we calculated the HALLMARK pathway, KEGG pathway, and Reactome pathway scores among the 3 tumor subtypes, respectively. Within the HALLMARK pathway, cluster A was primarily enriched in pro-tumor development and proliferation, immune response, and anti-tumor response (Figure 7A). For the KEGG pathway, cluster A was enriched in receptor signal transduction pathways, such as NOD-like receptor signaling pathway, and ECM receptor interaction et al (Figure 7B). Among the Reactome pathways, cluster A was mainly enriched in the tumorigenic and lipid metabolism pathways (Figure 7C). Whereas clusters B and C showed similar results in all three GSVA analyses, predominantly involved in the peroxisome, and energy metabolism pathways. The results of GSVA analysis showed that cluster A patients are involved in complex and contradictory biological processes, both pro- and anti-tumor. Together with the cluster A survival curve analysis, it was hypothesized that the anti-tumor effect in cluster A patients were presumably in the suppressed condition, so we further evaluated the immune status of BLCA patients. It was confirmed first in the PCA plot that there were existing differences between the three tumor subtypes (Figure 8A), and then the immune score, stromal score, and ESTIMATE score were measured by R package “ESTIMATE” across the different subtypes, and it was observed that the level of immune infiltration was significantly higher in cluster A than the other two types (p<0.0001) (Figure 8B). Finally, the degrees of infiltration of the 23 immune cells were verified in more detail using the ssGSEA feature, and the results were consistent with the previous findings, with significantly higher levels of infiltration of most immune cells in cluster A, except for monocytes, CD56dim-NK cells and Th17 cells (p<0.0001) (Figure 8C). Contrary to our speculation, immune cell infiltration was greater in cluster A patients, but the prognosis turned out to be worse, inferring that this group of patients may suffer from immune tolerance contributing to the decline of the organism’s anti-tumor response. With the above speculation, we further proceeded with differential analysis among tumor subtypes (B-A, C-A and C-B) and finally obtained 1065 DEGs through a two-by-two comparison to take a merged set (Figure 9A). GO/KEGG enrichment analysis results revealed that DEGs were largely associated with negative regulation of the immune system, leukocyte migration, extracellular matrix structure, cytokine interactions, and BLCA (Figure 9B-D). These results confirm our speculation to some extent.
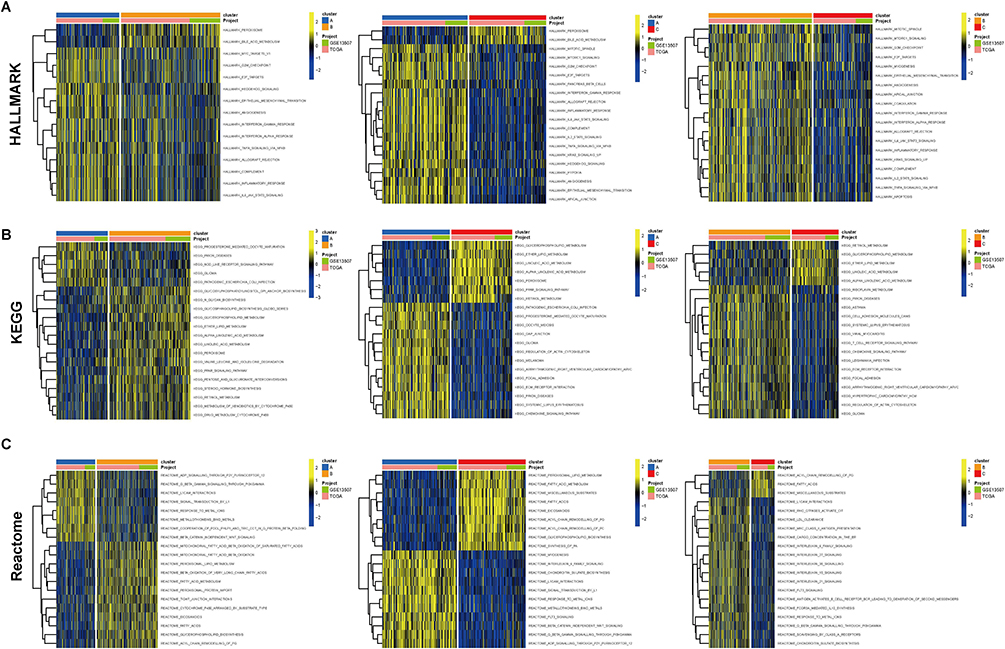 |
Figure 7 Functional enrichment analysis of tumor subtypes. Heatmap for enrichment analysis of 3 tumor subtypes in HALLMARK pathway (A), KEGG pathway (B), and Reactome pathway (C) by GSVA analysis. |
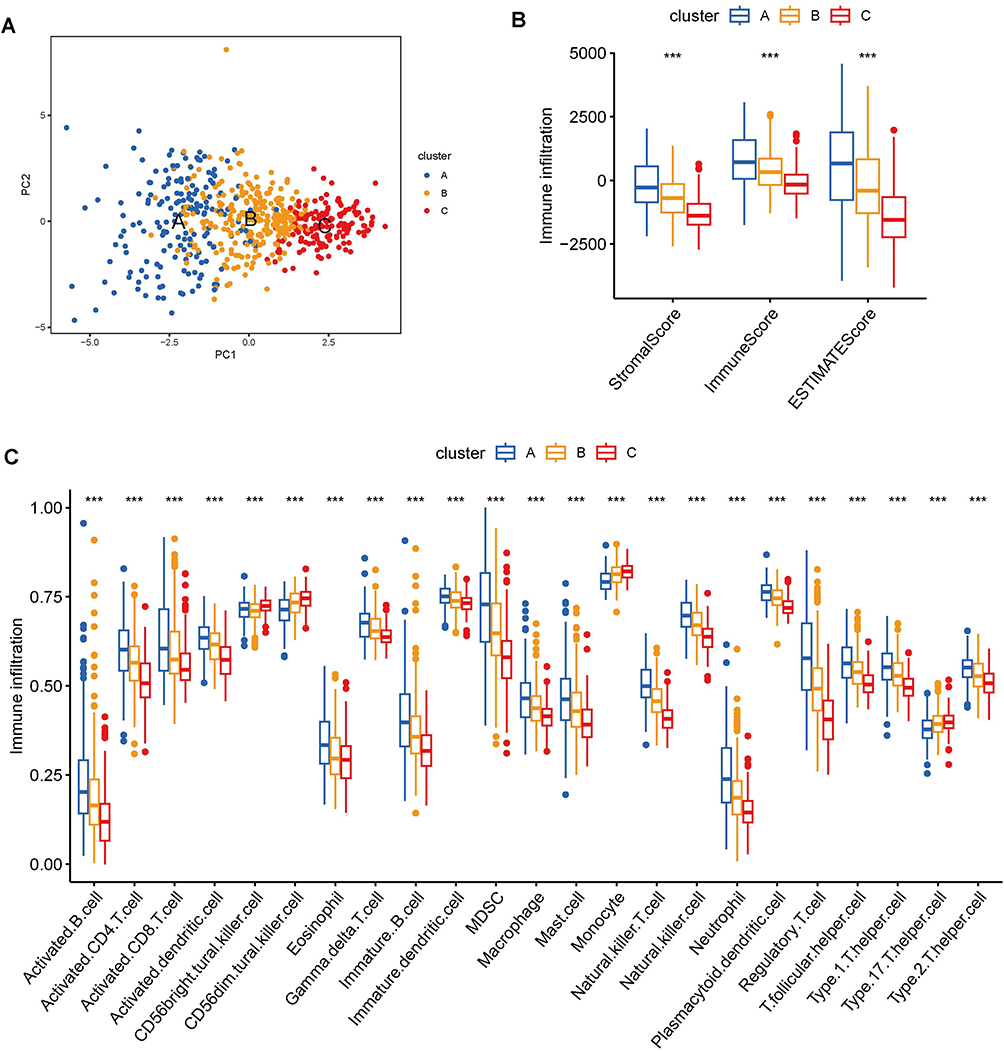 |
Figure 8 Analysis of immune cell infiltration between tumor subtypes. (A) PCA plot of sample distribution for tumor subtypes. (B) Differences in immune, stromal, and ESTIMATE scores across tumor subtypes assessed by ESTIMATE package. (C) The degree of immune cell infiltration between different tumor subtypes was measured by ssGSEA analysis. (***p value < 0.001). |
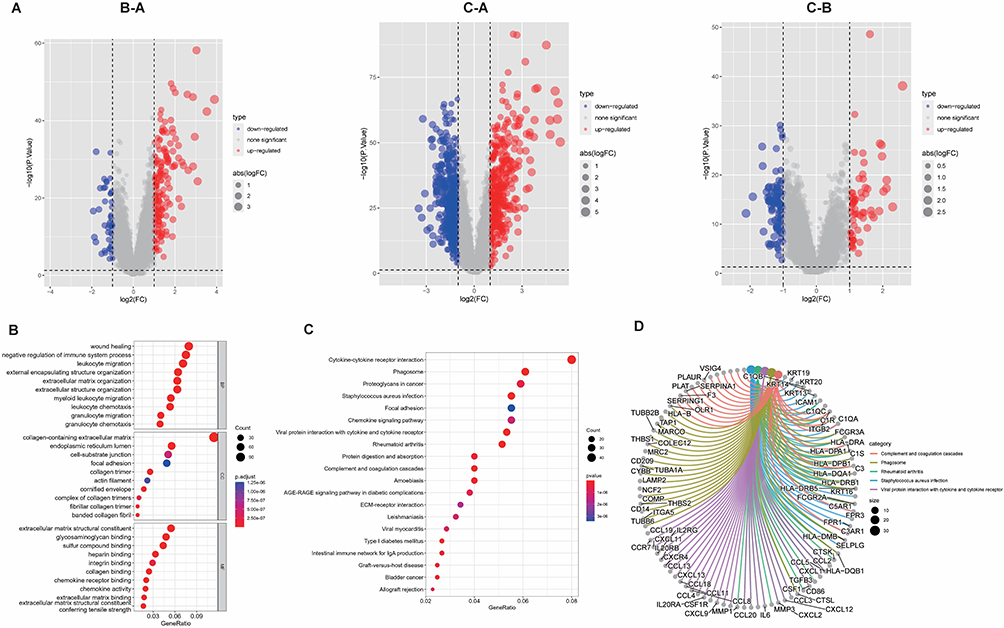 |
Figure 9 Recognition and functional enrichment analysis of DEGs among tumor subtypes. (A) Volcano plot of DEGs between clusters (A-C). (B) Bubble plots of the GO terms of DEGs. (C) Bubble plots of the KEGG pathways of DEGs. (D) Counterparts of top 5 pathway and genes in KEGG enrichment analysis. |
Establishment and Validation of Risk Stratification Based on Sialylation-Related Genes in BLCA
All DEGs were subjected to univariate regression analysis (Supplementary Table 3), and the top 10 genes with the minimum p-value were considered as signature genes, including EMP1, CD109, CERCAM, CARD11, TM4SF1, FN1, FBN1, ELOVL4, ANXA1, and SERPINB2. The forest plot indicated that all the remaining 9 genes were prognostic risk factors besides CARD11 (Supplementary Figure 3A). The consensus clustering analysis was conducted again in the training set, and the best clustering was achieved at k=2 (Supplementary Figure 3B). We analyzed the prognosis, gene expression levels, and clinicopathological characteristics of both genecluster groups, and we observed that patients in genecluster A experienced worse prognosis than genecluster B (p<0.001) (Supplementary Figure 3C), the expression of signature genes exhibited elevated expression of risk factors and reduced expression of protective factors (p<0.001) (Supplementary Figure 3D), and we also compared other clinicopathological parameters (Supplementary Figure 3E). The risk score was calculated from the expression of signature genes, and the training set samples were divided into high and low-risk score groups depending on the optimal cut-off values to establish sialylation-related risk stratification for BLCA patients. The stability of the sialylation-related risk stratification was subsequently validated in terms of survival analysis, immune infiltration, and clinicopathological characteristics. First of all, the survival curves displayed a median survival of < 2 years for patients in the high-risk score group, which was lower than in the low-risk score group (p<0.001) (Supplementary Figure 3F). Over the course of repeated subgroups, patients in the high-risk score group were all from the genecluster A subtype, while most patients in the low-risk score group were alive, suggesting the importance of signature genes in the risk stratification of BLCA patients (Supplementary Figure 3G). Then, we also evaluated the correlation between risk score and immune cell infiltration and the results suggested that risk score was positively correlated with multiple immune cell infiltration levels, especially NK T cells and NK cells (p<0.05) (Supplementary Figure 3H). Lastly, we matched 6 clinicopathological characteristics including fustat, gender, grade, stage, N stage, and T stage, which were significantly different between the two groups of patients. The box plot indicated that death (p<0.0001) and female patients (p=0.0035) had higher risk scores, higher graded patients had risk scores increased (p<0.0001) and patients with later stage, N stage, and T stage had significantly greater risk score than those with the earlier stage (p<0.01). As for the bar plots, a significantly higher proportion of patients in the high-risk score group died (64% vs 37%), were female (34% vs 21%), were higher grade (98% vs 71%), and were stage III/IV (81% vs 61%), N1/2 (36% vs 22%), and T3/4 (74% vs 47%) patients (Figure 10A-F).
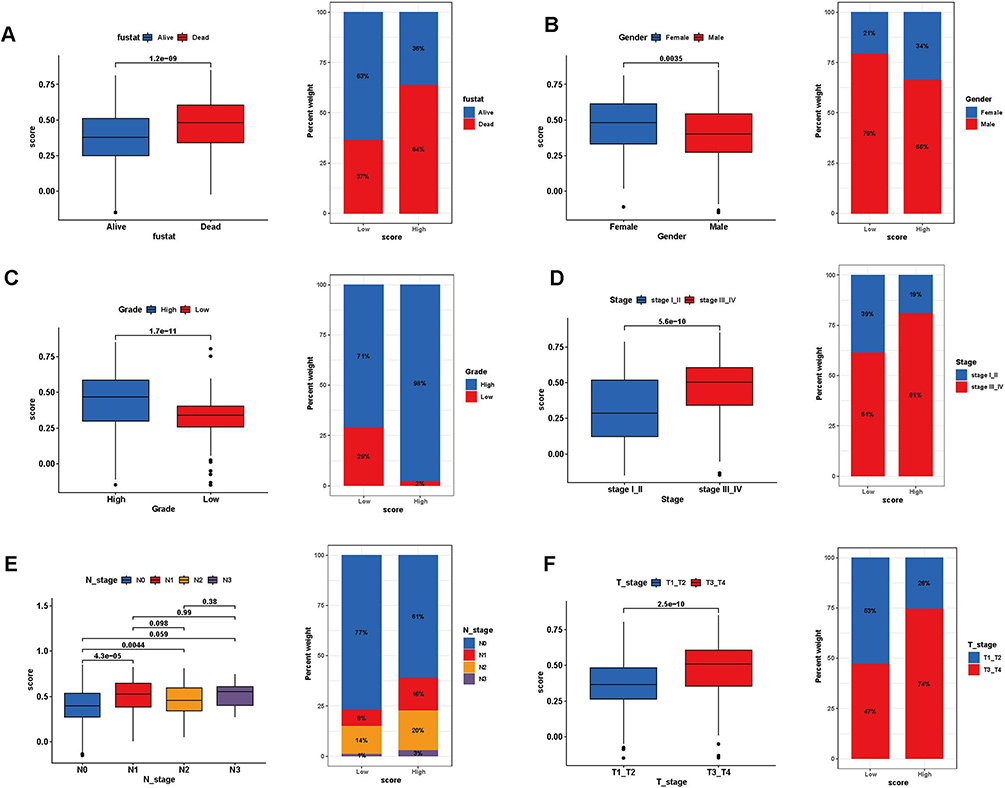 |
Figure 10 Association analysis of risk scores with clinical characteristics. Box plot for differences in risk score profiles (Left) and bar plot for sample distribution in high and low-risk score groups (Right) in different survival status (A), gender (B), grade (C), tumor stage (D), N stage (E), and T stage (F). |
Correlation Between Risk Score and Tumor Microenvironment
The tumor microenvironment is the internal and external environment in which tumors live and is closely related to tumorigenesis, progression, and metastasis. After clarifying that risk score is an important factor in the variability of prognosis and clinicopathological characteristics in BLCA patients, we explored the correlation between risk score and tumor microenvironment and attempted to reveal some oncological features of bladder urothelial carcinoma from this aspect. The fundamental source of tumorigenesis is the mutation of hereditary elements, so we analyzed the mutation situation between high- and low-risk score groups, and the results indicated that missense mutation was the dominant mutation type in both groups, and the top 5 mutated genes were TP53, TTN, KMT2D, MUC16, and PIK3CA (Figure 11A and B), but the frequency of mutation was higher in the high-risk score group (Figure 11C). Immune cells are an essential component of the tumor microenvironment, and the expression of immune check loci can regulate the activation of immune cells, so we extracted the expression of 5 immune check loci including CD274, CTLA-4, LAG3, PDCD1, and TIGIT between high and low-risk score groups, as Figure 12A showed that the expression levels of all 5 immune check loci in the high-risk score group were significantly higher than those in the low-risk score group (p<0.0001). Chemokines are the major non-cellular elements in the tumor microenvironment and regulate tumor immunity by recruiting lymphocytes into the tumor microenvironment through the chemokine-chemokine receptor signaling pathway, therefore we compared the expression levels of chemokines in the two groups and indicated that most chemokines and cytokines were significantly highly expressed in the high-risk score group, especially the CC chemokine family and CXC chemokine family (p<0.05) (Figure 12B). Additionally, we examined the correlation between risk score and HALLMARK pathways and discovered that risk score was positively correlated with multiple immune-related pathways, such as complement, IL-6/Jak/Stat3 signaling, TNF-α signaling via NFκB, and IL-2/ Stat5 signaling pathway et al (Figure 12C).
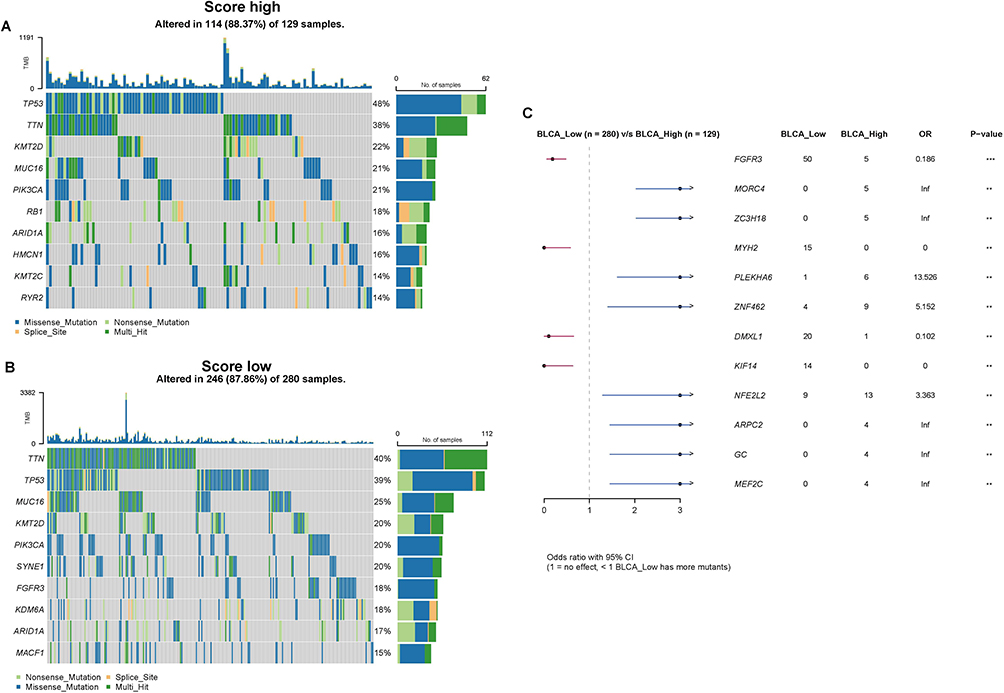 |
Figure 11 Gene mutations in the high and low-risk score groups. (A) Distribution of top 10 mutation genes in the high-score group. (B) Distribution of top 10 mutation genes in the low-score group. (C) Comparison of the gene mutations in high and low-risk score groups by maftools package (**p value < 0.01; ***p value < 0.001). |
 |
Figure 12 Assessment of the relationship between risk scores and the tumor immune microenvironment. (A) The expression level of CD274, CTLA-4, LAG3, PDCD1, and TIGIT between high and low-risk score groups (p<0.0001). (B) Heatmap for cytokine expression in high and low-risk score groups. (*p value < 0.05; **p value <0.01; ***p value <0.001). (C) Correlations between risk score and HALLMARK pathway visualized by ggplot2. |
Estimating and Validating the Value of Risk Score as a Predictor of Immunotherapeutic Efficacy in Patients with BLCA
We further evaluated the role of the risk score in the immunotherapy of BLCA patients. The samples of the GSE78220 dataset and IMvigor210 cohort were divided into high and low-risk score groups depending on the optimal cut-off value of risk score, and the survival analysis of both datasets showed that the median survival of the high-risk score group was lower than the low-risk score group, with p-values of 0.0052 and 0.00075, respectively (Figure 13A and C). The response to immunotherapy also differed between the two groups, with a higher proportion of non-responders to immunotherapy (PD/SD) in the high-risk score group (Figure 13B and D), which contributed to the different survival outcomes in the two groups. For the patients who were not sensitive to immunotherapy, we also performed the targeted drug prediction and detected significant differences (p<0.05) in the IC50 values of 12 targeted drugs (Supplementary Figure 4). In the end, the value of the risk score for immunotherapy efficacy in BLCA patients was verified in scRNA-seq data. The expression of signature genes in various cell types was analyzed (Figure 14A), and heterogeneity among cells was observed by calculating the risk score, with the highest risk score in monocytes and macrophages (Figure 14B). The immunotherapy information of scRNA-seq revealed a significantly higher risk score in the immunotherapy non-responder group than in the responder group (p<0.001) (Figure 14C), and reaffirmed in the UMAP plot of the relationship between immunotherapy response and score distribution in BLCA patients, with a greater proportion of immunotherapy non-responders in the high-risk score group (Figure 14D), which was consistent with the results of immunotherapy data from bulk RNA-seq. And the cell numbers and proportions of monocytes and macrophages were highest in the high-risk score group (Figure 14E), suggesting that monocytes and macrophages may be involved in immunotherapy tolerance for patients in the high-risk score group. To investigate the potential mechanisms leading to immune tolerance, we further enriched the HALLMARK pathways in both groups, and the results indicated that most of the pathways were enriched in the high-risk score group, and risk score in all types of cells was significantly correlated with most of the HALLMARK pathways (p<0.05), except for CD4 T cells (Supplementary Figure 5A and B).
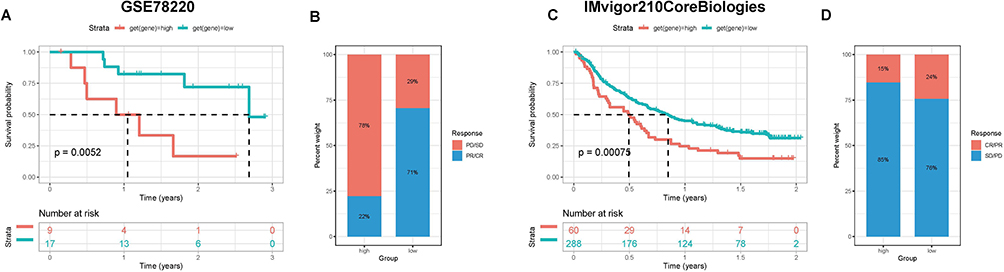 |
Figure 13 Evaluation of the discrimination potency of risk scores on the efficacy of immunotherapy in BLCA patients. (A and B) Prognosis and immunotherapy response of patients in GSE78220 datasets. (C and D) Prognosis and immunotherapy response of patients in IMvigor210 datasets. |
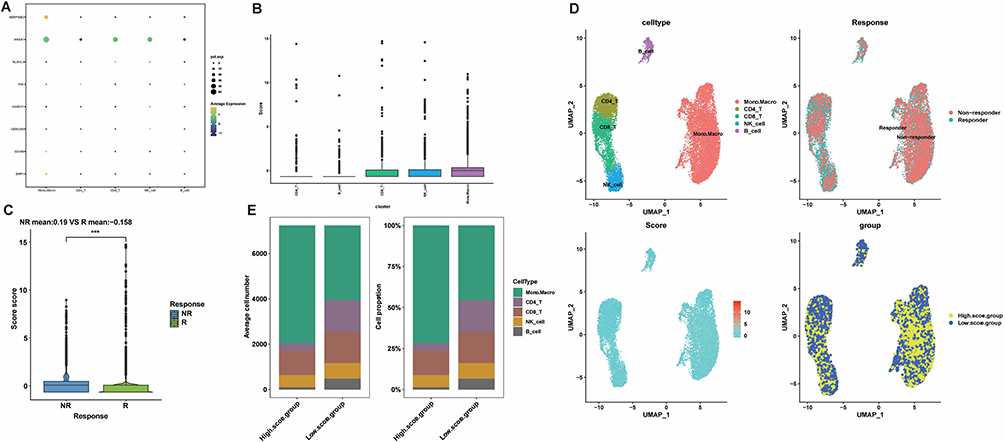 |
Figure 14 Validation of immunotherapy efficacy in scRNA-seq data. (A) Expression profiles of signature genes in individual cell subtypes. (B) Risk scores for each cell subtype with GSVA. (C) Distribution of immunotherapy responses of high and low-risk score groups in GSE145281. (***p value <0.001). (D) Umap plot for the distribution of BLCA patients’ immunotherapy response with a risk score. (E) The proportion and count of each cell subtype in the high- and low-risk score groups. |
Discussion
Glycosylation is the most common and complex post-translational modification of proteins, and roughly more than half of human proteins are glycosylated.35 As one of the classes of glycosylation, sialylation is involved in important biological processes regarding tumor metastasis, metabolic reprogramming, and immune recognition36 in a variety of malignancies including colon,15 ovarian,14 breast,37 and liver,38 but its role in BLCA is still obscure owing to the paucity of relevant studies. Therefore, it may be worthwhile to investigate sialylation-related biomarkers for predicting the survival outcome of BLCA patients. In this study, we combined scRNA-seq and bulk RNA-seq data to disclose the effects of sialylation-related genes in BLCA patients by glycomics analysis, which may provide critical targets for individualized treatment.
We identified 5 core cell types among the scRNA-seq data, with the highest proportion of monocytes and macrophages and significant enrichment in the HALLMARK pathway, suggesting that monocytes and macrophages were intimately associated with BLCA development and played critical roles in tumor tumorigenesis, immunity, and energy metabolism. Previous studies have well elaborated the vital role of monocytes and macrophages in tumorigenesis, as monocyte-derived macrophages secrete pro-angiogenic growth factors during polarization to M2-like macrophages and accompanied with the alterations in sialylation and desialylation profiles, resulting in a pro-angiogenic and lymphangiogenic role.39,40 M2-like macrophages are regarded as tumor-associated macrophages (TAMs) that facilitate tumor growth, metastasis, and suppression of cellular immunity, which are associated with poor prognosis in BLCA patients.41 In parallel, sialic acid generated by tumor cells can stimulate the differentiation of monocytes into tumor-associated macrophages by being recognized by Siglecs (Sialic acid-binding immunoglobulin-type lectins), initiating immune tolerance of various immune cells such as T cells, NK cells and monocytes.42 Therefore, we believe that monocytes and macrophages occupy an indispensable position in the pathological process of BLCA.
The sialylation process is strictly regulated by a diversity of sialidases and sialyltransferases,6 so we obtained sialylation-related genes and measured the sialylation scores of each cell type, discovering that the sialylation scores of monocytes and macrophages are significantly higher than those of other cells, which indicates that the sialylation process in such cells was active and strongly associated with the development of BLCA. 19 sialylation-related genes associated with the prognosis of BLCA patients were identified in the bulk RNA-seq data, including 1 sialylase (NPL) and 12 sialyltransferases (GALNT6, GALNT5, GALNT15, GALNTL6, ST3GAL5, B4GALNT1. ST3GAL6, ST6GALNAC3, ST3GAL4, B4GAT1, B3GNT4, and B3GNT3), demonstrating that sialyltransferase activity could to some extent impact the prognostic outcome of patients. Nevertheless, the results of univariate regression analysis indicated that sialyltransferase is a double-edged sword for the prognosis of BLCA patients, which could be both a risk factor and a favorable factor. ST3GAL5 (ST3 β-galactoside α-2,3-sialyltransferase 5) can encode ganglioside GM3, which exhibits anti-tumor effects by decreasing the proliferation of BLCA cells via inhibiting apoptosis and angiogenesis and reducing epidermal growth factor receptor phosphorylation.43,44 For its part, ST3GAL6 was modulated by the transcription factor GATA3, and in BLCA GATA3 was downregulated to diminish the inhibition of ST3GAL6 promoter activity, and ST3GAL6 expression was upregulated to increase the level of sialylation in tumor cells to enhance tumor invasion and migration,45 which is consistent with the results of the present study. Based on the detected prognosis-related sialylation genes, samples were stratified into 3 tumor subtypes. Significant differences in gene expression levels, the prognosis of patients, functional enrichment analysis results, and immune cell infiltration were observed across subtypes, with cluster A exhibiting the worst prognosis and the highest level of immune cell infiltration (p<0.001) and increased expression levels of multiple sialyltransferases, taking into account that the poor prognosis of patients was likely relevant to increased levels of sialylation causing immune tolerance. The hypothesis was finally confirmed in function enrichment analyses of DEGs among tumor subtypes, revealing that DEGs were enriched in several immune-related pathways such as negative regulation of immune system processes, leukocyte migration, extracellular matrix structure, and chemokine signaling pathways.
From the results of DEGs univariate regression analysis, the 10 signature genes with the smallest p-values were extracted to calculate a risk score for the risk stratification of BLCA samples, and the clinicopathological and tumor microenvironmental characteristics of the high and low-risk score groups were analyzed in comparison, discovering that patients in the high-risk score group had worse survival outcome, higher tumor grade, later stage, higher frequency of gene mutations, and higher expression levels of immune checkpoints and chemokines. All of the above-mentioned results illustrated that risk score exerted direct or indirect effects on tumor immunity in the tumor microenvironment of bladder urothelial carcinoma cells, which affected tumor progression, treatment, and patient prognostic outcome. Description of the risk score can be considered as a criterion for risk stratification of BLCA patients and provide new evidence for individualized treatment of BLCA patients. We also assessed and validated the efficacy of immunotherapy in both groups of patients in the bulk RNA-seq dataset and scRNA-seq dataset, and both results displayed lower immune response rates in the high-risk score group. In the scRNA-seq dataset, we observed a higher proportion of monocytes/macrophages and a lower proportion of CD4/CD8 T cells in BLCA samples, together with the results of previous studies confirming that tumor-associated macrophages (TAMs) secrete cytokines, chemokines, and enzymes to exert immunosuppressive effects and suppress the effective functions of both CD8+ and CD4+ T cells,46,47 which may underlie the immunosuppressive microenvironment in the high-risk score group of patients. Moreover, we also conducted targeted drug prediction in the immunotherapy-insensitive high-risk score group and concluded that patients in the high-risk score group may be sensitive to Akt inhibitors (A.443654), Lck inhibitors (A.770041), PARP inhibitors (AAG.014699), AMPK activators (AICAR), and VEGFR inhibitors (AMG.706, AP.24534), but these results need to be confirmed in additional clinical trials. Given the differences in clinicopathological characteristics, tumor microenvironment, cellular heterogeneity, and immunotherapy efficacy between high and low-risk score groups, it is reasonable to regard risk score as a reliable parameter for risk stratification of urothelial carcinoma, which can accurately discriminate patients’ survival outcome and immunotherapy response.
Despite the meaningful results we yielded, there are still some inevitable limitations of the current study. On the one hand, the sample size of the scRNA-seq dataset was relatively small and the expression level of some sialylation-related genes was low, so small values of risk score were counted and the grouping was rather difficult; on the other hand, the mechanism of sialylation-related genes impacting tumor microenvironment and immune tolerance is inexplicit, thus the functions and interactions of these genes need further in vivo and in vitro experiments to explore and validate.
Conclusion
By synthetic analysis of scRNA-seq and bulk RNA-seq data, we made a systematic investigation of the effects and clinical implications of sialylation-related genes in BLCA patients. We managed to establish a new risk stratification for BLCA by counting the risk score in terms of the expression of sialylation-related genes, which seemed to possess promising accuracy in predicting the prognostic outcome, clinicopathological characteristics, immune microenvironment status, and immunotherapy efficacy of BLCA patients in open access databases. However, further experiments are needed to validate the feasibility of glycomics in risk stratification for individualized anti-tumor therapy in BLCA patients and provide more evidence for future clinical decisions.
Data Sharing Statement
The analyzed datasets generated during the study are available from the corresponding author upon reasonable request.
Ethics Approval and Consent to Participate
This study was approved by the ethics committee of The Second Affiliated Hospital of Kunming Medical University and carried out under the World Medical Association Declaration of Helsinki. All patients provided written informed consent before their inclusion in the study.
Acknowledgments
We thank the Gene Expression Omnibus (GEO) and The Cancer Genome Atlas (TCGA) Database for sharing a large amount of data. Meanwhile, We thank Prof. Haihao Li and Yinglong Huang were involved in the formulation of the study design and study concept.
Author Contributions
All authors made a significant contribution to the work reported, whether that is in the conception, study design, execution, acquisition of data, analysis, and interpretation, or all these areas; took part in drafting, revising, or critically reviewing the article; gave final approval of the version to be published; have agreed on the journal to which the article has been submitted; and agree to be accountable for all aspects of the work.
Funding
This work was supported by the National Natural Science Foundation of China (No. 82060464, 82260609), Yunnan Provincial Education Department Scientific Research Fund Project (2022Y221), and Yunnan Provincial Basic Research Programme - Youth Project (202101AU070241).
Disclosure
The authors declare that they have no competing interests in this work.
References
1. Sung H, Ferlay J, Siegel RL, et al. Global Cancer Statistics 2020: GLOBOCAN Estimates of Incidence and Mortality Worldwide for 36 Cancers in 185 Countries. CA Cancer J Clin. 2021;71(3):209–249. doi:10.3322/caac.21660
2. Massard C, Gordon MS, Sharma S, et al. Safety and Efficacy of Durvalumab (MEDI4736), an Anti-Programmed Cell Death Ligand-1 Immune Checkpoint Inhibitor, in Patients With Advanced Urothelial Bladder Cancer. J Clin Oncol. 2016;34(26):3119–3125.
3. Charlton ME, Adamo MP, Sun L, et al. Bladder cancer collaborative stage variables and their data quality, usage, and clinical implications: a review of SEER data, 2004-2010. Cancer. 2014;23(23):3815–3825.
4. Witjes JA, Bruins HM, Cathomas R, et al. European Association of Urology Guidelines on Muscle-invasive and Metastatic Bladder Cancer: summary of the 2020 Guidelines. Eur Urol. 2021;79(1):82–104.
5. Pearce OM, Läubli H. Sialic acids in cancer biology and immunity. Glycobiology. 2016;26(2):111–128.
6. Pietrobono S, Stecca B. Aberrant Sialylation in Cancer: biomarker and Potential Target for Therapeutic Intervention? Cancers. 2021;13(9):2014.
7. Pinho SS, Reis CA. Glycosylation in cancer: mechanisms and clinical implications. Nat Rev Cancer. 2015;15(9):540–555.
8. Huang J, Huang J, Zhang G. Insights into the Role of Sialylation in Cancer Metastasis, Immunity, and Therapeutic Opportunity. Cancers. 2022;14(23):5840.
9. Munkley J. Aberrant Sialylation in Cancer: therapeutic Opportunities. Cancers. 2022;14(17):4248.
10. Munkley J, Mills IG, Elliott DJ. The role of glycans in the development and progression of prostate cancer. Nat Rev Urol. 2016;13(6):324–333. doi:10.1038/nrurol.2016.65
11. Stowell SR, Ju T, Cummings RD. Protein glycosylation in cancer. Annu Rev Pathol. 2015;10(1):473–510. doi:10.1146/annurev-pathol-012414-040438
12. Almaraz RT, Tian Y, Bhattarcharya R, et al. Metabolic flux increases glycoprotein sialylation: implications for cell adhesion and cancer metastasis. Mol Cell Proteomics. 2012;11(7):
13. Natoni A, Macauley MS, O’Dwyer ME. Targeting Selectins and Their Ligands in Cancer. Front Oncol. 2016;6:93. doi:10.3389/fonc.2016.00093
14. Wu X, Zhao J, Ruan Y, et al. Sialyltransferase ST3GAL1 promotes cell migration, invasion, and TGF-β1-induced EMT and confers paclitaxel resistance in ovarian cancer. Cell Death Dis. 2018;9(11):1102. doi:10.1038/s41419-018-1101-0
15. Swindall AF, Bellis SL. Sialylation of the Fas death receptor by ST6Gal-I provides protection against Fas-mediated apoptosis in colon carcinoma cells. J Biol Chem. 2011;286(26):22982–22990. doi:10.1074/jbc.M110.211375
16. Villanueva-Cabello TM, Gutiérrez-Valenzuela LD, Salinas-Marín R, et al. Polysialic Acid in the Immune System. Front Immunol. 2022;12:823637. doi:10.3389/fimmu.2021.823637
17. Läubli H, Varki A. Sialic acid–binding immunoglobulin-like lectins (Siglecs) detect self-associated molecular patterns to regulate immune responses. Cell Mol Life Sci. 2020;77(4):593–605. doi:10.1007/s00018-019-03288-x
18. Scott E, Elliott DJ, Munkley J. Tumour associated glycans: a route to boost immunotherapy? Clin Chim Acta. 2020;502:167–173. doi:10.1016/j.cca.2019.12.015
19. Cotton S, Azevedo R, Gaiteiro C, et al. Targeted O-glycoproteomics explored increased sialylation and identified MUC16 as a poor prognosis biomarker in advanced-stage bladder tumours. Mol Oncol. 2017;11(8):895–912.
20. Leek JT, Johnson WE, Parker HS, et al. The sva package for removing batch effects and other unwanted variation in high-throughput experiments. Bioinformatics. 2012;28(6):882–883.
21. Mariathasan S, Turley SJ, Nickles D, et al. TGFβ attenuates tumour response to PD-L1 blockade by contributing to exclusion of T cells. Nature. 2018;554(7693):544–548.
22. Gribov A, Sill M, Lück S, et al. SEURAT: visual analytics for the integrated analysis of microarray data. BMC Med Genomics. 2010;3:21.
23. Becht E, McInnes L, Healy J, et al. Dimensionality reduction for visualizing single-cell data using UMAP. Nat Biotechnol. 2018.
24. Aran D, Looney AP, Liu L, et al. Reference-based analysis of lung single-cell sequencing reveals a transitional profibrotic macrophage. Nat Immunol. 2019;20(2):163–172.
25. Hänzelmann S, Castelo R, Guinney J. GSVA: gene set variation analysis for microarray and RNA-seq data. BMC Bioinform. 2013;14:7.
26. Zhou M, Lv S, Hou Y, et al. Characterization of sialylation-related long noncoding RNAs to develop a novel signature for predicting prognosis, immune landscape, and chemotherapy response in colorectal cancer. Front Immunol. 2022;13:994874.
27. Wilkerson MD, Hayes DN. ConsensusClusterPlus: a class discovery tool with confidence assessments and item tracking. Bioinformatics. 2010;26(12):1572–1573.
28. Li GM, Zhang CL, Rui RP, et al. Bioinformatics analysis of common differential genes of coronary artery disease and ischemic cardiomyopathy. Eur Rev Med Pharmacol Sci. 2018;22(11):3553–3569.
29. Meng Z, Ren D, Zhang K, et al. Using ESTIMATE algorithm to establish an 8-mRNA signature prognosis prediction system and identify immunocyte infiltration-related genes in Pancreatic adenocarcinoma. Aging. 2020;12(6):5048–5070.
30. Gustavsson EK, Zhang D, Reynolds RH, et al. ggtranscript: an R package for the visualization and interpretation of transcript isoforms using ggplot2. Bioinformatics. 2022;38(15):3844–3846.
31. Yu G, Wang LG, Han Y, et al. clusterProfiler: an R package for comparing biological themes among gene clusters. Omics. 2012;16(5):284–287.
32. Mayakonda A, Lin DC, Assenov Y, et al. Maftools: efficient and comprehensive analysis of somatic variants in cancer. Genome Res. 2018;28(11):1747–1756.
33. Geeleher P, Cox N, Huang RS. pRRophetic: an R package for prediction of clinical chemotherapeutic response from tumor gene expression levels. PLoS One. 2014;9(9):e107468.
34. Zhang X, Lan Y, Xu J, et al. CellMarker: a manually curated resource of cell markers in human and mouse. Nucleic Acids Res. 2019;47(D1):D721–d8.
35. Ferreira JA, Magalhães A, Gomes J, et al. Protein glycosylation in gastric and colorectal cancers: toward cancer detection and targeted therapeutics. Cancer Lett. 2017;387:32–45.
36. Li F, Ding J. Sialylation is involved in cell fate decision during development, reprogramming and cancer progression. Protein Cell. 2019;10(8):550–565.
37. Ma X, Dong W, Su Z, et al. Functional roles of sialylation in breast cancer progression through miR-26a/26b targeting ST8SIA4. Cell Death Dis. 2016;7(12):e2561.
38. Wang L, Chen X, Meng F, et al. α2,6-Sialylation promotes hepatocellular carcinoma cells migration and invasion via enhancement of nSmase2-mediated exosomal miRNA sorting. J Physiol Biochem. 2023;79(1):19–34.
39. Corliss BA, Azimi MS, Munson JM, et al. Macrophages: an Inflammatory Link Between Angiogenesis and Lymphangiogenesis. Microcirculation. 2016;23(2):95–121.
40. Wang D, Ozhegov E, Wang L, et al. Sialylation and desialylation dynamics of monocytes upon differentiation and polarization to macrophages. Glycoconj J. 2016;33(5):725–733.
41. Sharifi L, Nowroozi MR, Amini E, et al. A review on the role of M2 macrophages in bladder cancer; pathophysiology and targeting. Int Immunopharmacol. 2019;76:105880.
42. Rodriguez E, Boelaars K, Brown K, et al. Sialic acids in pancreatic cancer cells drive tumour-associated macrophage differentiation via the Siglec receptors Siglec-7 and Siglec-9. Nat Commun. 2021;12(1):1270.
43. Wang H, Isaji T, Satoh M, et al. Antitumor effects of exogenous ganglioside GM3 on bladder cancer in an orthotopic cancer model. Urology. 2013;81(1):210.e11–5.
44. Ouyang S, Liu JH, Ni Z, et al. Downregulation of ST3GAL5 is associated with muscle invasion, high grade and a poor prognosis in patients with bladder cancer. Oncol Lett. 2020;20(1):828–840.
45. Dalangood S, Zhu Z, Ma Z, et al. Identification of glycogene-type and validation of ST3GAL6 as a biomarker predicts clinical outcome and cancer cell invasion in urinary bladder cancer. Theranostics. 2020;10(22):10078–10091.
46. Chen Y, Song Y, Du W, et al. Tumor-associated macrophages: an accomplice in solid tumor progression. J Biomed Sci. 2019;26(1):78.
47. Wang X, Ni S, Chen Q, et al. Bladder cancer cells induce immunosuppression of T cells by supporting PD-L1 expression in tumour macrophages partially through interleukin 10. Cell Biol Int. 2017;41(2):177–186.
 © 2023 The Author(s). This work is published and licensed by Dove Medical Press Limited. The
full terms of this license are available at https://www.dovepress.com/terms
and incorporate the Creative Commons Attribution
- Non Commercial (unported, 3.0) License.
By accessing the work you hereby accept the Terms. Non-commercial uses of the work are permitted
without any further permission from Dove Medical Press Limited, provided the work is properly
attributed. For permission for commercial use of this work, please see paragraphs 4.2 and 5 of our Terms.
© 2023 The Author(s). This work is published and licensed by Dove Medical Press Limited. The
full terms of this license are available at https://www.dovepress.com/terms
and incorporate the Creative Commons Attribution
- Non Commercial (unported, 3.0) License.
By accessing the work you hereby accept the Terms. Non-commercial uses of the work are permitted
without any further permission from Dove Medical Press Limited, provided the work is properly
attributed. For permission for commercial use of this work, please see paragraphs 4.2 and 5 of our Terms.
Recommended articles
Immunotherapy for Urothelial Carcinoma: Focus on Clinical Utility of Nivolumab
Chiang RS, Glover MJ, Khaki AR, Srinivas S
OncoTargets and Therapy 2022, 15:1259-1269
Published Date: 20 October 2022
Overexpression of TREM1 is Associated with the Immune-Suppressive Microenvironment and Unfavorable Prognosis in Pan-Cancer
Zhou X, Lin K, Fu L, Liu F, Lin H, Chen Y, Zhuang B, Liang H, Deng Q, Wang Z, Chen W, Luo J, Cao J, Li P
Journal of Inflammation Research 2023, 16:1375-1391
Published Date: 27 March 2023
Exploring the Correlation Between GPR176, a Potential Target Gene of Gastric Cancer, and Immune Cell Infiltration
Gu X, Shen H, Xiang Z, Li X, Zhang Y, Zhang R, Su F, Wang Z
Pharmacogenomics and Personalized Medicine 2023, 16:519-535
Published Date: 1 June 2023
Systemic Treatment-Decision Algorithms in Muscle-Invasive Bladder Cancer: Clinical Complexities and Navigating for Improved Outcomes
Giles M, Crabb SJ
Research and Reports in Urology 2023, 15:321-331
Published Date: 7 July 2023
NOTCH1 Mutations Predict Superior Outcomes of Immune Checkpoint Blockade in Non-Small Cell Lung Cancer
Huang Q, Cao H, Yao Q, Zhou X, Li H, Bai Q, Hu H
ImmunoTargets and Therapy 2023, 12:165-173
Published Date: 5 December 2023