Back to Journals » Journal of Inflammation Research » Volume 14
Integrating Bioinformatic Strategies with Real-World Data to Infer Distinctive Immunocyte Infiltration Landscape and Immunologically Relevant Transcriptome Fingerprints in Ossification of Ligamentum Flavum
Authors Zhang B ![]() , Chen G, Chen X, Yang X, Fan T, Sun C, Chen Z
, Chen G, Chen X, Yang X, Fan T, Sun C, Chen Z ![]()
Received 29 April 2021
Accepted for publication 8 July 2021
Published 30 July 2021 Volume 2021:14 Pages 3665—3685
DOI https://doi.org/10.2147/JIR.S318009
Checked for plagiarism Yes
Review by Single anonymous peer review
Peer reviewer comments 3
Editor who approved publication: Dr Monika Sharma
Baoliang Zhang,1– 3 Guanghui Chen,1– 3 Xi Chen,1– 3 Xiaoxi Yang,1– 3 Tianqi Fan,1– 3 Chuiguo Sun,1– 3 Zhongqiang Chen1– 3
1Peking University Third Hospital, Department of Orthopaedics, Beijing, 100191, People’s Republic of China; 2Engineering Research Center of Bone and Joint Precision Medicine, Beijing, 100191, People’s Republic of China; 3Beijing Key Laboratory of Spinal Disease Research, Beijing, 100191, People’s Republic of China
Correspondence: Zhongqiang Chen
Orthopaedic Department, Peking University Third Hospital, No. 49 North Garden Road, Haidian District, Beijing, 100191, People’s Republic of China
Tel +86 10 13801132346
Fax +86 10 82267368
Email [email protected]
Purpose: Ossification of the ligamentum flavum (OLF) is a multifactorial disease characterized by an insidious and debilitating process of abnormal bone formation in ligamentum tissues. However, its definite pathogenesis has not been fully elucidated. Potential links between the immune system and various forms of heterotopic ossification have been discussed for many years, whereas no research investigated the immune effects on the initiation and development of OLF. Therefore, we attempt to shed light on this issue.
Methods: A series of bioinformatic algorithms were integrated to evaluate the immune score and the immunocyte infiltration patterns between OLF and normal samples, screen OLF-related and immune-related differentially expressed genes (OIDEGs), and analyze their biological functions. Correlation analysis inferred OIDEGs-related differentially expressed lncRNAs (OIDELs) and infiltrating immune cells (OIICs) to construct an immunoregulatory network.
Results: Differential immune score and immune cell infiltration were determined between two groups, and 10 OIDEGs with diverse biological function annotations were identified and verified. A lncRNA-gene-immunocyte regulatory network further revealed 10 OIDEGs, 41 OIDELs and 7 OIICs that were highly correlated. Among them, CD1E and STAT3 were predicted as hub genes whether at the expression level or interaction level. cDCs emerged as having the most prominent differences and the highest degree of connectivity. FO393414.3, AC096734.1, LINC01137 and DLX6-AS1 with the greatest number of OIDEGs were thought to be more likely to participate in immunoregulation of OLF.
Conclusion: This is the first research to preliminarily elucidate OLF-related immunocyte infiltration landscape and immune-associated transcriptome signatures based on bioinformatic strategies and real-world data, which may provide compelling insights into the pathogenesis and therapeutic targets of OLF.
Keywords: ossification of ligamentum flavum, differentially expressed genes, lncRNAs, immune infiltration, bioinformatics
Introduction
Ossification of ligamentum flavum (OLF) is characterized by a progressive pathological process of heterotopic bone formation from ligamentous tissues that causes spinal canal stenosis and severe myeloradiculopathy without response to conservative managements.1,2 OLF predominately affects East Asian population, with an estimated prevalence of 6.1% in Chinese, 12% in Japanese and 21.8% in Korean populations.3–5 The onset of OLF is so insidious that early detection is difficult. At the point when OLF is diagnosed, patients usually develop notable neurological symptoms, and have to require challenging surgical interventions with multiple complications.6 Therefore, it is essential to explore potential diagnostic biomarkers and therapeutic targets of OLF based on scientific research of its molecular mechanisms.
It is generally believed that genetic and environmental factors can contribute to the occurrence and development of OLF.7 However, its definite pathomechanism remains inadequately understood. Histologically, its pathological nature is considered as endochondral osteogenesis involving the differentiation of ligament fibroblasts into osteoblasts.7 Therefore, abnormally expressed osteogenic-related genes in ligamentum flavum (LF) cells are indispensable contributors to the pathogenesis of OLF. Multiple osteogenic markers (ALP, RUNX2, OCN, OPN) and signaling pathway molecules (BMP2, Wnt/β-catenin, Notch) have been identified to be significantly up-regulated in OLF.8,9 In addition, potential causative factors including mechanical stressors, metabolic elements, inflammatory markers and angiogenic effects can influence the osteogenic differentiation of LF cells by regulating these target genes.10–13 Transcription factors and epigenetic modification can also be involved in the development of OLF by endogenously altering the expression of osteogenic targets.14,15 With the development of second-generation sequencing techniques, emerging RNA sequencing and bioinformatics analysis have revealed differential OLF-related transcriptome expression profiles and functional characteristics, including identification of mRNAs, miRNAs, lncRNAs, circRNAs and construction of ceRNA network.16–18 However, there is lack of specialized investigation on the immune-associated transcriptome signatures in OLF.
Osteoimmunology, immunoregulatory effects on bone homeostasis and bone metabolism, has gained substantial interest in recent years. Accumulated researches have revealed immune cells and their inflammatory factors secreted (eg, IL-3, IL-6, TNF) participating in multiple forms of heterotopic ossification (HO) disorders, such as ankylosing spondylitis (AS), fibrodysplasia ossificans progressiva (FOP), neurogenic heterotopic ossification (NHO) and vascular calcification.19–21 Moreover, a growing body of evidence has uncovered how the inflammatory response functions in the formation of HO, and several specific cell populations in the innate and adaptive immunity, such as neutrophils, macrophages, mast cells, B cells and T cells, have been particularly implicated in the pathophysiology of HO via interactions with osteoprogenitor cells and the release of osteogenic growth factors.20,22 Historically, differential responses of peripheral lymphocytes were observed among patients with the continuous-type ossification of posterior longitudinal ligament (OPLL), those with the segmental-type OPLL and healthy volunteers.23 Moreover, Saito et al demonstrated that infiltrating macrophages could contribute to the progression of LF hypertrophy by stimulating collagen production in fibroblasts.24 Inflammatory response plays an important role in the immune system, and is also involved in the occurrence and development of OLF.25 TNF-α, a pro-inflammatory cytokine, is mainly produced by activated macrophages, which has been supposed to make for new bone formation.26 Consistently, our previous iTRAQ proteomics study found that the expression level of TNF-α was significantly elevated in OLF samples compared to normal controls, and TNF-α facilitated osteogenic differentiation of LF fibroblasts through activating Osx expression.12 These evidences suggested immune response might be associated with the pathomechanism of OLF. However, no investigation has been performed to shed light on this issue.
To systematically investigate the possible role of immune regulation in OLF, we applied multiple bioinformatic algorithms to evaluate difference of immune score and immune cell infiltration between OLF and normal tissues for the first time. Subsequently, we identified and validated the hub differentially expressed OLF-related and immune-related genes and illustrated their correlative biological functions and signaling pathways based on the real-world data. Finally, we conducted a joint correlation analysis of hub genes, lncRNAs and infiltrating immune cells to predict a potential immunoregulatory network in OLF. These findings preliminarily inferred the potential contribution of an immune-directed mechanism in the occurrence and development of OLF, providing compelling insights into the detailed pathogenesis and novel therapeutic targets of OLF as well as available data resources for future research.
Materials and Methods
Data Collection and Preprocessing
The workflow diagram of this study is described in Figure 1. Gene expression profile data were downloaded from Gene Expression Omnibus (GEO) database (https://www.ncbi.nlm.nih.gov/geo/). Eligible GEO datasets were selected according to the following inclusion criteria: 1) organism: Homo sapiens; 2) expression profiling by microarray; 3) samples: OLF ligament tissues and normal ligament tissues. Datasets from other organisms or expression profiling by RT-PCR or genome variation profiling were excluded. Ultimately, the lncRNA/mRNA expression dataset GES106253 was obtained, and clinical data related to these samples was also collected from the published study.16 Ossified ligament samples and normal samples were acquired from 4 TOLF patients and 4 spinal trauma patients during surgery, respectively. Gene expression analysis was based on GPL21827 platform (Agilent-079487 Arraystar Human LncRNA microarray V4), and expression values were normalized with robust multi-array average. The immune-related gene list was obtained from ImmPort database (http://www.immport.org). The macrophage-related gene list was retrieved from Genecards database (http://www.genecards.org).
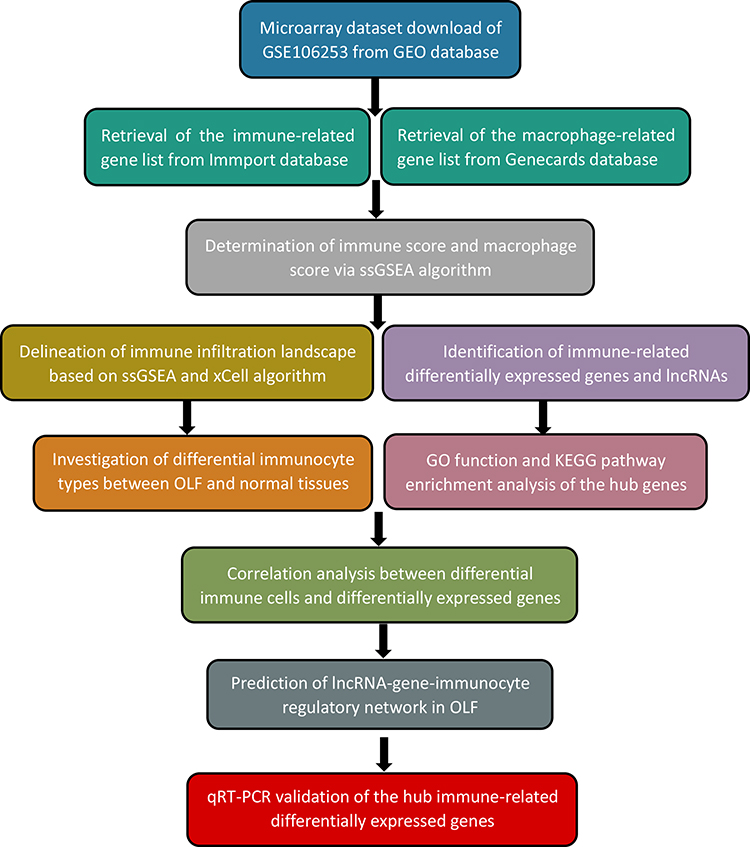 |
Figure 1 The overview of the analysis procedure. |
Determination of Immune and Macrophage Score
To investigate whether immune response is implicated in the pathomechanism of OLF, an immune score and a macrophage score for each sample were calculated based on the immune-related gene list and macrophage-related gene list by applying the single sample gene set enrichment analysis (ssGSEA) algorithm.
Evaluation of Immune Infiltration Landscape
Principal component analysis (PCA) was performed to determine whether there was a difference in immune cell infiltration between OLF tissues and normal tissues. ssGSEA was introduced to calculate the relative infiltration scores of different immune cell types based on the expression of reference gene within the gene sets from RNA-seq data. The enrichment score in ssGSEA represented the relative abundance of each immune cell type. xCell, a novel gene signature-based method reliably portraying the cellular heterogeneity landscape of tissue expression profiles, was utilized to infer the estimated proportion of 64 types of immune cells. The cut-off values for the cell analyses were p < 0.05. Heat maps and box diagrams were plotted to visualize the immune infiltration landscape.
Differential Analysis of Infiltrating Immunocyte Types
The significant differential infiltrating immune cells were screened according to p value < 0.05, and the percentage of each type of immune cell in the samples was calculated. Pearson correlation coefficient was used to further understand the relationship between these OLF-related infiltrating immune cells (OIICs).
Identification of Immune-Related Genes and Correlated LncRNAs
To determine differentially expressed genes (DEGs) and differentially expressed lncRNAs (DELs), GEO2R (https://www.ncbi.nlm.nih.gov/geo/geo2r), an interactive online tool, was engaged. Based on the predetermined statistical threshold of |fold change| >1.5 and p-values < 0.05, DEGs and DELs were screened out independently and utilized for further analysis. Furthermore, OLF-related DEGs and immune-related genes were intersected to obtain the OLF-related and immune-related DEGs (OIDEGs). Subsequently, Pearson correlation analysis (r > 0.9 or < −0.9, p < 0.01) between OIDEGs and DELs was conducted to confirm OIDEG-related DELs (OIDELs). Two-way hierarchical clustering was performed using pheatmap R package to render a heatmap of DEGs, DELs, OIDEGs and OIDELs.
Functional Enrichment Analyses of OIDEGs
Gene ontology (GO) analysis was performed to annotate OIDEGs, and to illustrate their functions in biology process, cell component, and molecular function. Kyoto Encyclopedia of Genes and Genomes (KEGG) analysis was conducted to investigate the related signaling pathways, and to understand high-level and biological functions from large-scale molecular datasets. The clusterProfiler package was used for the GO and KEGG analysis. The cutoff values for the GO and KEGG analyses were set at p < 0.05.
Correlation Analysis Between OIICs and OIDEGs
In order to further reveal the potential mechanism for the immune dysfunction in OLF, Pearson correlation analysis was used to analyze the relationship between OIDEGs and OIICs in R software. P-value < 0.05 was used as the cut-off standard.
Construction of LncRNA-Gene-Immunocyte Regulatory Networks
Based on above correlation analysis results, the OIDEG-OIDEL correlation pairs with the value of r > 0.95 or < −0.95 together with p < 0.001 and the significant OIDEG-OIIC correlation pairs with the value of r > 0.90 or < −0.90 together with p < 0.001 were integrated to construct a potential regulatory network, and to screen out more valuable regulators.
Validation of Candidate OIDEGs by Quantitative Real-Time PCR
Real-world data were collected to validate the expression changes of above candidate OIDEGs. The study protocol was approved by the Ethics Committee for Human Subjects of the Peking University Third Hospital in accordance with the Declaration of Helsinki (PUTH-REC-SOP-06-3.0-A27, #2014003). Since the homeostasis and function of immune system can be influenced by multiple factors, such as age and other comorbid diseases. Therefore, the rigorous inclusion and exclusion criteria were set to ensure the reliability of the results as far as possible. Experimental group included 10 adult patients diagnosed with TOLF who underwent surgical decompression, and control group included 10 adult patients diagnosed with thoracic disc herniation or spine fracture from June 2020 to December 2020. Patients with ankylosing spondylitis (AS), diffuse idiopathic skeletal hyperostosis (DISH), rheumatoid arthritis, spinal tumors, spinal infections and other systemic autoimmune diseases, were excluded. In addition, patients with hypertension, diabetes and arteriosclerosis were also eliminated. The detailed patients’ clinical data are described in Table 1, which showed there were no significant difference in age, gender and BMI between two groups. Their ossified and normal ligament tissue specimens were obtained during surgery with informed consent. Total RNA from pretreated ligament tissues was extracted with TRIzol reagent (German DBI) for qRT-PCR. Reverse transcription of RNA into complementary DNA was performed using the Bestar qPCR RT Kit (DBI, Germany) following the manufacturer’s instructions. GAPDH was used as the internal control, and the expression of candidate genes was calculated by the 2-ΔΔCt method.
 |
Table 1 Basic Clinical Data of Included Patients from OLF Group and Normal Group |
Statistical Analysis and Visualization
All statistical analyses and visualization were performed using R software 3.6.3 and GraphPad Prism 7 (GraphPad Software Inc.). Differences of immune score, immunocyte fractions and gene expression between two groups were analyzed by Wilcoxon matched pairs test. Correlation analysis was conducted using the Pearson test. The results of qPCR were statistically analyzed by Student’s t-test with SPSS 22.0 (IBM Analytics, United States). All data were expressed as mean ± standard deviation. P < 0.05 was considered as statistically significant.
Results
Confirmation of Differential Immune and Macrophage Score Between OLF and Normal Samples
Based on data of the immune-related gene list and macrophage-related gene list, we first calculated and compared the immune score and macrophage score between OLF and normal tissues by ssGSEA algorithm. As a result, we found that the OLF samples were significantly associated with lower immune score (P=0.019) and macrophage score (P=0.029) than normal samples, which indicated that immune dysregulation might be implicated in the development of OLF (Figure 2).
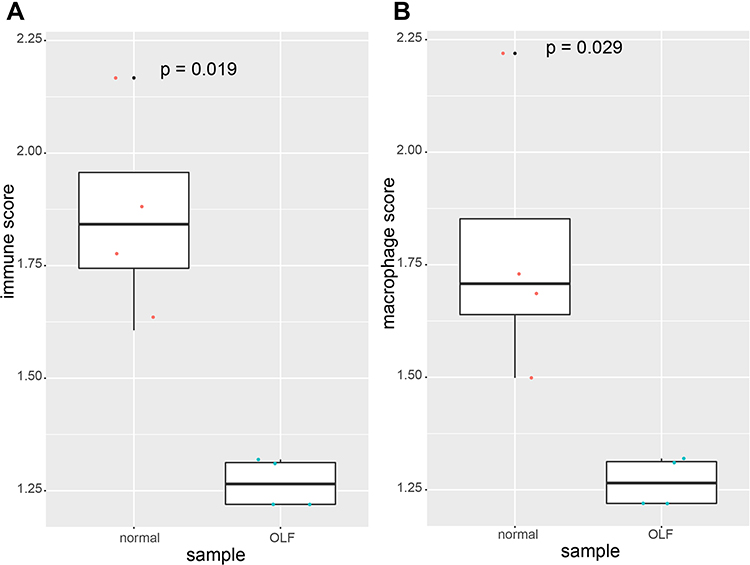 |
Figure 2 The comparison of immune score and macrophage score between normal samples and OLF samples based on ssGSEA algorithm. (A) Immune score. (B) Macrophage score. |
Distinction of Immune Cell Infiltration Between OLF and Normal Samples
The two-dimensional PCA depicted a significant difference in immune cell infiltration between OLF and control samples (Figure 3A and B). To comprehensively evaluate the landscape of immune cell infiltration between two groups, the percentage of each of the 23 types of immune cells and 64 types of immune cells in each sample was identified by ssGSEA and xCell, respectively (Figures 3C, D and 4A). Fourteen types of OLF-infiltrating immune cells (OIICs) were significantly altered, including natural killer T (NKT) cells, macrophages M2, NK CD56 bright cells, common myeloid progenitor (CMP) cells, basophils, conventional dendritic cells (cDCs), plasmacytoid dendritic cells (pDCs), pro B-cells, memory B cells, B cells, T helper 1 (Th1) cells, mesenchymal stem cells (MSC), smooth muscle cells and preadipocytes (Figure 4B). Correlation heatmap of these 14 types of immune cells revealed that pro B-cells had the strongest positive correlation with Basophils (r = 0.97), whereas NK CD56bright cells had the strongest negative correlation with cDC cells (r = −0.93) (Figure 4C). Among them, macrophages M2, NKT, NK CD56 bright cells, Th1 cells and smooth muscle cells were downregulated, whereas the other cells were upregulated in OLF samples (Figures 5 and 6).
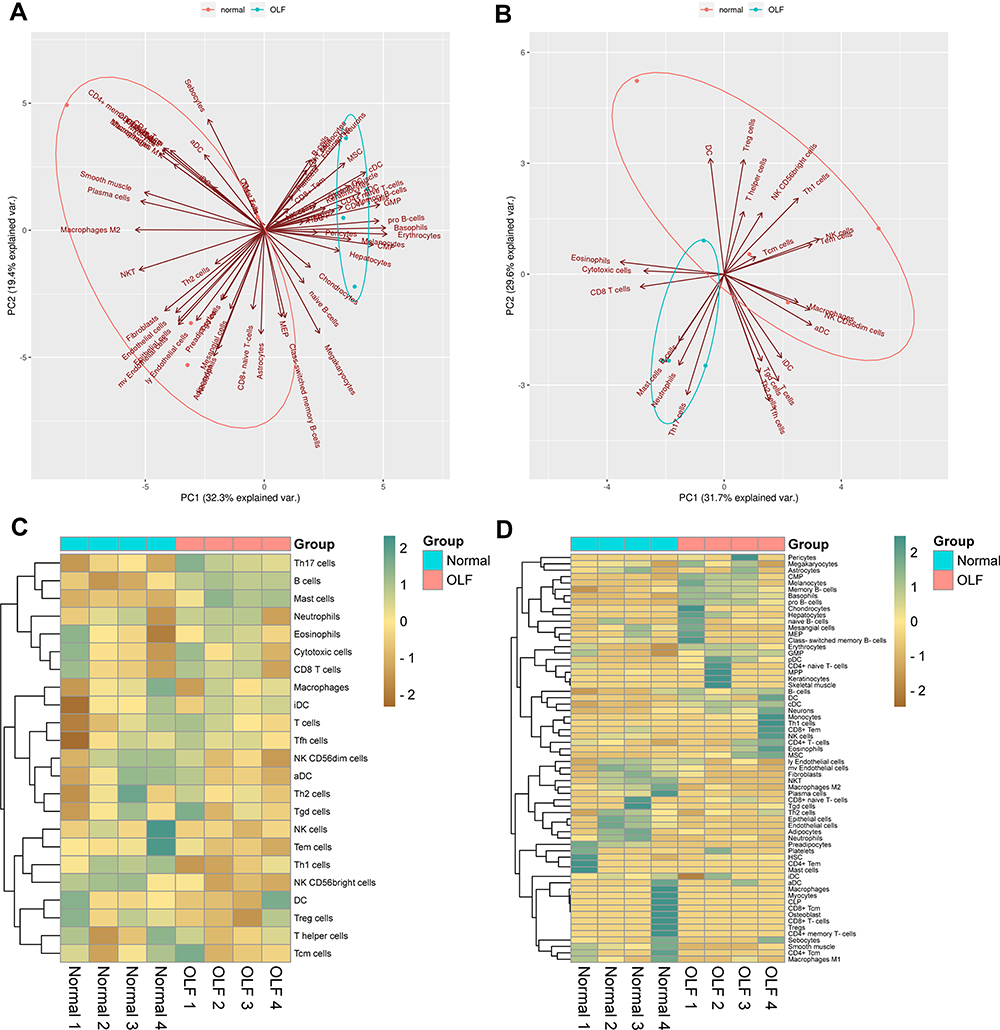 |
Figure 3 The landscape of immune infiltration between OLF and normal tissues. (A) PCA cluster visualizing 64 types of differentially infiltrated immune cells based on xCell algorithm. (B) PCA visualizing 23 types of differentially infiltrated immune cells based on ssGSEA algorithm. (C) Heatmap of 23 infiltrating immune cells between normal and OLF tissues. (D) Heatmap of 64 infiltrating immune cells between normal and OLF tissues. |
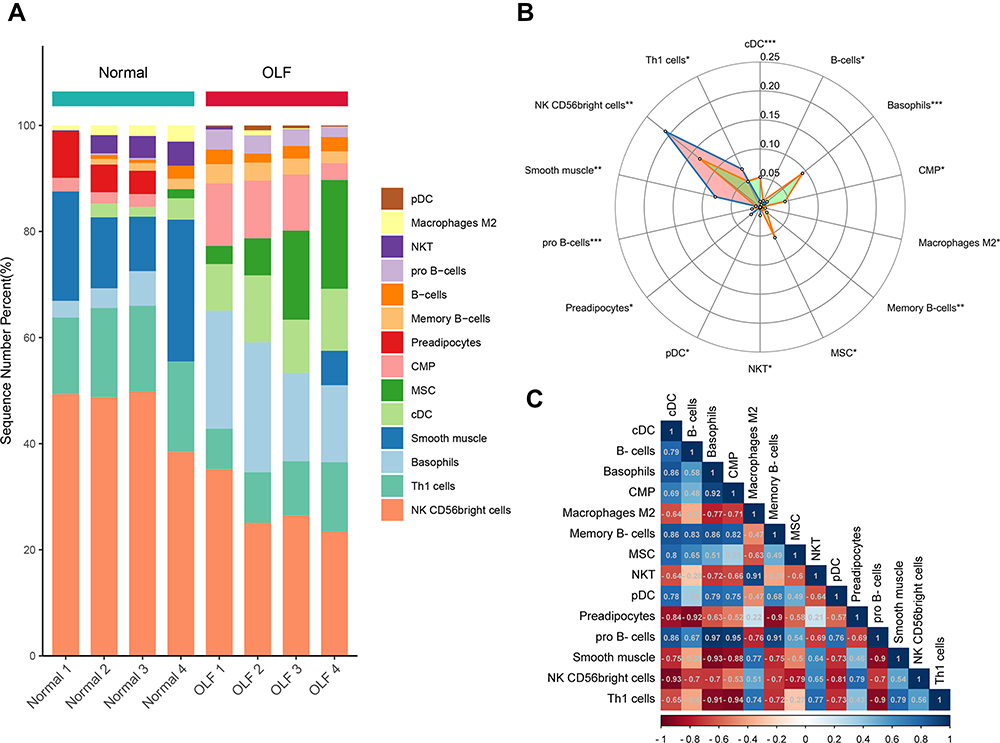 |
Figure 4 The situation of differential immune infiltration between normal and OLF samples. (A) The relative percentage of 14 differential immune cells between normal and OLF samples. Horizontal axes represents 4 × normal samples and 4 × OLF samples, and vertical axes represents the percentage of different immune cells in each sample. Color bars on right of the map represent immune cell types. (B) Radar chart depicting 14 types of infiltrating immune cells with different proportions. *, ** and *** indicate the significance level of 0.05, 0.01 and 0.001, respectively. (C) Correlation heatmap of 14 differential immune cells. |
 |
Figure 5 Up-regulated infiltrating immune cells in OLF. Red represents the expression of immune cells in normal LF tissues, and blue represents the expression of immune cells in OLF tissues. (A) Basophils. (B) B-cells. (C) cDC. (D) CMP. (E) Memory B-cells. (F) MSC. (G) pDC. (H) Pro-B cells. |
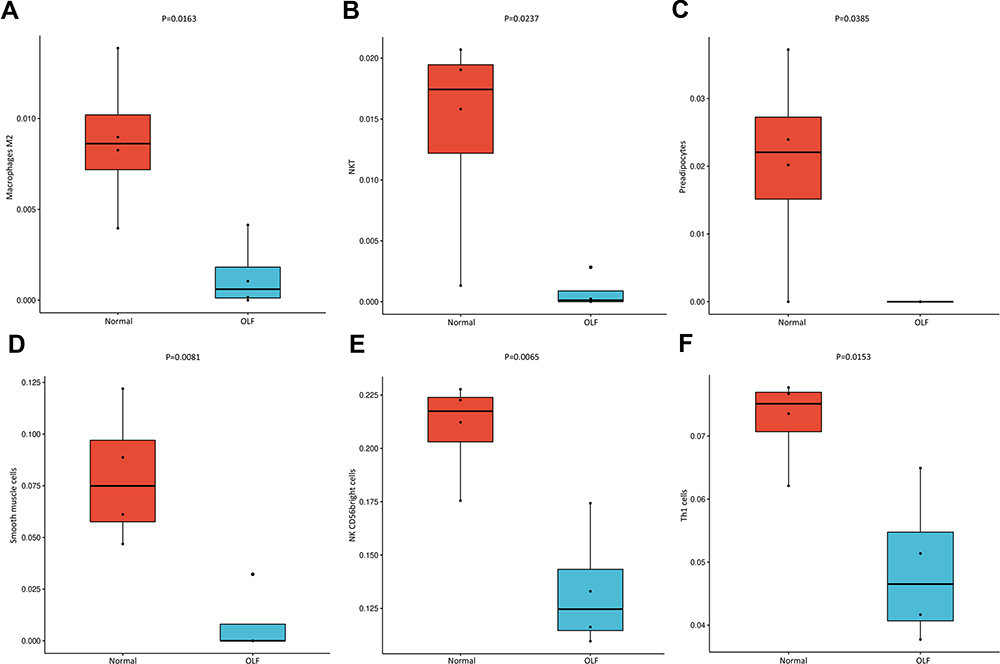 |
Figure 6 Down-regulated infiltrating immune cells in OLF. Red represents the expression of immune cells in normal LF tissues, and blue represents the expression of immune cells in OLF tissues. (A) Macrophages M2. (B) NKT. (C) Preadipocytes. (D) Smooth muscle cells. (E) NK CD56bright cells. (F) Th1 cells. |
Identification of Differentially Expressed Immune-Related Genes Between OLF and Normal Samples
A three-step computational framework was performed to explore hub OIDEGs and OIDELs. Firstly, 121 DEGs (51 downregulated and 70 upregulated) and 131 DELs (32 downregulated and 99 upregulated genes) in OLF were preliminarily screened out according to the predetermined screening cut-off criteria (Figure 7). Secondly, we constructed the intersection between 121 OLF-related DEGs and immune-related genes from ImmPort database to obtain 14 OIDEGs, including 7 downregulated genes (FAM3B, STAT3, SOCS3, IKBKE, LGR5, GDF15, TACR1) and 7 upregulated genes (CRH, IFNB1, CD40LG, CCL28, CD1E, GRP, MUC4) (Figure 8A–C). Table 2 showed the detailed information on these genes. CD1E (p=0.00034) and STAT3 (p=0.00039) were the most significantly up- and downregulated genes, respectively. Correlation analysis showed that STAT3 had the highest positive correlation with SOCS3 (r = 0.98, p = 0.01), but had the highest negative correlation with CD1E (r = −0.98, p = 0.03) (Figure 8D). Thirdly, Pearson correlation analysis inferred 46 featured lncRNAs that were highly correlated with these 14 OIDEGs (r > 0.9, P < 0.01), namely OIDELs, including 10 downregulated genes (eg, BMS1P10, HOPX, GAS2L1P2, SORD2P, ARHGAP22) and 36 upregulated genes (eg, ZNF195, SILC1, ZMAT4, DNAAF5, NUP210P1) (Figure 8E, Table 3). AC106779.1 (p=2.53E-07) and BMS1P10 (p=0.0005) were the most significantly up-regulated and down-regulated OIDELs, respectively.
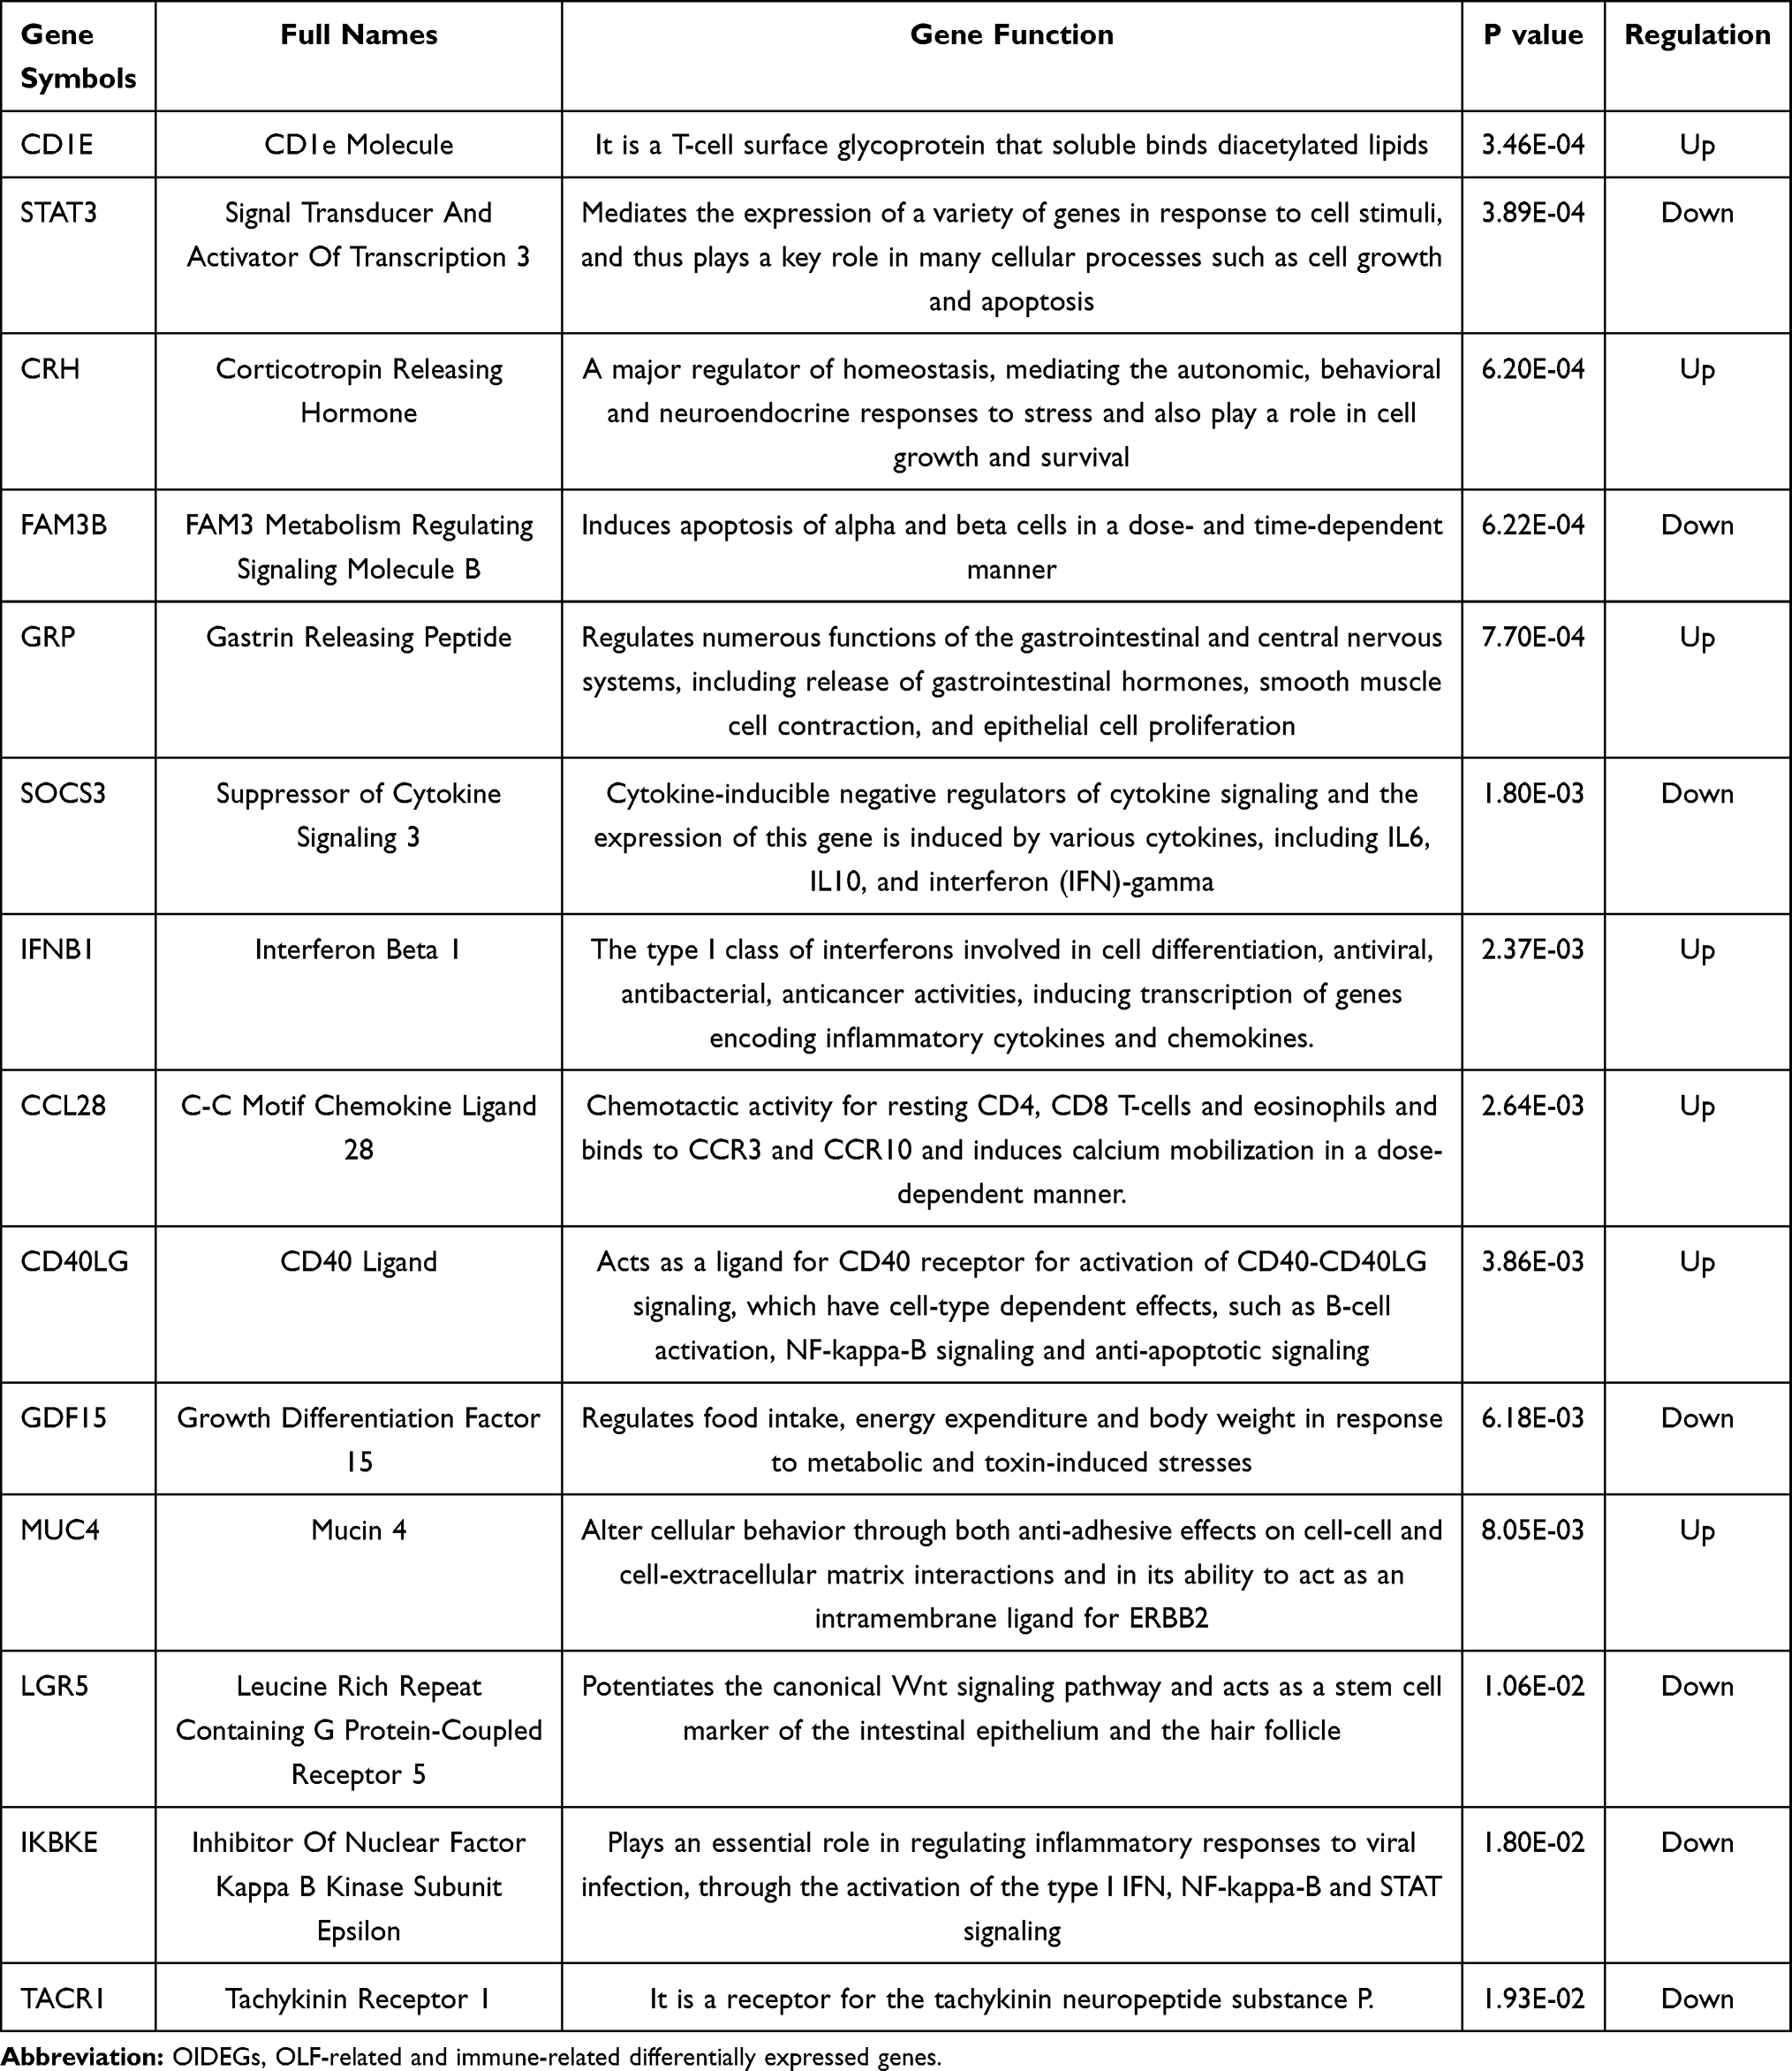 |
Table 2 Detailed Information on 14 Hub OIDEGs |
 |
Table 3 OIDEGs-Related Differentially Expressed LncRNAs Between OLF and Normal Groups |
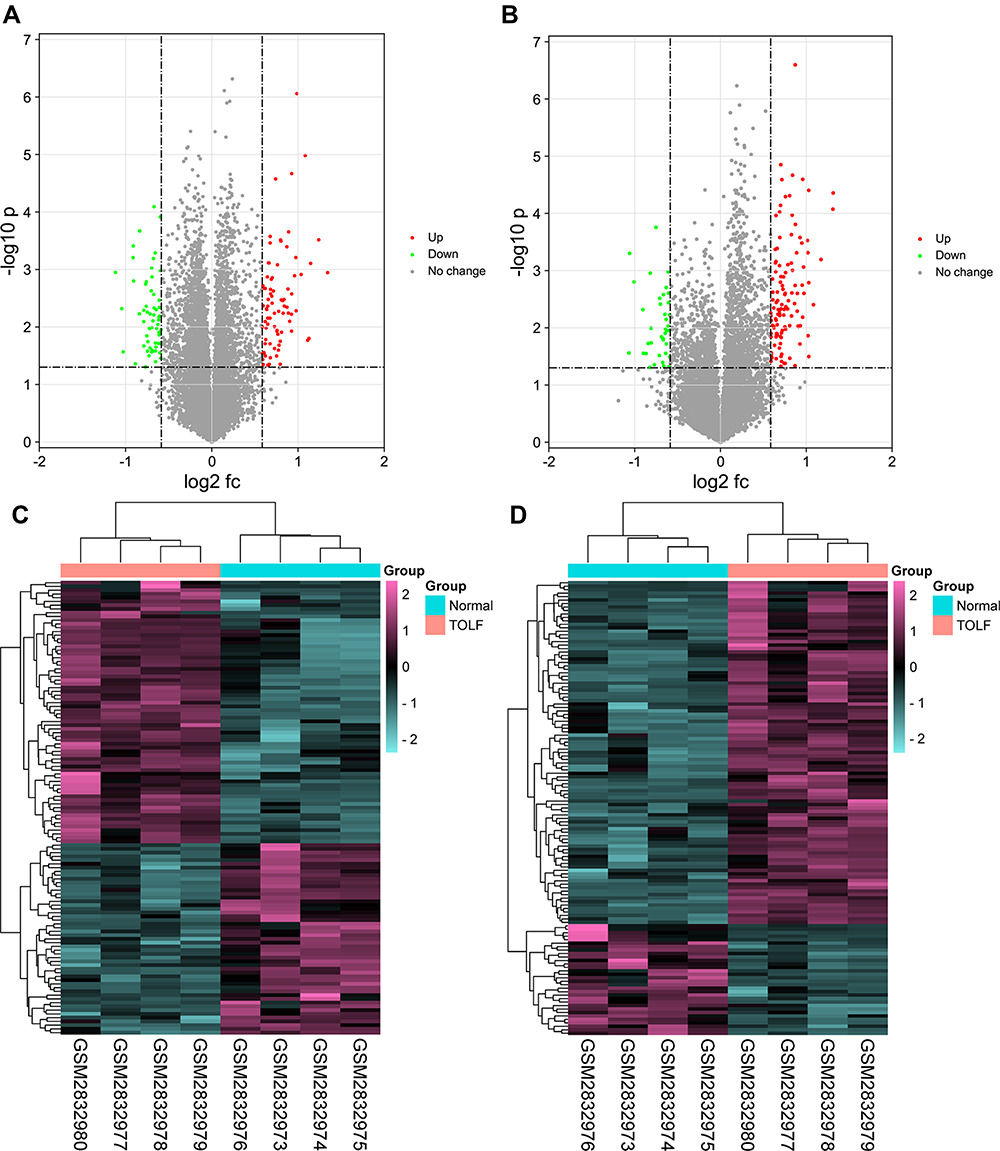 |
Figure 7 Differentially expressed genes and lncRNAs between OLF samples and normal samples. (A) Volcano plot of differentially expressed genes. (B) Volcano plot of differentially expressed lncRNAs. (C) Heatmap of differentially expressed genes. (D) Heatmap of differentially expressed lncRNAs. Green dots indicates down-regulated, red indicates up-regulated and gray indicates no differential expression. |
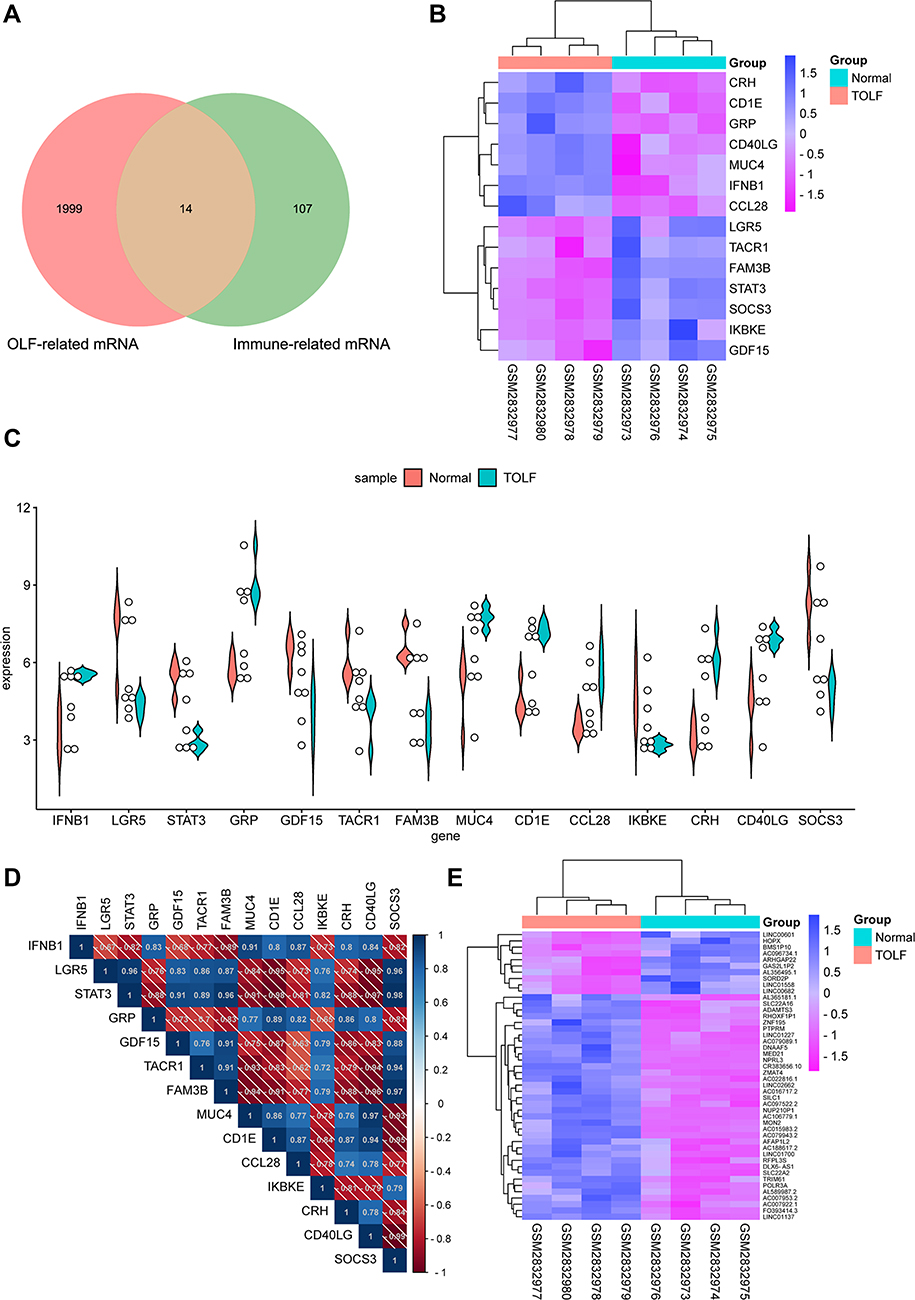 |
Figure 8 Immune-related differentially expressed genes and lncRNAs between OLF samples and normal samples. (A) Venn diagram showing the overlapping between immune-related genes and OLF-related differentially expressed genes. (B) Heatmap of 14 OLF-related and immune-related differentially expressed genes (OIDEGs). (C) Box plot showing expression level of 14 OIDEGs between normal and OLF samples. (D) Correlation heat map of 14 OIDEGs. (E) Heatmap of 46 OIDEGs-related differentially expressed lncRNAs. |
GO Function and KEGG Pathway Enrichment Analysis of OIDEGs
GO analysis showed that OIDEGs were mainly involved in receptor ligand activity, cytokine receptor binding, cytokine activity, G protein-coupled receptor binding, neuropeptide hormone activity, chemokine receptor binding, G protein-coupled peptide receptor activity, hormone activity, protein phosphatase binding, phosphatase binding, hormone receptor activity (Figure 9A and B). KEGG analysis demonstrated that OIDEGs were primarily involved in cytokine–cytokine receptor interaction, JAK-STAT signaling pathway, adipocytokine signaling pathway, RIG-I-like receptor signaling pathway, prolactin signaling pathway, Toll-like receptor signaling pathway, TNF signaling pathway, neuroactive ligand–receptor interaction, insulin resistance, growth hormone synthesis, secretion and action (Figure 9C and D). Among the pathways, “JAK-STAT signaling pathway”, “Toll-like receptor signaling pathway”, “TNF signaling pathway” were all well-known pathways involved in the process of osteogenesis and inflammation. In addition, many of the other pathways suggested metabolism-related involvement in OLF, such as “adipocytokine signaling pathway”, “prolactin signaling pathway” and “insulin resistance”, which suggested the interactions of immune-metabolism mechanism in the development of OLF.
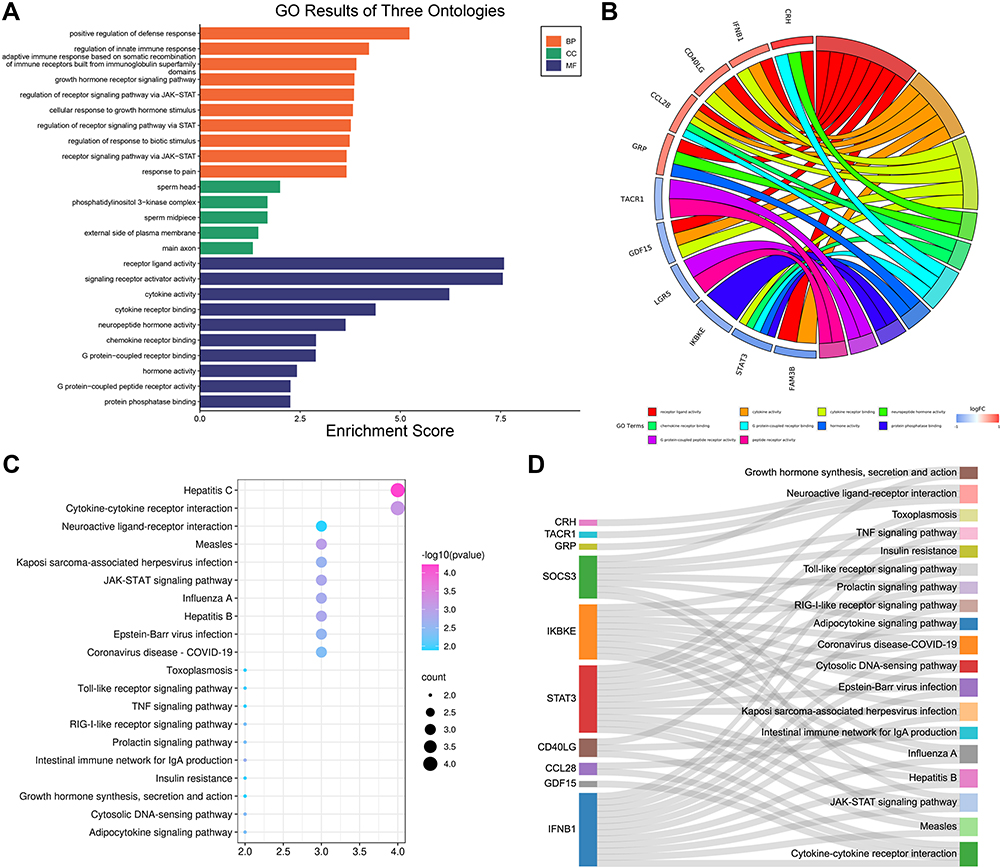 |
Figure 9 Functional enrichment analysis of OIDEGs. (A) The top 20 GO terms with significantly differential expression from the GO enrichment analyses. (B) The most significant functions of hub enriched OIDEGs. (C) The top 20 KEGG pathways with significantly differential expression from KEGG enrichment analysis. (D) The most significant pathways of hub enriched OIDEGs. |
Correlation Between OIDEGs and Infiltrating Immune Cells
According to r > 0.90 and p < 0.001, 21 OIDEG-OIICs correlation pairs were screened, and cDCs were significantly associated with the most OIDEGs (Figure 10A). For example, STAT3, SOCS3 and FAM3B were negatively correlated with cDCs (r = −0.99, p = 5.2E-06; r = −0.96, p = 0.00013; r = −0.95, p = 0.00022) (Figure 10B–D); CD1E and CD40LG were positively correlated with cDCs (r = 0.98, p = 3.3E-08; r = 0.96, p = 0.00022) (Figure 10E and F). In addition, STAT3 was positively correlated with NK CD56 bright cells (r = 0.94, p = 0.00043) (Figure 10G); LGR5 was positively correlated with preadipocytes (r = 0.96, p = 0.00014) (Figure 10H); IFNB1 was negatively correlated with smooth muscle cells (r = –0.94, p = 0.00041) (Figure 10I).
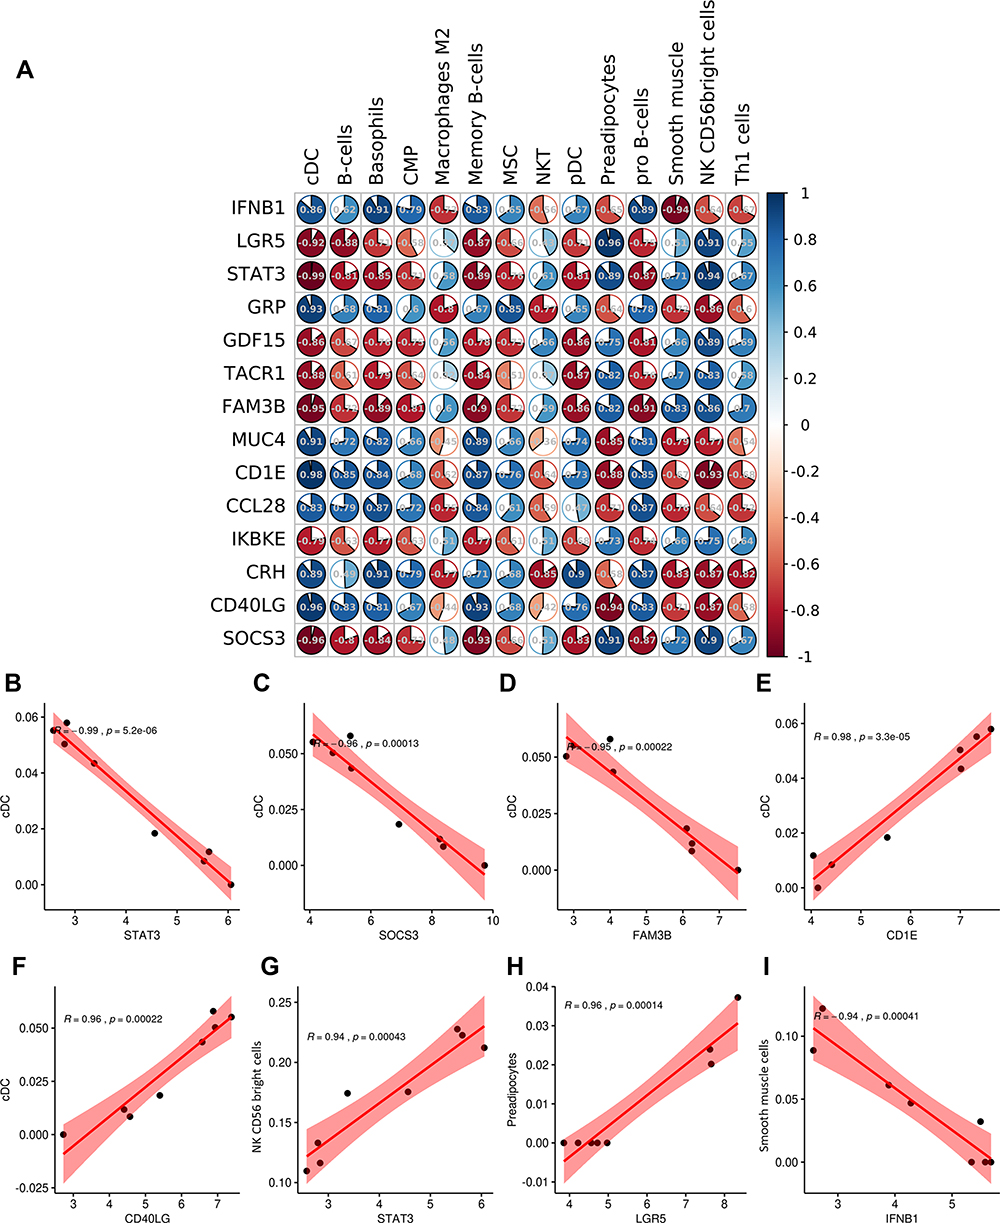 |
Figure 10 Correlation analysis between OIICs and OIDEGs. (A) Correlation coefficient matrix diagram between 14 OIICs and 14 OIDEGs. (B) STAT3-cDC correlation. (C) SOCS3-cDC correlation. (D) FAM3B-cDC correlation. (E) CD1E-cDC correlation. (F) CD40LG-cDC correlation. (G) STAT3-NK CD56 bright cells correlation. (H) LGR5-preadipocytes correlation. (I) IFNB1-smooth muscle cells correlation. |
Prediction of LncRNA-Gene-Immunocyte Regulated Network in OLF
Based on the criteria of r > 0.95 or < −0.95 and p < 0.001, 73 OIDEG-OIDEL co-expression pairs were further selected, indicating that each lncRNA or mRNA could correlate with several lncRNAs or mRNAs (Figure 11A). CD1E and STAT3 were DEmRNAs with the highest degree of connectivity. In addition, SILC1 and ZMAT4 were positively correlated with CD1E, whereas BMS1P10 was negatively correlated with CD1E (Figure 11B–D). DLX6-AS1 was positively correlated with STAT3, while SILC1 was negatively correlated with STAT3 (Figure 11E and F). PTPRM was positively correlated with GRP (Figure 11G); DLX6-AS1 was positively correlated with SOCS3 (Figure 11H); DNAAF5 was negatively correlated with CRH (Figure 11I). Importantly, FO393414.3, AC096734.1, LINC01137 and DLX6-AS1 were OIDELs with the greatest number of OIDEGs, which were more likely to participate in this regulating process. Furthermore, we integrated these correlation results with the above correlation results of OIDEGs and OIICs to generate a specific lncRNA-gene-immunocyte regulatory network map (Figure 12). Targets included 10 OIDEGs, 41 OIDELs and 7 OIICs, which indicated that these regulators might participate in the control of OLF development and deserved further concern.
 |
Figure 11 Correlation analysis between OIDELs and OIDEGs. (A) Correlation heat map between 46 OIDELs and 14 OIDEGs. (B) SILC1-CD1E correlation. (C) ZMAT4-CD1E correlation. (D) BMS1P10-CD1E correlation. (E) DLX6-AS1-STAT3 correlation. (F) SILC1-STAT3 correlation. (G) PTPRM-GRP correlation. (H) DLX6-AS1-SOCS3 correlation. (I) DNAAF5-CRH correlation. |
 |
Figure 12 Alluvial plot depicting predicted lncRNA-gene-immunocyte regulated network in OLF, including 10 OIDEGs, 41 OIDELs and 7 OIICs. |
RT-PCR Validation of the Candidate OIDEGs Between OLF and Normal Samples
To confirm the accuracy of the prediction results, qRT-PCR was used to detect the expression of the above 10 hub OIDEGs, including CD1E, STAT3, CRH, FAM3B, GRP, SOCS3, IFNB1, CD40LG, MUC4 and LGR5. Eventually, changes in the expression levels of these 10 OIDEGs were paralleled in microarray and qRT-PCR experiments, thereby confirming the reliability and validity of our findings (Figure 13A–J). Among them, CRH and STAT3 were up-regulated and down-regulated genes with the highest fold change (Figure 13K).
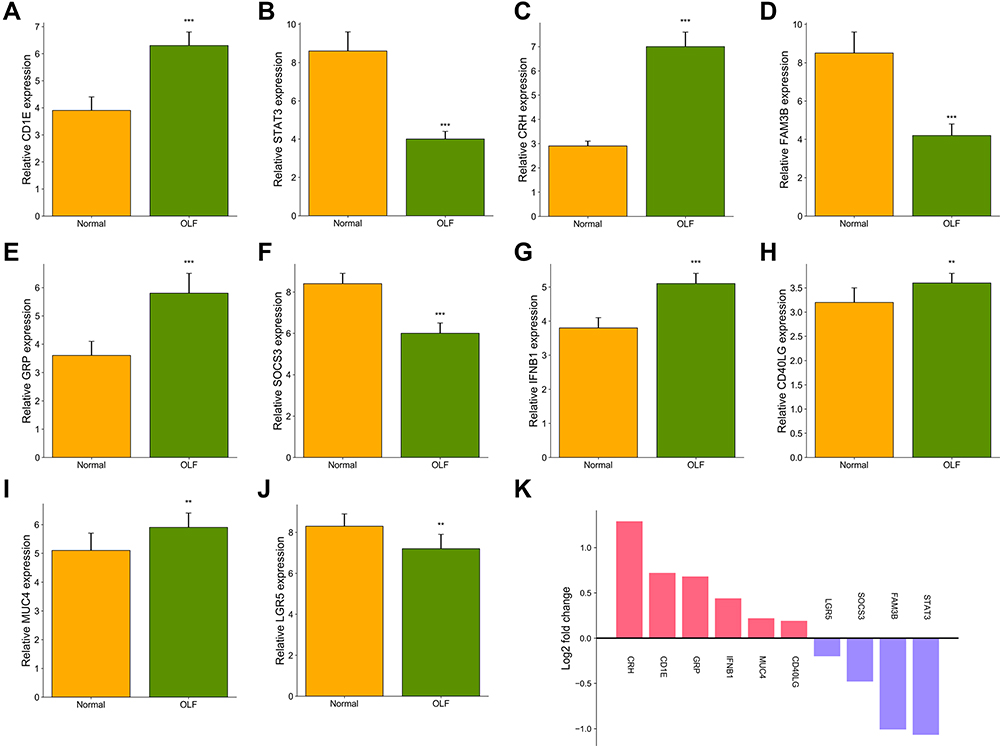 |
Figure 13 Validation of the expression of 10 hub OIDEGs between OLF and normal controls by qRT-PCR. (A) CD1E. (B) STAT3. (C) CRH. (D) FAM3B. (E) GRP. (F) SOCS3. (G) IFNB1. (H) CD40LG. (I) MUC4. (J) LGR5. (K) Fold changes of the mean expression value of OIDEGs. Error bars represented mean ± standard deviation for each group. **P < 0.01, ***P < 0.001. |
Discussion
OLF is characterized by heterotopic bone formation of ligamentum flavum tissues through endochondral ossification. In spite of a multitude of investigations, the exact pathogenesis of OLF has not been fully elucidated. Considering potential links between the immune system and abnormal bone formation have been frequently reported, we speculated that immune dysregulation might be implicated in osteogenic differentiation of ligament fibroblasts during OLF. More importantly, it was firstly established that immune score and macrophage score were significantly differential between OLF and normal samples. This aroused our interest in investigating whether immune-related functions and mechanisms in the development of OLF. To the best of our knowledge, this was the first tentative exploration for key factors that have potentially pathogenic effects, such as immune-related genes, molecular pathways and infiltrating immune cells, and their biological and functional correlations in OLF based on integrating bioinformatic analysis with real-world data, which provided novel insights into the pathogenesis and therapeutic targets of OLF.
Different expressional cell patterns of immune infiltration were identified to reveal that dysregulation of initial innate immunity and subsequent adaptive immunity might be associated with OLF. For example, infiltrating M2 macrophages, which are important component of the innate immunity, were lower in OLF samples than normal samples. Considering that M1 macrophages were generally pro-inflammatory, while M2 macrophages were anti-inflammatory,27 lower proportions of M2 macrophages in OLF tissues might contribute to more severe inflammatory and osteogenic processes. On the contrary, recovery of M2 macrophages might antagonize M1 macrophage responses to inhibit inflammation. Additionally, higher proportions of pro B-cells were detected in OLF tissues, representing that dysregulated cell population of adaptive immunity in OLF might be involved in disease development. Admittedly, mature B-cells could inhibit osteoblastic differentiation, thus we speculated that alterations in molecules or transcription factors during OLF precluded normal B-cell differentiation and resulted in sustaining osteogenic differentiation in unpredicted ways.28 Interestingly, cDC cells, which connected the innate and adaptive arms of the immune system, emerged as having the most prominent differential expression. Moreover, cDCs had an extraordinary capacity to produce bioactive molecules that induced and sustained inflammation as well as neovascular formation, which might indicate a crucial regulatory role in new bone formation.29 However, its concrete effects and mechanisms in the initiation and progression of OLF need to be studied by further research.
Through a series of bioinformatics algorithms and experimental verification, CD1E, CD40LG, MUC4, IFNB1, CRH, GRP, FAM3B, STAT3, SOCS3 and LGR5 were identified as hub immune-related genes implicated in OLF. Among them, STAT3 acts as a well-known OLF-associated gene, which plays a significant role in many cellular processes related to human osteogenesis, such as angiogenesis, inflammation, and autophagy.30–32 In addition, STAT3-related immunoregulatory mechanisms during new bone formation were also reported. Nicolaidou et al33 found monocytes/macrophages could potently induce the osteogenic differentiation of human MSCs via inducing the local activation of STAT3 in ankylosing spondylitis. SOCS3, encoding a member of the STAT-induced STAT inhibitor, has been predicted to be enriched in “adaptive immune response” and “chemokine signaling pathway” processes in OLF.17 Furthermore, a recent study revealed the SOCS3-STAT3 pathway, activated by the CUE domain-containing 2 (CUEDC2), accelerated osteoblast differentiation and bone formation.34 IFNB1, also known as Interferon Beta 1, belongs to the Type I interferons, which can induce transcription of genes encoding inflammatory cytokines and chemokines. Emerging studies highlighted the importance of the interaction between IFNB and bone metabolisms.35–37 For instance, osteoblasts treated with IFNβ exhibited a decreased mineralization, showing that IFNβ could be involved in low bone mass or osteoporosis.37 CD40LG, a gene regulating B cell function by engaging CD40, has been considered to regulate bone metabolism. Under appropriate conditions, CD40L suppression could also promote Wnt-10b production, bone formation and accretion of bone mass in the axial skeleton.38 LGR5 is the receptor for R-spondins that potentiates the canonical Wnt signaling pathway. Recently, LGR5 was found to be implicated in the cellular processes of osteogenic differentiation of MSCs through Wnt signaling pathway in fracture healing.39 Importantly, Wnt signaling pathway was highly correlated with the development of OLF; thus, the promising role of LGR5 during OLF should be further elucidated.40 GRP, a member of bombesin-like peptides, has been involved in several physiological and pathological processes. A latest study revealed the role of GRP inhibition on the amelioration of phosphate-induced vascular calcification by inhibiting osteogenic differentiation of vascular smooth muscle cells (VSMCs) in vitro and in vivo.41 As we know, the remaining four genes were the first time to be reported to hold potential relationship with osteogenic processes, which provided new directions in related fields.
Based on GO and KEGG analyses, OIDEGs-related biological processes and pathways were mainly related to inflammation and immunity. KEGG analysis demonstrated that JAK-STAT, Toll-like receptor and TNF signaling pathways might be involved in the development of OLF. A previous study showed that the STAT3 signaling pathway was activated by leptin-induced osteogenic differentiation of OLF cells.42 In addition, the activation of the JAK2-STAT3 pathway also had osteogenic potentials on OPLL cells.43 An iTRAQ proteomics study revealed that the TNF signaling pathway promoted the osteogenic differentiation of LF cells by activating Osx expression.12 Besides, numerous researches demonstrated that the TNF signaling enhanced the osteogenic differentiation ability of periodontal ligament stem cells (PDLSCs) in periodontitis.44–46 However, no studies were conducted to uncover the role of the toll-like receptor signaling pathway in OLF. He et al inferred that toll-like receptor signaling pathway was involved in the development of OPLL by mining microarray gene profiling.47 Moreover, the regulation of toll-like receptor signaling in human PDLSCs under inflammatory conditions has been fully elucidated.48,49 Our results revealed the significant involvement of the toll-like receptor signaling pathway in OLF, and further studies need to explore its underlying mechanisms in mediating the progression of OLF.
Establishment of the potential interactions among OIDEGs, OIDELs and OIICs could provide momentous clues for probing the role of immunoregulatory mechanisms in OLF. LncRNAs can affect the gene expression in various manners, including serving as competing endogenous RNAs (ceRNA), regulating DNA methylation of genes, modulating the promoter of genes.50 AC106779.1 and BMS1P10 were the most significantly up- and down-regulated OIDELs in OLF tissues in the present study, respectively; however, their biological functions remained so obscure that further studies were necessary to validate their potential as diagnostic biomarkers for OLF. Furthermore, FO393414.3, AC096734.1, LINC01137 and DLX6-AS1 were predicted as pivotal lncRNAs of the co-expressed OIDELs-OIDEGs pairs, which modulated the majority of the OIDEGs in OLF. It was hypothesized that these OIDELs might serve crucial roles by regulating the expression of STAT3, CD1E, SOCS3, and their associated signaling pathways. Regarding the immunocyte–gene interaction, not only did cDCs serve as most prominently up-regulated immune cell in OLF tissues, but it also held the highest degree of connectivity with hub OIDEGs, including up-regulated CD40LG and CD1E and down-regulated STAT3 and FAM3B. In addition, the most significantly down-regulated NK CD56bright cells were another valuable object which also concatenated many hub genes. These crucial immune-related regulators in this network deserved special mention.
Several inevitable limitations of this study need to be taken into account when interpreting the findings. First, only a few RNA-sequencing datasets of OLF were available on the GEO database. Moreover, we had no access to clinical data such as disease phenotypes and radiological data from the published study and public database. The small number of samples and incomplete clinical data made subgroup analyses impossible, which may lead to biased interpretation of the results in the case of group heterogeneity and the influence of other factors. Secondly, all of these analyses were obtained by data mining based on a series of bioinformatic algorithms, but these algorithms were commonly used and scientific, and we also preliminarily performed rigorous experimental demonstration to validate the feasibility of these algorithms to some extent. Thirdly, the exact underlying molecular mechanisms of candidate immune-related genes and immune cells in OLF need to be further investigated using in-depth in vitro and in vivo scientific experiments. Finally, the nature of retrospective research limited the clinical value of this work; thus, multicentre or prospective studies are imperative to elucidate the relationship between immune response and the development of OLF.
Conclusion
Taken together, through analyzing an OLF microarray, we found that OLF tissues and normal controls could be clearly distinguished via the overall immune score and featured infiltrating immune cells, and the hub differential immune response-related genes (eg, FAM3B, STAT3, SOCS3, CD40LG, CD1E) were identified. By combining a series of reliable bioinformatic algorithms with real-world data verification, we considered that these genes might participate in the immune response and play important roles in the development of OLF. Furthermore, highly correlated immunocyte-gene-lncRNA network was also preliminarily constructed. These findings may not only provide compelling insights into the underlying immunoregulatory machinery in OLF but also shed lights on promising targets for treatment strategies.
Abbreviations
OLF, ossification of ligamentum flavum; OIDEGs, OLF-related and immune-related differentially expressed genes; OIDELs, OIDEGs-related differentially expressed lncRNAs; OIICs, OIDEGs-related infiltrating immune cells; HO, heterotopic ossification; AS, ankylosing spondylitis; FOP, fibrodysplasia ossificans progressiva; NHO, neurogenic heterotopic ossification; OPLL, ossification of posterior longitudinal ligament; LF, ligamentum flavum; GEO, Gene Expression Omnibus; ssGSEA, single sample gene set enrichment analysis; DEGs, differentially expressed genes; DELs, differentially expressed lncRNAs; GO, Gene ontology; KEGG, Kyoto Encyclopedia of Genes and Genomes; qRT-PCR, quantitative real-time PCR; NKT, natural killer T cells; CMP, common myeloid progenitor cells; cDCs, conventional dendritic cells; pDCs, plasmacytoid dendritic cells; Th1, T helper 1; MSC, mesenchymal stem cells; VSMCs, vascular smooth muscle cells.
Data Sharing Statement
The data analyzed in this article come from Gene Expression Omnibus (GEO) database (http://www.ncbi.nlm.nih.gov/geo). The accession number can be found in the Materials and Methods section of the article.
Ethics Approval and Informed Consent
This study was approved by the Ethics Committee for Human Subjects of the Peking University Third Hospital in accordance with the Declaration of Helsinki (PUTH-REC-SOP-06-3.0-A27, #2014003) and all of the participants submitted written informed consent.
Acknowledgments
We thank the ImmPort, Genecards and GEO database for providing immune-related data and gene expression profiles of TOLF.
Funding
Our study was supported by the National Natural Science Foundation of China (82072479, 81772381).
Disclosure
The authors have declared no conflict of interest.
References
1. Feng F, Qiu H, Zhu D, Li X, Ning H, Yang D. miR-29a-5p targets SATB2 and regulates the SIRT1/Smad3 deacetylation pathway to inhibit thoracic ligamentum flavum cell osteogenesis. Spine. 2020;45(17):E1057–E1065. doi:10.1097/BRS.0000000000003505
2. Ando K, Imagama S, Kaito T, et al. Outcomes of surgery for thoracic myelopathy owing to thoracic ossification of the ligamentum flavum in a nationwide multicenter prospectively collected study in 223 patients: is instrumented fusion necessary? Spine. 2020;45(3):E170–E178. doi:10.1097/BRS.0000000000003208
3. Tang CYK, Cheung KMC, Samartzis D, Cheung JPY. The Natural history of ossification of yellow ligament of the thoracic spine on MRI: a population-based cohort study. Global Spine J. 2021;11;321–330.
4. Fujimori T, Watabe T, Iwamoto Y, Hamada S, Iwasaki M, Oda T. Prevalence, concomitance, and distribution of ossification of the spinal ligaments: results of whole spine CT scans in 1500 Japanese patients. Spine. 2016;41(21):1668–1676. doi:10.1097/BRS.0000000000001643
5. Kim SI, Ha KY, Lee JW, Kim YH. Prevalence and related clinical factors of thoracic ossification of the ligamentum flavum-a computed tomography-based cross-sectional study. Spine J. 2018;18(4):551–557. doi:10.1016/j.spinee.2017.08.240
6. Hou X, Chen Z, Sun C, Zhang G, Wu S, Liu Z. A systematic review of complications in thoracic spine surgery for ossification of ligamentum flavum. Spinal Cord. 2018;56(4):301–307. doi:10.1038/s41393-017-0040-4
7. Yang X, Qu X, Meng X, et al. MiR-490-3p inhibits osteogenic differentiation in thoracic ligamentum flavum cells by targeting FOXO1. Int J Biol Sci. 2018;14(11):1457–1465. doi:10.7150/ijbs.26686
8. Qu X, Chen Z, Fan D, Sun C, Zeng Y. MiR-132-3p regulates the osteogenic differentiation of thoracic ligamentum flavum cells by inhibiting multiple osteogenesis-related genes. Int J Mol Sci. 2016;17(8):1370. doi:10.3390/ijms17081370
9. Qu X, Chen Z, Fan D, et al. MiR-199b-5p inhibits osteogenic differentiation in ligamentum flavum cells by targeting JAG1 and modulating the Notch signalling pathway. J Cell Mol Med. 2017;21(6):1159–1170. doi:10.1111/jcmm.13047
10. Ning S, Chen Z, Fan D, et al. Genetic differences in osteogenic differentiation potency in the thoracic ossification of the ligamentum flavum under cyclic mechanical stress. Int J Mol Med. 2017;39(1):135–143. doi:10.3892/ijmm.2016.2803
11. Li J, Yu L, Guo S, Zhao Y. Identification of the molecular mechanism and diagnostic biomarkers in the thoracic ossification of the ligamentum flavum using metabolomics and transcriptomics. BMC Mol Cell Biol. 2020;21(1):37. doi:10.1186/s12860-020-00280-3
12. Zhang C, Chen Z, Meng X, Li M, Zhang L, Huang A. The involvement and possible mechanism of pro-inflammatory tumor necrosis factor alpha (TNF-α) in thoracic ossification of the ligamentum flavum. PLoS One. 2017;12(6):e0178986. doi:10.1371/journal.pone.0178986
13. Yang X, Chen Z, Meng X, et al. Angiopoietin-2 promotes osteogenic differentiation of thoracic ligamentum flavum cells via modulating the Notch signaling pathway. PLoS One. 2018;13(12):e0209300. doi:10.1371/journal.pone.0209300
14. Uchida K, Yayama T, Cai HX, et al. Ossification process involving the human thoracic ligamentum flavum: role of transcription factors. Arthritis Res Ther. 2011;13(5):R144. doi:10.1186/ar3458
15. Fan T, Meng X, Sun C, et al. Genome-wide DNA methylation profile analysis in thoracic ossification of the ligamentum flavum. J Cell Mol Med. 2020;24(15):8753–8762. doi:10.1111/jcmm.15509
16. Han Y, Hong Y, Li L, et al. A Transcriptome-level study identifies changing expression profiles for ossification of the ligamentum flavum of the spine. Mol Ther Nucleic Acids. 2018;12:872–883. doi:10.1016/j.omtn.2018.07.018
17. Kong D, Zhao Q, Liu W, Wang F. Identification of crucial miRNAs and lncRNAs for ossification of ligamentum flavum. Mol Med Rep. 2019;20(2):1683–1699.
18. Wu W, Chen Y, Yang Z, et al. The role of gene expression changes in ceRNA network underlying ossification of ligamentum flavum development. DNA Cell Biol. 2020;39(7):1162–1171. doi:10.1089/dna.2020.5446
19. Tsukasaki M, Takayanagi H. Osteoimmunology: evolving concepts in bone-immune interactions in health and disease. Nat Rev Immunol. 2019;19(10):626–642. doi:10.1038/s41577-019-0178-8
20. Kraft CT, Agarwal S, Ranganathan K, et al. Trauma-induced heterotopic bone formation and the role of the immune system: a review. J Trauma Acute Care Surg. 2016;80(1):156–165. doi:10.1097/TA.0000000000000883
21. Matsuo K, Chavez RD, Barruet E, Hsiao EC. Inflammation in fibrodysplasia ossificans progressiva and other forms of heterotopic ossification. Curr Osteoporos Rep. 2019;17(6):387–394. doi:10.1007/s11914-019-00541-x
22. Convente MR, Chakkalakal SA, Yang E, et al. Depletion of mast cells and macrophages impairs heterotopic ossification in an acvr1R206H mouse model of fibrodysplasia ossificans progressiva. J Bone Miner Res. 2018;33(2):269–282. doi:10.1002/jbmr.3304
23. Kanai Y, Kakiuchi T. Response of peripheral lymphocytes from patients with ossification of posterior longitudinal ligament. Clin Orthop Relat Res. 2001;389:79–88. doi:10.1097/00003086-200108000-00013
24. Saito T, Hara M, Kumamaru H, et al. Macrophage infiltration is a causative factor for ligamentum flavum hypertrophy through the activation of collagen production in fibroblasts. Am J Pathol. 2017;187(12):2831–2840. doi:10.1016/j.ajpath.2017.08.020
25. Ren L, Hu H, Sun X, Li F, Zhou JJ, Wang YM. The roles of inflammatory cytokines in the pathogenesis of ossification of ligamentum flavum. Am J Transl Res. 2013;5(6):582–585.
26. Vallés G, Bensiamar F, Maestro-Paramio L, García-Rey E, Vilaboa N, Saldaña L. Influence of inflammatory conditions provided by macrophages on osteogenic ability of mesenchymal stem cells. Stem Cell Res Ther. 2020;11(1):57. doi:10.1186/s13287-020-1578-1
27. Kong L, Wang Y, Smith W, Hao D. Macrophages in bone homeostasis. Curr Stem Cell Res Ther. 2019;14(6):474–481. doi:10.2174/1574888X14666190214163815
28. Sun W, Meednu N, Rosenberg A, et al. B cells inhibit bone formation in rheumatoid arthritis by suppressing osteoblast differentiation. Nat Commun. 2018;9(1):5127. doi:10.1038/s41467-018-07626-8
29. Bosisio D, Ronca R, Salvi V, Presta M, Sozzani S. Dendritic cells in inflammatory angiogenesis and lymphangiogenesis. Curr Opin Immunol. 2018;53:180–186. doi:10.1016/j.coi.2018.05.011
30. Jo S, Won EJ, Kim MJ, et al. STAT3 phosphorylation inhibition for treating inflammation and new bone formation in ankylosing spondylitis. Rheumatology. 2020. doi:10.1093/rheumatology/keaa846
31. Chen L, Zhang RY, Xie J, et al. STAT3 activation by catalpol promotes osteogenesis-angiogenesis coupling, thus accelerating osteoporotic bone repair. Stem Cell Res Ther. 2021;12(1):108. doi:10.1186/s13287-021-02178-z
32. Wang Z, Wei Y, Lei L, et al. RANKL expression of primary osteoblasts is enhanced by an IL-17-mediated JAK2/STAT3 pathway through autophagy suppression. Connect Tissue Res. 2020;1–16. doi:10.1080/03008207.2020.1759562
33. Nicolaidou V, Wong MM, Redpath AN, et al. Monocytes induce STAT3 activation in human mesenchymal stem cells to promote osteoblast formation. PLoS One. 2012;7(7):e39871. doi:10.1371/journal.pone.0039871
34. Kim JW, Oh SH, Lee MN, et al. CUEDC2 controls osteoblast differentiation and bone formation via SOCS3-STAT3 pathway. Cell Death Dis. 2020;11(5):344. doi:10.1038/s41419-020-2562-5
35. Kwon Y, Park OJ, Kim J, Cho JH, Yun CH, Han SH. Cyclic dinucleotides inhibit osteoclast differentiation through STING-mediated interferon-β signaling. J Bone Miner Res. 2019;34(7):1366–1375. doi:10.1002/jbmr.3701
36. Takayanagi H, Kim S, Matsuo K, et al. RANKL maintains bone homeostasis through c-Fos-dependent induction of interferon-beta. Nature. 2002;416(6882):744–749. doi:10.1038/416744a
37. Woeckel VJ, Koedam M, van de Peppel J, Chiba H, van der Eerden BC, van Leeuwen JP. Evidence of vitamin D and interferon-β cross-talk in human osteoblasts with 1α,25-dihydroxyvitamin D3 being dominant over interferon-β in stimulating mineralization. J Cell Physiol. 2012;227(9):3258–3266. doi:10.1002/jcp.24020
38. Roser-Page S, Vikulina T, Yu K, McGee-Lawrence ME, Weitzmann MN. Neutralization of CD40 ligand costimulation promotes bone formation and accretion of vertebral bone mass in mice. Rheumatology. 2018;57(6):1105–1114. doi:10.1093/rheumatology/kex525
39. Lin W, Xu L, Pan Q, et al. Lgr5-overexpressing mesenchymal stem cells augment fracture healing through regulation of Wnt/ERK signaling pathways and mitochondrial dynamics. FASEB J. 2019;33(7):8565–8577. doi:10.1096/fj.201900082RR
40. Yayama T, Mori K, Okumura N, et al. Wnt signaling pathway correlates with ossification of the spinal ligament: a microRNA array and immunohistochemical study. J Orthop Sci. 2018;23(1):26–31. doi:10.1016/j.jos.2017.09.024
41. Park HJ, Kim Y, Kim MK, et al. Inhibition of gastrin-Releasing peptide attenuates phosphate-Induced vascular calcification. Cells. 2020;9(3):737. doi:10.3390/cells9030737
42. Fan D, Chen Z, Chen Y, Shang Y. Mechanistic roles of leptin in osteogenic stimulation in thoracic ligament flavum cells. J Biol Chem. 2007;282(41):29958–29966. doi:10.1074/jbc.M611779200
43. Chen S, Zhu H, Wang G, Xie Z, Wang J, Chen J. Combined use of leptin and mechanical stress has osteogenic effects on ossification of the posterior longitudinal ligament. Eur Spine J. 2018;27(8):1757–1766. doi:10.1007/s00586-018-5663-4
44. Tan J, Zhou L, Xue P, et al. Tumor necrosis factor-α attenuates the osteogenic differentiation capacity of periodontal ligament stem cells by activating PERK signaling. J Periodontol. 2016;87(8):e159–e171. doi:10.1902/jop.2016.150718
45. Yan W, Cao Y, Yang H, et al. CB1 enhanced the osteo/dentinogenic differentiation ability of periodontal ligament stem cells via p38 MAPK and JNK in an inflammatory environment. Cell Prolif. 2019;52(6):e12691. doi:10.1111/cpr.12691
46. Dong, T., Sun, X., & Jin, H. (2020). Role of YAP1 gene in proliferation, osteogenic differentiation, and apoptosis of human periodontal ligament stem cells induced by TNF-α. Journal of periodontology. doi:10.1002/JPER.20-0176
47. He H, Mao L, Xu P, et al. Ossification of the posterior longitudinal ligament related genes identification using microarray gene expression profiling and bioinformatics analysis. Gene. 2014;533(2):515–519. doi:10.1016/j.gene.2013.09.001
48. Yu B, Li Q, Zhou M. LPS-induced upregulation of the TLR4 signaling pathway inhibits osteogenic differentiation of human periodontal ligament stem cells under inflammatory conditions. Int J Mol Med. 2019;43(6):2341–2351.
49. Zhu Y, Li Q, Zhou Y, Li W. TLR activation inhibits the osteogenic potential of human periodontal ligament stem cells through Akt signaling in a Myd88- or TRIF-dependent manner. J Periodontol. 2019;90(4):400–415. doi:10.1002/JPER.18-0251
50. Mercer TR, Dinger ME, Mattick JS. Long non-coding RNAs: insights into functions. Nat Rev Genet. 2009;10(3):155–159. doi:10.1038/nrg2521
 © 2021 The Author(s). This work is published and licensed by Dove Medical Press Limited. The
full terms of this license are available at https://www.dovepress.com/terms
and incorporate the Creative Commons Attribution
- Non Commercial (unported, 3.0) License.
By accessing the work you hereby accept the Terms. Non-commercial uses of the work are permitted
without any further permission from Dove Medical Press Limited, provided the work is properly
attributed. For permission for commercial use of this work, please see paragraphs 4.2 and 5 of our Terms.
© 2021 The Author(s). This work is published and licensed by Dove Medical Press Limited. The
full terms of this license are available at https://www.dovepress.com/terms
and incorporate the Creative Commons Attribution
- Non Commercial (unported, 3.0) License.
By accessing the work you hereby accept the Terms. Non-commercial uses of the work are permitted
without any further permission from Dove Medical Press Limited, provided the work is properly
attributed. For permission for commercial use of this work, please see paragraphs 4.2 and 5 of our Terms.