Back to Journals » OncoTargets and Therapy » Volume 13
Integrated RNA Sequencing and Single-Cell Mass Cytometry Reveal a Novel Role of LncRNA HOXA-AS2 in Tumorigenesis and Stemness of Hepatocellular Carcinoma
Authors Lu Q, Gao J, Tang S ![]() , Li Z, Wang X, Deng C, Hu J, Tao Y, Wang Q
, Li Z, Wang X, Deng C, Hu J, Tao Y, Wang Q
Received 18 July 2020
Accepted for publication 29 September 2020
Published 27 October 2020 Volume 2020:13 Pages 10901—10916
DOI https://doi.org/10.2147/OTT.S272717
Checked for plagiarism Yes
Review by Single anonymous peer review
Peer reviewer comments 2
Editor who approved publication: Prof. Dr. Nicola Silvestris
Qinchen Lu,1– 3,* Jiamin Gao,1– 3,* Shaomei Tang,4,* Zhijian Li,2,3 Xi Wang,2,3 Caiwang Deng,2,3 Jiaxin Hu,1– 3 Yuting Tao,2,3 Qiuyan Wang1– 3
1Department of Biochemistry and Molecular Biology, School of Basic Medical Sciences, Guangxi Medical University, Nanning 530021, People’s Republic of China; 2Center for Genomic and Personalized Medicine, Guangxi Medical University, Nanning 530021, People’s Republic of China; 3Guangxi Key Laboratory for Genomic and Personalized Medicine, Guangxi Collaborative Innovation Center for Genomic and Personalized Medicine, Nanning 530021, People’s Republic of China; 4Department of Gastroenterology, The First Affiliated Hospital of Guangxi Medical University, Nanning 530021, People’s Republic of China
*These authors contributed equally to this work
Correspondence: Qiuyan Wang; Yuting Tao
Center for Genomic and Personalized Medicine, Guangxi Medical University, 22 Shuangyong Road, Nanning 530021, People’s Republic of China
Tel/Fax +86 7715353342
Email [email protected]; [email protected]
Purpose: Accumulating evidence indicates that long non-coding RNAs (lncRNAs) play critical roles in the development of many cancer types. However, the changes of lncRNAs expression profiles in hepatocarcinogenesis remain largely unknown. Therefore, the purpose of this study was to identify the clinical significance, oncogenic functions, and potential mechanism of cancer-related lncRNAs in hepatocellular carcinoma (HCC).
Materials and Methods: An in vitro hepatocellular carcinoma model was established via oncogene-mediated transformation with a combination of three genetic alterations, including hTERT overexpression, inactivation of P53, and KRAS activation. Changes of biological function and transcriptome profile in these cell lines were determined by colony formation assay, MTT assay, wound-healing scratch assay, xenograft nude mice model, mass cytometry and RNA sequencing (RNA-Seq). Furthermore, 116 HCC tissues and its corresponding normal tumor-adjacent tissues were explored to validate the results of cell lines. Finally, RNA sequencing, single-cell mass cytometry and fluorescence-activated cell sorter were applied to evaluate the potential association between the expression of lncRNA and the stemness of HCC.
Results: LncRNA HOXA-AS2 was aberrantly upregulated and it may be involved in the regulation of cancer stem cells during oncogenic transformation. Consistently, lncRNA HOXA-AS2 expression was significantly upregulated in HCC and its higher expression positively correlated with poor prognosis and stem cell-related functions. Moreover, a specific cancer stem cell subpopulation with EPCAM+, C-MYC+ and CK19+ may exist in higher HOXA-AS2 expression HCC patients.
Conclusion: LncRNA HOXA-AS2 plays pivotal roles in the occurrence and progression of HCC, which may act as a therapeutic target for prognostic biomarker in hepatocellular carcinoma.
Keywords: diagnostic markers, hepatocellular carcinoma, lncRNA HOXA-AS2, multi-omics analysis, oncogenic transformation, stemness
Introduction
Hepatocellular carcinoma (HCC) is the most common primary liver cancer and is the third leading cause of cancer-related deaths worldwide.1 Almost half of the global incidence of HCC occurs in China, thus, it is arguably one of the most serious challenges in social health care as it imposes a heavy economic burden to many HCC patients and their families.2 The high mortality rate and poor prognosis of HCC are attributed to patients not displaying any clinical symptoms at the initial stages. Over 60% of the HCC patients are diagnosed with the late-stage disease after metastasis has occurred.3 Therefore, there is an urgent need to better understand the molecular mechanisms of hepatocarcinogenesis and identify reliable molecular markers for the detection of HCC.
Emerging evidences indicate that aberrant activation of oncogenes and the inactivation of tumor suppressor genes are frequently observed events in hepatocarcinogenesis.4,5 More importantly, defects in the transcriptional process play a critical role in oncogenic transformation, and may further lead to potential tumor initiation and progression.6,7 Non-coding RNAs (ncRNAs) are now widely regarded as one of key regulatory elements involved in the regulation of gene expression. Long non-coding RNAs (lncRNAs) are a class of non-coding RNAs and are commonly defined as transcripts of more than 200 nucleotides that are not translated into proteins.8 Many lncRNAs are reported to be dysregulated in HCC, where they promote cell proliferation, migration, invasion, metastasis, and stemness via multiple biological processes.9 Although significant research efforts have been made to understand the functions of cancer-associated lncRNAs, the mechanisms of HCC-related lncRNAs remain largely unknown.
Studies have shown that oncogenic transformation generally implicates oncogenic reprogramming of human somatic cells, and yields cells with the ability to self-renew and along multiple lineages differentiate, a property shared with cancer stem cells.10,11 Cancer stem cells (CSCs; also known as tumor-initiating cells, TICs) are a subpopulation of cancer cells with the ability to self-renew and differentiate and are responsible for the initiation and maintenance of tumor growth.12 CSCs play critical roles in multiple stages of tumorigenesis, from the initial cellular transformation to the hierarchical organization of well-established malignancies. Furthermore, lncRNAs have been reported to be involved in the regulation of biological functions of cancer stem cells, where they modulate stem cell-related pathways.13 However, little is known about the association between aberrant expression of lncRNAs and regulation of cancer cell stemness in HCC, which is currently receiving significant attention in theoretical research and clinical practice.
In the current study, a hepatocellular carcinoma model was successfully developed via oncogene-mediated transformation of primary cultured normal human liver epithelial cells (THLE2), with a combination of three genetic alterations, including hTERT overexpression, inactivation of P53, and KRAS activation. Subsequently, changes in the transcriptome profile and stem cell-related markers in these cell lines were determined by high-throughput RNA-sequencing (RNA-Seq) technology and single-cell mass cytometry (CyTOF) technology. LncRNA HOXA-AS2 is found to be significantly upregulated in oncogenic transformation cell lines compared to normal cell lines and further implicated in the regulation of cancer stem cells. Therefore, the expression of lncRNA HOXA-AS2 in normal liver cell lines and HCC cell lines, and 116 HCC tissues and its corresponding normal tumor-adjacent tissues was explored to validate the results. In addition, the potential association between the lncRNA HOXA-AS2 expression and cancer cell stemness and their functional effects were elaborated for the first time through transcriptome and high-dimensional single-cell proteome analysis. These pioneering studies aimed at providing innovative insights into considering lncRNA HOXA-AS2 as an attractive and promising therapeutic target of HCC.
Materials and Methods
Cell Lines and Cell Culture
Normal human liver epithelial cell lines (THLE2) were purchased from Cell Bank of Shanghai Institute of Cell Biology, Chinese Academy of Sciences (Shanghai, China). The cell lines were cultured in Dulbecco’s Modified Eagle Medium (DMEM, Gibco, China) supplemented with penicillin (Pen, 100 U/mL), streptomycin (Strep, 100mg/mL) and 10% fetal bovine serum (FBS, Gibco, Australia). All cell lines were maintained at 37°C in a humidified atmosphere containing 5% CO2.
Lentiviral Transduction of THLE2 Cell Lines
The pGMLV-hTERT-3xFlag and pGMLV-P53-shRNA lentiviral vectors were purchased from Genomeditech Co. Ltd (Shanghai, China). The PCDH-mCherry-KRASV12 lentiviral vector was a gift from Prof. Pei Wang (UT Health San Antonio, USA). Lentiviruses were produced with these lentiviral vectors, and then infected into THLE2 cells with the Polybrene (8 μg/mL, Sigma, USA), according to the manufacturer’s instructions. The THLE2 cell lines were established by stable overexpression of hTERT, knockdown of P53, and overexpression of KRAS oncogene in sequential order. The infected cells were selected with culture media containing puromycin (1 mg/mL), blasticidin (1 mg/mL) and neomycin (1 mg/mL). After antibiotics selection, the infected cells were harvested for RNA and protein extraction. The infection efficiency was confirmed by Quantitative Polymerase Chain Reaction (qPCR) and Western blot (WB) analysis.
RNA Extraction and qRT-PCR
Total RNA was extracted from the cell lines using Trizol Reagent (Invitrogen), and reverse-transcribed to cDNA using PrimeSciptTM RT reagent Kit with gDNA Eraser (Takara, China) following the manufacturer’s instructions. Quantitative real-time Polymerase Chain Reaction (qRT-PCR) was performed using FastStart Essential DNA Green Master (Roche, USA) and LightCycle® 96 Instrument (Roche, USA) following the manufacturer’s instructions. Primer sequences were: 5ʹ-CTCCATCCTGGCCTCGCTGT-3ʹ (forward) and 5ʹ-GCTGTCACCTTCACCGTTCC-3ʹ (reverse) for Actin; 5ʹ-GCGTTTGGTGGATGATTTCT-3ʹ (forward) and 5ʹ-GCGGTTGAAGGTGAGACTG-3ʹ (reverse) for hTERT; 5ʹ-CCTCAGCATCTTATCCGAGTGG-3ʹ (forward), 5ʹ-TGGATGGTGGTACAGTCAGAGC-3ʹ (reverse) for P53; 5ʹ-GGCCTGCTGAAAATGACTG-3ʹ (forward) and 5ʹ-GGTCCTGCACCAGTAATATG-3ʹ (reverse) for KRAS; 5ʹ-GTGAACCATGAGAAGTATGACAAC-3ʹ (forward) and 5ʹ-CATGAGTCCTTCCACGATACC-3ʹ (reverse) for GAPDH and 5ʹ-CCCGTAGGAAGAACCGATGA-3ʹ (forward) and 5ʹ-TTTAGGCCTTCGCAGACAGC-3ʹ (reverse) for lncRNA HOXA-AS2. The 2−ΔΔCT method was used to analyze relative changes in gene expression by calculating the fold change. Three replicate wells were prepared for each group, and the experiment was repeated thrice.
Western Blot Assay
Cells were lysed using RIPA buffer, and proteins were collected and preserved at −80°C. The BCA assay was used to determine protein concentration. About 50 μg of the proteins were loaded on 10% SDS-PAGE for separation and transferred onto PVDF membranes for 1.5 h. The membranes were incubated with a primary antibody (1:1000) at 4°C overnight. Subsequently, the membranes were incubated with horseradish peroxidase (HRP) -conjugated secondary antibody (1:30,000) at 37°C for 1.5 h. EZ-ECL (Biological Industries, Israel) was used to detect the proteins, according to the manufacturer’s instructions. Anti-P53 (ab26), and anti-TERT (ab181830) antibodies were obtained from Abcam (Cambridge, UK), anti-α-TUBULIN (CST#138000) was obtained from Invitrogen (California, USA), and anti-HRP antibodies (7074S, 7076S) was purchased from Cell Signaling Technology (Cambridge, USA).
Colony Formation Assay
Approximately 200 primary or transfected cells per well were plated into six-well plates at 37°C in a humidified incubator containing 5% CO2. After two weeks, the cells were washed with PBS three times, fixed in 100% methanol for 30 minutes, stained with 0.1% Giemsa Stain-solution for 30 minutes at room temperature. The cells were counted under a microscope, where more than 50 cells in a colony were identified as one positive colony and photographed. Three replicate wells were prepared for each group, and the experiment was repeated 3 times independently.
Cell Proliferation Assay
Cell proliferation was evaluated by dimethylthiahiazo, di-phenytetrazoliumromide (MTT) assay. Cells were adjusted to 1.5×10³ cells/mL, seeded into 96-well plates at 100μL per well, and cultured for 1–4 days. At the indicated time, 10 μL MTT stock solution (5 mg/mL, Sigma) was added to each well and incubated for 4 hours at 37°C. Then, 100μL dimethyl sulfoxide (DMSO) was added into each well to dissolve formazan crystals. The absorbance was detected at 490 nm using luminometer (FLUOstar Omega, USA). Three replicate wells were prepared for each group, and the experiment was repeated thrice.
Wound-Healing Scratch Assay
Cells were seeded into 6-well cell plates at a density of 8×10⁵ cells per well and cultured with 2 mL of DMEM medium supplemented with 10% FBS for 24 hours to form a cell monolayer. A straight line was scratched into the monolayer with a 200 μL pipette tip. The cells were washed thrice with PBS, cultured with serum-free DMEM medium, and observed for 0, 12, and 24 hours under a reversed microscope with 200×magnification. Photographs were taken at each time point, and the images were analyzed by ImageJ software. Three duplicate wells were prepared for each group, and the experiment was repeated thrice.
Xenograft Nude Mice Model
Four-week female nude mice were purchased from Laboratory Animal Center of Guangxi Medical University. SPF-grade rodent feed was provided by Laboratory Animal Center of Guangxi Medical University. The wild type and oncogene-transformed THLE2 cell lines were inoculated subcutaneously in nude mice (approximately 5×10⁵ cells per animal, with 5 nude mice in each group). The tumor tissues were dissected, and the tumor sizes were compared in 15 days after cell inoculation. The maximum tumor diameter was estimated every 2 days using an electronic vernier caliper, and final tumor weight measurements were taken at the termination of the experiments. This study was approved by the Animal Ethics Committee of Guangxi Medical University (Ethical Number: 202008001).
Tissue Samples and Patients
Paired HCC and normal tumor-adjacent tissues were freshly collected from 116 HCC patients after surgical resection at The Affiliated Cancer Hospital of Guangxi Medical University. Informed consent was obtained from each patient included in this study and the study was approved by the Human Subject Research Ethics Committee of Guangxi Medical University (Ethical Number: 20200137). Besides the tissue samples, we also collected detailed clinical and pathological data from the patients, including age, sex, tumor numbers, tumor sizes, Barcelona Clinical Liver Cancer System (BCLC), Edmondson grade, Microvascular invasion (MVI), CK19, AST/ALT, AFP level, liver cirrhosis, recurrence status, and survival status (Table 1). The pathological analysis was confirmed by at least two experienced pathologists. All experimental methods were performed in accordance with relevant guidelines and regulations.
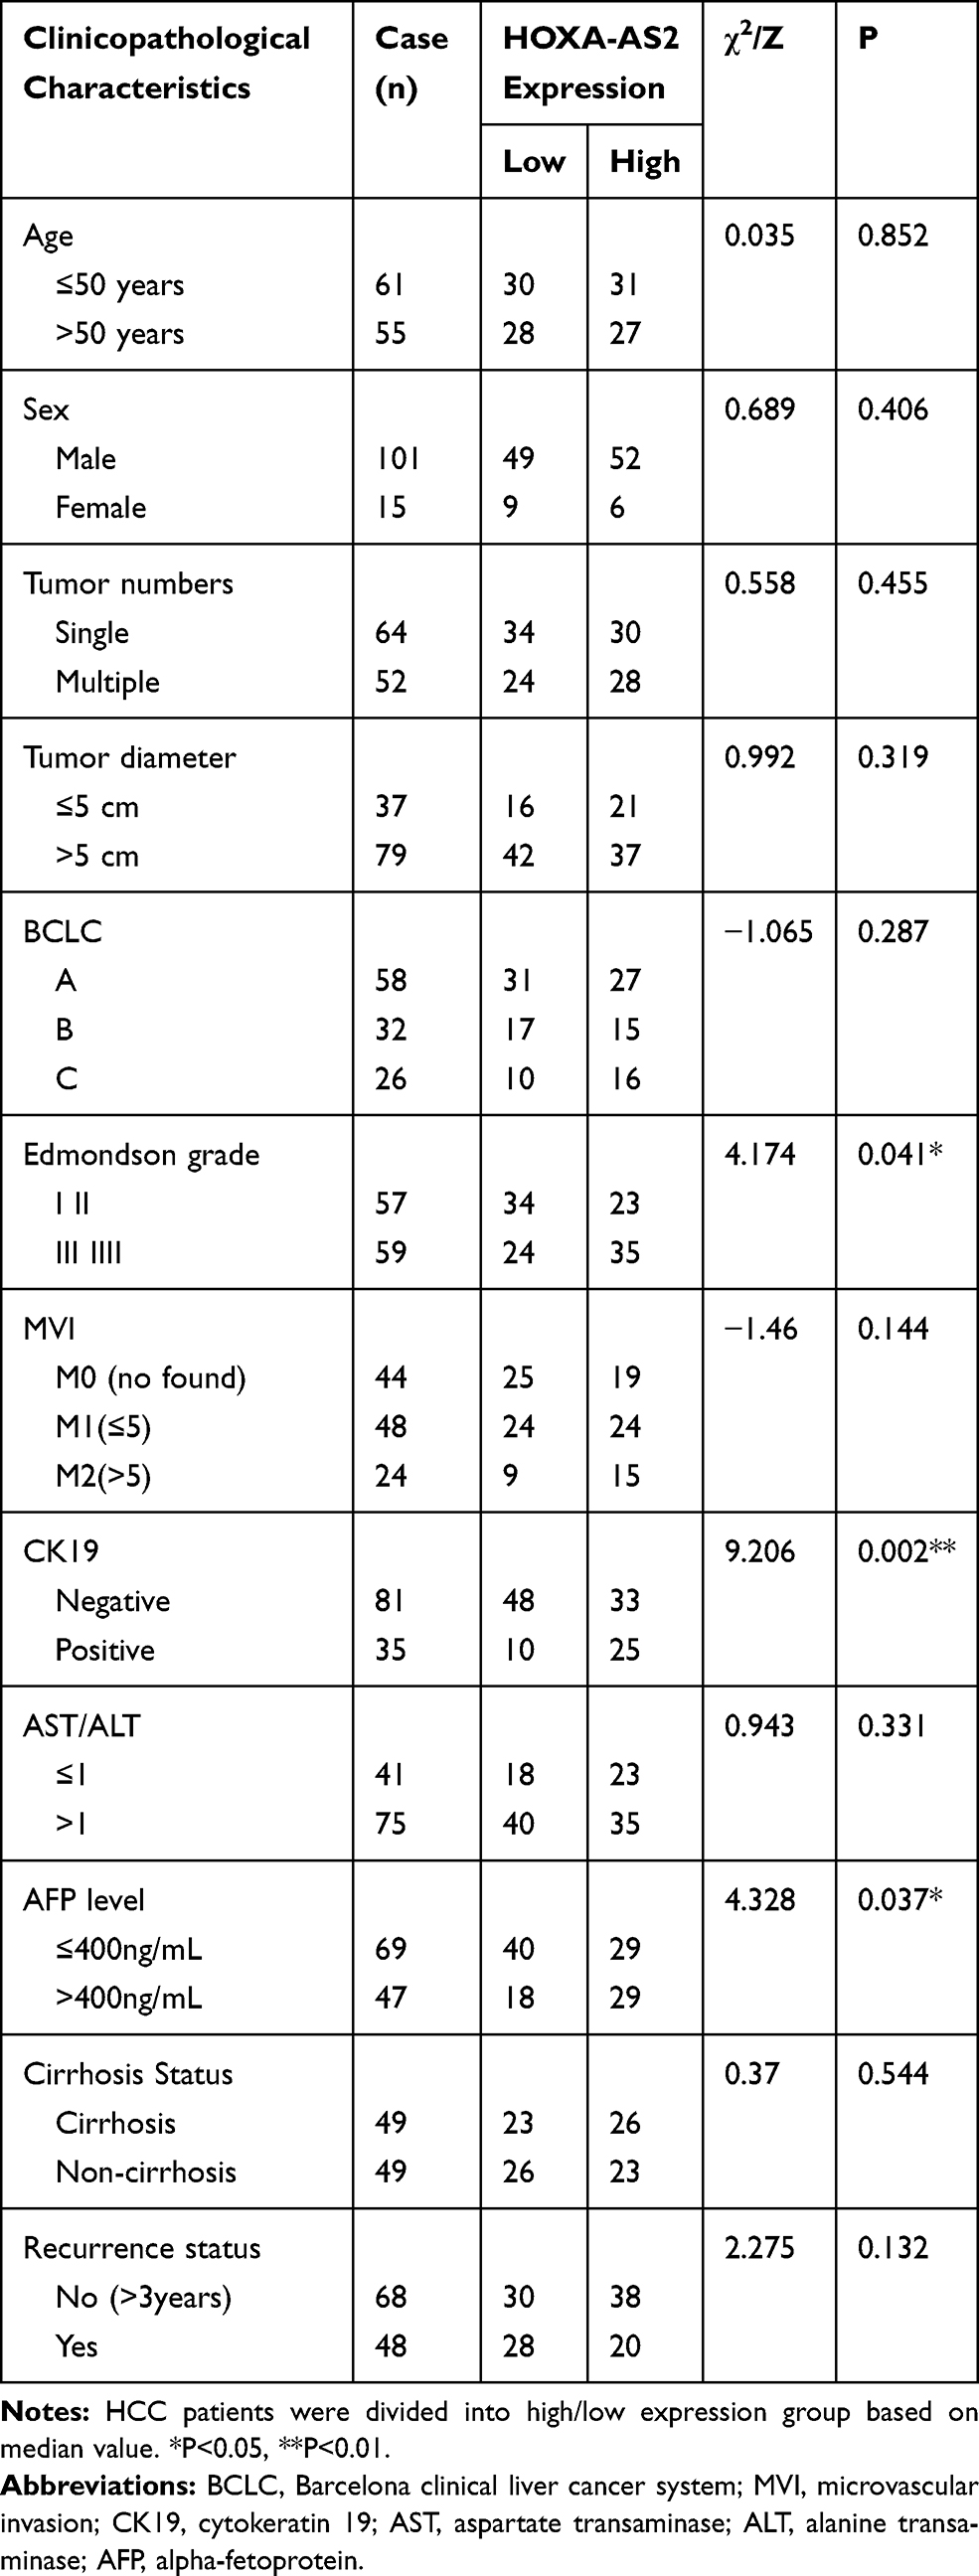 |
Table 1 Correlation Between HOXA-AS2 Expression and Clinicopathological Characteristics in HCC Patients |
RNA-Seq Library Preparation and Sequencing
RNA-seq of THLE2 Wild-Type and hTERT+P53−KRAS+ cell lines were performed. Besides, RNA-seq of 116 paired HCC tissue samples and normal tumor-adjacent tissue samples was performed. Total RNA was extracted from the primary or transfected cells and frozen tissue samples, and a strand-specific RNA-seq library prepared for each cell line or sample. The integrity of the total RNA was determined using a 2100 Bioanalyser (Agilent) and quantified using the NanoDrop (Thermo Scientific). RNA purification, reverse transcription, library construction, and sequencing (2x150 paired-end) were performed at WuXi NextCODE in Shanghai according to the manufacturer’s instructions (Illumina). Quality control was performed using Fast QC and clean reads were mapped onto the human genome (hg19) using HiSeq2 and StringTie before bioinformatics analysis.
RNA-Seq for Differential Expression of LncRNAs and mRNAs
The expression level of each lncRNA and mRNA was calculated, and the results were quantified using the FPKM (Fragments Per Kilobase of exon model per Million reads mapped) method. Differentially expressed lncRNAs and mRNAs were identified using the DEseq2 package of R/Bioconductor. The biological significance threshold was set at a fold change of ±2 (log2FC≥1 and log2FC≤-1), and the statistical significance threshold was set at an adjusted p-value (adj. p) <0.05. Only lncRNAs or mRNAs that achieved both biological and statistical significance were considered as DEGs. Differentially expressed lncRNAs and mRNAs were identified through volcano plot filtering. One lncRNA (HOXA-AS2) which was significantly up-regulated in both oncogenic transformation cell line and HCC tissue samples was selected and the expression of HOXA-AS2 in liver hepatocellular carcinoma in TCGA was further validated using LncTarD online database (http://biocc.hrbmu.edu.cn/LncTarD/or http://biocc.hrbmu.edu.cn/LncTarD/).14 Based on the median expression of lncRNA HOXA-AS2, the patient samples were categorized into the high (n=58) and low (n=58) expression groups and subsequently plotted into the heatmap of differentially expressed mRNAs using the pheatmap.2 R package.
GO and Pathway Analysis
The gene ontology (GO) analysis is used as the functional annotation of the differentially expressed mRNAs, including Biological Process (BP), Cellular Component (CC) and Molecular Function (MF). The GO annotations were performed using DAVID 6.8 (https://david.ncifcrf.gov/). The KEGG (Kyoto Encyclopedia of Genes and Genomes) pathway analysis for differentially expressed mRNAs allowed the determination of significantly enriched biological pathways using KOBAS 3.0 (http://kobas.cbi.pku.edu.cn/). P<0.05 was considered statistically significant.
Fluorescence-Activated Cell Sorting (FACS) for CD133+ and CD326+ Cell Populations
The single-cell suspensions were incubated with phycoerythrin (PE) anti-human CD133 antibody (1:50, Cat. 372803, BioLegend, USA) and fluorescein isothiocyanate (FITC) anti-human CD326 antibody (1:50, Cat. 324203, BioLegend, USA) in staining solution containing 3% bovine serum albumin (BSA) for 15 min at 4°C according to the manufacturer’s instructions. Negative controls were stained with antibodies of isotype control. The cells were then washed and resuspended in pre-cooled PBS, and filtered through a 40 μm cell strainer to obtain single-cell suspension. Cell analysis was performed using a BD Accuri C6 Plus (BD Biosciences, USA), and cell sorting was performed using a BD FACS Aria ш (BD Bioscience, USA). Data were analyzed using FlowJo 10.5.3 software (FlowJo, LLC) and only living and single cells were gated out for population analysis using a PI gate and side and forward scatter gates. All experiments were repeated thrice.
Time-of-Flight Mass Cytometry (CyTOF)
In brief, a total of 30 HCC patients (15 HCC patients with high HOXA-AS2 expression and 15 HCC patients with low HOXA-AS2 expression) and 10,000 living cells per sample were selected and analyzed. These 30 tumor tissues were dissociated into single cells using DNAase I (Sigma), Collagenase II (Gibco) and Red Blood Cell Lysis Buffer (Solarbio) as previously described,15 and single-cell suspensions were cryopreserved in freezing media containing 10% dimethyl sulfoxide (DMSO, Sigma) and 90% fetal bovine serum (FBS, Gibco) for CyTOF analysis. A panel of 29 antibodies that included a broad number of stem cell markers are listed in the Table 2. These antibodies were subsequently conjugated with metal-loaded polymers for antibody binding. A 20-well barcoding group comprising of unique combinations of six barcoding metals (102 Pd, 104 Pd, 105 Pd, 106 Pd, 108 Pd, and 110 Pd, Fluidigm) were used for this study. For viability staining, the cells were stained with cisplatin (Fluidigm) at a final concentration of 5 mmol/L to identify living and dead cells. The cells were then fixed with 1.6% paraformaldehyde at room temperature for 10 minutes, stained with DNA intercalator (Fluidigm), and incubated at 4°C overnight. The cells were then washed with Maxpar Cell Staining Buffer and Milli-Q Water. Prepare 0.1×EQ beads to re-suspend all samples, then filter through a 35-μm nylon mesh and then analyzed on CyTOF 2 Mass Cytometer within the Fluidigm CyTOF acquisition software.
 |
Table 2 Purified Antibodies About the Stem-Like Cells Centric Panel |
CyTOF Data Analysis
All FCS files generated by CyTOF v6.7 were concatenated, normalized, and manually debarcoded. Single living cells for each file were manually gated using the online Cytobank software (https://www.cytobank.org/). Single-cell data were clustered by an unsupervised hierarchical clustering algorithm (PhenoGraph)16 and dimensionality reduction performed by at-distributed stochastic neighbor embedding algorithm (t-SNE).17 For Spanning Tree Progression of Density Normalized Events (SPADE) analysis,18 20–200 target nodes and 10% downsampled events were used. The clustering channels were selected based on whether they were lineage markers and which cell subpopulations were to be clustered. The ratio of median intensity to plot heatmap was transformed, showing the differential expression of 29 stem cell markers in different clusters. The colors in the heatmap represented the measured average intensity value of a given marker in each cluster.
Statistical Analysis
All assays were carried out in triplicates. Statistical analysis was performed using SPSS 26.0, GraphPad Prism 8.3, and R 3.6.1. The independent t-test was used to compare the differences between the two groups, one-way ANOVA was used for three or more groups, and repeated-measures ANOVA was used for MTT assay and tumor growth curves. The Chi-square test and Wilcoxon rank-sum test were used to examine the correlations between clinicopathological characteristics and HOXA-AS2 expression. Data were expressed as mean (M)±standard deviation (SD). Survival analysis was performed using the following steps: dividing the patients into high and low HOXA-AS2 level groups with the median expression regarded as the cut-off value; Overall survival curves plotted by Kaplan-Meier plotter and overall survival analysis performed using the Log-rank test. Univariate and multivariate Cox regression analysis was used to determine hazard ratios and independent prognostic factors that influenced survival, and relevant results were displayed on a forest plot. P<0.05 was considered statistically significant in all analyses (*P<0.05; **P<0.01; ***P<0.001).
Results
Establishment of Oncogene-Transformed Cell Lines
THLE2 cell lines were derived from primary normal human liver epithelial cells expressing SV40 LT. To engineer hepatocellular carcinoma models via oncogene-mediated transformation, according to previous studies,19 the oncogenic hTERT, which is known as the most important oncogene in hepatocarcinogenesis was first overexpressed, creating the THLE2 hTERT+ cell line. Based on hTERT overexpression, the P53 pathway was inactivated by transducing with P53-specific shRNA (sh-P53), to construct the THLE2 hTERT+P53− cell line. Finally, an oncogene KRAS was introduced to enhance malignant transformation, generating the THLE2 hTERT+P53−KRAS+ cell line. The overexpression efficiency of hTERT and KRAS and knockdown efficiency of P53 in THLE2 cell lines were evaluated by qRT-PCR and Western blot analysis, respectively (Figure 1A and B). All the above experimental results supported that the oncogene-transformed cell lines were established successfully.
 |
Figure 1 Characterization of THLE2 cell lines expressing oncogenes hTERT, P53 or KRAS. |
Enhancement of Colony Formation, Proliferation, Migration and Stem Cell-Related Properties During Oncogenic Transformation
In an attempt to determine the biological functions of the constructed cell lines, the colony formation experiment was first conducted, demonstrating that the number and size of clones in the THLE2 hTERT+P53−KRAS+#2 cell line increased significantly compared with the THLE2 Wild Type cell line (P<0.001, Figure 2A). Moreover, MTT assay revealed that the cell proliferation ability of THLE2 hTERT+P53−KRAS+#2 cell line was also significantly higher than that of the Wild Type cell line (P<0.01, Figure 2B). Given that cell migration is a vital step in cancer progression, a scratch wound-healing assay was performed to evaluate the role of oncogenic transformation in cell migration. As shown in Figure 2C, the migration rate of THLE2 hTERT+P53-KRAS+#2 cell line was significantly increased after 24 h compared with the Wild Type cell line (P<0.001, Figure 2C). The increased abilities of colony formation, proliferation and migration may indicate the enhancement of stem cell characteristics. Because stem cell subpopulation is extremely rare in all cell types, the single-cell mass cytometry technology was innovatively adopted to reveal the stem-cell properties of THLE2 cell lines. CD326, CK19, and OV6 are some of the well-known stem cell markers in HCC, which were significantly increased (Figure 3A). We further developed a xenograft nude mice model to test the self-renewal capacity of established cell line in vivo (Figure 3B). Oncogene-transformed cell line significantly accelerated xenograft tumor growth in nude mice compared with Wild Type cell line (P<0.05, Figure 3C). The diameter of the subcutaneous tumors in nude mice formed by the THLE2 hTERT+P53−KRAS+ cell line was larger than that of THLE2 Wild Type cell line (P<0.05, Figure 3D). Tumor weight of nude mice was measured at the termination of the experiment and shown significantly higher in the THLE2 hTERT+P53−KRAS+ group compared with THLE2 Wild Type group (P<0.05, Figure 3E). These results suggested that oncogenic transformation might enhance the stem cell-related properties.
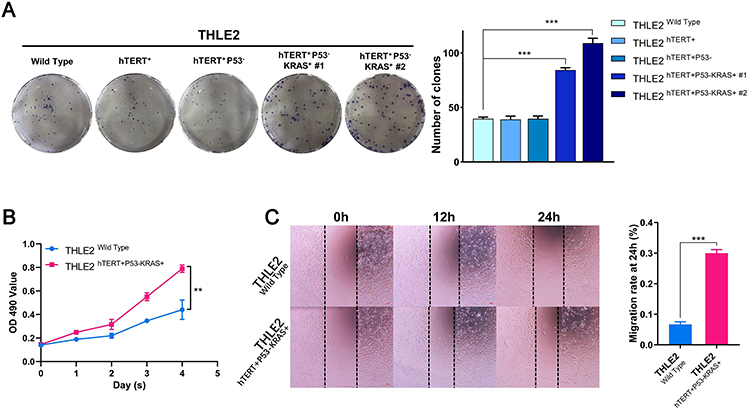 |
Figure 2 The abilities of colony formation, proliferation and migration in THLE2 cell lines. |
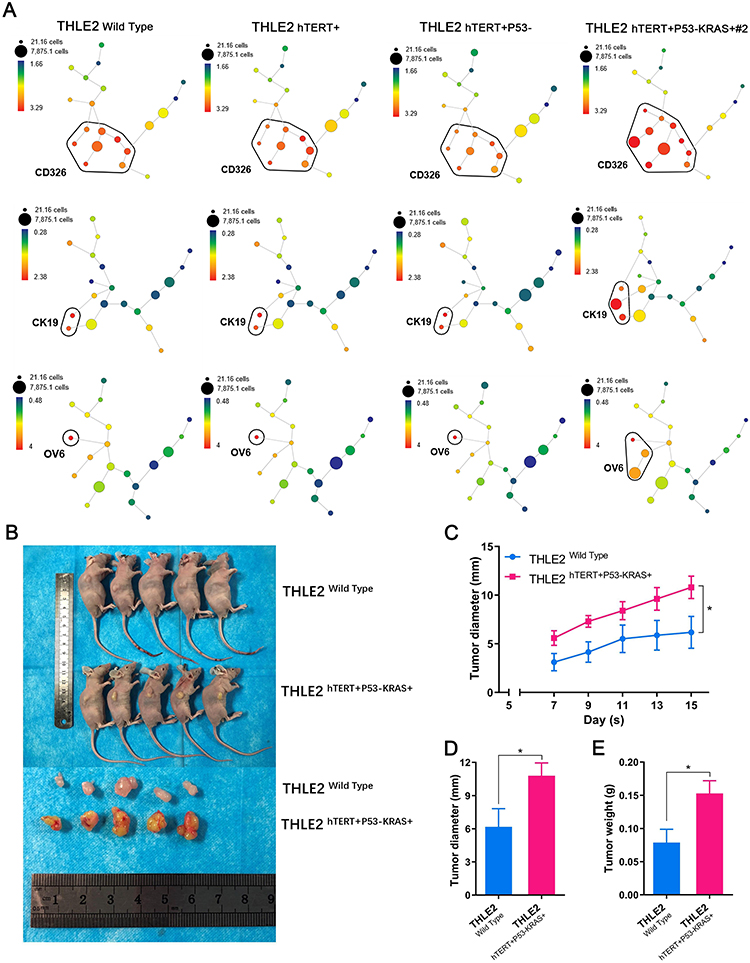 |
Figure 3 The stem cell-related and tumorigenic properties of THLE2 cell lines. |
Aberrant Upregulation of lncRNA HOXA-AS2 in Oncogene-Transformed Cell Lines, HCC Cell Lines and HCC Patients
To gain further insights into transcriptional regulation changes during malignant transformation, whole transcriptome sequencing (RNA-seq) on THLE2 Wild Type and THLE2 hTERT+P53−KRAS+#2 cell lines were performed. The volcano plot depicted 87 up-regulated lncRNAs and 101 down-regulated lncRNAs which significantly changed more than two-fold (P adj< 0.05, Figure 4A). Among the differentially expressed lncRNAs, HOXA-AS2 is the top 5 significantly up-regulated lncRNA, and little has been reported on its role in tumorigenesis and cancer stemness. Meanwhile, qPCR experiments in two normal liver cell lines (THLE2 and LO2) and nine HCC cell lines (Huh-1, Li-7, SNU-398, MHCC97L, HCCLM3, PLC/PRF/5, SNU-182, Huh-7, HepG2) were performed to verify the upregulation of HOXA-AS2 in HCC cell lines (P<0.001, Figure 4B). To evaluate the expression levels of HOXA-AS2 in HCC patients, HOXA-AS2 expression was detected in 116 pairs of tumor and normal tumor-adjacent tissue samples. Consistently, HOXA-AS2 expression was found to be significantly upregulated in HCC tissues (P<0.001, Figure 4C). The expression of HOXA-AS2 in TCGA was subsequently examined using LncTarD online database. The results from the TCGA database revealed that HOXA-AS2 expression was significantly upregulated in HCC as well (Figure 4D). Together, these results elucidated the aberrant upregulation of lncRNA HOXA-AS2 in oncogene-transformed cell lines, HCC cell lines and HCC Patients.
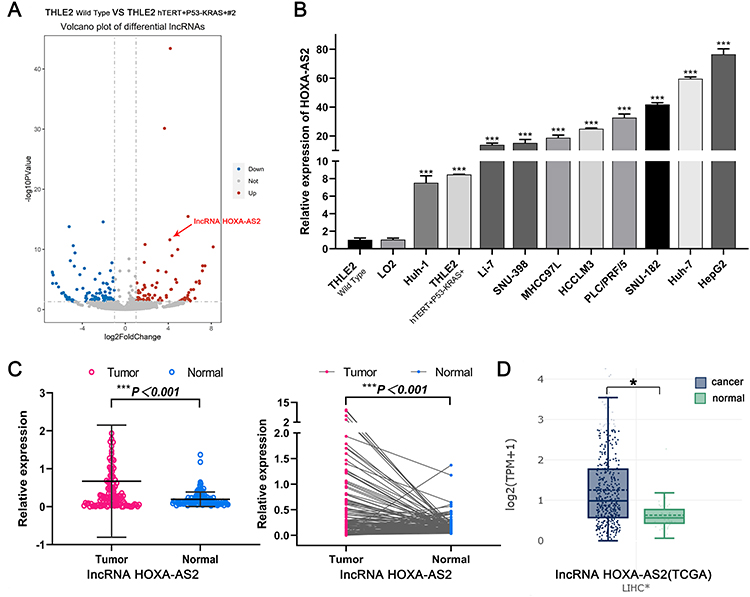 |
Figure 4 The expression of lncRNA HOXA-AS2 in oncogene-transformed cell lines, HCC cell lines and HCC Patients. |
Higher HOXA-AS2 Expression Levels are Positively Correlated with Poor Progression, Survival, and Prognosis
To further investigate the clinical significance regarding dysregulation of HOXA-AS2 in HCC, the correlation between clinicopathological characteristics and HOXA-AS2 expression was evaluated by dividing patients into high (n=58) and low (n=58) expression groups, based on the median expression value of HOXA-AS2 in tumor tissues. Association analysis revealed that the HOXA-AS2 expression was positively correlated with Edmondson grade (P=0.041), CK19+ (P=0.002) and AFP level (P=0.037, Figure 5A), but not with age, gender, tumor diameter, tumor numbers, Barcelona clinical stage of liver cancer (BCLC), Microvascular invasion (MVI), liver cirrhosis, and recurrence status (P>0.05, Table 1 and Figure S1A). However, these indicators also showed increasing trends in HCC patients with high HOXA-AS2 expression. Furthermore, Kaplan–Meier survival analysis suggested that the overall survival rate (OS) in HCC patients with high HOXA-AS2 expression was significantly lower compared with low HOXA-AS2 expression group (P=0.0364, Figure 5B), while there was no significant difference in the recurrence-free survival rate between the two groups (P=0.904, Figure S1B). Besides, Univariate Cox proportional hazard regression analysis revealed that the HOXA-AS2 expression, as well as tumor numbers, Edmondson grade, MVI, BCLC, and CK19+, were significantly correlated with overall survival in HCC patients (Figure 5C). More importantly, multivariable Cox regression analysis predicted that HOXA-AS2 expression level could serve as an independent prognostic factor for poor overall survival (P=0.028, HR=2.764, 95% CI=1.115–6.848). All the above clinical results suggested that the upregulation of HOXA-AS2 may play a critical role in poor progression, survival, and prognosis in HCC patients.
 |
Figure 5 Higher HOXA-AS2 expression levels indicated poor survival and prognosis. |
Functional Annotations of Differentially Expressed Genes in HCC Patients with High and Low HOXA-AS2 Expression
In the preliminary study, HOXA-AS2 expression was uncovered to be significantly increased in both oncogene-transformed cell line and HCC tissues, and associated with poor survival and prognosis, implying that HOXA-AS2 plays a pivotal role in hepatocarcinogenesis. It was therefore important to further explore the biological functions of high HOXA-AS2 expression in HCC, through differentially expressed genes analysis between high and low HOXA-AS2 expression groups. A total of 260 up-regulated and 94 down-regulated genes were identified (Figure S2). Subsequently, GO and KEGG pathway enrichment analysis was performed and the top 10 GO terms and top 10 KEGG pathways enriched in upregulated genes are shown in Figure 6. GO annotation results indicated that the upregulated genes were significantly enriched in anterior/posterior pattern specification and extracellular space (Figure 6A). Chord plot further revealed the expression profiles of these GO Terms, which enriched many stem cell-related genes such as the HOX gene family, MMP gene family, and MUC gene family (Figure 6B). Coincidentally, the functional pathways enriched by some of the upregulated genes were stem cell-related pathways, including the extracellular matrix (ECM) receptor interaction pathway and the Wnt signaling pathway (Figure 6C), suggesting a correlation between high HOXA-AS2 expression and the stemness of cancer cells.
 |
Figure 6 Functional annotations of differentially expressed genes in HCC patients with High/Low HOXA-AS2 expression. (A) GO analysis and annotation of upregulated genes. (B) Chordal graph of certain functional enrichment. (C) KEGG pathways analysis of upregulated genes. |
Characterization of Differential Distribution of CSCs Based on the Analysis of Time-of-Flight Mass Cytometry (CyTOF)
The enrichment of HOX, MMP, MUC family genes and aberrant Wnt and ECM signaling have been described as critical players in the initiation and maintenance of HCC, via modulating the stemness of cancer cells and affecting intercellular adhesion.20,21 A total of 30 HCC patients (15 HCC patients with high HOXA-AS2 expression and 15 HCC patients with low HOXA-AS2 expression) and 10,000 living cells per sample were selected and analyzed, and a single-cell mass cytometry experiment was performed for their tumor tissues. The t-SNE maps were the sum of all patients with high and low expression and applied to all cancer stem cells and colored on a scale ranging from blue to red, to indicate increasing expression of stem cell markers. SPADE analysis was further performed to visualize the annotated trees of stem cell markers in the sum of all HCC patients with high and low expression. Based on the above analysis, increased expression of CD326 (EPCAM), CK19, OV6 and decreased expression of P53 were displayed in HCC patients with high HOXA-AS2 expression compared with those with low HOXA-AS2 expression (Figure 7A, and7B). Moreover, the other CSCs markers such as CD133 and CD44 were also evaluated, the expression of CD133 was a little increased trend in high HOXA-AS2 expression group compared with low HOXA-AS2 expression group but no significant difference in the expression of CD44 between high and low HOXA-AS2 expression groups (Figure S3). It should be noted that CD326 (EPCAM), CK19, OV6 are some of the previously reported typical stem cell markers and P53 is one of the best-characterized tumor suppressor proteins in HCC. Accordingly, we hypothesized that the stem cell characteristics in patients with higher HOXA-AS2 expression may highly modulate poor progression and development of HCC.
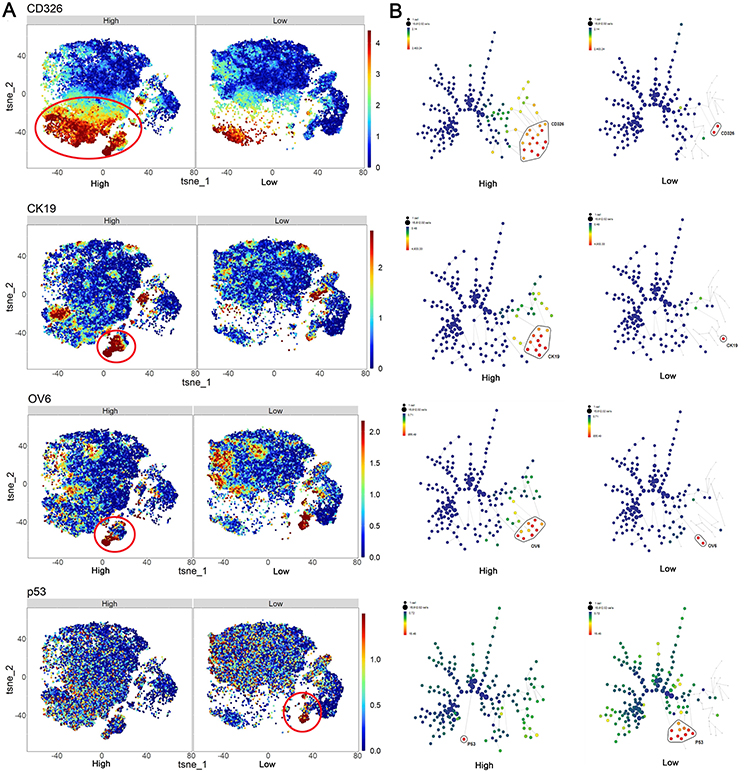 |
Figure 7 SPADE clustering and t-SNE maps analysis of the expression level of CSCs markers. (A) The integrative SPADE clustering plots of CD326 (EpCAM), CK19, OV6, P53 in HCC with high and low HOXA-AS2 expression. The clustering was based on the stem cell panel and manually gated using the online Cytobank software. (B) The integrative t-SNE maps of CD326 (EpCAM), CK19, OV6, P53 in HCC with high and low HOXA-AS2 expression. |
The Landscape of CSCs-Microenvironment and Identification of Specific CSCs-Subpopulations
To further visualize the CSCs phenotypic diversity of HCC patients with high and low HOXA-AS2 expression, the PhenoGraph and t-SNE dimensionality reduction algorithm was adopted and eventually partitioned the high-dimensional single-cell data into different clusters. The expression profile of stem cell markers in each cluster was used to construct the landscape of CSCs-microenvironment in HCC patients with high and low HOXA-AS2 expression (Figure 8A). The expression profile of stem cell markers can reliably assign these clusters into 14 cell clusters (Figure 8B). Interestingly, cluster 7 was first discovered to be significantly increased in the high HOXA-AS2 expression group (P=0.0023, Figure 8C). Differential expression of stem cell markers in this cluster was further explored and to our surprise, some of the canonical liver CSCs markers such as CD326 (EPCAM, P=0.0047), C-MYC (P=0.014) and CK19 (P=0.03) were significantly increased in the high HOXA-AS2 expression group (Figure 8D). These findings provided insights into the possibility of the existence of a specific CSCs-subpopulation in HCC patients with higher HOXA-AS2 expression at the single-cell proteome level.
 |
Figure 8 The landscape of CSCs-microenvironment and analysis of specific cancer stem cell subpopulations in HCC patients with high and low HOXA-AS2 expression. (A) Heatmaps of normalized stem cell markers expression for 14 clusters. The expression level of cancer stem cell markers in each cluster are shown by colors. The cluster ids are labeled as a bar graph in the order of size. (B) t-SNE maps of cancer stem cell clusters distribution. (C) Boxplots and volcano plots displaying the frequencies of the stem cell clusters between high and low HOXA-AS2 expression. (D) The expression of cancer stem cell markers in cluster 7. |
LncRNA HOXA-AS2 are Enriched in CD326+ and CD133+ Cell Populations
To further confirm the role of lncRNA HOXA-AS2 in maintaining stemness phenotype, fluorescence-activated cell sorting (FACS) was first performed to isolate CD326+ and CD133+ cell populations from Huh-7 cell line, which was shown stem cell-related properties and higher HOXA-AS2 expression.22,23 The proportion of CD326+ cells is 44.8% (Figure 9A) and the proportion of CD133+ cells is 26.6% (Figure 9C). Subsequently, the relative expression levels of HOXA-AS2 were detected in CD326+, CD326-, CD133+ and CD133- populations using qPCR experiments, respectively. To our surprise, the expression level of HOXA-AS2 was significantly higher in CD326+ cells compared with CD326- cells (P<0.001, Figure 9B), More importantly, the expression level of HOXA-AS2 was significantly higher in CD133+ cells compared with CD133- cells as well (P<0.01, Figure 9D), These experimental results demonstrated that lncRNA HOXA-AS2 may be enriched in some cancer stem cell populations, further demonstrating the vital association between lncRNA HOXA-AS2 and cancer stem cell properties.
 |
Figure 9 The expression of HOXA-AS2 in CSCs cell populations sorted by FACS. |
Discussion
Increasing research efforts report that the construction of the oncogene-transformed experimental model in vitro is becoming an important measure to observe the occurrence and development of HCC.24 Nevertheless, significant characterization of HCC at the molecular level shows that more than 90% of HCC patients exhibit telomerase reactivation, TP53 oncogenic mutations which affect 12–48% of HCC patients, and over-activation of the RAS pathway representing a dominant oncogenic event in almost every HCC patient.25–27 Consequently, it has been conceived that the transformations of these oncogenes and suppressor genes play a fundamental role in the initiation and progression of HCC. In the present study, THLE2 hTERT+P53−KRAS+ cell line with oncogene-mediated malignant transformation was successfully established, and the abilities of colony formation, cell proliferation, migration and tumorigenesis and the expression levels of stem cell-related markers were found to be significantly increased in THLE2 hTERT+P53−KRAS+ cell line. These results showed that increased stem cell-related features may particularly occur during oncogenic transformation. These changes in molecular biological function are usually accompanied by several transcriptional regulation alterations such as the dysregulation of lncRNAs, which could serve as crucial biomarkers in oncogenesis.
Therefore, the whole transcriptome sequencing (RNA-seq) on THLE2 Wild Type and THLE2 hTRET+P53−KRAS+ cell lines was performed to further investigate changes at transcriptional level, and a significantly up-regulated lncRNA HOXA-AS2 was revealed. LncRNA HOXA Cluster Antisense RNA2 (HOXA-AS2) is an emerging cancer-related lncRNA, located between the human genes of HOXA3 and HOXA4.28 Previous studies have reported that HOXA-AS2 can function as an oncogene in multiple cancer types, including lung cancer, bladder cancer, colorectal cancer, and many others, but rarely in HCC.29 Consistently, the up-regulation of HOXA-AS2 in HCC cell lines and HCC patients was observed as well. More importantly, higher HOXA-AS2 expression level predicted poor prognosis and the expression levels of HOXA-AS2 could serve as an independent prognosis factor for overall survival in HCC patients. However, how HOXA-AS2 expression is implicated in poor progression, survival, and prognosis of HCC remains elusive.
Differentially expressed genes analysis between high and low HOXA-AS2 expression groups was performed to explore the biological functions of HOXA-AS2 in the development and progression of HCC. The differentially upregulated genes were found to be enriched in stem cell-related function and included many stem cell-related genes such as the HOX gene family, MMP gene family, and MUC gene family. Emerging evidences confirm that the abnormal expression of these gene families is involved in the transformation of normal stem cells into cancer stem cells.30,31 Similarly, upregulated genes were enriched in the stem cell-related signaling pathway, including ECM and Wnt pathway. It’s noteworthy that ECM and Wnt are some of the most important signaling pathways for maintaining cancer growth by influencing the behavior of cancer stem cells.32,33 Transcriptome analysis supported the notion that the aberrant expression of HOXA-AS2 expression promotes tumor initiation and accelerates tumor development by regulating the stemness of cancer cells in HCC patients.
Given that the relationship between lncRNA HOXA-AS2 and liver cancer stem cells remains largely unknown, liver cancer stem cells are known to be the most important trigger for the initiation and progression of HCC.34 Therefore, high-dimensional single-cell proteome analysis based on advanced mass cytometry was conducted for the first time in this study, and displayed increased expression of CD326 (EPCAM), CK19, OV6, together with decreased expression of P53 in HCC patients with higher HOXA-AS2 expression. Besides, EPCAM, OV6, and CK19 are subsets of stem cell-related proteins and might acquire more self-renewal ability, tumorigenicity, and invasive characteristics in HCC.35,36 Herein, we further emphasize the fundamental role of higher HOXA-AS2 expression in promoting stem cell-related features based on the perspectives of single-cell proteome analysis.
Since higher HOXA-AS2 expression may enhance stem cell-related features and poor progression in HCC, the existence of specific cancer stem cell subpopulations was of great concern. A specific CSCs-cluster was discovered to be significantly increased in HCC patients with high HOXA-AS2 expression, following the construction of the landscape of CSCs-microenvironment. Most notably, the expression levels of some canonical markers of liver CSCs including EPCAM, C-MYC, and CK19 were also significantly increased in the high HOXA-AS2 expression group. These data suggested that this cluster with EPCAM+, C-MYC+, and CK19+ may be a specific cancer stem cell subpopulation affecting the occurrence and progression of HCC.
To further verify the association between lncRNA HOXA-AS2 and cancer stemness, fluorescence-activated cell sorting (FACS) was performed to isolate CD326+ and CD133+ cell populations and the relative expression levels of HOXA-AS2 were further detected in these cell populations. Intriguingly, the positive stem cell populations were shown the higher HOXA-AS2 expression compared with corresponding negative cell populations, suggesting the enrichment of HOXA-AS2 in stem cell populations. It’s innovatively revealed the potential role of lncRNA HOXA-AS2 in maintaining stem cell-related properties.
Conclusion
In summary, this study provides innovative insights into the oncogenesis of HCC. The expression of HOXA-AS2 was found to be aberrantly expressed, and its higher expression positively was correlated with poor prognosis and stem cell-related functions. Furthermore, the landscape of CSCs-microenvironment in HCC patients with high or low HOXA-AS2 expression was elucidated in this study. The presence of a specific cancer stem cell subpopulation with EPCAM+, C-MYC+, and CK19+ in higher HOXA-AS2 expression HCC patients was first confirmed via high-dimensional single-cell proteome analysis. These innovative findings may present new targets for the diagnosis and treatment of HCC. However, further investigations are required to elucidate the underlying regulatory mechanism of specific cancer stem cell subpopulation in HCC patients with higher HOXA-AS2 expression.
Abbreviations
HCC, Hepatocellular carcinoma; CSCs, cancer stem cells; ECM, extracellular matrix; BCLC, Barcelona Clinical Liver Cancer System; MVI, Microvascular invasion; AFP, alpha-fetoprotein; CK19, Cytokeratin 19; AST, Aspartate transaminase; ALT, Alanine transaminase; OS, overall survival.
Ethics Approval and Informed Consent
This study on animals and human specimens were approved by the Animal Ethics Committee and Human Research Ethics Committee of Guangxi Medical University (Ethical Numbers: 202008001 and 20200137). All animal procedures were conducted in accordance with the National Institutes of Health Guide for the Care and Use of Laboratory animals. All patients provided informed consent for the use of their tissues.
Acknowledgments
This work was supported by Guangxi Natural Science Fund for Innovation Research Team (2016GXNSFGA380006), Guangxi science and technology development project (AD17195090, AB18126055), National Natural Science Foundation of China (31471271, 31560311). Funding agencies had no role in study design, data collection and analysis, publication, or preparation of the manuscript. The mass cytometry experiment was supported by Core Facility of Biomedical, Xiamen University.
Author Contributions
All authors made significant contributions to study conception and design, acquisition of data, or analysis and interpretation of data; took part in drafting the article or revising it critically for important intellectual content; gave final approval of the version to be published; and agreed to be accountable for all aspects of the work.
Disclosure
The authors have declared that they have no conflicts of interest in this work.
References
1. Raoul J-L, Forner A, Bolondi L, Cheung TT, Kloeckner R, de Baere T. Updated use of TACE for hepatocellular carcinoma treatment: how and when to use it based on clinical evidence. Cancer Treat Rev. 2019;72:28–36. doi:10.1016/j.ctrv.2018.11.002
2. Fu J, Wang H. Precision diagnosis and treatment of liver cancer in China. Cancer Lett. 2018;412:283–288. doi:10.1016/j.canlet.2017.10.008
3. Kulik L, El-Serag HB. Epidemiology and Management of Hepatocellular Carcinoma. Gastroenterology. 2019;156(2):477–491.e471.
4. Couri T, Pillai A. Goals and targets for personalized therapy for HCC. Hepatol Int. 2019;13(2):125–137.
5. Guachalla LM, Rudolph KL. The GAPs between hepatocellular carcinoma and RAS. J Hepatol. 2011;54(2):191–192.
6. Flavahan WA, Gaskell E, Bernstein BE. Epigenetic plasticity and the hallmarks of cancer. Science. 2017;357:6348.
7. Vicente-Dueñas C, Hauer J, Cobaleda C, Borkhardt A, Sánchez-García I. Epigenetic Priming in Cancer Initiation. Trends Cancer. 2018;4(6):408–417.
8. Kopp F, Mendell JT. Functional Classification and Experimental Dissection of Long Noncoding RNAs. Cell. 2018;172(3):393–407.
9. Bhan A, Soleimani M, Mandal SS. Long Noncoding RNA and Cancer: A New Paradigm. Cancer Res. 2017;77(15):3965–3981.
10. Suvà ML, Riggi N, Bernstein BE. Epigenetic reprogramming in cancer. Science. 2013;339(6127):1567–1570. doi:10.1126/science.1230184
11. Friedmann‐Morvinski D, Verma IM. Dedifferentiation and reprogramming: origins of cancer stem cells. EMBO Reports. 2014;15(3):244–253. doi:10.1002/embr.201338254
12. Zhu P, Fan Z. Cancer stem cells and tumorigenesis. Biophysics Reports. 2018;4(4):178–188. doi:10.1007/s41048-018-0062-2
13. Huo X, Han S, Wu G, et al. Dysregulated long noncoding RNAs (lncRNAs) in hepatocellular carcinoma: implications for tumorigenesis, disease progression, and liver cancer stem cells. Mol Cancer. 2017;16(1):165. doi:10.1186/s12943-017-0734-4
14. Zhao H, Shi J, Zhang Y, et al. LncTarD: a manually-curated database of experimentally-supported functional lncRNA-target regulations in human diseases. Nucleic Acids Res. 2020;48(D1):D118–D126.
15. Li Z, Hu J, Qin Z, et al. High-dimensional single-cell proteomics analysis reveals the landscape of immune cells and stem-like cells in renal tumors. J Clin Lab Anal. 2020;34(5):e23155. doi:10.1002/jcla.23155
16. Levine JH, Simonds EF, Bendall SC, et al. Data-Driven Phenotypic Dissection of AML Reveals Progenitor-like Cells that Correlate with Prognosis. Cell. 2015;162(1):184–197. doi:10.1016/j.cell.2015.05.047
17. Belkina AC, Ciccolella CO, Anno R, Halpert R, Spidlen J, Snyder-Cappione JE. Automated optimized parameters for T-distributed stochastic neighbor embedding improve visualization and analysis of large datasets. Nat Commun. 2019;10(1):5415.
18. Qiu P, Simonds EF, Bendall SC, et al. Extracting a cellular hierarchy from high-dimensional cytometry data with SPADE. Nat Biotechnol. 2011;29(10):886–891. doi:10.1038/nbt.1991
19. Sasai K, Sukezane T, Yanagita E, et al. Oncogene-Mediated Human Lung Epithelial Cell Transformation Produces Adenocarcinoma Phenotypes In Vivo. Cancer Res. 2011;71(7):2541–2549. doi:10.1158/0008-5472.CAN-10-2221
20. Duchartre Y, Kim YM, Kahn M. The Wnt signaling pathway in cancer. Crit Rev Oncol Hematol. 2016;99:141–149.
21. Ragelle H, Naba A, Larson BL, et al. Comprehensive proteomic characterization of stem cell-derived extracellular matrices. Biomaterials. 2017;128:147–159.
22. Park DJ, Sung PS, Kim JH, et al. EpCAM-high liver cancer stem cells resist natural killer cell-mediated cytotoxicity by upregulating CEACAM1. J Immunother Cancer. 2020;8:1.
23. Yao J, Zhang T, Ren J, Yu M, Wu G. Effect of CD133/prominin-1 antisense oligodeoxynucleotide on in vitro growth characteristics of Huh-7 human hepatocarcinoma cells and U251 human glioma cells. Oncol Rep. 2009;22(4):781–787.
24. Pez F, Gifu P, Degli-Esposti D, et al. In vitro transformation of primary human hepatocytes: epigenetic changes and stemness properties. Exp Cell Res. 2019;384(2):111643.
25. Nault JC, Ningarhari M, Rebouissou S, Zucman-Rossi J. The role of telomeres and telomerase in cirrhosis and liver cancer. Nat Rev Gastroenterol Hepatol. 2019;16(9):544–558.
26. Lorbeer FK, Hockemeyer D. TERT promoter mutations and telomeres during tumorigenesis. Curr Opin Genet Dev. 2020;60:56–62.
27. Calvisi DF. Accomplices in crime: the diabolical liaison between protein tyrosine phosphatase 1B and ras in hepatocellular carcinoma. Hepatology. 2016;63(5):1418–1420.
28. Zhang Y, Xu J, Zhang S, et al. HOXA-AS2 Promotes Proliferation and Induces Epithelial-Mesenchymal Transition via the miR-520c-3p/GPC3 Axis in Hepatocellular Carcinoma. Cell Physiol Biochem. 2018;50(6):2124–2138.
29. Wang J, Su Z, Lu S, et al. LncRNA HOXA-AS2 and its molecular mechanisms in human cancer. Clin Chim Acta. 2018;485:229–233.
30. Smith J, Zyoud A, Allegrucci CA. Case of Identity: HOX Genes in Normal and Cancer Stem Cells. Cancers. 2019;11:4.
31. Long H, Xie R, Xiang T, et al. Autocrine CCL5 signaling promotes invasion and migration of CD133+ ovarian cancer stem-like cells via NF-κB-mediated MMP-9 upregulation. Stem Cells. 2012;30(10):2309–2319.
32. Brown Y, Hua S, Tanwar PS. Extracellular matrix-mediated regulation of cancer stem cells and chemoresistance. Int J Biochem Cell Biol. 2019;109:90–104.
33. Zhan T, Rindtorff N, Boutros M. Wnt signaling in cancer. Oncogene. 2017;36(11):1461–1473.
34. Liu YC, Yeh CT, Lin KH. Cancer Stem Cell Functions in Hepatocellular Carcinoma and Comprehensive Therapeutic Strategies. Cells. 2020;9:6.
35. Yang W, Wang C, Lin Y, et al. OV6(+) tumor-initiating cells contribute to tumor progression and invasion in human hepatocellular carcinoma. J Hepatol. 2012;57(3):613–620.
36. Kim H, Choi GH, Na DC, et al. Human hepatocellular carcinomas with “Stemness”-related marker expression: keratin 19 expression and a poor prognosis. Hepatology. 2011;54(5):1707–1717.
 © 2020 The Author(s). This work is published and licensed by Dove Medical Press Limited. The
full terms of this license are available at https://www.dovepress.com/terms
and incorporate the Creative Commons Attribution
- Non Commercial (unported, 3.0) License.
By accessing the work you hereby accept the Terms. Non-commercial uses of the work are permitted
without any further permission from Dove Medical Press Limited, provided the work is properly
attributed. For permission for commercial use of this work, please see paragraphs 4.2 and 5 of our Terms.
© 2020 The Author(s). This work is published and licensed by Dove Medical Press Limited. The
full terms of this license are available at https://www.dovepress.com/terms
and incorporate the Creative Commons Attribution
- Non Commercial (unported, 3.0) License.
By accessing the work you hereby accept the Terms. Non-commercial uses of the work are permitted
without any further permission from Dove Medical Press Limited, provided the work is properly
attributed. For permission for commercial use of this work, please see paragraphs 4.2 and 5 of our Terms.