Back to Journals » ImmunoTargets and Therapy » Volume 14
Integrated Profiling Delineated KIF18A as a Significant Biomarker Associated with Both Prognostic Outcomes and Immune Response in Pancreatic Cancer
Authors Nan K, Zhang L, Zou Y, Geng Z, Huang J, Peng Y, Yin S, Zhang M
Received 4 October 2024
Accepted for publication 8 February 2025
Published 28 February 2025 Volume 2025:14 Pages 123—138
DOI https://doi.org/10.2147/ITT.S497284
Checked for plagiarism Yes
Review by Single anonymous peer review
Peer reviewer comments 3
Editor who approved publication: Dr Flavio Salazar-Onfray
Kai Nan,1,* Lei Zhang,2,* Yujia Zou,3 Zilong Geng,3 Jing Huang,4 Yulong Peng,4 Su Yin,4 Ming Zhang5
1Department of Joint Surgery, Honghui Hospital, Xi’an Jiaotong University, Xi’an, Shaanxi, 710054, People’s Republic of China; 2Department of Pharmacy, Shaanxi Provincial Hospital of Chinese Medicine, Xi’an, Shaanxi, 710003, People’s Republic of China; 3Department of Orthopaedics, The second Affiliated Hospital of Xi’an Jiaotong University, Xi’an, Shaanxi, 710000, People’s Republic of China; 4Department of Rehabilitative Medicine, Affiliated Hospital of Shaanxi University of Chinese Medicine, Xianyang, Shaanxi, 712046, People’s Republic of China; 5Department of General Practice, Honghui Hospital, Xi’an Jiaotong University, Xi’an, Shaanxi, 710054, People’s Republic of China
*These authors contributed equally to this work
Correspondence: Ming Zhang, Department of General Practice, Honghui Hospital, Xi’an Jiaotong University, Xi’an, Shaanxi, 710054, People’s Republic of China, Email [email protected]
Purpose: Kinesin family member 18A (KIF18A) is a member of the kinesin-8 family of motor proteins, involved in the progression and metastasis of various tumors. However, its role in pancreatic adenocarcinoma (PAAD) remains unclear.
Methods: To evaluate that role, RNA sequencing datasets, complemented by pertinent clinical metadata, were procured from the Cancer Genome Atlas (TCGA) and the Gene Expression Omnibus (GEO) repositories. The protein expression level of KIF18A in PAAD was derived from human protein atlas (HPA) database. The differences in KIF18A expression levels and prognostic related genes were identified through multivariate Cox regression and Lasso regression analysis to construct a prognostic risk model. The Tumor Mutation Burden (TMB), Microsatellite (MSI), immune landscape, mutation landscape and drug sensitivity of high- and low-expression KIF18A groups were assessed in immunotherapy cohorts and KIF18A expression cohorts. Finally, in vitro experiments were conducted to elucidate the molecular function of KIF18A in regulating the malignant behavior of PAAD.
Results: KIF18A is highly expressed in PAAD and is closely related to worse clinical stage and poor prognosis. Single cell analysis revealed that KIF18A is mainly expressed in microtubules of tumor cells and participated in mitosis and cell cycle of PAAD. Further analysis revealed that the expression of KIF18A is closely related to TMB, MSI, and immune cell infiltration. In vitro experiments confirmed that KIF18A promotes the proliferation, migration and expression of adhesion molecules in PAAD, and inhibits angiogenesis. In addition, the high expression of KIF18A is positively related to ferroptosis and m6A genes expression, and its high expression is driven by mutated KRAS and TP53.
Conclusion: This study confirmed that KIF18A can be used as a marker to predict the prognosis and immunotherapy of PAAD, and it participates in the formation of microtubules in PAAD cells and promotes the malignant behavior of PAAD.
Keywords: pancreatic cancer, KIF18A, tumor microenvironment, prognosis, immunotherapy
Introduction
Pancreatic cancer, classified as a malignant neoplasm within the digestive tract, is marked by a notably low 5-year survival rate, which is less than 13%.1 Pancreatic cancer encompasses a spectrum of pathological subtypes, such as pancreatic adenocarcinoma (PAAD), acinar cell carcinoma, and small gland carcinoma. Notably, PAAD is the predominant form, constituting approximately 80–90% of pancreatic malignancies.2 Although there are many treatments including surgery, the survival rate of PAAD is still not ideal due to the high recurrence rate and low drug remission rate.3 Therefore, the exploration of PAAD related-markers and the search for drug- and immunotherapy-related targets are particularly critical for the treatment of PAAD.
KIF18A is a constituent of the kinesin-8 motor protein family, characterized by its capacity to transport along microtubules towards the plus-end, utilizing the energy derived from ATP hydrolysis.4,5 KIF18A can regulate spindle microtubule dynamics and chromosome amplitude, playing a crucial role in the timely completion of chromosome alignment during mitosis, maintaining genome stability, and successfully completing mitosis.6 Recently, some reports have implied that KIF18A increases the malignant behavior of colorectal cancer and hepatocellular carcinoma cells.7,8 Furthermore, KIF18A was identified as therapeutic target for chromosomally unstable tumor cells,4,9 while its role and mechanism in PAAD are still unclear.
In this research, we executed a comprehensive multi-omics analysis to delineate the expression patterns of KIF18A and to evaluate its prognostic significance, as well as its potential as a biomarker for immunotherapeutic response and chemoresistance in PAAD.
Methods
Mining From TCGA and GEO Databases
The original gene expression profiles and accompanying clinical data were sourced from TCGA and GEO databases, accessible via the National Center for Biotechnology Information (NCBI) repository. Seven databases from GEO (GSE78229, GSE62452, GSE79668, GSE57495, GSE28735, GSE21501 and GSE71729) and E-MTAB-6134 on PAAD were downloaded for data analysis. Single cell sequencing analysis (scRNA-seq) was performed on GSE154778. For scRNA-seq, Download the corresponding single-cell data in.h5 format and annotation results from TISCH. Use the R software MAESTRO and Seurat to process and analyze the single-cell data. Re-cluster the cells using the t-SNE method. Our study incorporated data from TCGA and the Genotype-Tissue Expression (GTEx) project, encompassing a total of 178 tumor samples and 171 normal control samples. The inclusion criteria for the data were stringent, requiring the availability of gene expression profiles, survival data. Patients with missing survival information were excluded. Our analysis encompassed an in-depth examination of gene expression patterns, survival outcomes, and pertinent clinical characteristics. The protein expression of KIF18A in pancreatic cancer and normal pancreatic tissues through immunohistochemistry was obtained from HPA database.
Immune and Drug Sensitivity Analysis Based on TCGA
TMB and MSI have been recognized as significant biomarkers that can affect the prognosis of various cancers and the efficacy of immunotherapy treatments.10 Correlation analysis between KIF18A expression and TMB/MSI was performed using the spearman method. In addition, we selected two cohorts of PAAD patients who received ICI therapy with different KIF18A expression to further predict the response to immunotherapy. The potential response to ICI therapy has been prognosticated using the Tumor Immune Dysfunction and Exclusion (TIDE) algorithm, providing a valuable tool for predicting treatment outcomes.11 We subsequently contrasted the clinical outcomes and responses to therapy between subgroups characterized by high and low KIF18A expression levels. The dataset for these cohorts, which were part of an immunotherapy study, was sourced from the comprehensive repository available at http://research-pub.gene.com/IMvigor210CoreBiologies/packageVersions/.12 In our conclusive analysis, we investigated the relationship between KIF18A expression levels and drug sensitivity by leveraging data from the Genomics of Drug Sensitivity in Cancer (GDSC) database, as accessed through the Gene Set Correlation Analysis (GSCA) platform at http://bioinfo.life.hust.edu.cn/GSCA/#/drug to pinpoint potential therapeutic agents that could specifically target KIF18A.13
Differentially Expressed Genes Analysis
The gene expression profile data from the TCGA-PAAD cohorts were subjected to preprocessing utilizing R software. Differential expression analysis of KIF18A, distinguishing high from low expression groups, was conducted employing the “limma” R package. Genes exhibiting a |log2FoldChange| >1 and P adj < 0.05 were considered as statistically significant. Subsequently, Gene Ontology (GO) and Kyoto Encyclopedia of Genes and Genomes (KEGG) pathway enrichment analyses for the differentially expressed genes (DEGs) were executed with the “clusterProfiler” R package. The GO analysis spanned across three domains: biological processes (BP), molecular functions (MF), and cellular components (CC). To correct for multiple testing, the p-values were adjusted using the Benjamini-Hochberg (BH) method, also known as the False Discovery Rate (FDR) approach. Outcomes with an FDR threshold of less than 0.05 were deemed statistically significant.
Construction of Prognostic Model for PAAD Patients
In our analysis, we employed the Least Absolute Shrinkage and Selection Operator (LASSO) regression algorithm for feature selection, utilizing the R package glmnet. To ensure the robustness of our model, we implemented 10-fold cross-validation. For the construction of a prognostic model, we applied multivariate Cox regression analysis through the R package survival. Initially, we conducted a multi-factor Cox regression analysis. Subsequently, the stepwise function was employed to refine the model through iterative processes. The optimal model, identified through this refinement, was selected as the definitive model for our study. R package “glmnet” was used to construct the model. And risk score was calculated by the following formula:

Median risk score was used to divide patients into low-risk and high-risk groups. To visualize the survival outcomes, we generated Kaplan-Meier curves and calculated p-values and hazard ratios (HR) with their corresponding 95% confidence intervals (CI). These were derived from Log rank tests and univariate Cox proportional hazards regression analyses.
Validation of KIF18A Expression, Proliferation and Migration of PAAD Cells
For our cellular experiments, we sourced normal human pancreatic ductal epithelial cells, hTERT-HPNE, and three distinct PAAD cell lines, CFPAC-1, PANC-1, and AsPC-1, from ATCC. Culturing was performed in DMEM for PANC-1, IMDM for CFPAC-1 and RPMI-1640 for AsPC-1 within a CO2 incubator to maintain optimal conditions. Total RNA from these cells was extracted using the Fastgen 200 RNA Isolation Kit and subsequently reverse transcribed into cDNA with the Prime Script RT Reagent Kit. Quantitative real-time PCR (RT-qPCR) was conducted using the CFX Manager 2.1 system. Primer sequences are detailed in Table S1. For assessing cell proliferation, 1×10⁴ cells were plated in each well of a 24-well plate and cultured to approximately 75% confluence. The BeyoClick™ EdU Cell Proliferation Kit from Beyotime (Shanghai) was utilized to measure proliferative activity following the manufacturer’s protocol. Briefly, the EdU working solution was added to the cells for further incubation for 3 hours after treatment for 24 hours. They were then fixed and processed following the manufacturer’s instructions. Images were taken for three different fields per well using a fluorescence microscope. The results were analyzed using the ImageJ software to determine the cell proliferation rate. Fluorescence microscopy captured images of nuclei with blue fluorescence and EdU-positive cells with red fluorescence, with subsequent analysis conducted using ImageJ software. In migration assays, 400 μL of serum-free medium were added to the upper chamber and 700 μL of medium containing 20% FBS to the lower chamber of a transwell apparatus. Subsequently, 4×10⁴ siRNA-transfected cells were seeded into the upper chamber. After a 24-hour incubation, cells in the upper chamber were removed with a microcellular scraper. The lower surface of the upper chamber was fixed with 4% ice-cold paraformaldehyde for 15 minutes and stained with 0.1% crystal violet for 10 minutes. The chambers were then thoroughly washed, dried, and photographed under a microscope. ImageJ software was employed to quantify the migrated cells.
Angiogenesis Experiment and Western Blotting
For our angiogenesis assay, we utilized Growth Factor Reduced Matrigel, devoid of phenol red and with a concentration of 8.9 mg/mL from Becton, which was precooled at 4°C alongside 48-well plates and pipette tips. We uniformly dispensed 100 µL of the precooled Matrigel into each well and allowed it to solidify at 37°C for 30 minutes. Human Umbilical Vein Endothelial Cells (HUVECs) were resuspended in pre-collected, serum-free culture supernatants. We then added 100 µL of this cell suspension, containing 2×10⁴ HUVECs, to each well. The HUVECs were cultured in a 5% CO2 incubator at 37°C for 4 hours. Subsequently, tube formation by HUVECs was observed using an inverted microscope, and images were captured for further analysis. The quantification of mesh networks was performed using ImageJ software. For the preparation of cell protein, we mixed High-Efficiency Radioimmunoprecipitation Assay (RIPA) buffer with phenylmethanesulfonyl fluoride in a 100:1 ratio. The extraction of cellular proteins began with the collection of cells and washing them twice with PBS. We added 1 mL of this solution to cell lysate, homogenized the mixture, and allowed it to rest on ice for 10 minutes. The cell lysate was then centrifuged at 4°C and 15000 rpm for 10 minutes. The supernatant was carefully collected after discarding the pellet, and 5×loading buffer was added. The concentration of the proteins was determined and the samples were mixed with Loading Buffer and denatured by boiling. The extraction of cellular proteins began with the collection of cells and washing them twice with PBS. The subsequent steps mirrored those used for tissue protein extraction. The procedure for Western blotting followed protocols outlined in previous studies.14 Briefly, proteins were separated using SDS-PAGE gel electrophoresis. They were then transferred onto a membrane, blocked, and incubated overnight at 4°C with specific primary antibodies. The membrane was incubated with secondary antibodies for 1 hour at room temperature. Finally, the protein blots were examined using the Enhanced Chemiluminescence (ECL) reagent, and the resulting gel image was visualized and captured with the gel imaging system.
Statistical Analyses
Statistical analysis and graphical representation of the data from the two groups were conducted using GraphPad Prism software, version 8.0, and Sangerbox tools. To assess the normality of data distribution, we employed the Kolmogorov–Smirnov test. The homogeneity of variance was evaluated using the Levene test. For data that were normally distributed, we applied independent samples t-tests. In contrast, data exhibiting a non-Gaussian distribution were analyzed using the non-parametric Mann–Whitney U-test. To measure the strength and direction of association between variables, we performed correlation analysis using Spearman’s rank correlation method. Statistical significance was determined using two-tailed P-values, with a threshold of P < 0.05 considered as statistically significant.
Results
High Expression of KIF18A in Microtubules of PAAD Cells
The overall study design is illustrated in Figure 1. Tumor grade refers to classifying tumors into different grades according to the morphological and cytological characteristics of tumor tissues under the microscope, so as to evaluate their malignancy and prognosis. G1 is well differentiated and low-grade malignant; G2 is moderately differentiated and moderately malignant; G3 is poorly differentiated and highly malignant; G4 is undifferentiated and highly malignant. We first investigated the expression of KIF18A in different grade stages. The results confirmed that compared to normal pancreatic tissue, the expression of KIF18A was significantly enhanced in tumors (Figure 2A). Furthermore, the expression of KIF18A was significantly higher in G3 and G4 phases than in G1 and G2 phases (Figure 2A). To further explore the relationship between KIF18A and the malignant progression of PAAD, we explored the protein location of KIF18A in cells based on HPA database. The results confirmed that KIF18A was significantly upregulated in microtubules and cytoskeleton bridges in A-431 cells, suggesting its potential involvement in cytoskeleton formation and its impact on cell morphology (Figure 2B). To further explore the expression of KIF18A in PAAD tissue samples, we explored this in HPA database. The results showed that KIF18A had a higher positive rate in PAAD than in normal pancreatic tissue, and it was mainly distributed in the cytoplasm (Figure 2C). Subsequently, we further confirmed the expression of KIF18A in cells. Consistent with previous results, the study found that KIF18A is highly expressed in microtubules of A-431 cells (Figure 2D). Next, we explored which cell type in the tumor tissue has the highest expression level of KIF18A from the single-cell dimension. The research results confirmed that KIF18A has the highest expression level in tumor cells compared to other cell types in the tumor microenvironment (Figure 2E).
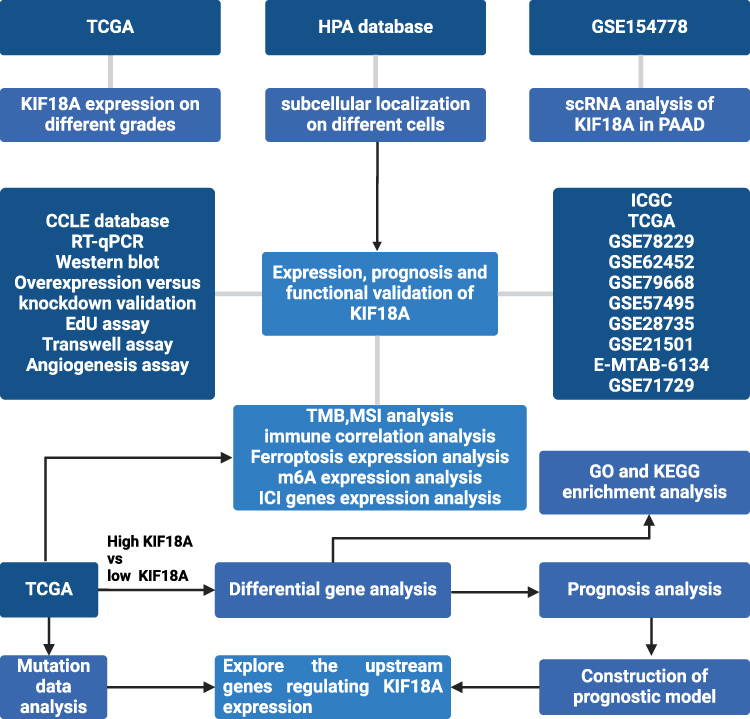 |
Figure 1 The flowchart of the study. |
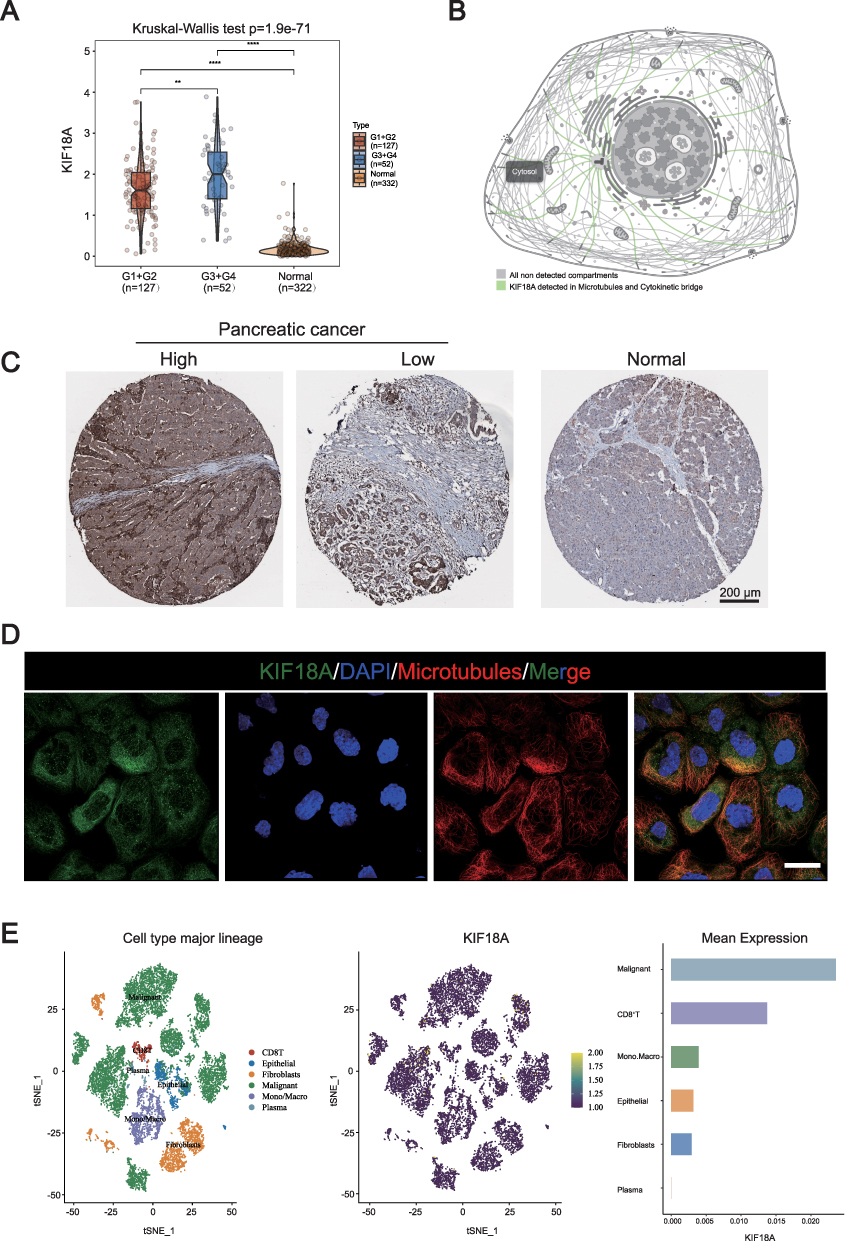 |
Figure 2 The mRNA and protein expression of KIF18A in PAAD tissue. (A) The KIF18A expression in different PAAD grade by TCGA database. (B) The KIF18A protein location in cells based on HPA database. (C) Immunohistochemical results of KIF18A in PAAD. (D) Immunofluorescence results of KIF18A in cells (Scale bar: 30 μm). (E) The expression of KIF18A in PAAD based on the single cell dimension in GSE154778 (16 PAAD samples including 10 primary tumor samples and 6 metastatic lesion samples). **p < 0.01, ****p < 0.0001. |
KIF18A Is Positively Correlated with Poor Prognosis, TMB and MSI of PAAD
Next, we investigated the relationship between KIF18A expression and prognosis in various databases. The research results showed that KIF18A is significantly associated with poor prognosis in ICGC, TCGA, GSE78229, GSE62452 and E_MTAB_6134 (Figure 3A). To further explore the relationship between the expression of KIF18A and immunotherapy in PAAD, we studied the relationship between KIF18A expression and TMB, as well as between KIF18A expression and MSI. The results showed that KIF18A was highly positively correlated with TMB (correlation coefficient =3.22e-01; p-value=3.14e-05), and KIF18A could be used as a marker to predict the immunotherapy of PAAD (Figure 3B and C). Furthermore, we explored the expression of KIF18A in PAAD cell lines based on Cancer Cell Line Encyclopedia (CCLE) database. The research results confirmed that KIF18A is significantly overexpressed in two cell lines PA-TU-8988T and PA-TU-8902 (Figure 3D). We also detected the single-cell expression of KIF18A in normal pancreatic tissue, and the results confirmed that KIF18A was significantly overexpressed in macrophages, while it was almost not expressed in endothelial cells (Figure 3E). Subsequently, qPCR and Western blotting were used to explore the mRNA and protein expression of KIF18A. The results showed that compared with the pancreatic ductal epithelial cell line HPNE, the mRNA expression of KIF18A was significantly higher in CFPAC-1 and ASPC-1 cells (Figure 3F), which was consistent with the protein expression of KIF18A (Figure 3G).
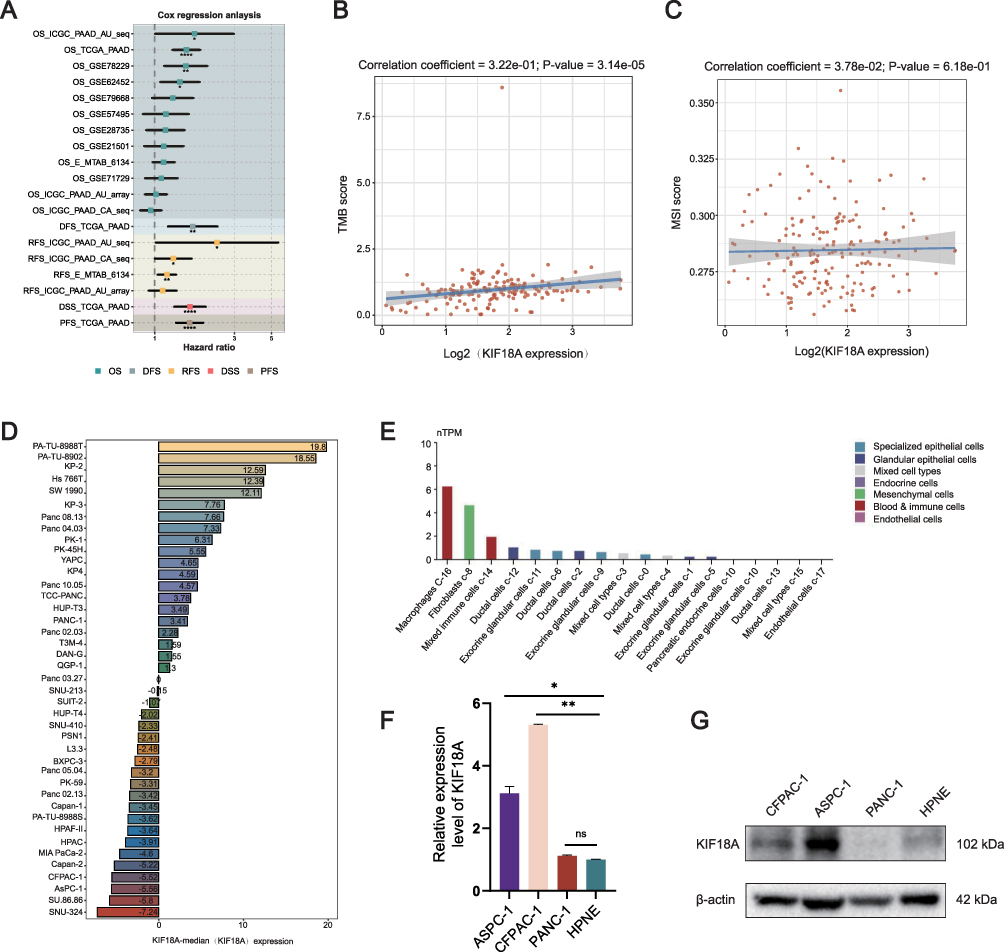 |
Figure 3 The prognosis of KIF18A and its correlation with TMB and MSI. (A) Prognostic analysis of KIF18A in multiple databases. (B and C) The correlation between KIF18A expression and TMB, MSI score. (D) The mRNA expression of KIF18A in PAAD based on CCLE database. (E) The expression of KIF18A in normal pancreatic tissue. (F) The mRNA expression of KIF18A in PAAD cells. (G) The protein expression of KIF18A in PAAD cells. *p < 0.05, **p < 0.01, ****p < 0.0001. |
KIF18A Promotes the Proliferation and Migration of PAAD Cells and Inhibits Their Angiogenesis
To further explore the effect of KIF18A on the malignant behavior of PAAD cells. We validated the overexpression and knockdown efficiency of KIF18A in CFPAC-1 cells. The results confirmed that compared to the vector group, the overexpression efficiency of KIF18A was 10 times higher than that of the control group. Among the knockdown sequences, the knockdown sequence of sequence 1 is the most significant, with a knockdown efficiency of 60% (Figure 4A and B). Therefore, subsequent research selected sequence 1 as the main knockdown sequence. The EdU experiment confirmed that overexpression of KIF18A significantly increased the proportion of EdU positive cells, indicating that KIF18A facilitates proliferation (Figure 4C). Migration experiments confirmed that after overexpression of KIF18A, the number of PAAD cells in the lower compartment of chamber was significantly increased (p=0.0002), while after knockdown of KIF18A, the number of cells penetrating the lower compartment significantly decreased (p=0.0007) (Figure 4D). Next, we explored the relationship between the expression of KIF18A in PAAD and angiogenesis. The results confirmed a significant negative correlation between KIF18A and the angiogenesis pathway (correlation coefficient=−2.45e-01, p=9.54e-04). The angiogenesis experiment also confirmed that the number of tubes was significantly reduced after intervention of HUVEC with conditioned medium overexpressing KIF18A (Figure 4E). Subsequently, we further investigated the correlation between KIF18A and the expression of adhesion molecule ICAM1. The results showed a significant positive correlation between the mRNA expression of KIF18A and ICAM1 (R=0.16, p=0.037), indicating that KIF18A enhanced the adhesion of PAAD cells, thereby promoting their malignant behavior. Western blotting experiment further confirmed this result (Figure 4F).
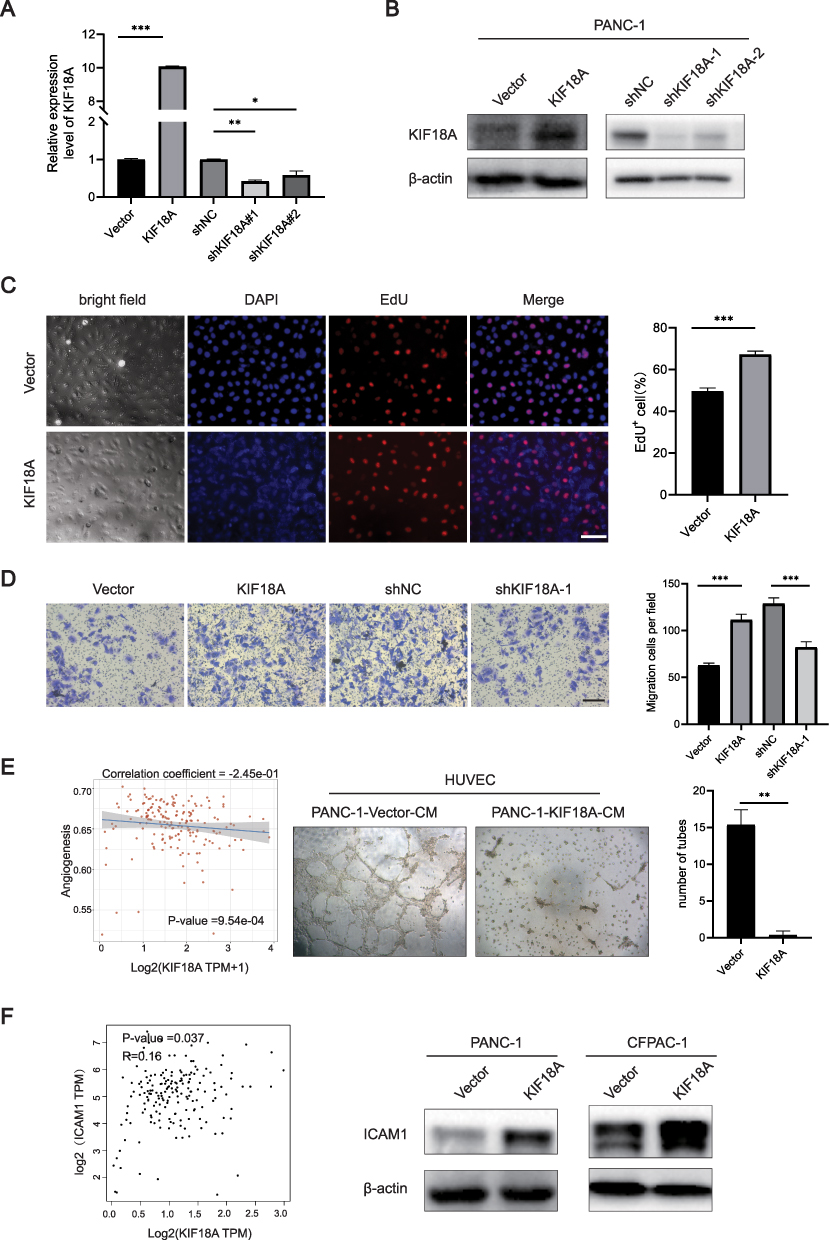 |
Figure 4 KIF18A promotes the proliferation and migration of PAAD and inhibits angiogenesis. (A and B) Validation of knockdown and overexpression efficiency of KIF18A. (C) EdU proliferation experiment after overexpression of KIF18A (Scale bar: 50 μm). (D) Migration experiments after overexpression and knockdown of KIF18A (Scale bar = 100 μm). (E) The correlation between KIF18A and angiogenesis. (F) The correlation between KIF18A and ICAM1. *p < 0.05, **p < 0.01, ***p < 0.001. |
High Expression of KIF18A was Positively Correlated with Immune Checkpoint, m6A and Ferroptosis Genes
We then investigated the correlation between TIDE, mRNAsi score and expression of KIF18A. Results showed that patients with high expression of KIF18A had higher TIDE score and mRNAsi score (Figure 5A and B). Furthermore, high expression of KIF18A positively correlated with lower EPIC score in B cells, NK cells, and endothelial cells (Figure 5C), which was consistent with previous results (Figure 4E). Subsequently, we found that the group with high expression of KIF18A had higher expression of CD274 and siglec15 (Figure 5D). A nomogram incorporating KIF18A expression and clinical characteristics of PAAD patients is shown in Figure 5E. All these results indicated that KIF18A may act as an immune biomarker that could potentially be used to guide individualized treatment. Finally, expression of m6A and ferroptosis genes in the groups expressing high and low KIF18A was investigated, and the patients with high expression of KIF18A. And we found that high expression of KIF18A patients had higher m6A and ferroptosis gene expression (Figure 5F and G), which indicated that KIF18A promotes PAAD progression by the m6A and ferroptosis pathway.
 |
Figure 5 Immunotherapy response and expression of m6A, ferroptosis genes of KIF18A high and low expression groups. (A and B) TIED and mRNAsi score between high and low KIF18A expression. (C) EPIC score between high and low KIF18A expression in PAAD. (D) Immune checkpoint genes expression between high and low KIF18A expression group patients. (E), Nomogram incorporating KIF18A expression and PAAD clinical characteristics. (F and G) m6A and ferroptosis genes expression between high and low KIF18A expression. *p < 0.05, **p < 0.01, ***p < 0.001, ns p > 0.05. |
The High Expression KIF18A Is Closely Related to Cell Mitosis and Cell Cycle
Previous studies have confirmed that KIF18A can serve as a predictive indicator for prognosis and immunotherapy.15 Next, we divided PAAD patients into two groups according to the expression of KIF18A, and explored the signal pathway involving KIF18A by analyzing the differential gene expression patterns of the two groups. A total of 237 differentially expressed genes were screened (log2FC > 1, P < 0.05), including 183 upregulated genes and 54 downregulated genes (Figure 6A and B). GO enrichment analysis showed that the upregulated genes were mainly enriched in the mitotic pathway, microtubule binding and condensed chromosome. KEGG enrichment analysis showed that the upregulated genes were mainly enriched in cell cycle, p53 signaling pathway and oocyte meiosis (Figure 6C).
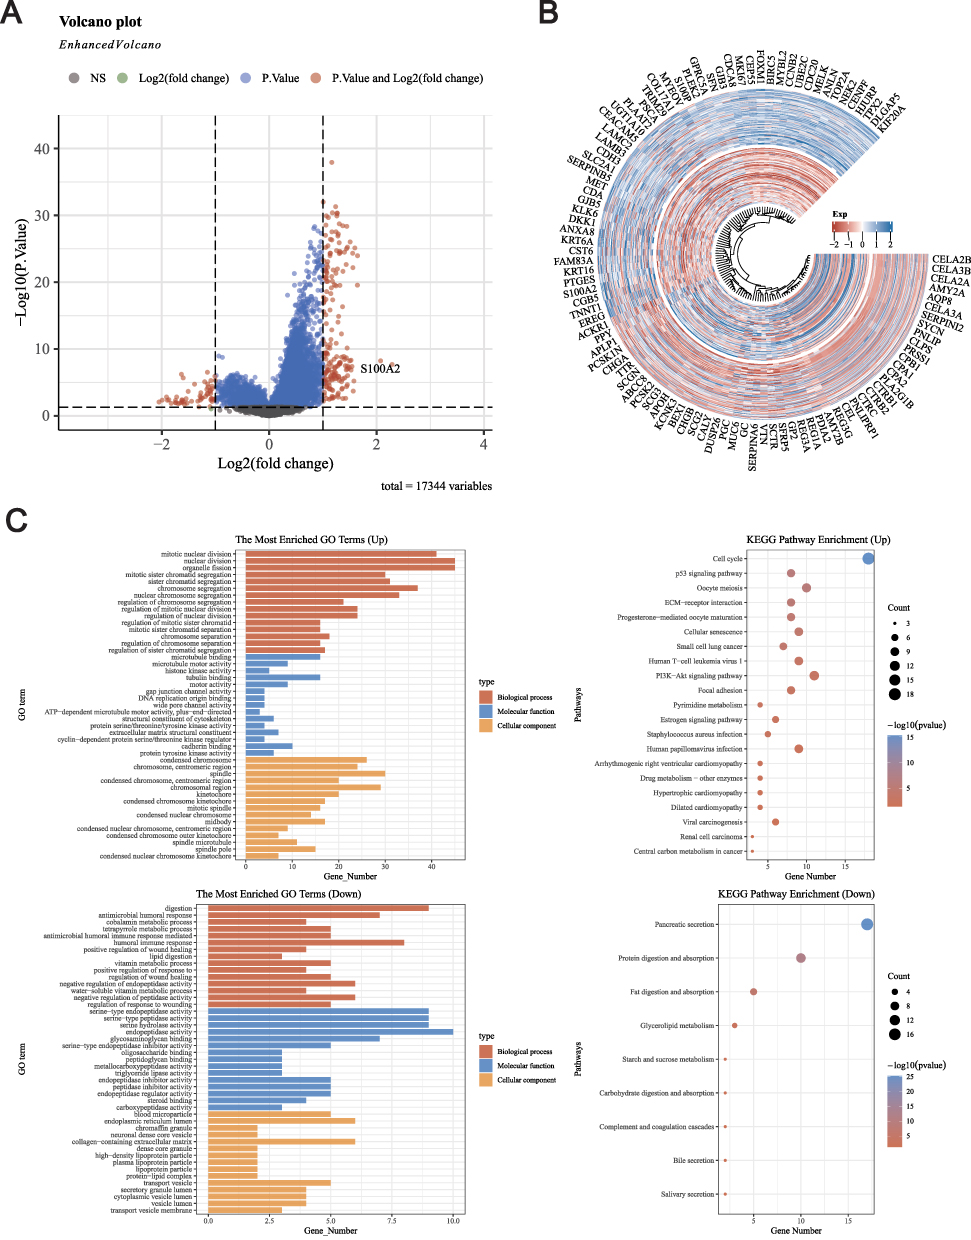 |
Figure 6 Differential analysis and GO/KEGG analysis based on high and low expression of KIF18A. (A) Volcanic map of DEGs between high and low expression groups of KIF18A. (B) Heatmap of DEGs between high and low expression groups of KIF18A. (C) GO and KEGG enrichment analysis based DEGs of high and low expression groups of KIF18A groups. |
Construction of a Prognostic Model for PAAD
Subsequently, we undertook a prognostic analysis of the differentially expressed genes (DEGs) between the high and low expression groups of KIF18A. Our findings indicate that 157 DEGs are associated with prognosis and have been incorporated into the prognostic model. To identify valuable prognostic genes more comprehensively, we have included genes that overlap in at least two algorithms for further analysis. The model fit across different lambda values and coefficient plot were shown in 7A and 7B, respectively. Upon conducting univariate Cox analysis, we discovered that 7 out of the 15 genes significantly impact prognosis (Figure 7C). We then proceeded with LASSO and multivariate Cox regression analysis to refine the selection of an optimal prognostic signature from these eleven genes. Following the LASSO analysis, seven top candidate DEGs—PCSK1N, LY6D, DSG3, MYEOV, PLAAT2, MET, and CENPE—were identified based on the minimum partial likelihood deviance. The risk score formula derived from this analysis is as follows: risk score=0.0968×CENPE+0.1989×MET+0.0163×PLAAT2+0.0537×MYEOV+0.0219×DSG3+0.0903×LY6D+(−0.0049) × PCSK1N. Utilizing this formula, we calculated the risk score for each patient, stratifying them into low- and high-risk groups based on the median risk score. These results revealed a significant statistical difference in overall survival (OS) between the high- and low-risk groups, suggesting the efficacy of our prognostic signatures. Furthermore, the predictive accuracy of the model was assessed using ROC analysis at 1, 3, and 5 years, yielding area under the curve (AUC) values of 0.76, 0.824, and 0.783, respectively. High-risk groups had stronger correlation with B cell, neutrophil and myeloid dendritic cells (Figure S1), which elaborates the model’s potential effectiveness in guiding immunotherapy.
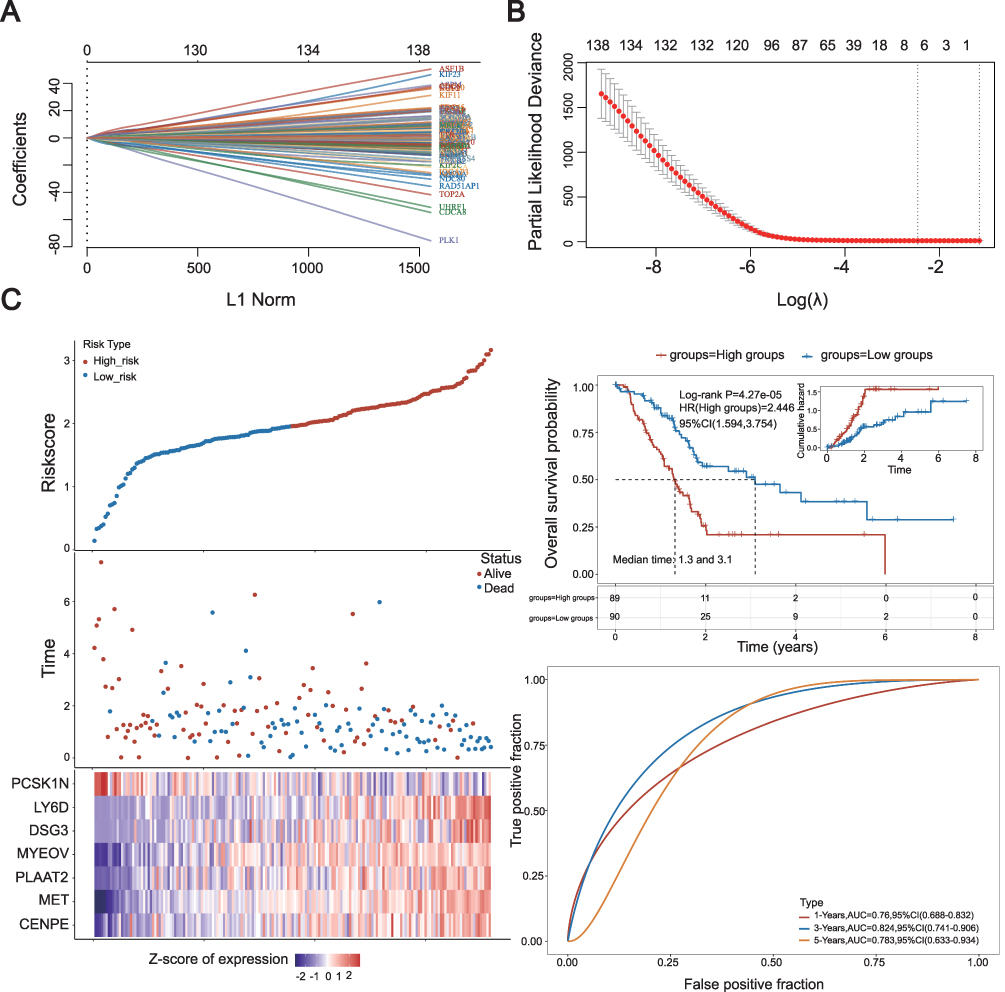 |
Figure 7 Construction of prognostic model for DEGs. (A) 10-fold cross-validation for variable selection in the LASSO model. (B), Formula coefficient of five NRLs in PAAD. (C) Risk score distribution, scatter plots, KM survival curve analysis and ROC curve of patients with PAAD. |
TP53 and KRAS Mutations Promote the Expression of KIF18A
Next, we investigated the driving factors behind the upregulation of KIF18A. TP53 and KRAS mutations are important driving factors for the occurrence and development of PAAD. The results confirmed that the expression of KIF18A in PAAD tissue was significantly up-regulated after TP53 and KRAS mutations compared with the group having wild-type TP53 and KRAS, which confirmed that KIF18A might be driven by TP53 or KRAS. Survival analysis showed that the prognosis of PAAD patients with TP53 mutation and KRAS mutation was significantly worse than that of the group with wild type TP53 and KRAS (Figure 8A and B). According to the results in GDSC database, we found that KIF18A expression was mainly negatively correlated with cisplatin, gemcitabine and paclitaxel, (Figure 8C).
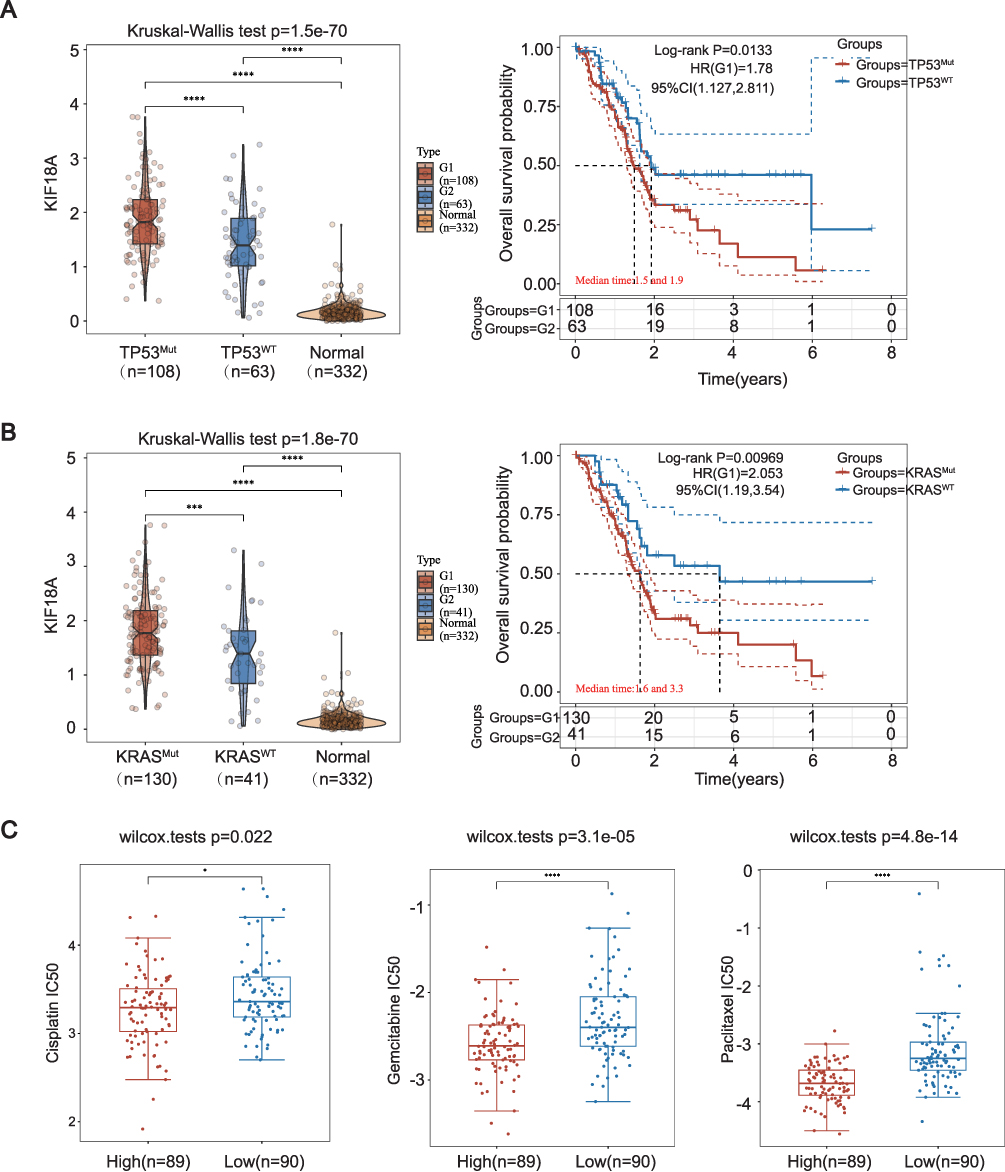 |
Figure 8 Expression of KIF18A with different mutations types and drug sensitivity analysis for PAAD patients in different drugs. (A and B) KIF18A expression based on KRAS and TP 53 mutation in TCGA database. (C) IC 50 of cisplatin, gemcitabine and paclitaxel between high and low KIF18A expression based on GDSC database. *p < 0.05, ***p < 0.001, ****p < 0.0001. |
Discussion
PAAD is extremely malignant, and its occult characteristics pose a major threat to people’s health. Although the emergence of surgery, radiotherapy, chemotherapy and immunotherapy has saved some patients, the recurrence and metastasis after surgery is still a major dilemma restricting the treatment of PAAD.16,17 With the development of high-throughput sequencing technology, exploring the changes of genes in PAAD is of great significance for predicting the prognosis of PAAD patients and guiding individualized immunotherapy.18
KIF18A, as an important part of cell microtubule structure, is involved in the genesis and development of many kinds of tumors,19 but research on KIF18A in PAAD is still lacking. This study first explored the expression of KIF18A in pancreatic cancer, and the results confirmed that the mRNA and protein levels of KIF18A in pancreatic cancer were significantly up-regulated compared with normal tissues. The stroma of PAAD tissue is highly remodeled and heterogeneous.20 Single cell sequencing analysis can explore gene localization in specific cell subpopulations.21 In this study, we found that KIF18A is mainly located in tumor cells in pancreatic cancer tissue, and it promotes tumor progression by regulating the mitosis and chromosome stability of PAAD cells. TMB and MSI are important indicators for predicting the efficacy of immunotherapy in cancer patients.22,23 This study found that the high expression of KIF18A was positively correlated with TMB and MSI, suggesting that KIF18A may be used as a marker of immunotherapy in PAAD patients to guide clinical treatment.
In recent years, studies have shown that microtubule proteins are closely related to the progression and metastasis of tumors.24,25 This study found that the high expression of KIF18A promoted the proliferation and migration of PAAD through in vitro experiments. This study confirmed that that KIF18A is expressed at a low level in endothelial cells of normal pancreatic tissue, and we further explore its relationship with angiogenesis. The results showed a significant negative correlation between KIF18A expression and the activation of angiogenesis pathways. Further angiogenesis experiments confirmed that overexpression of KIF18A in conditioned medium intervened in HUVEC, resulting in a significant reduction in the number of vascularized cells, thereby indicating KIF18A inhibits tumor angiogenesis. To further investigate its correlation with endothelium, this study found that the expression of KIF18A was significantly correlated with ICAM1, confirming that it may promote tumor metastasis by enhancing tumor cell adhesion.
To further explore the KIF18A’s involvement in PAAD, we conducted enrichment analysis on the high and low expression groups of KIF18A. Consistent with previous results, high expression of KIF18A is closely associated with microtubule formation and cell cycle. M6A and ferroptosis are involved in the progression and metastasis of PAAD.26–28 This study also confirmed that the expression levels of m6A and ferroptosis genes in the KIF18A overexpression group were also significantly increased, which confirmed that they may be involved in the ferroptosis and methylation process of PAAD. KRAS and TP53 mutations are important factors driving the occurrence of PAAD, but there are no effective clinical drugs for the two mutations at present,29–31 so exploring their downstream molecular pathways has important guiding value for the treatment of PAAD. The research results also confirmed that the up regulation of KIF18A is mediated by two mutations, so combining the mutation and the expression of KIF18A can more accurately predict the prognosis of PAAD patients and the corresponding immunotherapy.
Conclusion
In conclusion, our study focused on investigating KIF18A’s roles in predicting prognosis and guide personalized immunotherapy in PAAD patients. Targeting KIF18A holds promise for addressing systemic therapy failure and exploring novel pathways for immunotherapy. Consequently, the molecular mechanisms underlying the interactions between KIF18A and PAAD warrant further investigation.
Data Sharing Statement
The PAAD RNA-seq dataset and Genotype-Tissue Expression project (GTEx) data utilized in this study are accessible through the UCSC Xena platform (http://xena.ucsc.edu/) and GEO datasets (https://www.ncbi.nlm.nih.gov/geo/). For additional inquiries, please contact the corresponding author.
Ethics Statement
This study was approved by the Ethics Committee of the Xi’an Honghui Hospital.
Author Contributions
All authors made a significant contribution to the work reported, whether that is in the conception, study design, execution, acquisition of data, analysis and interpretation, or in all these areas; took part in drafting, revising or critically reviewing the article; gave final approval of the version to be published; have agreed on the journal to which the article has been submitted; and agree to be accountable for all aspects of the work.
Funding
This work was funded by Natural Science Basic Research Plan in Shaanxi Province of China (2024JC-YBQN-0896); Project of Xi’an Municipal Health Commission (2024qn11).
Disclosure
The authors declare that the research was conducted in the absence of any commercial or financial relationships that could be construed as a potential conflict of interest.
References
1. Siegel RL, Giaquinto AN, Jemal A. Cancer statistics, 2024. CA Cancer J Clin. 2024;74(1):12–49. doi:10.3322/caac.21820
2. Vincent A, Herman J, Schulick R, Hruban RH, Goggins M. Pancreatic cancer. Lancet. 2011;378(9791):607–620. doi:10.1016/S0140-6736(10)62307-0
3. Hu ZI, O’Reilly EM. Therapeutic developments in pancreatic cancer. Nat Rev Gastroenterol Hepatol. 2024;21(1):7–24. doi:10.1038/s41575-023-00840-w
4. Payton M, Hughes PE. Therapeutic targeting of the KIF18A motor protein in cancers with chromosomal instability. Nat Cancer. 2024;5(1):10–11. doi:10.1038/s43018-023-00700-1
5. Schuyler SC, Chen HY, Chang KP. Suppressing anaphase-promoting complex/cyclosome-cell division cycle 20 activity to enhance the effectiveness of anti-cancer drugs that induce multipolar mitotic spindles. Int J mol Sci. 2024;25(12):6329. doi:10.3390/ijms25126329
6. Lin Y, Wei YL, She ZY. Kinesin-8 motors: regulation of microtubule dynamics and chromosome movements. Chromosoma. 2020;129(2):99–110. doi:10.1007/s00412-020-00736-7
7. Ren J, Yao X, Yang M, et al. Kinesin family member-18A (KIF18A) promotes cell proliferation and metastasis in hepatocellular carcinoma. Dig Dis Sci. 2024;69(4):1274–1286. doi:10.1007/s10620-024-08321-z
8. Liu Y, Sun M, Zhang B, Zhao W. KIF18A improves migration and invasion of colorectal cancer (CRC) cells through inhibiting PTEN signaling. Aging. 2023;15(17):9182–9192. doi:10.18632/aging.205027
9. Schutt KL, Queen KA, Fisher K, et al. Identification of the KIF18A alpha-4 helix as a therapeutic target for chromosomally unstable tumor cells. Front Mol Biosci. 2024;11:1328077. doi:10.3389/fmolb.2024.1328077
10. Thorsson V, Gibbs DL, Brown SD, et al. The immune landscape of cancer. Immunity. 2018;48(4):812–830e814. doi:10.1016/j.immuni.2018.03.023
11. Jiang P, Gu S, Pan D, et al. Signatures of T cell dysfunction and exclusion predict cancer immunotherapy response. Nat Med. 2018;24(10):1550–1558. doi:10.1038/s41591-018-0136-1
12. Xie T, Peng S, Liu S, et al. Multi-cohort validation of Ascore: an anoikis-based prognostic signature for predicting disease progression and immunotherapy response in bladder cancer. mol Cancer. 2024;23(1):30. doi:10.1186/s12943-024-01945-9
13. Yang W, Soares J, Greninger P, et al. Genomics of Drug Sensitivity in Cancer (GDSC): a resource for therapeutic biomarker discovery in cancer cells. Nucleic Acids Res. 2013;41(Database issue):D955–961. doi:10.1093/nar/gks1111
14. Li Y, Zhou H, He X, et al. Impaired microglial glycolysis promotes inflammatory responses after intracerebral haemorrhage via HK2-dependent mitochondrial dysfunction. J Adv Res. 2024; S2090-1232(24)00359–X. doi:10.1016/j.jare.2024.08.016
15. Liu T, Yang K, Chen J, Qi L, Zhou X, Wang P. Comprehensive pan-cancer analysis of KIF18A as a marker for prognosis and immunity. Biomolecules. 2023;13(2):326. doi:10.3390/biom13020326
16. Klein AP. Pancreatic cancer epidemiology: understanding the role of lifestyle and inherited risk factors. Nat Rev Gastroenterol Hepatol. 2021;18(7):493–502. doi:10.1038/s41575-021-00457-x
17. Neoptolemos JP, Kleeff J, Michl P, Costello E, Greenhalf W, Palmer DH. Therapeutic developments in pancreatic cancer: current and future perspectives. Nat Rev Gastroenterol Hepatol. 2018;15(6):333–348. doi:10.1038/s41575-018-0005-x
18. Qian Y, Gong Y, Fan Z, et al. Molecular alterations and targeted therapy in pancreatic ductal adenocarcinoma. J Hematol Oncol. 2020;13(1):130. doi:10.1186/s13045-020-00958-3
19. Gardner MK, Odde DJ, Bloom K. Kinesin-8 molecular motors: putting the brakes on chromosome oscillations. Trends Cell Biol. 2008;18(7):307–310. doi:10.1016/j.tcb.2008.05.003
20. Ho WJ, Jaffee EM, Zheng L. The tumour microenvironment in pancreatic cancer - clinical challenges and opportunities. Nat Rev Clin Oncol. 2020;17(9):527–540. doi:10.1038/s41571-020-0363-5
21. Han J, DePinho RA, Maitra A. Single-cell RNA sequencing in pancreatic cancer. Nat Rev Gastroenterol Hepatol. 2021;18(7):451–452. doi:10.1038/s41575-021-00471-z
22. Jiang M, Jia K, Wang L, et al. Alterations of DNA damage response pathway: biomarker and therapeutic strategy for cancer immunotherapy. Acta Pharm Sin B. 2021;11(10):2983–2994. doi:10.1016/j.apsb.2021.01.003
23. Wu X, Gu Z, Chen Y, et al. Application of PD-1 blockade in cancer immunotherapy. Comput Struct Biotechnol J. 2019;17:661–674. doi:10.1016/j.csbj.2019.03.006
24. Xie S, Ogden A, Aneja R, Zhou J. Microtubule-binding proteins as promising biomarkers of paclitaxel sensitivity in cancer chemotherapy. Med Res Rev. 2016;36(2):300–312. doi:10.1002/med.21378
25. Gu Y, Zhao Y, Ichikawa M. Tektin makes a microtubule a”micropillar”. Cell. 2023;186(13):2725–2727. doi:10.1016/j.cell.2023.05.018
26. Guo X, Li K, Jiang W, et al. RNA demethylase ALKBH5 prevents pancreatic cancer progression by posttranscriptional activation of PER1 in an m6A-YTHDF2-dependent manner. mol Cancer. 2020;19(1):91. doi:10.1186/s12943-020-01158-w
27. Lin K, Zhou E, Shi T, et al. m6A eraser FTO impairs gemcitabine resistance in pancreatic cancer through influencing NEDD4 mRNA stability by regulating the PTEN/PI3K/AKT pathway. J Exp Clin Cancer Res. 2023;42(1):217. doi:10.1186/s13046-023-02792-0
28. Tong X, Tang R, Xiao M, et al. Targeting cell death pathways for cancer therapy: recent developments in necroptosis, pyroptosis, ferroptosis, and cuproptosis research. J Hematol Oncol. 2022;15(1):174. doi:10.1186/s13045-022-01392-3
29. Buscail L, Bournet B, Cordelier P. Role of oncogenic KRAS in the diagnosis, prognosis and treatment of pancreatic cancer. Nat Rev Gastroenterol Hepatol. 2020;17(3):153–168. doi:10.1038/s41575-019-0245-4
30. Cheng NC, Vonderheide RH. Immune vulnerabilities of mutant KRAS in pancreatic cancer. Trends Cancer. 2023;9(11):928–936. doi:10.1016/j.trecan.2023.07.004
31. Escobar-Hoyos LF, Penson A, Kannan R, et al. Altered RNA splicing by mutant p53 Activates oncogenic RAS signaling in pancreatic cancer. Cancer Cell. 2020;38(2):198–211e198. doi:10.1016/j.ccell.2020.05.010
 © 2025 The Author(s). This work is published and licensed by Dove Medical Press Limited. The
full terms of this license are available at https://www.dovepress.com/terms
and incorporate the Creative Commons Attribution
- Non Commercial (unported, 3.0) License.
By accessing the work you hereby accept the Terms. Non-commercial uses of the work are permitted
without any further permission from Dove Medical Press Limited, provided the work is properly
attributed. For permission for commercial use of this work, please see paragraphs 4.2 and 5 of our Terms.
© 2025 The Author(s). This work is published and licensed by Dove Medical Press Limited. The
full terms of this license are available at https://www.dovepress.com/terms
and incorporate the Creative Commons Attribution
- Non Commercial (unported, 3.0) License.
By accessing the work you hereby accept the Terms. Non-commercial uses of the work are permitted
without any further permission from Dove Medical Press Limited, provided the work is properly
attributed. For permission for commercial use of this work, please see paragraphs 4.2 and 5 of our Terms.