Back to Journals » OncoTargets and Therapy » Volume 19
Integrated CT Radiomics and Circulating Tumor Cell Analysis in Predicting Lung Adenocarcinoma Invasion: A Dual-Center Study with Implications for Personalized Treatment
Authors Zhao Q ![]() , Wang R, Zhao Q, Ren D
, Wang R, Zhao Q, Ren D ![]() , Kong L, Zhang X, Duan G
, Kong L, Zhang X, Duan G
Received 20 January 2026
Accepted for publication 4 March 2026
Published 18 March 2026 Volume 2026:19 597565
DOI https://doi.org/10.2147/OTT.S597565
Checked for plagiarism Yes
Review by Single anonymous peer review
Peer reviewer comments 2
Editor who approved publication: Prof. Dr. Gaetano Romano
Qingtao Zhao,1,2,* Runzhe Wang,1,3,* Qingxin Zhao,4,5,* Dahu Ren,1 Lingxin Kong,2 Xiaopeng Zhang,2 Guochen Duan1,2
1Graduate School, Hebei Medical University, Shijiazhuang, Hebei, 050000, People’s Republic of China; 2Department of Thoracic Surgery, Hebei General Hospital, Shijiazhuang, Hebei, 050051, People’s Republic of China; 3The Second Hospital of Hebei Medical University, Shijiazhuang, Hebei, 050051, People’s Republic of China; 4Graduate School, Hebei North University, Zhangjiakou, Hebei, 075000, People’s Republic of China; 5Department of Oncology, Hebei General Hospital, Shijiazhuang, Hebei, 050051, People’s Republic of China
*These authors contributed equally to this work
Correspondence: Guochen Duan, Email [email protected]
Purpose: This study aimed to construct a risk prediction model based on radiomics, circulating tumor cells (CTCs), and dual-center clinical data to predict the invasiveness of lung adenocarcinoma, specifically for discriminating between minimally invasive adenocarcinoma (MIA) and invasive adenocarcinoma (IAC). The clinical value of this model in the precise diagnosis of early-stage lung adenocarcinoma was investigated to provide a reference for formulating reasonable treatment plans.
Patients and Methods: Clinical data, imaging data, CTCs, and pathological information from 202 patients with lung adenocarcinoma were retrospectively collected and analyzed from two medical centers between May 2022 and July 2023. The 146 cases from medical center 1 were randomly divided into a development set and an internal test set at a 3:2 ratio. The 56 cases from medical center 2 served as an external validation set. Machine learning was employed to analyze preoperative CTC counts and CT radiomic features. A feature selection method based on LASSO regression (with λ determined by the minimum criterion) was used to screen out 12 radiomic features. These features were subsequently incorporated into logistic regression to construct three prediction models: (1) a radiomics model based on radiomic features; (2) a CTCs-clinical data model based on the total development set; and (3) a composite clinical data-radiomics-CTCs model integrating the former two. The optimal model was selected to construct a nomogram. Its goodness-of-fit was assessed using a calibration curve (Hosmer-Lemeshow goodness-of-fit test), and its predictive performance was validated in the external validation set.
Results: A total of 107 radiomic features were extracted and categorized into 7 groups: 18 (16.8%) first-order features, 24 (22.4%) gray-level co-occurrence matrix (GLCM) features, 14 (13.1%) gray-level dependence matrix (GLDM) features, 16 (15.0%) each for gray-level run length matrix (GLRLM) and gray-level size zone matrix (GLSZM) features, 5 (4.7%) neighboring gray-tone difference matrix (NGTDM) features, and the remaining (13.1%) were shape-based features. In the total development set, significant differences were observed in clinical-imaging semantic features including CEA, CK19, CTC count, and lesion diameter, which were used to construct the clinical model. The area under the curve (AUC) for the radiomics model was 0.896 95% CI:0.832– 0.960. The CTCs-clinical model demonstrated superior performance AUC:0.960, 95% CI:0.926– 0.994. The composite clinical-radiomics-CTCs model showed the highest predictive accuracy AUC:0.980, 95% CI:0.960– 1.000. According to decision curve analysis and the Akaike information criterion, the composite clinical-radiomics-CTCs model outperformed any single clinical or radiomic feature in terms of clinical predictive capability.
Conclusion: For assessing the invasiveness of early-stage lung adenocarcinoma, the radiomics approach can effectively discriminate between MIA and IAC. However, compared to single-modality methods, the composite clinical-radiomics-CTCs model offers a novel auxiliary diagnostic method for evaluating the risk of invasiveness in early-stage lung cancer.
Keywords: CT radiomics, circulating tumor cells, lung adenocarcinoma, nomogram, preoperative prediction
Introduction
Lung cancer remains the leading cause of cancer-related mortality worldwide, with approximately 2.48 million new cases and 1.8 million deaths reported in 2022.1 This number is projected to increase to 4·62 million new cases and 3·55 million deaths by 2050 if current trends persist.2 The disease has a multifactorial etiology, with established risk factors encompassing tobacco consumption, airborne pollutants, genetic predisposition, and broader environmental exposures.3 Despite advances in low-dose Computed tomography (LDCT) screening, which have reduced late-stage diagnoses by 20–25%, nearly 30% of subcentimeter pulmonary nodules exhibit invasive histopathology upon resection.4 The diagnostic accuracy of current paradigms relying on tumor size and FDG-PET findings remains limited (Area under the ROC curve, AUC = 0.73) for predicting invasiveness, leading to overtreatment in 15–20% of cases.5 Liquid biopsy approaches such as ctDNA analysis exhibit only 50–60% sensitivity in early-stage disease, and cost barriers further limit their widespread adoption.6 This diagnostic uncertainty underscores the urgent need for more advanced biomarkers.
CT imaging plays a crucial role in distinguishing benign from malignant pulmonary nodules by analyzing high-throughput image features such as texture, shape, and gray-level distribution, often supported by machine learning algorithms.7 Recent studies suggest that integrating multimodal radiomic models with clinical or genomic data can further improve diagnostic specificity.8 For example, Li et al combined CT radiomic features with smoking history to develop a model that achieved an AUC of 0.872 in an independent cohort, representing a 22% improvement over conventional CT.9 The integration of deep learning and radiomics is also progressing; for instance, Li et al employed a three-dimensional (3D) deep convolutional neural network (CNN) to extract spatiotemporal features from subsolid nodules. This approach yielded superior predictive performance for malignancy, demonstrating enhanced sensitivity and specificity.10 Nevertheless, challenges remain, including the need for image standardization, risks of overfitting due to limited sample sizes, and limited biological interpretability.
Circulating tumor cells (CTCs) analysis, a minimally invasive form of liquid biopsy, shows promise in discriminating benign from malignant lung nodules for early lung cancer detection.11 CTCs detection demonstrates higher AUC (93%) than conventional serum biomarkers such as CEA (70%), particularly for indeterminate nodules (8–30 mm) where PET-CT accuracy is limited.12,13 Wang et al reported that combining CTC counts with gene mutation detection helped differentiate inflammatory from malignant nodules, offering particular benefit for subcentimeter nodules not amenable to biopsy.14 The in vivo CellCollector® platform improves detection sensitivity by minimizing cell loss associated with conventional blood-draw methods.15 This study investigates the utility of integrating CTCs data with artificial intelligence for assessing pulmonary nodule malignancy, thereby providing insights to support clinical decision-making.
The acquisition of invasiveness in lung adenocarcinoma is fundamentally driven by specific molecular events, such as gene mutations (eg., TP53, KRAS) and epithelial-mesenchymal transition (EMT).16–18 These molecular alterations not only lead to the loss of tumor cell adhesion and enhanced motility, facilitating their detachment into the bloodstream to form CTCs, but also trigger tumor microvascular proliferation and stromal remodeling. These pathological changes manifest as imaging features like spiculation and solid components on CT. Therefore, CT radiomics can non-invasively capture the macroscopic invasive phenotype of the tumor as a whole, while CTC analysis provides direct molecular evidence of invasive behavior at the single-cell level.19,20 Integrating these two modalities to establish a multi-modal fusion model enables a comprehensive deconstruction of lung adenocarcinoma invasiveness from the macroscopic to the microscopic scale. This approach is expected to significantly improve prediction accuracy and provide a more reliable basis for clinical decision-making regarding early intervention.
Study Cohort and Methods
Study Cohort
This retrospective multicenter study consecutively enrolled patients with pulmonary nodules who underwent surgical resection at two tertiary institutions in Shijiazhuang, China, between May 2022 and July 2023: The Hebei General Hospital (n = 119) and The Second Hospital of Hebei Medical University (n = 56). Inclusion criteria were as follows: 1. Complete clinical documentation; 2. Histopathological confirmation following curative resection; 3. Preoperative CTC analysis using the FDA-cleared CellCollector system (GILUPI GmbH); 4. Availability of diagnostic-quality high-resolution CT (HRCT) scans obtained within one week before surgery, showing nodules ≤3.0 cm in maximum diameter; 5. Quantitative radiomic risk stratification using a validated machine learning algorithm.
Exclusion criteria were: 1. Suboptimal CT image quality precluding radiomic analysis; 2. Pathologically confirmed carcinoma in situ or benign lesions; 3. Absolute surgical contraindications; 4. Pulmonary metastases from extrathoracic malignancies. After rigorous screening, 175 eligible subjects were included in the final cohort.
Comprehensive clinical parameters were systematically collected, including demographic characteristics (sex, age), medical history, smoking status, and serum tumor biomarkers such as carcinoembryonic antigen (CEA), neuron-specific enolase (NSE), cytokeratin 19 fragment (CK19), and squamous cell carcinoma antigen (SCC-Ag). Lesion diameters were categorized into four groups: T0: 6–10 mm; T1: 11–20 mm; T2: 21–25 mm; T3: 26–30 mm.
The study received ethical approval from the institutional review boards (IRB-2022-LN012), and the requirement for informed consent was waived due to the retrospective design. All data were anonymized and handled in accordance with the principles of the Declaration of Helsinki.
Methods
In vivo CTCs Detection Using Cell Collector
CTC isolation was performed using the CellCollector system (GILUPI GmbH), an in vitro diagnostic device that uses an antibody-functionalized venous capture technique. The device comprises a medical-grade stainless-steel wire (0.5 mm in diameter) with a 20-mm bioactive segment coated with EpCAM-specific monoclonal antibodies embedded in a hydrogel polymer matrix to maintain cellular viability during ex vivo processing. The wire was inserted into the antecubital vein via a 20-gauge intravenous cannula. The bioactive segment remained intravascular for exactly 30 minutes to allow specific antigen-antibody interaction with circulating epithelial-derived malignant cells. Cells that were EpCAM/CK-positive, nuclear-positive, and CD45-negative were identified as CTCs.
Image Acquisition
All patients underwent standard multi-slice spiral CT scans using either a Siemens Somatom Definition Flash system (Siemens Healthineers, Erlangen, Germany) or a GE Revolution Discovery CT 750 HD system (GE Healthcare, Chicago, IL, USA). Scans were performed with patients in the supine position during breath-hold. The protocol covered the region from the thoracic inlet to the adrenal glands. Thin-section lung window images were reconstructed using standard algorithms with a slice thickness of 1.0 mm or 1.25 mm. All images were saved in DICOM format for subsequent analysis.
Nodule Segmentation and Radiomic Feature Selection
The collected original thin-slice chest CT images were preprocessed. Resampling was performed to achieve a uniform voxel size of 1*1*1, with a window width of 1500 HU and a window level of −500 HU. Two radiologists, blinded to the pathological results, independently manually delineated the volume of interest (VOI) for each pulmonary nodule using ITK-SNAP software. Care was taken to avoid including blood vessels, bronchi, adjacent pleura, and atelectatic tissue. In this study, consistency analysis was performed on the independent segmentation results from the two radiologists. The stability of the extracted features was assessed using the Intraclass Correlation Coefficient (ICC). Features with an ICC value ≥ 0.75 were considered to have good consistency, and only these features were retained for subsequent model construction.
Model Construction
The original radiomic features were initially screened using the maximum-relevance and minimum-redundancy (mRMR) algorithm. The objective was to maximize the mutual information between the features and the target variable (ie., maximum relevance) while minimizing the average mutual information within the feature subset (ie., minimum redundancy). Subsequently, the least absolute shrinkage and selection operator (LASSO) algorithm (implemented via the scikit-learn toolkit in Python) was employed to select the radiomic features with the most significant predictive power. LASSO is a linear regression method that incorporates an L1 regularization term into the regression model’s loss function, which forces some feature coefficients to shrink to zero, thereby achieving variable selection and mitigating overfitting. For the features selected by mRMR, Lasso regression was further applied for refined selection and coefficient shrinkage. Features with non-zero coefficients from the Lasso regression were retained. Using these coefficients as weights, a linear weighted combination of the standardized feature values was calculated to derive a radiomics score (Rad-score) for each patient. A logistic regression model was then constructed based on the Rad-score. Clinical variables with p < 0.05 were incorporated into a multivariate logistic regression to identify significant predictors. These predictors were used to develop a clinical model. Finally, a combined model integrating both radiomic and clinical features was constructed.
Nested cross-validation was implemented in the development set to further reduce the risk of overfitting, with an outer loop for model evaluation and an inner loop for hyperparameter optimization. A five-fold cross-validation was used in the outer loop to assess model generalization performance, while another five-fold cross-validation was conducted in the inner loop for hyperparameter tuning. The optimal parameters determined during the inner cross-validation process were used only for model building within the current outer fold, and the outer validation data were not involved in the parameter search. To ensure the reproducibility of the experimental results, a fixed random seed (seed=42) was set for all models. Furthermore, the stability and clinical utility of the models were further evaluated using calibration curves and decision curve analysis.
Nomogram
Statistically significant risk factors identified through univariate logistic regression were included in a multivariate analysis to develop clinical and combined models. A nomogram was constructed to visualize the combined model, assess variable importance, and estimate prediction accuracy. Calibration was evaluated using calibration curves and the Hosmer–Lemeshow test, while clinical utility was assessed via decision curve analysis.
Statistical Analysis
Image preprocessing and region of interest (ROI) delineation were performed using ITK-SNAP Version 3.8.0. Radiomic feature extraction was conducted using PyRadiomics Version 3.0.1. The construction and analysis of machine learning models in this study were completed in a Python 3.8.10 environment. Model implementation was based on the open-source machine learning libraries Scikit-learn (version 1.1.3), LightGBM (version 3.3.5), and XGBoost (version 1.6.0).
Normality tests were performed for continuous variables. Normally distributed continuous data are presented as mean ± standard deviation, while non-normally distributed continuous data are presented as median (range). For comparisons between the MIA and IAC groups, the Mann–Whitney U-test or independent t-test was used to assess differences in data distribution. Categorical variables were compared using the chi-square test. A p-value < 0.05 was considered statistically significant for all analyses in this study.
Results
Patient Cohort Analysis
A total of 202 patients with early-stage lung adenocarcinoma of varying invasiveness were enrolled from two medical centers. Medical Center 1 (n=146) comprised 39 males and 107 females. Twenty patients had a history of smoking, while 126 did not. Significant differences (P<0.05) were observed among the groups in terms of CEA, CK19, CTC count, and lesion diameter, as detailed in Table 1. Medical Center 2 (n=56) served as the external test set, which included 49 cases (87.5%) of invasive adenocarcinoma (IAC) and 7 cases (12.5%) of minimally invasive adenocarcinoma (MIA). Based on the development set, the features demonstrating significant differences were identified as clinical risk factors for predicting the invasive risk of early-stage lung adenocarcinoma and were used to construct a clinical prediction model. Table 2 displays the Spearman correlation coefficients following multivariate analysis. Figure 1 summarizes the performance of machine learning models applied to the clinical data, including Logistic Regression (LR), Support Vector Machine (SVM), K-Nearest Neighbors (KNN), Random Forest, Extra Trees, XGBoost, LightGBM, and Multilayer Perceptron (MLP). All these models demonstrated favorable performance.
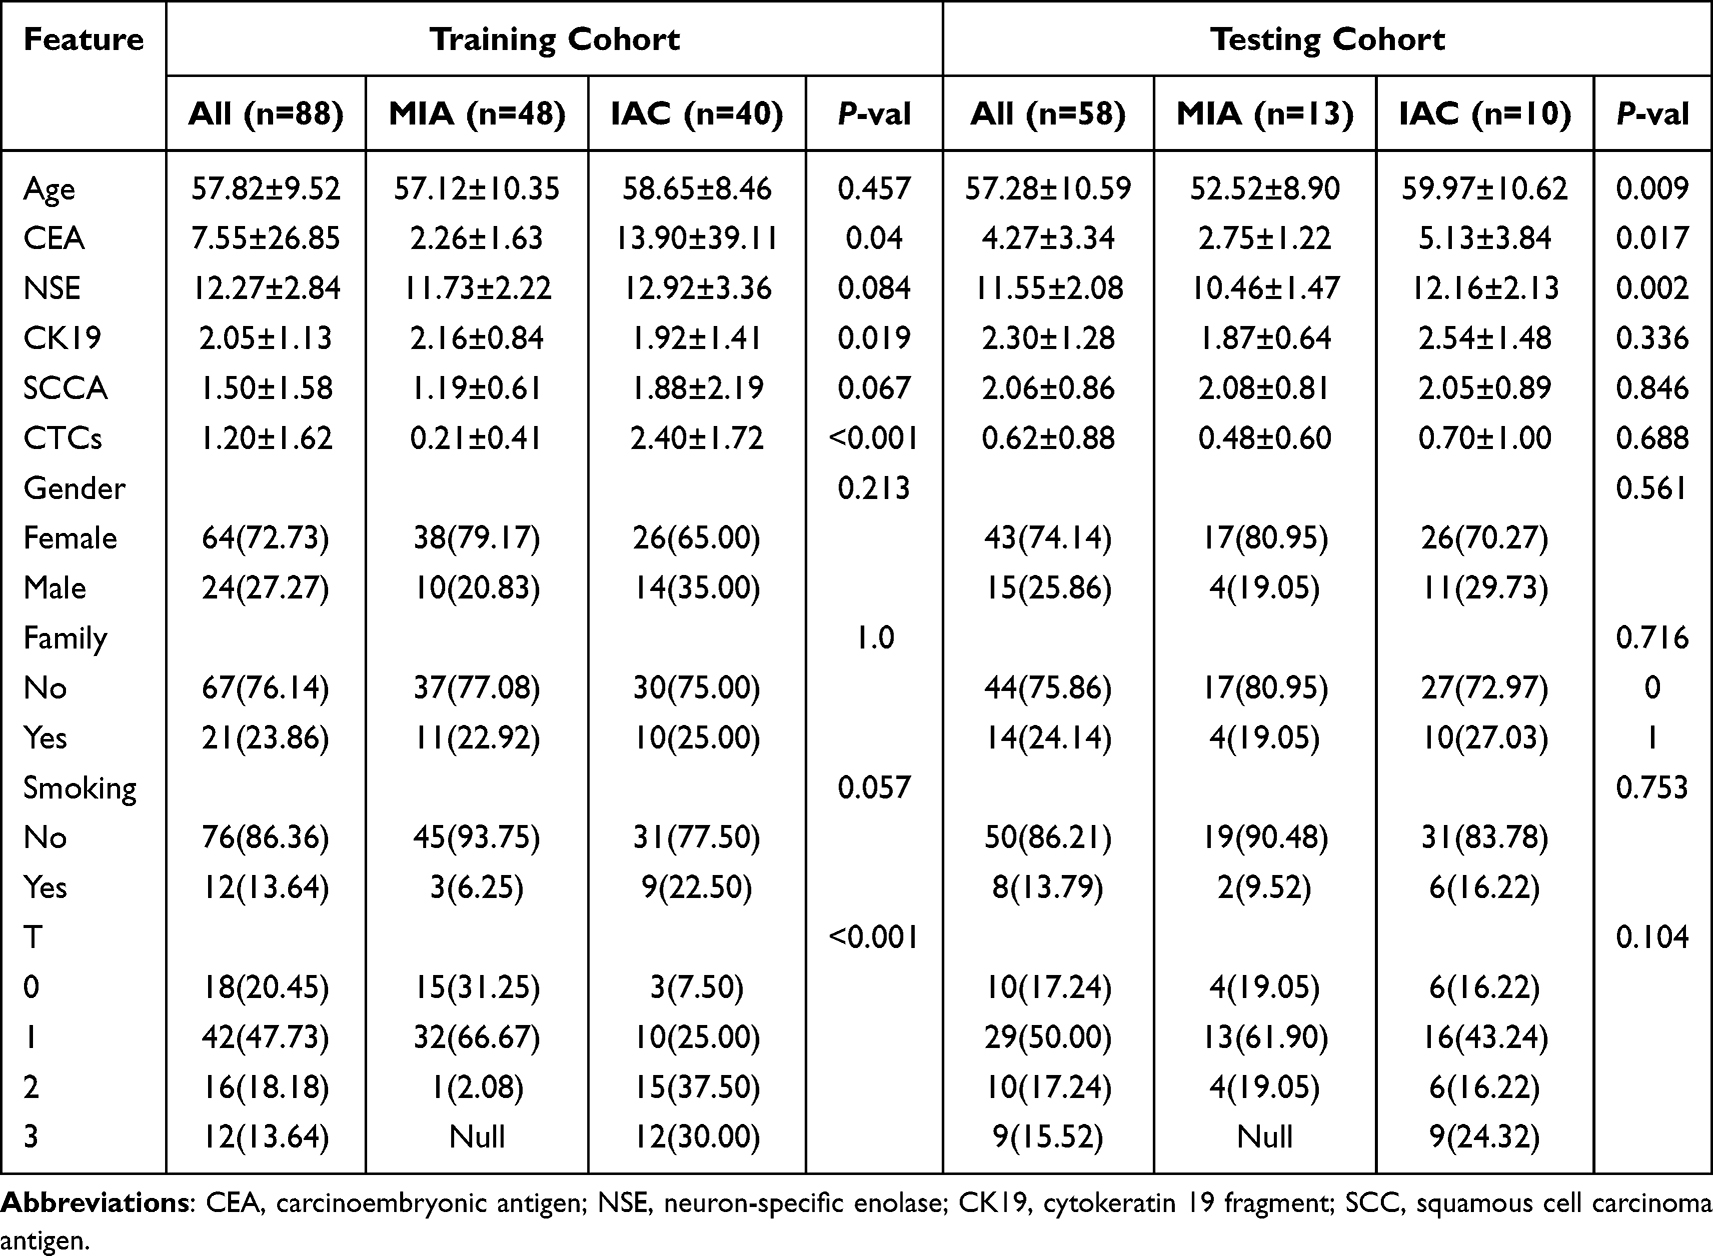 |
Table 1 Association of Clinicopathological Characteristics in 175 LUAD Patients |
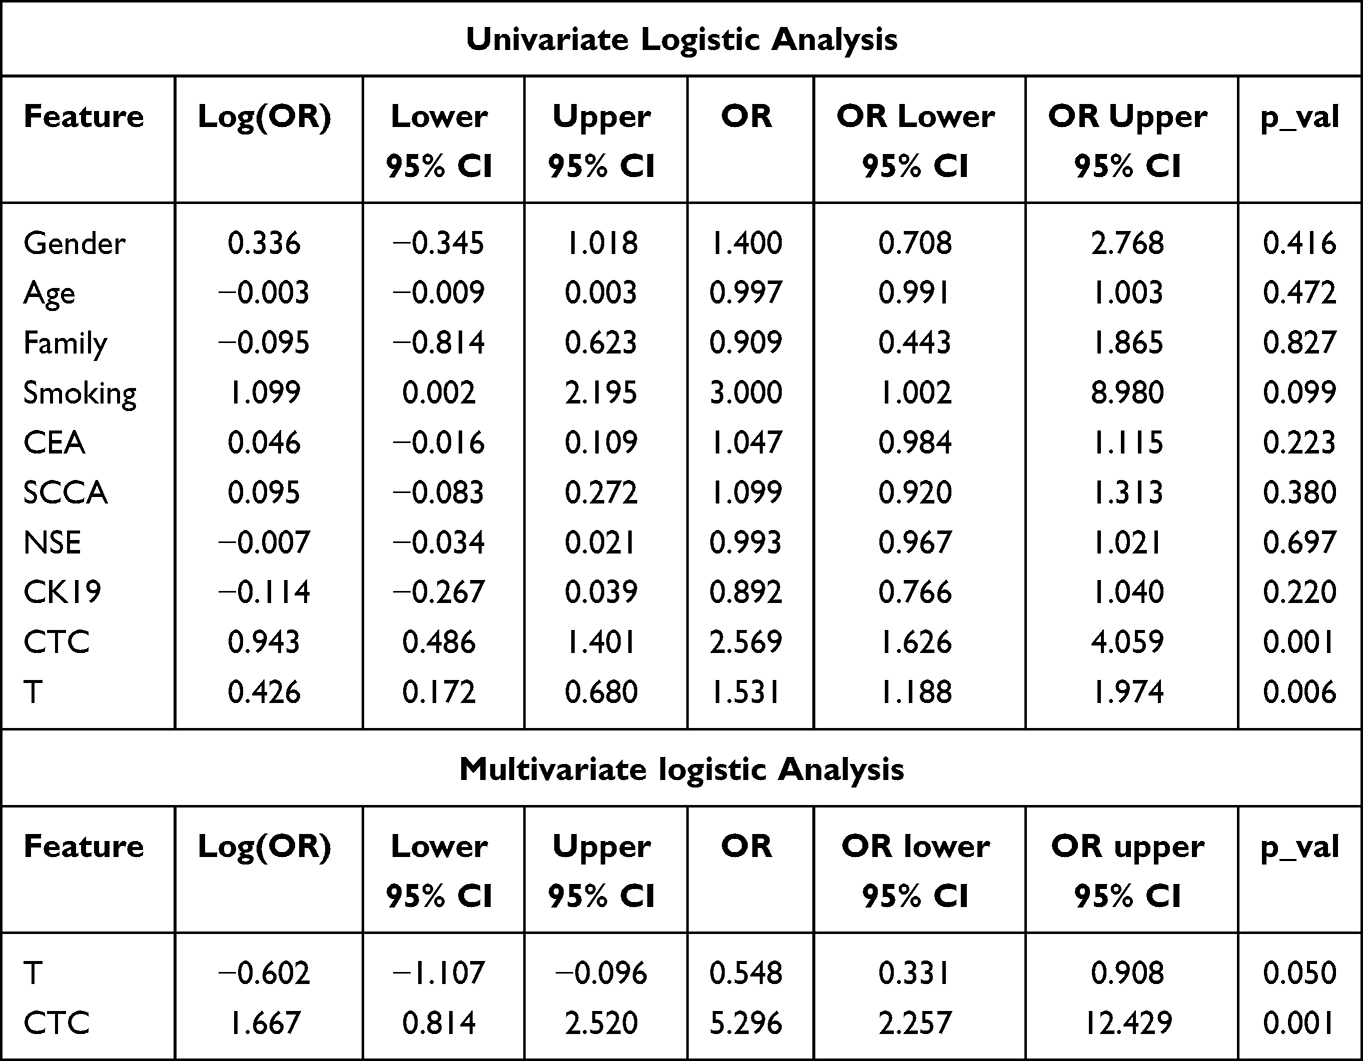 |
Table 2 Univariate and Multivariate Logistic Analysis of Clinical Data |
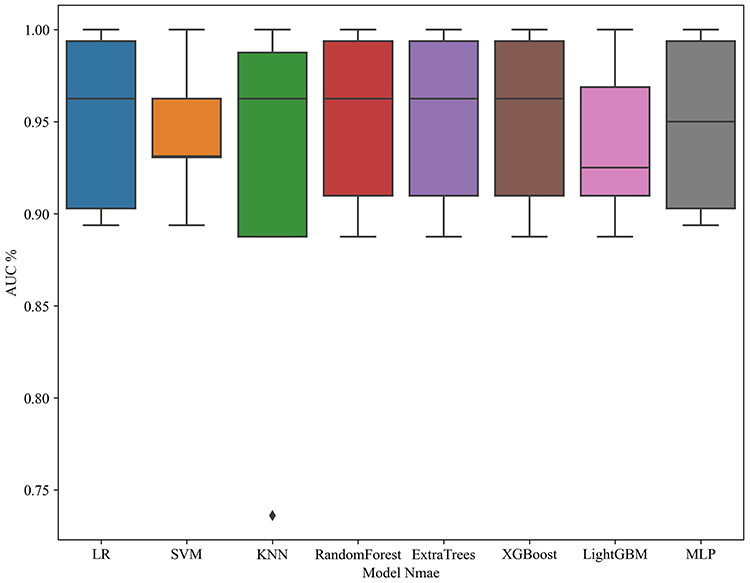 |
Figure 1 Performance of machine learning models in clinical data. |
Radiomics Results
A total of 107 radiomic features were extracted and categorized into seven groups, including 18 first-order features, 24 gray-level co-occurrence matrix (GLCM) features, 14 gray-level dependence matrix (GLDM) features, 16 gray-level run length matrix (GLRLM) features, 16 gray-level size zone matrix (GLSZM) features, 5 neighboring gray tone difference matrix (NGTDM) features, and the remaining shape-based features. All features were extracted using the internal analysis procedures of PyRadiomics (http://pyradiomics.readthedocs.io) to ensure accuracy and reliability. Figure 2 presents the P-values corresponding to all features. Within the range of P < 0.2, various radiomic features demonstrated a certain degree of convergence and homogeneity. Figure 3 displays the matrix obtained from phase clustering analysis under different correlation coefficient conditions, representing the pairwise correlations among all 107 features. The color variation within the matrix is closely associated with the data information in the two-dimensional matrix or table Darker colors indicate positive correlations, while lighter colors indicate negative correlations. The intensity of the color reflects the magnitude of the coefficient value, with darker shades representing stronger correlations, indicating that the correlation coefficient is closer to 1. As shown in Figure 4, the correlations among various clinical features can be observed at the intersections of the horizontal and vertical coordinates.
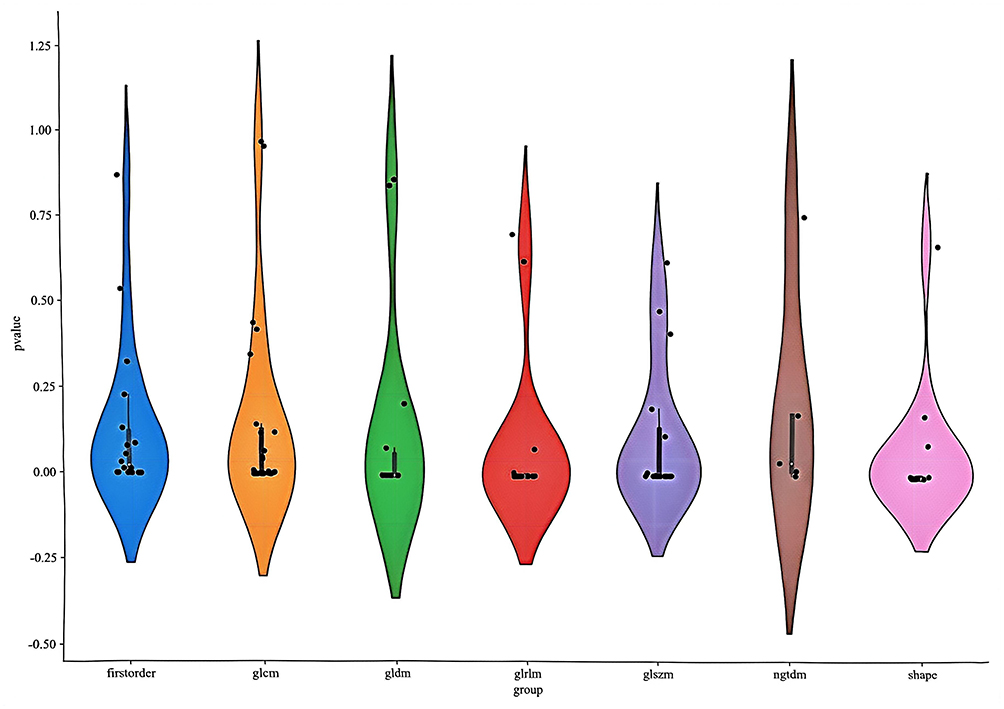 |
Figure 2 Violin plots of radiomics signatures. |
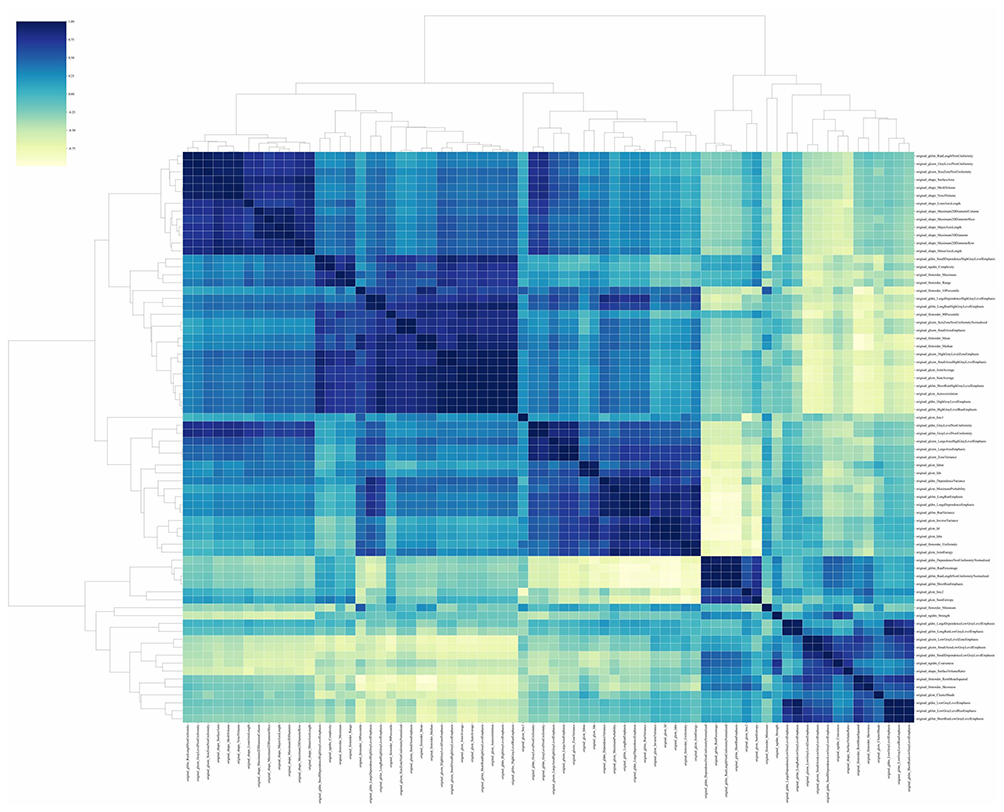 |
Figure 3 Visualization of the phase clustering analysis matrix with different correlation coefficients. |
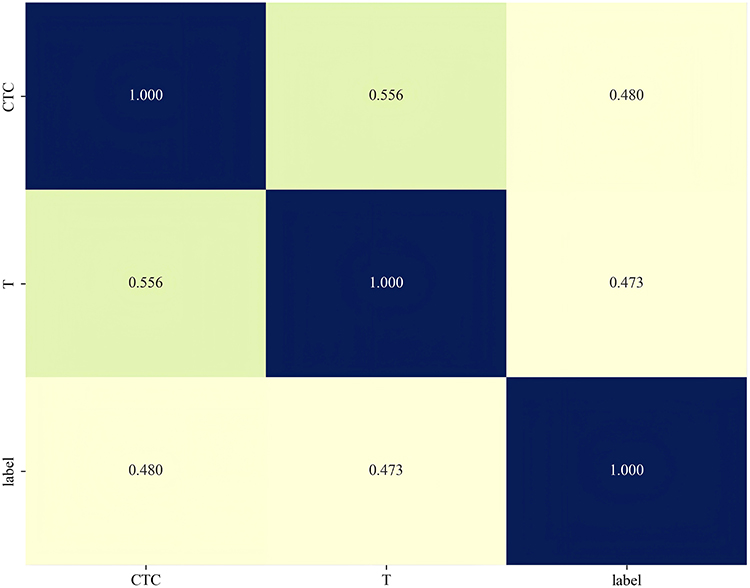 |
Figure 4 Spearman correlation coefficients of each clinical feature. |
The construction of the Lasso regression model involved screening non-zero coefficients to establish a radiomic feature score. The results of the regression model and the mean standard error (MSE) after ten-fold cross-validation are shown in Figures 5 and 6, respectively, with λ=0.0391. The most significant radiomic features included original_firstorder_10Percentile and original_firstorder_90Percentile. The dimensionality-reduced feature set was used for machine learning modeling, following the same model selection process as the clinical feature model (Figure 7). The area under the curve (AUC) for the LR model was 0.896 (95% CI: 0.832–0.960). Figure 8 presents the accuracy curves for the development and validation sets.
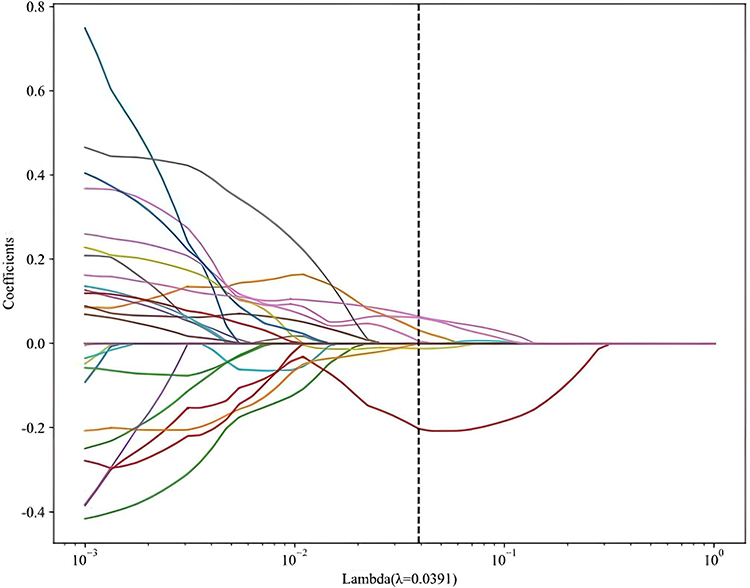 |
Figure 5 Lasso regression of radiographic features. |
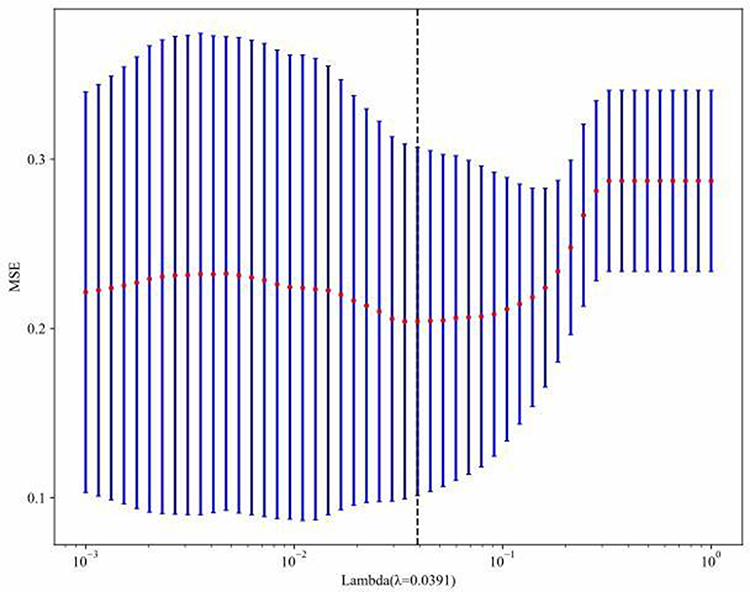 |
Figure 6 Correlation plots of standard errors and coefficients in Lasso regression. |
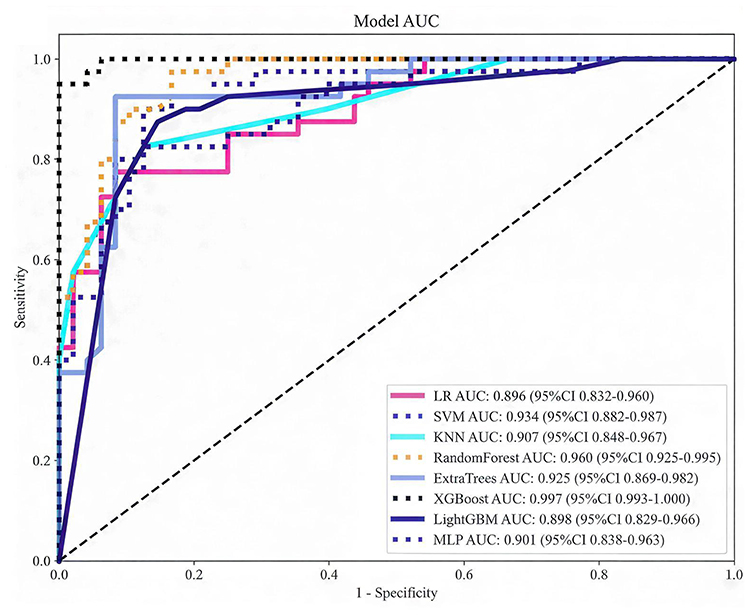 |
Figure 7 ROC curve analysis of Logistic regression model. |
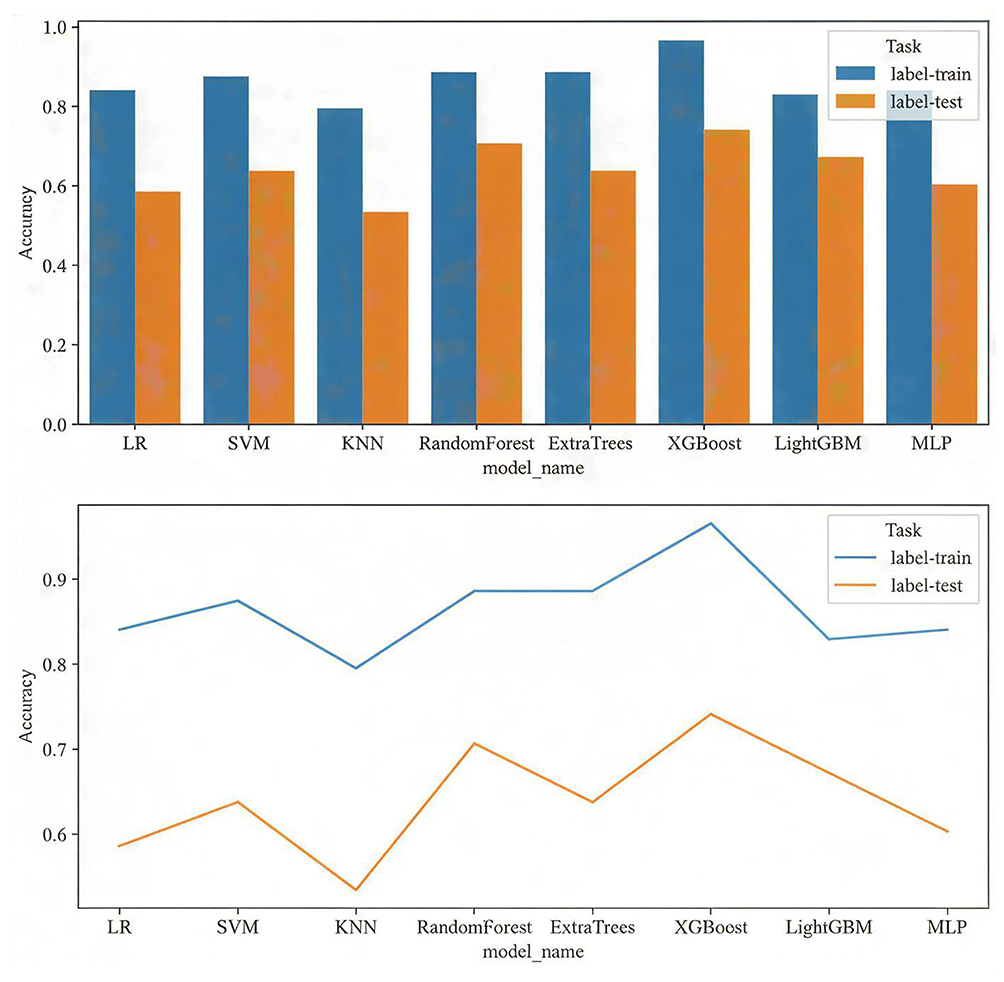 |
Figure 8 Accuracy curves of the training set and validation set. |
The most significant radiomic features included original_firstorder_10Percentile and original_firstorder_90Percentile. The feature set after dimensionality reduction was used for machine learning modeling, following the same model selection process as that for the clinical feature model (Figure 7). The AUC of the LR model was 0.896 (95% CI: 0.832–0.960). Figure 8 presents the accuracy curves for the development and validation sets. After a comprehensive comparison of the predictive performance and stability of multiple models, the LR model demonstrated stable performance in the independent test set, along with good interpretability and clinical applicability, and was therefore selected as the final prediction model.
Nomogram Construction
A nomogram was constructed to predict the invasiveness of lung adenocarcinoma by integrating clinical, radiomic, and circulating tumor cell (CTC) features (Figure 9). The area under the curve (AUC) of this nomogram was 0.980 (95% CI: 0.960–1.000) in the development set (Figure 10A). The AUC for external validation was 0.967 (95% CI: 0.960–1.000) (Figure 10B). The calibration curves demonstrated good agreement between the predicted and observed outcomes, indicating high accuracy of the nomogram. Decision curve analysis (DCA) revealed substantial clinical utility across a wide range of predicted risk thresholds (Figures 11A, B, and 12). The receiver operating characteristic (ROC) curves, calibration curves, and DCA results from both the development and validation sets collectively indicated robust model performance.
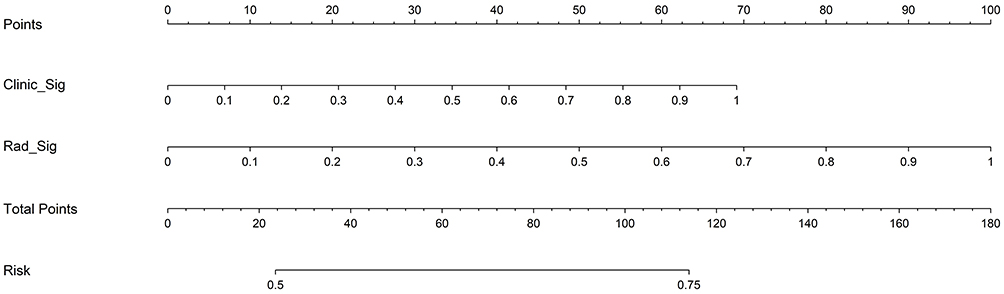 |
Figure 9 Nomogram of the composite model for predicting lung adenocarcinoma risk. |
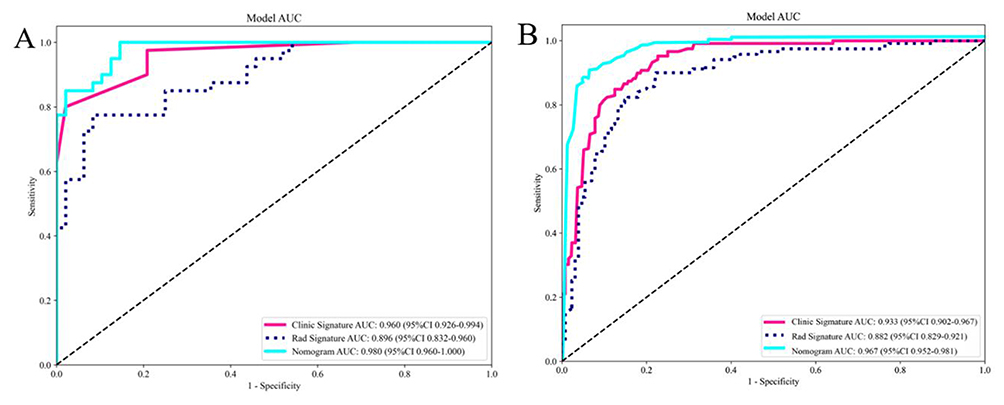 |
Figure 10 Receiver operating characteristic curves in both the (A) training and (B) testing cohort. |
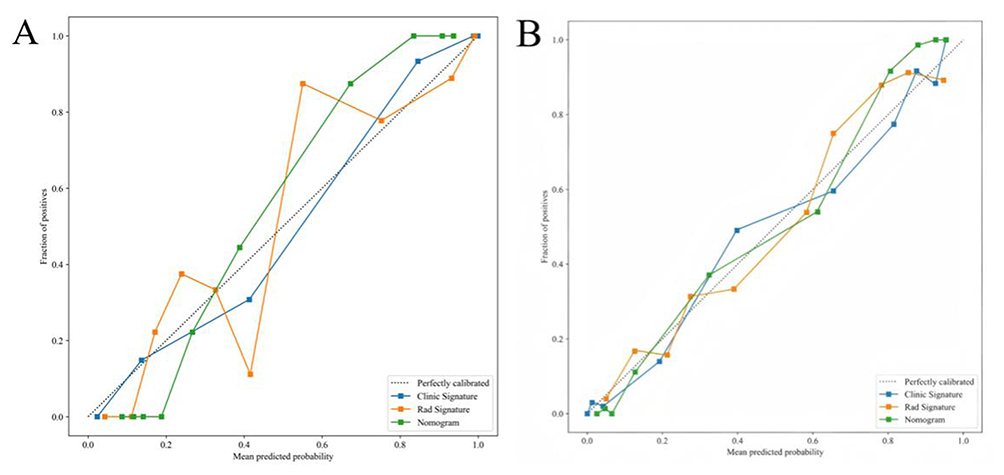 |
Figure 11 Calibration curves in the (A) training and (B) testing cohort. |
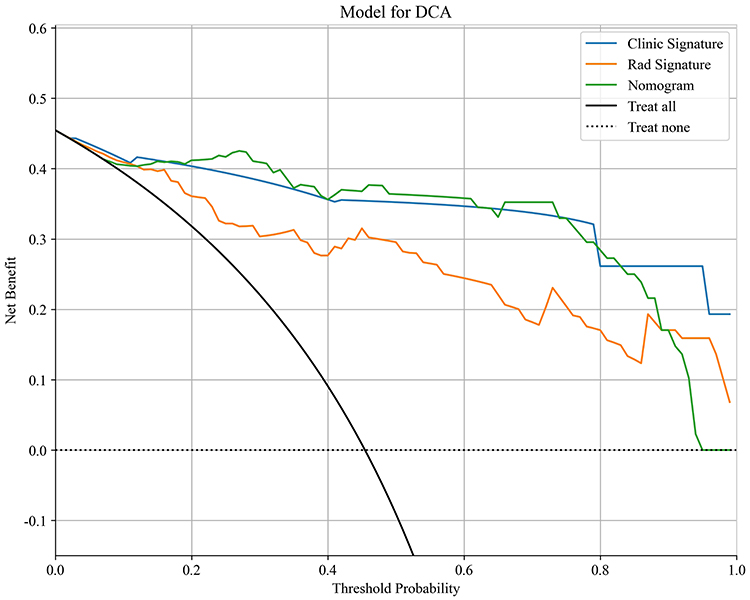 |
Figure 12 DCA in the testing cohort. |
Discussion
In this dual-center study, we developed integrated predictive models combining CT radiomics, clinical parameters, and CTC data to distinguish invasive adenocarcinoma from minimally invasive adenocarcinoma. The multimodal nomogram outperformed models based solely on radiomics or clinical data, providing a rapid, accurate, and non-invasive method for preoperative risk assessment and personalized management of lung adenocarcinoma.
The tumor microenvironment (TME) comprises the complex cellular and molecular milieu surrounding tumor cells and plays a critical role in cancer development, progression, and treatment response.21 In lung adenocarcinoma, significant differences exist in the TME between invasive and non-invasive tumors.22 Histopathologically, adenocarcinoma in situ (AIS) and MIA typically display a uniform lepidic growth pattern with tumor cells lining alveolar structures. In contrast, IAC exhibits histologic heterogeneity, including papillary, micropapillary, acinar, and solid subtypes. Approximately 90% of lung adenocarcinomas contain mixed subtypes, leading to considerable spatial variation in cellular composition and morphology.23,24 This histologic complexity contributes to diagnostic challenges. Although intraoperative frozen section analysis is widely used, it shows discordance rates of 12–25% in distinguishing MIA from IAC, primarily due to sampling limitations.25 Such diagnostic uncertainty is clinically significant, as stromal infiltration—a hallmark of invasive behavior—is a key determinant of poor survival and tumor recurrence.26,27 Therefore, accurate preoperative assessment of invasiveness is essential for surgical planning. While sublobar resection is sufficient for MIA (5-year survival >95%), IAC generally requires anatomical lobectomy with lymphadenectomy to reduce recurrence risk.28,29
The differences in radiomic features are mainly attributed to histological changes related to the pathological invasiveness of lung adenocarcinoma: in invasive lung adenocarcinoma, tumor cell proliferation activity increases and stromal infiltration is significant. On CT images, these manifest primarily as uneven density and lobulated margins. These features are positively correlated with circulating tumor cell counts, suggesting that both can serve as complementary non-invasive and invasive indicators for assessing the pathological invasiveness of lung adenocarcinoma. Their intrinsic association aligns with the histopathological mechanism of lung adenocarcinoma invasion.30 This study systematically compared several commonly used machine learning models, including logistic regression, random forest, and support vector machine, using five-fold cross-validation to evaluate each model’s AUC, sensitivity, and specificity, ultimately selecting the logistic regression model as the final predictive model.
This study has several limitations. First, the retrospective design may introduce selection bias, despite consecutive case enrollment to minimize this risk. Second, although dual-center data enhance generalizability, variations in CT scanners and acquisition parameters may affect feature stability. Third, although manual segmentation of regions of interest remains the clinical standard, it is subject to inter-observer variability; future implementation of automated segmentation algorithms could improve reproducibility. Finally, in patients with multiple pulmonary nodules, only the dominant lesion was analyzed, potentially overlooking information from synchronous nodules that could contribute to a comprehensive invasiveness assessment.
Conclusion
The CT radiomics features serve as an effective non-invasive tool for the preoperative differentiation of invasive adenocarcinoma from minimally invasive adenocarcinoma. Characteristics such as texture and density can reflect the microscopic pathological heterogeneity of the tumor and are associated with its invasive potential. Conversely, circulating tumor cell (CTC) counts are linked to tumor shedding, invasion, and epithelial-mesenchymal transition (EMT). The integrated diagnostic model combining these two modalities demonstrates excellent diagnostic performance, offering a robust method for preoperative risk stratification. This multimodal approach shows significant potential for clinical translation and may contribute to more personalized surgical planning and patient management for lung adenocarcinoma.
Data Sharing Statement
The data sets analyzed during the current study are available from the corresponding author on reasonable request.
Funding
This research was funded by the Hebei Provincial Clinical Outstanding Talent Training Project (grant no. ZF2023196), the Hebei Province Medical Science Research Project Plan (grant no. 20240380).
Disclosure
The authors report no conflicts of interest in this work.
References
1. Bray F, Laversanne M, Sung H, et al. Global cancer statistics 2022: GLOBOCAN estimates of incidence and mortality worldwide for 36 cancers in 185 countries. CA Cancer J Clin. 2024;74(3):229–15. doi:10.3322/caac.21834
2. Zhou J, Xu Y, Liu J, Feng L, Yu J, Chen D. Global burden of lung cancer in 2022 and projections to 2050: incidence and mortality estimates from GLOBOCAN. Cancer Epidemiol. 2024;93:102693. doi:10.1016/j.canep.2024.102693
3. Herbst RS, Morgensztern D, Boshoff C. The biology and management of non-small cell lung cancer. Nature. 2018;553(7689):446–454. doi:10.1038/nature25183
4. National Lung Screening Trial Research Team. Reduced lung-cancer mortality with low-dose computed tomographic screening. N Engl J Med. 2011;365(5):395–409.
5. Nakajo M, Jinguji M, Ito S, Tani A, Hirahara M, Yoshiura T. Clinical application of 18F-fluorodeoxyglucose positron emission tomography/computed tomography radiomics-based machine learning analyses in the field of oncology. Jpn J Radiol. 2024;42(1):28–55. doi:10.1007/s11604-023-01476-1
6. Cescon DW, Bratman SV, Chan SM, Siu LL. Circulating tumor DNA and liquid biopsy in oncology. Nat Cancer. 2020;1(3):276–290. doi:10.1038/s43018-020-0043-5
7. Pan F, Feng L, Liu B, Hu Y, Wang Q. Application of radiomics in diagnosis and treatment of lung cancer. Front Pharmacol. 2023;14:1295511. doi:10.3389/fphar.2023.1295511
8. Tan X, Pan F, Zhan N, et al. Multimodal integration to identify the invasion status of lung adenocarcinoma intraoperatively. iScience. 2024;27(12):111421. doi:10.1016/j.isci.2024.111421
9. Li J, Shi Q, Yang Y, et al. Prediction of EGFR mutations in non-small cell lung cancer: a nomogram based on 18F-FDG PET and thin-section CT radiomics with machine learning. Front Oncol. 2025;15:1510386. doi:10.3389/fonc.2025.1510386
10. Li S, Xu P, Li B, et al. Predicting lung nodule malignancies by combining deep convolutional neural network and handcrafted features. Phys Med Biol. 2019;64(17):175012. doi:10.1088/1361-6560/ab326a
11. Ignatiadis M, Sledge GW, Jeffrey SS. Liquid biopsy enters the clinic - implementation issues and future challenges. Nat Rev Clin Oncol. 2021;18(5):297–312. doi:10.1038/s41571-020-00457-x
12. Wang X, Ding P, Xu W, et al. Distinct CTC specific RNA profile enables NSCLC early detection and dynamic monitoring of advanced NSCLC. Adv Sci. 2025;12(23):e2417849. doi:10.1002/advs.202417849
13. Spadafora M, Pace L, Evangelista L, et al. Risk-related 18F-FDG PET/CT and new diagnostic strategies in patients with solitary pulmonary nodule: the Italian multicenter trial. Eur J Nucl Med Mol Imaging. 2018;45(11):1908–1914. doi:10.1007/s00259-018-4043-y
14. Wang S, Xu C, Xu X, et al. The role of circulating tumor cell as a promising biomarker in the evaluation of pulmonary nodules: a prospective study. Cancer Res Treat. 2026;58(1):128–140. doi:10.4143/crt.2024.841
15. Duan GC, Zhang XP, Wang HE, et al. Circulating tumor cells as a screening and diagnostic marker for early-stage non-small cell lung cancer. Onco Targets Ther. 2020;13:1931–1939. doi:10.2147/OTT.S241956
16. Zhao W, Nguyen TT, Bhagwat A, et al. A cellular and spatial atlas of TP53-associated tissue remodeling defines a multicellular tumor ecosystem in lung adenocarcinoma. Nat Cancer. 2025;6(11):1857–1879. doi:10.1038/s43018-025-01053-7
17. Budczies J, Romanovsky E, Kirchner M, et al. KRAS and TP53 co-mutation predicts benefit of immune checkpoint blockade in lung adenocarcinoma. Br J Cancer. 2024;131(3):524–533. doi:10.1038/s41416-024-02746-z
18. Thiery JP, Acloque H, Huang RY, Nieto MA. Epithelial-mesenchymal transitions in development and disease. Cell. 2009;139(5):871–890. doi:10.1016/j.cell.2009.11.007
19. Xu L, Lin S, Zhang Y. Differentiation of adenocarcinoma in situ with alveolar collapse from minimally invasive adenocarcinoma or invasive adenocarcinoma appearing as part-solid ground-glass nodules (≤ 2 cm) using computed tomography. Jpn J Radiol. 2022;40(1):29–37. doi:10.1007/s11604-021-01183-9
20. Jiao Z, Li H, Xiao Y, et al. Integration of deep learning radiomics and counts of circulating tumor cells improves prediction of outcomes of early stage NSCLC patients treated with stereotactic body radiation therapy. Int J Radiat Oncol Biol Phys. 2022;112(4):1045–1054. doi:10.1016/j.ijrobp.2021.11.006
21. Mantovani A, Marchesi F, Malesci A, Laghi L, Allavena P. Tumour-associated macrophages as treatment targets in oncology. Nat Rev Clin Oncol. 2017;14(7):399–416. doi:10.1038/nrclinonc.2016.217
22. Succony L, Rassl DM, Barker AP, McCaughan FM, Rintoul RC. Adenocarcinoma spectrum lesions of the lung: detection, pathology and treatment strategies. Cancer Treat Rev. 2021;99:102237. doi:10.1016/j.ctrv.2021.102237
23. Travis WD, Brambilla E, Noguchi M, et al. International association for the study of lung cancer/American thoracic society/european respiratory society international multidisciplinary classification of lung adenocarcinoma. J Thorac Oncol. 2011;6(2):244–285. doi:10.1097/JTO.0b013e318206a221
24. Travis WD, Brambilla E, Nicholson AG, et al. The 2015 World Health Organization classification of lung tumors: impact of genetic, clinical and radiologic advances since the 2004 classification. J Thorac Oncol. 2015;10(9):1243–1260. doi:10.1097/JTO.0000000000000630
25. Wang H, Chen A, Wang K, et al. CT imaging features of lung ground-glass nodule patients with upgraded intraoperative frozen pathology. Discov Oncol. 2024;15(1):29. doi:10.1007/s12672-024-00872-x
26. Wu H, Zhang X, Zhong Z. Exploration of CT-based discrimination and diagnosis of various pathological types of ground glass nodules in the lungs. BMC Med Imaging. 2025;25(1):119. doi:10.1186/s12880-025-01653-w
27. Gao F, Sun Y, Zhang G, Zheng X, Li M, Hua Y. CT characterization of different pathological types of subcentimeter pulmonary ground-glass nodular lesions. Br J Radiol. 2019;92(1094):20180204. doi:10.1259/bjr.20180204
28. Zhao FH, Fan HJ, Shan KF, et al. Predictive efficacy of a radiomics random forest model for identifying pathological subtypes of lung adenocarcinoma presenting as ground-glass nodules. Front Oncol. 2022;12:872503. doi:10.3389/fonc.2022.872503
29. Jiang Y, Che S, Ma S, et al. Radiomic signature based on CT imaging to distinguish invasive adenocarcinoma from minimally invasive adenocarcinoma in pure ground-glass nodules with pleural contact. Cancer Imaging. 2021;21(1):1. doi:10.1186/s40644-020-00376-1
30. Yang Z, Li F, Han Q, et al. Bio-interpretable ensemble learning model for invasive pulmonary adenocarcinoma grade using CT and histopathology images. NPJ Precis Oncol. 2025;10(1):41. doi:10.1038/s41698-025-01239-3
 © 2026 The Author(s). This work is published and licensed by Dove Medical Press Limited. The
full terms of this license are available at https://www.dovepress.com/terms
and incorporate the Creative Commons Attribution
- Non Commercial (unported, 4.0) License.
By accessing the work you hereby accept the Terms. Non-commercial uses of the work are permitted
without any further permission from Dove Medical Press Limited, provided the work is properly
attributed. For permission for commercial use of this work, please see paragraphs 4.2 and 5 of our Terms.
© 2026 The Author(s). This work is published and licensed by Dove Medical Press Limited. The
full terms of this license are available at https://www.dovepress.com/terms
and incorporate the Creative Commons Attribution
- Non Commercial (unported, 4.0) License.
By accessing the work you hereby accept the Terms. Non-commercial uses of the work are permitted
without any further permission from Dove Medical Press Limited, provided the work is properly
attributed. For permission for commercial use of this work, please see paragraphs 4.2 and 5 of our Terms.
Recommended articles
The Predictive Value of Monocarboxylate Transporter 4 (MCT4) on Lung Adenocarcinoma Patients Treated with PD-1 Inhibitors
Zhang Q, Pan G, Zhang L, Xu Y, Hao J
Journal of Inflammation Research 2024, 17:10515-10531
Published Date: 6 December 2024