Back to Journals » Journal of Inflammation Research » Volume 17
Integrated Bioinformatics Exploration and Preliminary Clinical Verification for the Identification of Crucial Biomarkers in Severe Cases of COVID-19
Authors Huang Z, Cheng Z, Deng X, Yang Y, Sun N, Hou P, Fan R, Liu S ![]()
Received 2 January 2024
Accepted for publication 29 February 2024
Published 11 March 2024 Volume 2024:17 Pages 1561—1576
DOI https://doi.org/10.2147/JIR.S454284
Checked for plagiarism Yes
Review by Single anonymous peer review
Peer reviewer comments 2
Editor who approved publication: Professor Ning Quan
Zhisheng Huang,1,2 Zuowang Cheng,3 Xia Deng,4 Ying Yang,5 Na Sun,5 Peibin Hou,5 Ruyue Fan,5 Shuai Liu6,7
1Department of Pulmonary and Critical Care Medicine, The First Affiliated Hospital of Nanchang University, Nanchang, Jiangxi, People’s Republic of China; 2Department of Pulmonary and Critical Care Medicine, National Regional Center for Respiratory Medicine, Jiangxi Hospital of China-Japan Friendship Hospital, Nanchang, Jiangxi, People’s Republic of China; 3Department of Clinical Laboratory, Zhangqiu District People’s Hospital Affiliated to Jining Medical University, Jinan, Shandong, People’s Republic of China; 4School of Public Health, Shandong Second Medical University, Weifang, Shandong, People’s Republic of China; 5Shandong Center for Disease Control and Prevention, Jinan, Shandong, People’s Republic of China; 6Department of Respiratory and Critical Care Medicine, Shandong Provincial Hospital Affiliated to Shandong First Medical University, Jinan, Shandong, People’s Republic of China; 7Shandong Key Laboratory of Infectious Respiratory Disease, Jinan, Shandong, People’s Republic of China
Correspondence: Shuai Liu; Ruyue Fan, Email [email protected]; [email protected]
Background: Coronavirus disease 2019 (COVID-19) is a respiratory infectious illness caused by severe acute respiratory syndrome coronavirus 2 (SARS-CoV-2). The objective of this study is to identify reliable and accurate biomarkers for the early stratification of disease severity, a crucial aspect that is currently lacking for the impending phases of the next COVID-19 pandemic.
Methods: In this study, we identified important module and hub genes related to clinical severe COVID-19 using differentially expressed genes (DEGs) screening combing weighted gene co-expression network analysis (WGCNA) in dataset GSE213313. We further screened and confirmed these hub genes in another two new independent datasets (GSE172114 and GSE157103). In order to evaluate these key genes’ stability and robustness for diagnosing or predicting the progression of illness, we used RT-PCR validation of selected genes in blood samples obtained from hospitalized COVID-19 patients.
Results: A total of 968 and 52 DEGs were identified between COVID-19 patients and normal people, critical and non-critical patients, respectively. Then, using WGCNA, 10 modules were constructed. Among them, the blue module positively associated with clinic disease severity of COVID-19. From overlapped section between DEGs and blue module, 12 intersected common differential genes were obtained. Subsequently, these hub genes were validated in another two new independent datasets as well and 9 genes that overlapped showed a highly correlation with disease severity. Finally, the mRNA expression levels of these hub genes were tested in blood samples from COVID-19 patients. In severe cases, there was increased expression of MCEMP1, ANXA3, CD177, and SCN9A. In particular, MCEMP1 increased with disease severity, which suggested an unfavorable development and a frustrating prognosis.
Conclusion: Using comprehensive bioinformatical analysis and the validation of clinical samples, we identified four major candidate genes, MCEMP1, ANXA3, CD177, and SCN9A, which are essential for diagnosis or development of COVID-19.
Keywords: COVID-19, differentially expressed genes, WGCNA, hub genes, neutrophil
Introduction
Over the past four years, coronavirus disease 2019 (COVID-19), caused by severe acute respiratory syndrome coronavirus-2 (SARS-CoV-2), is a worldwide health concern. As of 8 November 2023, there have been 771 million reported cases in 188 countries and territories, resulting in over 6.97 million deaths.1 The disease can manifest in various degrees of severity, ranging from mild to critical. Moreover, emerging evidence suggests that individuals infected with SARS-CoV-2 can be asymptomatic carriers, contributing to the silent spread of the virus.2,3 Despite extensive investigation, the underlying question of why there is such a marked difference in the disease progression among infected individuals remains unresolved.
Current studies highlight that the illness severity and progression are largely determined by the dysregulated host inflammatory response.4–6 When a virus penetrates a cell, it may activate both innate and adaptive host immune responses, which are critical components of viral defense.7,8 The exaggerated or dysregulated inflammatory responses and an imbalanced adaptive immunity may account for severe tissue destruction.9 The preexisting immunity on the response to viral infection include the excessive production of inflammatory cytokines, overactivation and dysregulated of immune cells, profound T lymphopenia, as well as decreased frequencies of dendritic cells and natural killer cells, complement activation.7,8,10 A comprehensive understanding of the host antiviral immunity in COVID-19 is critical for developing an explanation for why some patients with no comorbidities progress to critical illness, whereas others do not, a phenomenon exacerbated by new viral variants in current epidemic waves all over the country.
Several studies have described the potential immunological characteristics associated with the disease severity at transcriptomic levels, which provide effective avenue for better patient risk stratification, and further predicting hospitalization, intensive care unit (ICU) admission, monitoring patients’ response to treatment and choosing new treatment.11–14 Unfortunately, these novel biomarkers remain purely investigational concern and difficult to replicate and validate, despite their prognostic potential. Because of the continual evolution of virus and the widespread use of vaccination, identifying potential innovative biomarkers and significant genes linked to cytokine storms or poor immune function is crucial in diagnosing and predicting the severity of COVID-19, which is beneficial to early active treatment and reduce mortality.
In this study, we utilize the comprehensive bioinformatic analysis to identify candidate biological markers (hub genes) that might influence COVID-19 progression. Firstly, one microarray datasets GSE213313 from Gene Expression Omnibus database of the National Cancer Institute (NCBI) was analyzed to identify differentially expressed genes (DEGs) between COVID-19 patients and non-pneumonia controls, critical and non-critical patients, respectively. Meanwhile, the dataset was analyzed using weighted gene co-expression network analysis (WGCNA) to find the most important modules related to clinical severity as well. Secondly, using a Venn diagram to find the intersection of DEGs and WGCNA-derived hub genes and 12 overlapping genes were discovered. Subsequently, the top four upregulated genes, MCEMP1, ANXA3, CD177, and SCN9A were then ultimately screened out through another two datasets and clinical sample validation. The primary objective of this study is to offer a comprehensive illustration of the typical characteristics of severe COVID-19, proposing potential biomarkers for the early diagnosis and prognosis of the disease.
Materials and Methods
Microarray Data Information
We screened and downloaded datasets from Gene Expression Omnibus database of the NCBI (NCBI-GEO). Patients met the following selection criteria. Firstly, patients with COVID-19 were diagnosed by real time reverse transcription polymerase chain reaction (RT-PCR) analysis of respiratory tract samples. Second, gene expression profiles of patients with COVID-19 who had severity categorization, and classification criteria were generally similar. Last, datasets from microarray data or RNA-sequencing data contained a minimum of 10 COVID-19 patients’ whole blood samples or white blood samples. According to the aforementioned standards, three gene expression profiles GSE213313, GSE172114 and GSE157103 were sorted out. The dataset of GSE213313 included 83 COVID-19 patients (50 critical and 33 non-critical patients) and 11 healthy donors. The critical and non-critical were defined as patients being placed on mechanical ventilation or not.15 Whole blood samples from 83 patients were taken from three sampling points. Samples from acute phase (T1: day 1) rather than convalescent phase (T2: day 3; T3: day 9) were selected to analyze due to disease severity and were assessed at the first timepoint of sampling. The dataset of GSE172114 included 46 critical and 23 non-critical patients. The dataset of GSE157103 included 50 critical and 50 non-critical patients. The above two datasets employed the similar diagnostic criteria and classified the patients as severe status based on the use of invasive mechanical ventilation. The GSE213313 was utilized to identify DEGs and construct WGCNA for the investigation. The GSE172114 and GSE157103 were utilized to validate hub genes.
Identification of DEGs, Functional Enrichment and Immune Infiltration Analysis
The matrix files of three datasets from GEO were downloaded for further analysis. The R package “limma” was accounted for identifying DEGs between COVID-19 patients and healthy donors, as well as critical and non-critical patients. DEGs were screened by setting cut-off value to adjusted p-value <0.05 and/or p-value <0.05 (between critical and non-critical patients), and |log2FC| ≥ 1. The gene ontology (GO) enrichment and Kyoto encyclopedia of genes and genomes (KEGG) pathway analyses were conducted using the R package “clusterprofiler”. GO terms or KEGG pathways having an adjusted P < 0.05 were deemed statistically significant. We evaluated 28 different immune cell types using the ssGSEA in order to assess the difference in immune cells between COVID-19 patients and healthy donors.
Weighted Co-Expression Network Analysis (WGCNA)
Using the R package “WGCNA”, we extracted 5000 genes (based on median absolute deviation) in order to build a weight co-expression network.16 The adjacency matrix was transformed into topological overlap matrix (TOM) when the power of β = 16 (R2 = 0.85). The genes were categorized into modules with a minimum size cutoff of 30. Similar modules having a height cut-off of 0.25 were merged together. The module having the strongest connection with clinical traits was chosen for further investigation into its biological function using GO analysis.
Hub Genes Detection and Validation
WGCNA-derived hub genes were screened by setting the criteria that gene significance (GS) >0.5 and module membership (MM) >0.8 in the most important module. Then, using a Venn diagram, we discovered common genes by intersecting DEGs and WGCNA-derived hub genes (http://bioinformatics.psb.ugent.be/webtools/Venn/). Finally, we used GSE172114 and GSE157103 datasets to confirm the difference of hub genes between critical and non-critical COVID-19 patients.
Clinical Samples Collection and Processing
Peripheral blood samples were collected from COVID-19 patients hospitalized to Shandong provincial hospital from December 2022 to May 2023. Demographic data were summarized in Table 1. The patients with COVID-19 were diagnosed by RT-PCR test from throat swab samples for the detection of SARS-CoV-2. Their chest CT showed signs of pneumonia. According to the New Coronavirus Pneumonia Diagnosis and Treatment Program published by the National Health Commission of China,17 patients were considered to have severe pneumonia when they presented the following characteristics or criteria: dyspnea, respiratory rate ≥30/min, pulse oxygen saturation ≤93%, partial pressure of arterial oxygen (PaO2)-to-fraction of inspired oxygen (FiO2) ratio ≤300, and/or radiological lung infiltrates >50% within 48 h, or acute respiratory failure, septic shock. Moderate pneumonia had two or more following criteria: flu-like illness such as fever and cough, respiratory rate <30/min, pulse oxygen saturation >93%, and CT suggestive of pneumonia. Controls were asymptomatic individuals or donors who had recovered from mild infection and did not have any signs of pneumonia. White blood cell samples were isolated from peripheral blood samples and stored in liquid nitrogen until use.
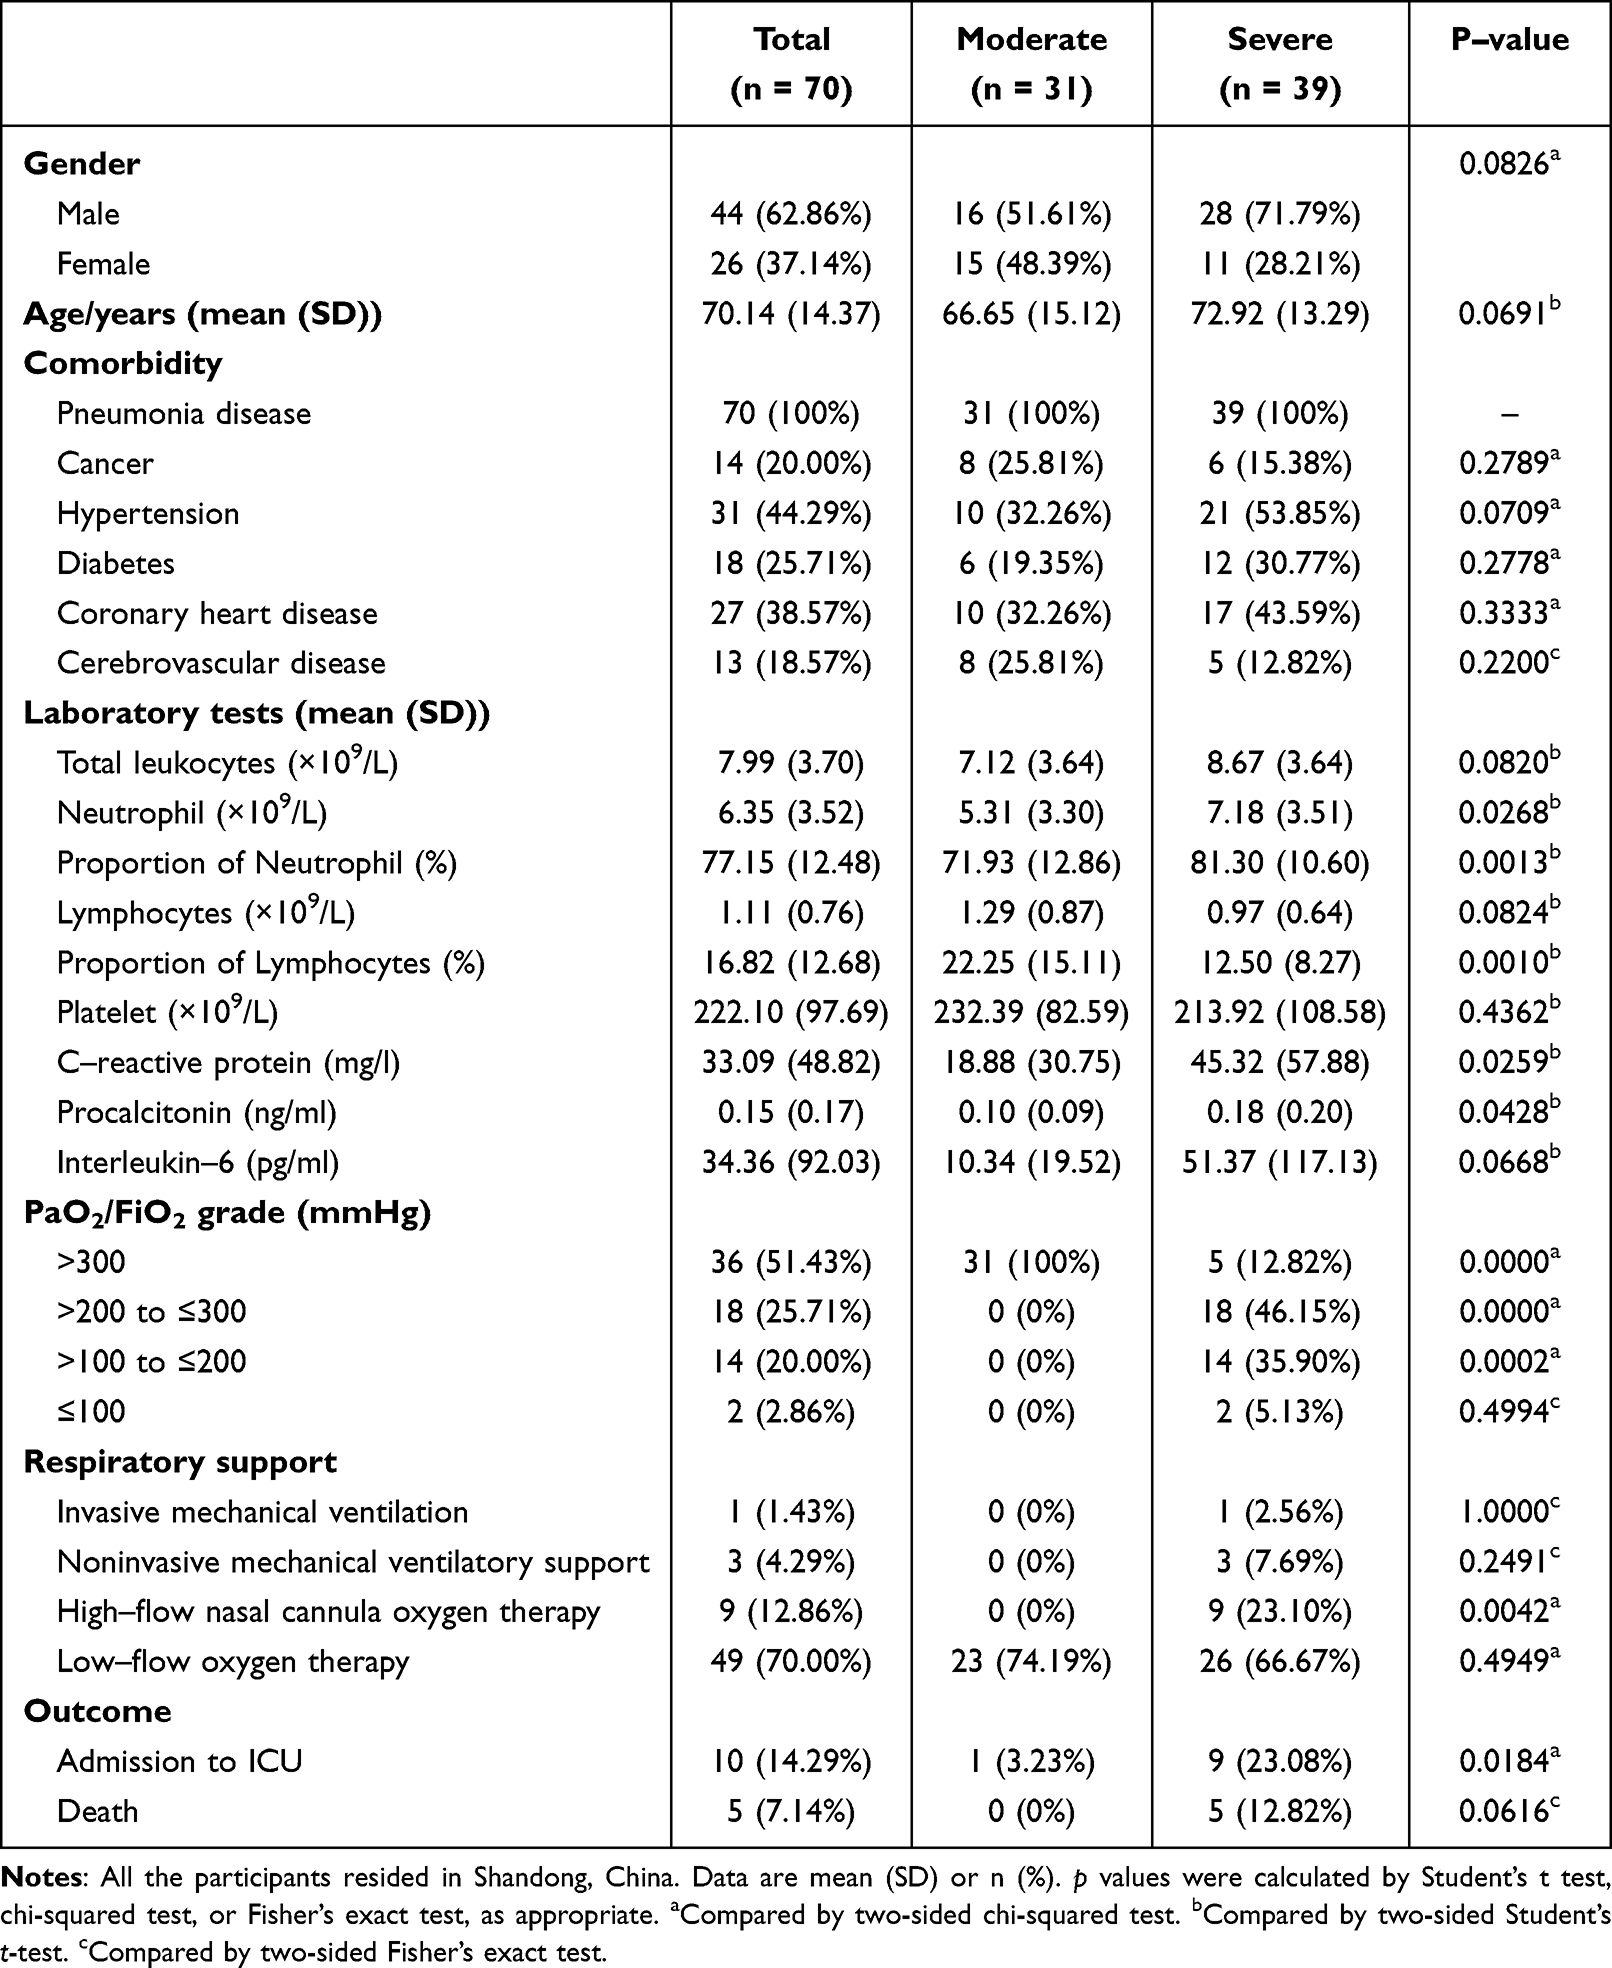 |
Table 1 Characteristics of All Patients Admitted to the Hospital For COVID-19 |
Detection of Hub Genes in Whole Blood Samples
Total RNA was extracted from white blood cells using RNeasy Mini Kit (QIAGEN). Then, the extracted RNA was reverse transcribed into cDNA using Evo M-MLV RT Mix Kit with gDNA Clean for qPCR (Accurate Biology, Hunan, China) according to the manufacturer’s protocol. RT-PCR was conducted using the SYBR Green Premix pro Taq HS qPCR kit (Accurate Biology, Hunan, China). The experiments were performed according to the manufacturer’s instructions provided in the kit using a 10 µL reaction system. The hub gene expression was normalized to the expression of the glyceraldehyde-3-phosphate dehydrogenase gene (GAPDH). The primers used for the hub genes’ RT-PCR were listed in Supplemental Table 1. The 2-ΔΔCT comparative method was used to estimate relative fold changes in gene expression.
Statistical Analysis
Statistical significance was calculated by Student’s t-test, Mann–Whitney U-test, χ2 test, or Fisher’s exact test, as appropriate. *P < 0.05, **P < 0.01, and ***P < 0.001 represents significant statistical differences.
Results
Screening of Stable DEGs Linked to Progression of COVID-19
We screened 968 DEGs, including 574 up-regulated and 394 down-regulated genes in the COVID-19 patient group compared with the healthy donor group, according to a threshold of |log2FC|>1 and adjusted p-value <0.05, and plotted into the volcano map (Figure 1A). A heatmap depicted the top 25 up-regulated and down-regulated DEGs (Figure 1B). The interferon-stimulated genes, such as IFI27 and IFI44, were substantially elevated, but immunoglobulin-E receptor α (FcεRIα) gene usually decreased. Further, we used gene ontology (GO) analysis and Kyoto encyclopedia of genes and genomes (KEGG) pathway analysis to evaluate the functional status resulting from these DEGs. These genes mostly functioned in biological processes (BP) associated with cytoplasmic translation, response to virus, and defense response to virus. In terms of cellular components (CC), these DEGs exhibited a significant enrichment in cytosolic ribosome, ribosomal subunit, and specific granule. The molecular function (MF) terms were immune receptor activity, and MHC class II receptor activity (Figure 1C). Moreover, in terms of KEGG pathway, these genes were mainly enriched in the coronavirus disease-COVID-19 pathway (Figure 1D).
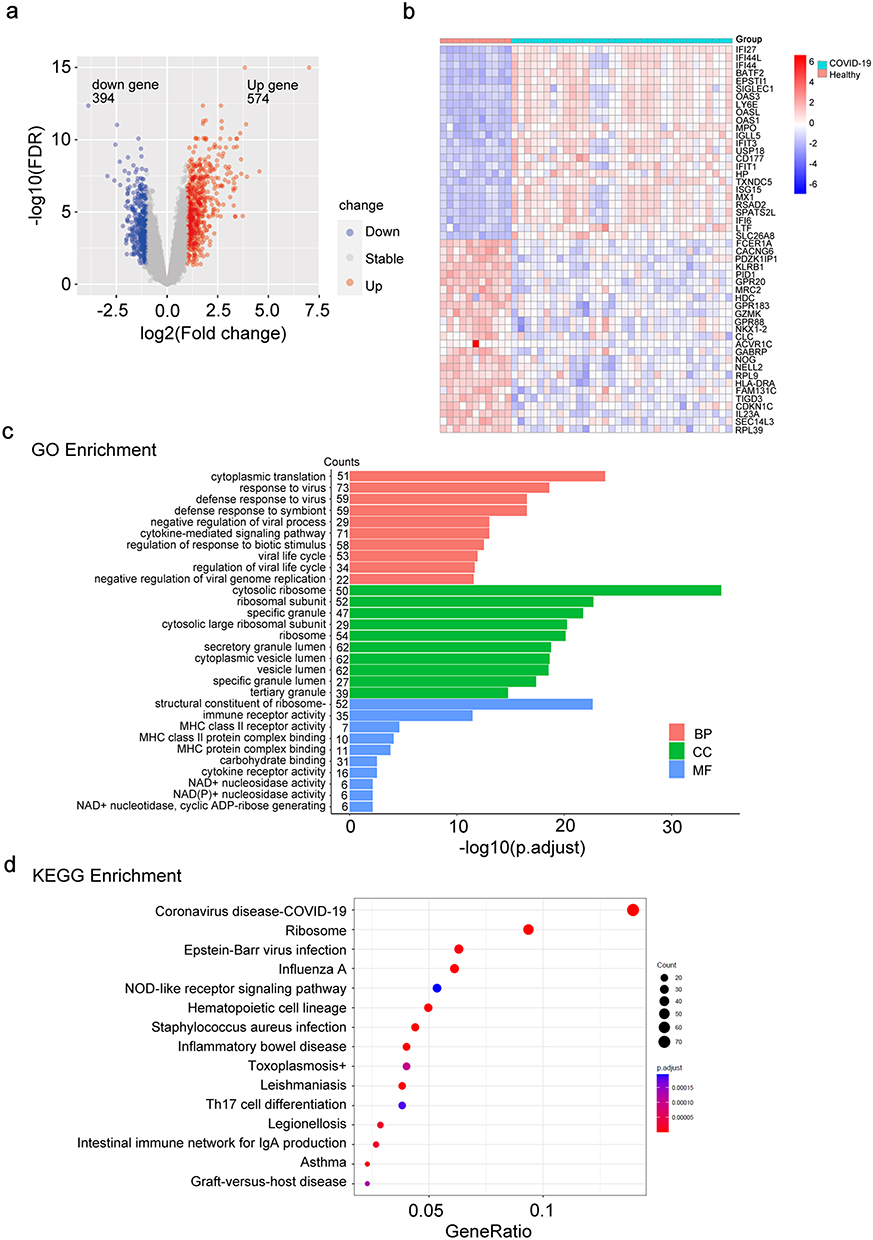 |
Figure 1 Identification of DEGs and functional enrichment analyses. (a) A volcano plot was generated to depict the differentially expressed genes (DEGs; |log2FC|>1, adjusted p-value < 0.05) between healthy donors (n = 11) and COVID-19 patients (n = 34). Up-regulated genes are marked in light red; down-regulated genes are marked in light blue. (b) Heatmap representation of top 25 significant genes, ordered by fold change. Up-regulated genes are shown in red, and down-regulated genes are shown in blue. (c) Bar plot of GO enrichment analysis of DEGs. X-axis represents -log10 adjusted p-value. Y-axis represents different functional groups (also named GO terms) and gene counts. The red bars indicate biological process (BP) terms; the green bars indicate cellular component (CC) terms, and the blue bars indicate molecular function (MF) terms. (d) Bubble plot of KEGG pathway analysis of DEGs. The color and size of the dots represent the range of the adjusted p-value and the number of genes mapped to the indicated KEGG terms. Gene-Ratio is defined as the ratio of the DEGs number to the total gene number. |
Meanwhile, 52 DEGs from the normalized data were screened out, with the findings displayed as heat map and volcano map (Supplementary Figure 1A and B). There were 46 up-regulated and 6 down-regulated genes in critical patients compared with non-critical patients. The results of the GO analysis revealed that the DEGs were mainly enriched in the acute inflammatory response and regulation of inflammatory in biological process (BP); specific granule and specific granule lumen in cellular component (CC); calcium-dependent protein binding and RAGE receptor binding in molecular function (MF) (Supplementary Figure 1C).
Immune Landscape Related to Characteristics of COVID-19
Given the pivotal role of immune cells in the progression of COVID-19, we uploaded microarray data of 45 whole-blood samples from dataset GSE213313 to perform immune infiltration analysis for evaluating the immune function. Using ssGSEA and specific gene markers, the enrichment scores of 28 immune cell types between healthy donors and COVID-19 patients were calculated. A heatmap of infiltration was drawn (Figure 2A). The results indicated that a high presence of neutrophils, macrophage, and activated dendritic cell in the COVID-19 group. Moreover, the differential expression analysis was conducted between groups according to Wilcoxon test, and the differences between groups were shown by a violin chart (Figure 2B). According to p-value <0.001, 12 different immune cells were obtained, and activated CD8+ T cells, natural killer cells, central memory CD4+ T cells, memory B cells, and T follicular helper cells were significantly enriched in healthy donors, while the fraction of neutrophils, macrophages, activated dendritic cells, type 17 T helper cells central, and memory CD8+ T cells showed marked elevation in COVID-19 group.
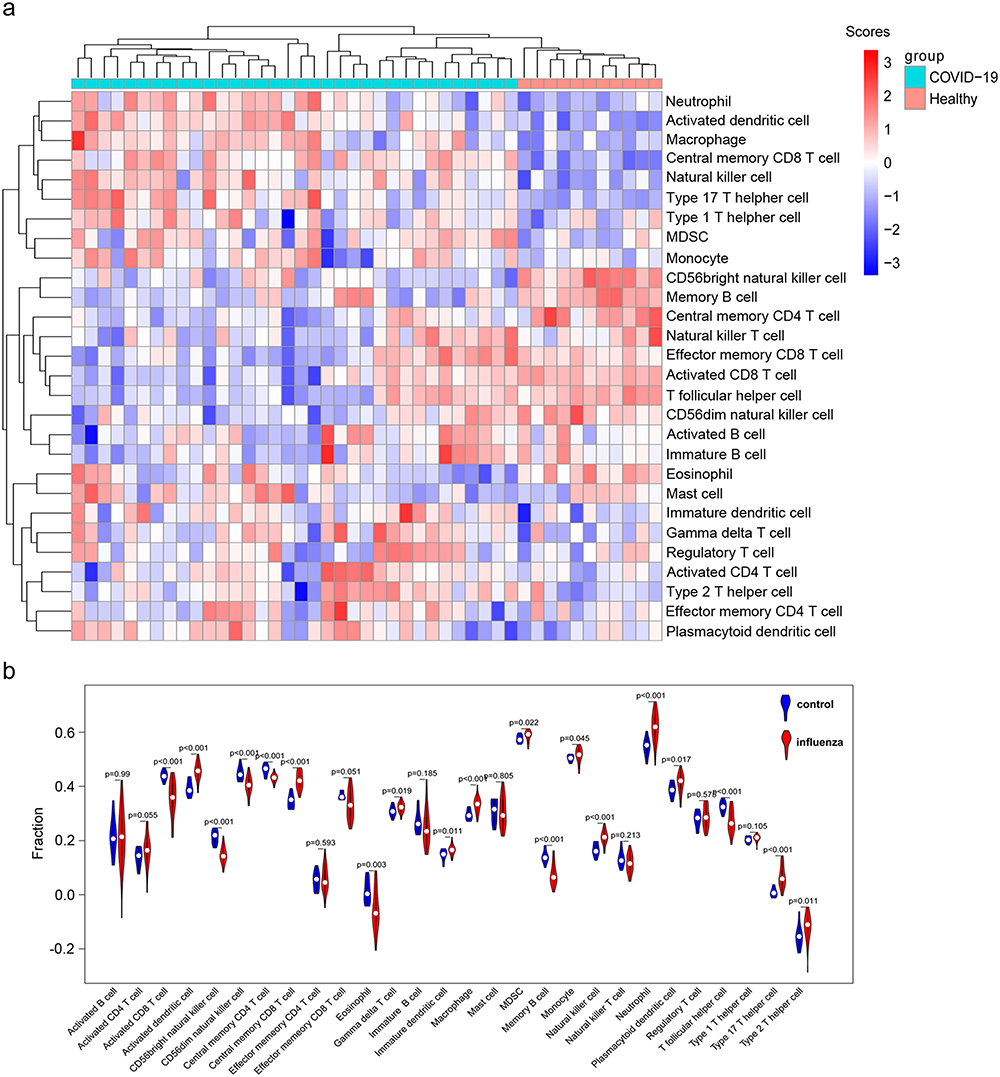 |
Figure 2 Analysis of immune infiltration associated with COVID-19. (a) Heatmap showing the enrichment score of immune cells between healthy donors and COVID-19 patients from dataset GSE213313. The specific enrichment scores of 28 immune cell types were calculated by ssGSEA based on specific gene marker. (b) Immune cells abundance in healthy donors and COVID-19 patients. The blue indicates samples of healthy donors, and the red indicates the samples of COVID-19 patients. The p-values were obtained using Wilcoxon test. |
Key Module Identification Using WGCNA
WGCNA was employed to analyze the gene expression value in 45 samples to find the crucial modules linked to the severity of COVID-19. Clinical features, such as disease status and disease severity were retrieved from raw files (Supplementary Figure S2A). The soft-thresholding power, calculated using a scale-free R2 (R2 = 0.85) analysis, was set to 16 (Supplementary Figure S2B). Ten modules were discerned when the DissThres was initialized to 0.25 subsequent to the fusion of dynamic modules, as shown in the clustering dendrograms (Supplementary Figure S2C). We generated a dendrogram and heatmap to visually present the interrelated eigengenes. The dendrogram clearly showed a substantial association between the blue module and disease severity (Figure 3A). The correlation between the eigengene (ME) values of the modules and samples traits represents the association between the modules and clinical samples traits. The results of this correlation were presented as heatmap profiles. The results indicated that the blue module displayed the most robust link with disease severity (Pearson correlation coefficient = 0.82, P = 2e-11), and it was strongly associated with disease status as well (Pearson correlation coefficient = 0.74, P = 2e-8) (Figure 3B).
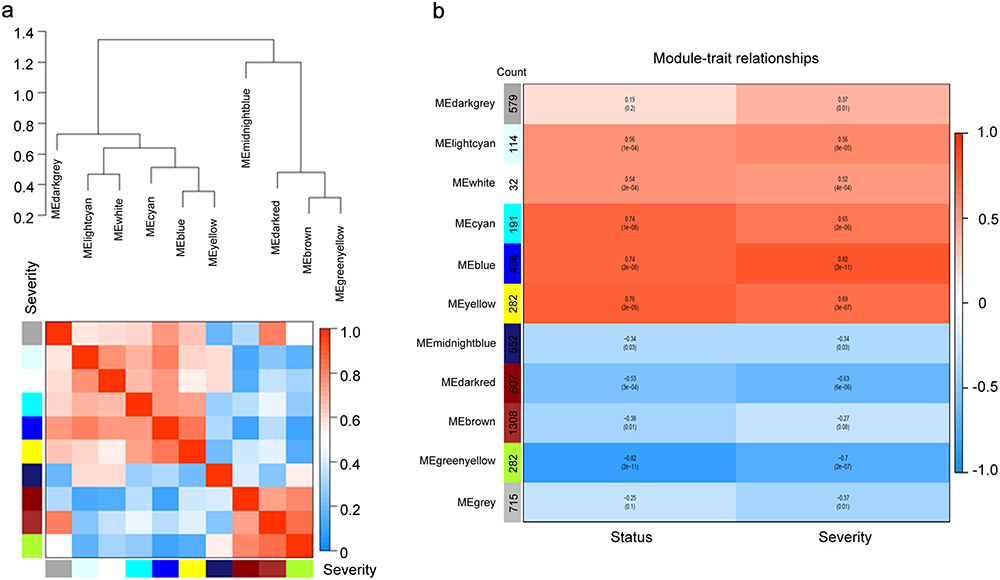 |
Figure 3 Identification of key modules correlated with disease severity through WGCNA. (a) The combination of eigengene dendrogram and heatmap indicated that the blue module is the most positively correlated with the severity of COVID-19. (b) Module-trait associations were evaluated by correlations between module eigengenes and sample traits. Each module contains the corresponding correlation coefficient and p-value. A stronger positive correlation was displayed in darker red, and the negative correlation with deeper blue. |
Validation of Key Module and Functional Enrichment Analysis
The blue module exhibited the strongest positive correlation with severity of COVID-19 and were processed for further analysis (Figure 4A). To identify stable and robust hub genes accurately, a total of 217 critical genes were selected based on their significant correlation in both gene significance (GS) and module membership (MM). This selection was made by setting Gene-Significance >0.5, Module-Membership >0.8, as demonstrated in the scatterplots (Figure 4B). To deeper understand the potential function of those genes, GO enrichment analysis was conducted. These intersection genes were found to be significantly enriched in COVID-19 progression involved in biological processes (BP) such as cytokine mediated signaling pathway and positive regulation of cytokine production; cell components (CC) such as ficolin-1 rich granule and tertiary granule; molecular functions (MF) such as immune receptor activity and inhibitory MHC class I receptor activity (Figure 4C).
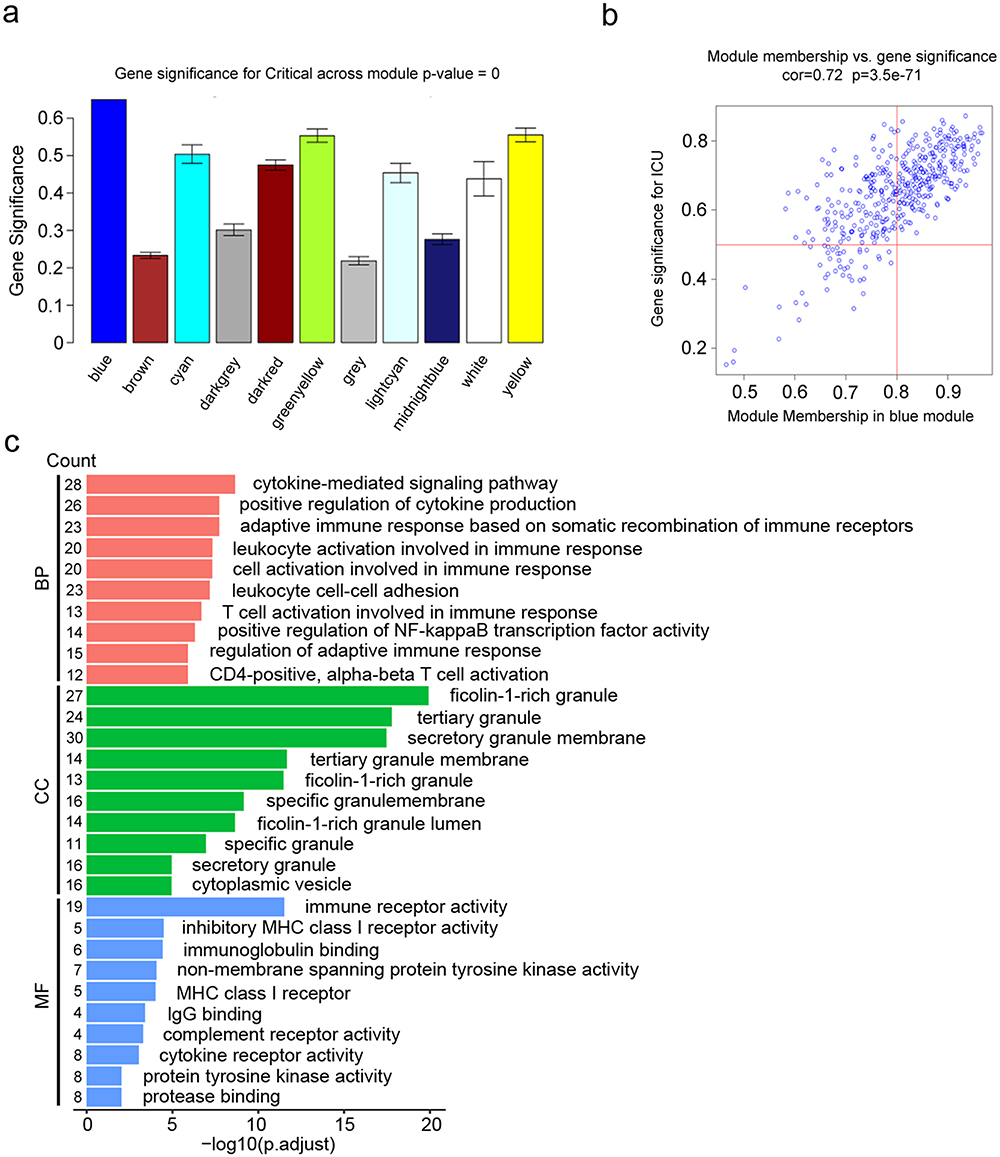 |
Figure 4 Validation of severity-related modules and functional enrichment analyses. (a) The blue module was the most positively associated with severity of COVID-19. (b) A scatterplot of Gene significance for COVID-19 severity vs Module Membership in blue module (Red line: Module-Membership > 0.8 and Gene-Significance > 0.5 were set to define genes that had the strongest positive correlation with disease severity). (c) Bar plot of GO enrichment analysis of genes from blue module. X-axis represents -log10 adjusted p-value. Y-axis represents different GO terms and gene counts. The red bars indicate biological process (BP) terms; the green bars indicate cellular component (CC) terms, and the blue bars indicate molecular function (MF) terms. |
Identification of Hub Genes
A total of 968 and 52 genes were obtained from DEGs (Healthy donors vs COVID-19; Non-critical vs Critical), and 217 genes were obtained from the key modules of WGCNA, respectively (Table 2). To identify co-expression genes between DEGs and WGCNA genes, we utilized a Venn diagram to determine the intersection of three gene sets. Consequently, we identified 12 overlapping genes that were selected as potential hub genes, indicating their significant involvement in the formation and progression of severe COVID-19 (Figure 5B).
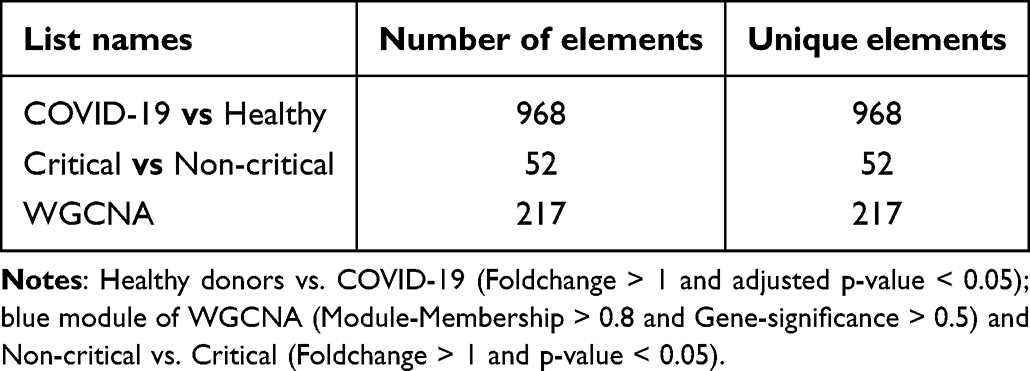 |
Table 2 Identification of the Intersection From the DEGs |
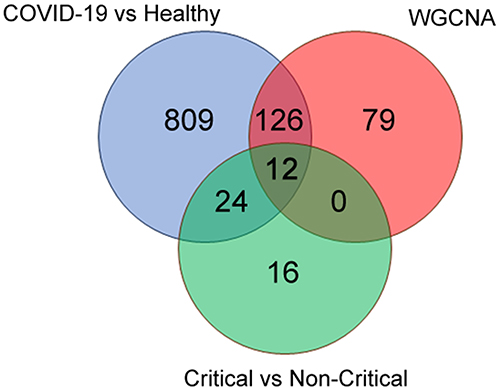 |
Figure 5 Key hub gene in severe progression of COVID-19. Venn diagram revealed 12 overlapping candidate hub genes. |
Validation of Potential Genes Linked to Disease Severity
To confirm the findings mentioned before, the expression levels of the aforementioned 12 hub genes were initially validated in two additional datasets (GSE172114 and GSE157103). The mRNA microarray dataset GSE172114 consists of 46 critical and 23 non-critical hospitalized COVID-19 patients. RNA-seq was performed on 69 whole blood RNA samples. The dataset GSE157103 consists of 50 critical and 50 non-critical COVID-19 patients. RNA-seq was conducted on 100 leukocyte RNA samples. The reconfirmed results showed that, in dataset GSE172114, MCEMP1, SCN9A, ANXA3, CD177, CACNA1E, IL-18R1, BMX, SOCS3, CDK5RAP2, ANKRD22, CD274, and FCGR1A were significantly highly expressed in critical COVID-19 group (Figure 6A and Supplementary Figure S3). However, in dataset GSE157103, the expressions of ANKRD22, CD274, and FCGR1A were not statistically significant between critical and non-critical group (Figure 6B and Supplementary Figure S3).
 |
Figure 6 Phase I validation: Candidate genes increased with disease severity. Validation of hub genes in the dataset GSE172114 and GSE157103. Nine candidate genes that highly expressed in critical COVID-19 patients from both validation sets were screened. (a) from GSE172114, and (b) from GSE157103. |
Candidate Genes Expression in Clinical Specimens from COVID-19 Patients
To further validate the findings of our bioinformatics research above, we conducted RT-PCR analysis on leukocyte samples acquired from 26 healthy donors, 31 patients with moderate COVID-19, and 39 patients with severe COVID-19. The average age of patients was over 70 years old. Therefore, this study is mainly aimed at elderly patients. The RT-PCR results indicated that the relative expression levels of MCEMP1, SCN9A, ANXA3, and CD177 were higher in COVID-19 patients than healthy donors (Figure 7A–D). Furthermore, the expression level of MCEMP1 mRNA increased with illness severity (Figure 7A). Nevertheless, there were no discernible differences in CACNA1E, IL-18R1, BMX, SOCS3, and CDK5RAP2 when plotted against disease severity (Figure 7E–I).
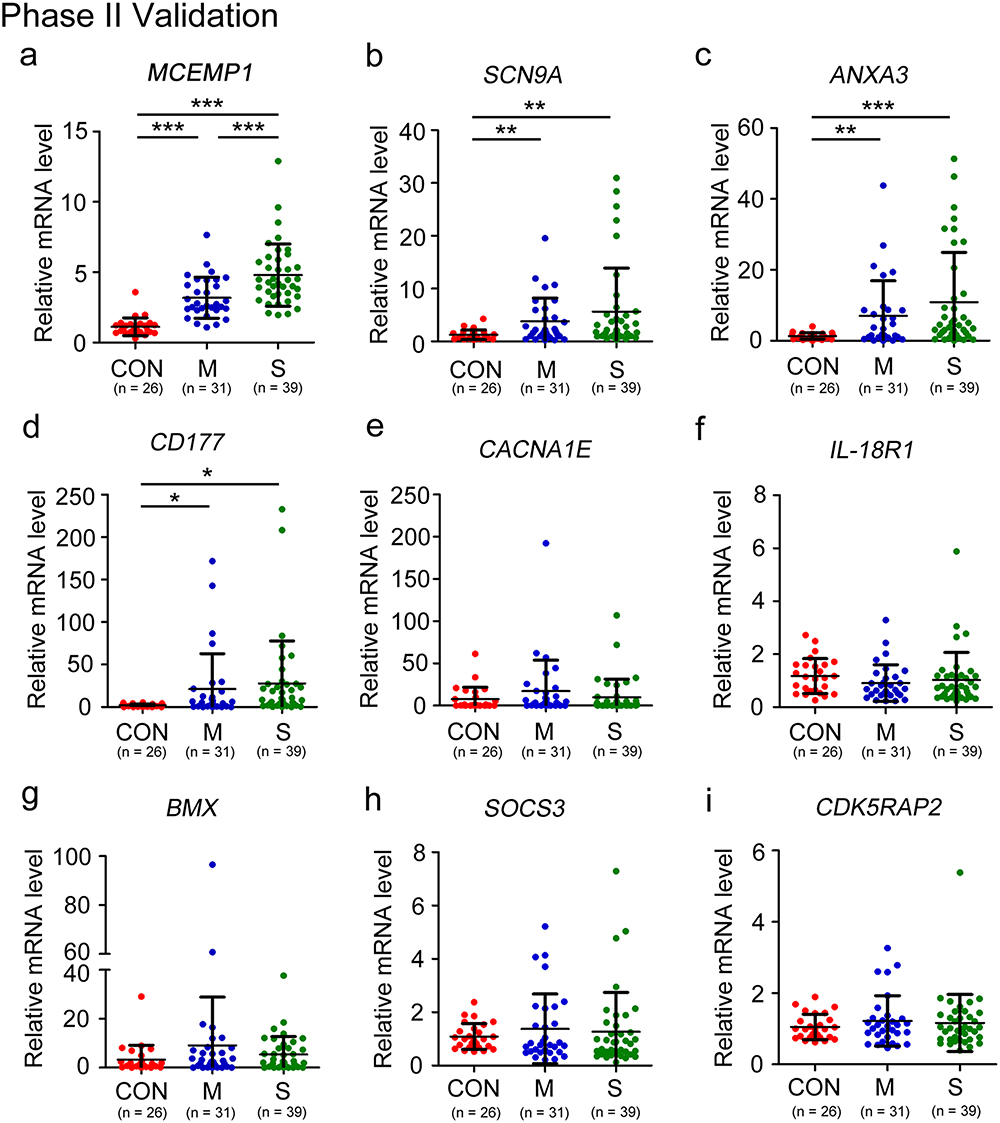 |
Figure 7 Phase II validation: The expression levels of nine hub genes in COVID-19 patients. The expression levels of (a) MCEMP1, (b) SCN9A, (c) ANXA3, (d) CD177, (e) CACNA1E, (f) IL-18R1, (g) BMX, (h) SOCS3, and (i) CDK5RAP2 mRNA in leukocyte obtained from healthy donors (n = 26), moderate patients (n = 31) and severe patients (n = 39) with COVID-19, and presented as scatter diagram. Statistical significance is determined by unpaired t-test. *P < 0.05, **P < 0.01, ***P < 0.001. |
Discussion
The pathophysiology and severity of COVID-19 exhibit variability among patients and depend partly on underlying host immunological state or risk factors. Although early vaccination and antiviral treatment have been effective in limiting the risk of developing severe or critical COVID-19, many patients still rapidly developed into respiratory failure, even acute respiratory distress syndrome (ARDS) or shock and require ICU management.18 Moreover, some studies indicated that patients who recovered from the severe form of the acute disease, eg, post intensive care syndrome, could also suffer long-term sequelae, which indicated that the return to their former health trajectory is slow and painful.19–21 Hence, identifying potential biomarkers capable of estimating severity and prognosis of COVID-19 may improve predictive accuracy and aid in clinical decision-making during the pandemic. Our research demonstrated that substantial alterations have occurred in COVID-19 patients based on blood samples, which are mainly characterized with excessive neutrophils activation and cytokine production.
Considering that each patient with COVID-19 is captured at different timepoints of infection and the discernible differences in immune response between acute and recovery phases,22 we selectively gathered and analyzed partial transcriptomics information from dataset GSE213313. As a result, we could capture snapshots of patients at early stages of their immune response and analyze the properties of whole-blood RNA during the acute phase. By combining microarray data obtained from healthy donors and patients with COVID-19, we identified 968 reliable DEGs. Notably, certain genes, including IFI27, OSA1, and ISG15, held more importance in terms of their impact on virus infection. Indeed, as well-known interferon-stimulated genes (ISGs), they have been reported widely in influenza-related studies.23 Similarly, we identified 52 robust DEGs from critical and non-critical patients with COVID-19. These hub genes were mostly associated with acute inflammatory response. Overall, it was suggested that inflammatory response after viral infections, especially, interferon signaling response, as a remarkable indicator, was involved in COVID-19 development.
Our study preliminarily revealed the alteration of immune cell infiltration subsequent to infection with SARS-COV-2. The fraction of neutrophils and macrophages was significantly higher, but the activated CD8+ T cells, central memory CD4+ T cells, and natural killer cells were all considerably diminished in COVID-19. These findings are predominantly consistent with other recent reports. An elevated absolute neutrophil count has been found to be predictive of ARDS and death in COVID-19.24,25 Severe COVID-19 patients had increased levels of neutrophil extracellular traps (NETs), which have been deemed as confirmed contributors to pathological inflammation of pneumonia.26 The absolute lymphocyte count is indicative of disease severity and mortality, since severe patients with COVID-19 have been shown to have significantly lower peripheral CD4+ and CD8+ T cells.25 The natural killer cells were also depleted and displayed an exhausted phenotype in severe patients.27 Overall, these observations indicate that a dysregulated host innate immune response associated with various immune cells could underlie the hyperinflammatory syndrome in COVID-19.28
Sepsis is an abnormal systemic inflammatory response of the host to infection.29 Some researchers proposed that severe COVID-19 could be defined as a sepsis caused by viral infection, also defined as “viral sepsis”.30,31 Therefore, novel biomarkers to diagnose “viral sepsis” might aid in the early identification of patients at risk of developing severe sepsis prior to organ damage, allow early intervention, and further reduce the risk of death. In our study, we observed that the hub genes MCEMP1, ANXA3, and CD177 were strongly up-regulated, which had been previously reported to be associated with sepsis.
Mcemp1
MCEMP1, a single-pass transmembrane protein, participates in regulating mast cell differentiation activities or immune responses.32 Mast cells exacerbate septic disease via interfering with phagocyte activity of resident macrophages and increasing the release of inflammatory cytokines,33 which is consistent with the hyperinflammatory responses noted in severe COVID-19. Some studies revealed that MCEMP1 could be served as a potential diagnosis marker for septic shock, and elevated MCEMP1 gene during the early phase of disease are predictive of severe COVID-19.34,35 As the upregulation of MCEMP1 is characteristic of myeloid-derived suppressor cells (MDSCs) which is a heterogeneous group of immature myeloid cells possessing potent immunosuppressive activities. Besides serving as potential early prognostic biomarkers for severe COVID-19 progression, several studies have also indicated the functional roles of MDSCs in severe COVID-19 pathogenesis and possibly even long COVID-19. Given the potential links between MDSCs and severe COVID-19, MDSCs are capable of suppressing various immune cell types such as B, NK, and in particular, T cells. MDSCs can exert their immunosuppressive activities through the depletion of arginine, tryptophan, and cystine/cysteine availability, the induction of Treg cells, RNS/ROS, the induction of T cell apoptosis via Fas/FasL interaction, the production of inhibitory cytokines, and PD-1/PD-L1 interaction. MDSCs can produce reactive nitrogen species (RNS) such as nitric oxide through inducible nitric oxide synthase (iNOS). These NO• released by MDSCs can react with superoxide (O2•−) to form peroxynitrite (ONOO-). MDSCs can also produce reactive oxygen species (ROS) such as superoxide through NADPH oxidase 2 (NOX2).36 Consequently, all of the results together suggest that MCEMP1 may be a key molecule in the regulation and maintenance of the bacterial or viral sepsis and it was worthy of additional investigation and development.
Annexin A3
Annexin A3 (ANXA3 encoding protein), also known as lipoprotein 3, is a member of the calcium‐binding protein family.37 A transcriptomic study of circulating neutrophils reported that ANXA3 abundance increased significantly throughout the course of sepsis.38 Considering the fact that ANXA3 expression is almost exclusive to neutrophils among circulating leucocytes, it may have potential effects on the host by facilitating neutrophil microbicidal function and pathogen clearance during sepsis.39 ANXA3 could potentially contribute to inflammatory-induced lung damage in COVID-19 through the activation of nuclear factor-kappa B (NF-κB). This is because NF-κB plays a crucial role in inflammation and inhibiting the NF-κB pathway by upregulating IκBα has been observed with ANXA3 knockdown.40 NF-κB is also activated by oxidative stress, which is common in COVID-19.41
CD177
CD177 was regarded as a prototypical gene for indicating neutrophil activation state because CD177 is a gene exclusive to neutrophils that encoding a membrane glycoprotein.42 Of note, it was also one of the highest DEGs in severe influenza infection.43 CD177 protein and mRNA expression increased in circulating neutrophils of patients who had experienced septic shock.44 Additionally, the combination of CD177 with genes IL1R2, OLFM4, and RETN has been identified as a possible prognostic predictor in sepsis patients, and it also has more advantages in predicting mortality compared with classical risk scales.45 The contribution of CD177 to the pathophysiology of COVID-19 may be attributed to its role as a signature for neutrophil activation. This activation is characterized by the homing of activated neutrophils toward infected lung tissue in acute lung injury.46,47 Subsequent to this homing process, aggressive responses are initiated, accompanied by the release of neutrophil extracellular traps (NETs), leading to an oxidative burst and the initiation of thrombus formation.48 Coagulopathy is associated with severity of COVID-19 which is characterized by high levels of D-dimer.48 Elevated CD177 mRNA expression has also been documented in patients with acute Kawasaki Disease (KD),49 and in individuals resistant to intravenous immunoglobulin (IV Ig) therapy.50 KD is a syndrome recognized as a potential complication of SARS-CoV-2 infection in children.51
Transcriptomics studies have recently gained detailed gene expression profiles of COVID-19 and reported that ANXA3 and CD177 were associated with COVID-19 severity and mortality.52,53 However, these results were solely derived from a single cohort study or lacked further clinical confirmation. In the study, we found that the ANXA3 and CD177 tended to be higher in patients with COVID-19 compared to healthy donors, which indicated that ANXA3 and CD177 were two valid hallmarks of the physiopathology of COVID-19.
In addition, SCN9A gene encoding voltage-gated sodium channels are a critical component in human pain perception.54 We found that the expression level of SCN9A gene increased in patients during the acute phase of SARS-COV-2. However, no significant differences between moderate and severe patients were observed. As of yet, the mechanisms account for elevated mRNA levels of SCN9A in COVID-19 are unknown, and the phenomenon and its causes deserve additional investigation.
Some limitations and disadvantages in the study are worth considering. First, the establishment of the generalizability of these potential biomarker genes across diverse populations necessitates the implementation of validation studies. Our limited clinical sample size might increase the standard error of variables. Second, despite the fact that the vaccination rate in the population was almost 90% at the time, the specific vaccination status of the enrolled patients was unclear. This may affect the results of tests. Finally, it is yet uncertain if the modulation of these potential biomarker genes was specific for SARS-COV-2 infection. The possible regulatory mechanisms should be elucidated through further investigation, such as controlled animal trials.
Conclusion
In summary, our comprehensive bioinformatics analysis results showed that considerable change occurred in patients with COVID-19 and neutrophils activation was typical characteristics after SARS-COV-2 infection. Several hub genes were related to excessive neutrophil activation, and cytokine-mediated signaling pathway. Moreover, further confirmation with another two datasets and clinical samples revealed MCEMP1, ANXA3, CD177, and SCN9A were potential diagnostic markers of COVID-19. Particularly, MCEMP1, as clinical potential indicator, could reflect disease severity of COVID-19. Overall, understanding the biology and functional significance of the newly discovered hub genes involved in COVID-19 development provides insights into the molecular mechanisms linked to disease severity. They could also facilitate risk stratification and early identification of patients who are more susceptible to developing severe symptoms. These findings will contribute to intensifying monitoring or treatment interventions for patients with COVID-19 at high-risk.
Data Sharing Statement
These datasets can be found in public database: GSE213313 (https://www.ncbi.nlm.nih.gov/geo/query/acc.cgi?acc=GSE213313), GSE172114 (https://www.ncbi.nlm.nih.gov/geo/query/acc.cgi?acc=GSE172114), and GSE157103 (https://www.ncbi.nlm.nih.gov/geo/query/acc.cgi?acc=GSE157103).
Ethics Approval and Consent to Participate
The study was conducted in accordance with the Declaration of Helsinki and approved by the ethics committee of Shandong provincial hospital (approval No. 2023-805). A written informed consent to participate in this study was obtained from all participants.
Supplementary Information
Additional supplementary information: the supplemental data consist of one table and three figures.
Funding
This research was funded by the Natural Science Foundation of China (Grant NO.82200014) and the Natural Science Foundation of Shandong Province (Grant NO. ZR2022QH216).
Disclosure
The authors declare that no potential conflict of interest exists in the submission of this manuscript.
References
1. World Health Organization. World Health Organization Coronavirus (COVID-19) Dashboard; 2023. Available from: https://covid19whoint/.
2. Jiang L, Tang L, Zhu L, et al. Viral dynamics during SARS-CoV-2 omicron infection highlight presymptomatic and asymptomatic infectiousness. J Infect. 2023;86(5):537–539. doi:10.1016/j.jinf.2022.11.026
3. Yang X, Yu Y, Xu J, et al. Clinical course and outcomes of critically ill patients with SARS-CoV-2 pneumonia in Wuhan, China: a single-centered, retrospective, observational study. Lancet Respir Med. 2020;8(5):475–481. doi:10.1016/S2213-2600(20)30079-5
4. Lucas C, Wong P, Klein J, et al. Longitudinal analyses reveal immunological misfiring in severe COVID-19. Nature. 2020;584(7821):463–469. doi:10.1038/s41586-020-2588-y
5. Cao Y, Xu X, Kitanovski S, et al. Comprehensive Comparison of RNA-Seq Data of SARS-CoV-2, SARS-CoV and MERS-CoV infections: alternative entry routes and innate immune responses. Front Immunol. 2021;12:656433. doi:10.3389/fimmu.2021.656433
6. Smail SW, Babaei E, Amin K, Abdulahad WH. Serum IL-23, IL-10, and TNF-α predict in-hospital mortality in COVID-19 patients. Front Immunol. 2023;14:1145840. doi:10.3389/fimmu.2023.1145840
7. Sette A, Crotty S. Adaptive immunity to SARS-CoV-2 and COVID-19. Cell. 2021;184(4):861–880. doi:10.1016/j.cell.2021.01.007
8. Schultze JL, Aschenbrenner AC. COVID-19 and the human innate immune system. Cell. 2021;184(7):1671–1692. doi:10.1016/j.cell.2021.02.029
9. Nasrollahi H, Talepoor AG, Saleh Z, et al. Immune responses in mildly versus critically ill COVID-19 patients. Front Immunol. 2023;14:1077236. doi:10.3389/fimmu.2023.1077236
10. Wilk AJ, Rustagi A, Zhao NQ, et al. A single-cell atlas of the peripheral immune response in patients with severe COVID-19. Nature Med. 2020;26(7):1070–1076. doi:10.1038/s41591-020-0944-y
11. Battaglini D, Lopes-Pacheco M, Castro-Faria-Neto HC, Pelosi P, Rocco PRM. Laboratory biomarkers for diagnosis and prognosis in COVID-19. Front Immunol. 2022;13:857573. doi:10.3389/fimmu.2022.857573
12. Aschenbrenner AC, Mouktaroudi M, Krämer B, et al. Disease severity-specific neutrophil signatures in blood transcriptomes stratify COVID-19 patients. Gen Med. 2021;13(1):7. doi:10.1186/s13073-020-00823-5
13. Meizlish ML, Pine AB, Bishai JD, et al. A neutrophil activation signature predicts critical illness and mortality in COVID-19. Blood Adv. 2021;5(5):1164–1177. doi:10.1182/bloodadvances.2020003568
14. Tan L, Wang Q, Zhang D, et al. Lymphopenia predicts disease severity of COVID-19: a descriptive and predictive study. Signal Transduct Target Ther. 2020;5(1):33. doi:10.1038/s41392-020-0148-4
15. Prebensen C, Lefol Y, Myhre PL, et al. Longitudinal whole blood transcriptomic analysis characterizes neutrophil activation and interferon signaling in moderate and severe COVID-19. Sci Rep. 2023;13(1):10368. doi:10.1038/s41598-023-37606-y
16. Langfelder P, Horvath S. WGCNA: an R package for weighted correlation network analysis. BMC Bioinf. 2008;9(1):559. doi:10.1186/1471-2105-9-559
17. National Health Commission & National Administration of Traditional Chinese Medicine. Diagnosis and treatment protocol for novel coronavirus pneumonia (Trial Version 7). Chinese Med J. 2020;133(9):1087–1095. doi:10.1097/CM9.0000000000000819
18. Li X, Xu S, Yu M, et al. Risk factors for severity and mortality in adult COVID-19 inpatients in Wuhan. J Allergy Clin Immunol. 2020;146(1):110–118. doi:10.1016/j.jaci.2020.04.006
19. Desai AD, Lavelle M, Boursiquot BC, Wan EY. Long-term complications of COVID-19. Am J Physiol Cell Physiol. 2022;322(1):C1–c11. doi:10.1152/ajpcell.00375.2021
20. Huang L, Li X, Gu X, et al. Health outcomes in people 2 years after surviving hospitalisation with COVID-19: a longitudinal cohort study. Lancet Respir Med. 2022;10(9):863–876. doi:10.1016/S2213-2600(22)00126-6
21. Blanco JR, Cobos-Ceballos MJ, Navarro F, et al. Pulmonary long-term consequences of COVID-19 infections after hospital discharge. Clin Microbiol Infect. 2021;27(6):892–896. doi:10.1016/j.cmi.2021.02.019
22. Rodriguez L, Pekkarinen PT, Lakshmikanth T, et al. Systems-level immunomonitoring from acute to recovery phase of severe COVID-19. Cell Rep Med. 2020;1(5):100078. doi:10.1016/j.xcrm.2020.100078
23. Liu S, Huang Z, Deng X, et al. Identification of key candidate biomarkers for severe influenza infection by integrated bioinformatical analysis and initial clinical validation. J Cell Mol Med. 2021;25(3):1725–1738. doi:10.1111/jcmm.16275
24. Del Valle DM, Kim-Schulze S, Huang HH, et al. An inflammatory cytokine signature predicts COVID-19 severity and survival. Nature Med. 2020;26(10):1636–1643. doi:10.1038/s41591-020-1051-9
25. Zhou F, Yu T, Du R, et al. Clinical course and risk factors for mortality of adult inpatients with COVID-19 in Wuhan, China: a retrospective cohort study. Lancet. 2020;395(10229):1054–1062. doi:10.1016/S0140-6736(20)30566-3
26. Cesta MC, Zippoli M, Marsiglia C, et al. Neutrophil activation and neutrophil extracellular traps (NETs) in COVID-19 ARDS and immunothrombosis. Eur J Immunol. 2023;53(1):e2250010. doi:10.1002/eji.202250010
27. Zheng M, Gao Y, Wang G, et al. Functional exhaustion of antiviral lymphocytes in COVID-19 patients. Cell. Mol. Immunol. 2020;17(5):533–535. doi:10.1038/s41423-020-0402-2
28. Gustine JN, Jones D. Immunopathology of Hyperinflammation in COVID-19. Am J Pathol. 2021;191(1):4–17. doi:10.1016/j.ajpath.2020.08.009
29. Barichello T, Generoso JS, Singer M, Dal-Pizzol F. Biomarkers for sepsis: more than just fever and leukocytosis-a narrative review. Critical Care. 2022;26(1):14. doi:10.1186/s13054-021-03862-5
30. Li H, Liu L, Zhang D, et al. SARS-CoV-2 and viral sepsis: observations and hypotheses. Lancet. 2020;395(10235):1517–1520. doi:10.1016/S0140-6736(20)30920-X
31. Bruse N, Kooistra EJ, Jansen A, et al. Clinical sepsis phenotypes in critically ill COVID-19 patients. Critical Care. 2022;26(1):244. doi:10.1186/s13054-022-04118-6
32. Li K, Wang SW, Li Y, et al. Identification and expression of a new type II transmembrane protein in human mast cells. Genomics. 2005;86(1):68–75. doi:10.1016/j.ygeno.2005.03.006
33. Dahdah A, Gautier G, Attout T, et al. Mast cells aggravate sepsis by inhibiting peritoneal macrophage phagocytosis. J Clin Invest. 2014;124(10):4577–4589. doi:10.1172/JCI75212
34. Kong C, Zhu Y, Xie X, Wu J, Qian M. Six potential biomarkers in septic shock: a deep bioinformatics and prospective observational study. Front Immunol. 2023;14:1184700. doi:10.3389/fimmu.2023.1184700
35. Chan KR, Koh CWT, Ng DH, et al. Early peripheral blood MCEMP1 and HLA-DRA expression predicts COVID-19 prognosis. EBioMedicine. 2023;89:104472. doi:10.1016/j.ebiom.2023.104472
36. Len JS, Koh CWT, Chan KR. The functional roles of MDSCs in Severe COVID-19 pathogenesis. Viruses. 2023;16(1):27. doi:10.3390/v16010027
37. Gerke V, Moss SE. Annexins: from structure to function. Physiol Rev. 2002;82(2):331–371. doi:10.1152/physrev.00030.2001
38. Toufiq M, Roelands J, Alfaki M, et al. Annexin A3 in sepsis: novel perspectives from an exploration of public transcriptome data. Immunology. 2020;161(4):291–302. doi:10.1111/imm.13239
39. Yamanegi K, Yamada N, Nakasho K, Nishiura H. Participation of delta annexin A3 in the ribosomal protein S19 C-terminus-dependent inhibitory mechanism of the neutrophil C5a receptor through delta lactoferrin. Pathol Int. 2018;68(2):109–116. doi:10.1111/pin.12626
40. Du R, Liu B, Zhou L, et al. Downregulation of annexin A3 inhibits tumor metastasis and decreases drug resistance in breast cancer. Cell Death Dis. 2018;9(2):126. doi:10.1038/s41419-017-0143-z
41. Smail SW, Babaei E, Amin K. Hematological, inflammatory, coagulation, and Oxidative/antioxidant biomarkers as predictors for severity and mortality in COVID-19: a prospective cohort-study. Int J Gene Med. 2023;16:565–580. doi:10.2147/IJGM.S402206
42. Mulet M, Osuna-Gómez R, Zamora C, et al. Dysregulated neutrophil extracellular traps formation in sepsis. Immunology. 2023;170(3):374–387. doi:10.1111/imm.13676
43. Tang BM, Shojaei M, Teoh S, et al. Neutrophils-related host factors associated with severe disease and fatality in patients with influenza infection. Nat Commun. 2019;10(1):3422. doi:10.1038/s41467-019-11249-y
44. Demaret J, Venet F, Plassais J, et al. Identification of CD177 as the most dysregulated parameter in a microarray study of purified neutrophils from septic shock patients. Immunol Lett. 2016;178:122–130. doi:10.1016/j.imlet.2016.08.011
45. Martínez-Paz P, Aragón-Camino M, Gómez-Sánchez E, et al. Gene expression patterns distinguish mortality risk in patients with postsurgical shock. J Clin Med. 2020;9(5):1276. doi:10.3390/jcm9051276
46. Juss JK, House D, Amour A, et al. Acute respiratory distress syndrome neutrophils have a distinct phenotype and are resistant to phosphoinositide 3-kinase inhibition. Am J Respir Crit Care Med. 2016;194(8):961–973. doi:10.1164/rccm.201509-1818OC
47. Smail SW, Babaei E, Amin K. Demographic, clinical and genetic factors associated with COVID-19 disease susceptibility and mortality in a Kurdish population. Ann Saudi Med. 2023;43(3):125–142. doi:10.5144/0256-4947.2023.125
48. Darbousset R, Thomas GM, Mezouar S, et al. Tissue factor-positive neutrophils bind to injured endothelial wall and initiate thrombus formation. Blood. 2012;120(10):2133–2143. doi:10.1182/blood-2012-06-437772
49. Huang WD, Lin YT, Tsai ZY, et al. Association between maternal age and outcomes in Kawasaki disease patients. Pediatr Rheumatol Online J. 2019;17(1):46. doi:10.1186/s12969-019-0348-z
50. Jing Y, Ding M, Fu J, Xiao Y, Chen X, Zhang Q. Neutrophil extracellular trap from Kawasaki disease alter the biologic responses of PBMC. Biosci Rep. 2020;40(9). doi:10.1042/BSR20200928
51. Toubiana J, Poirault C, Corsia A, et al. Kawasaki-like multisystem inflammatory syndrome in children during the covid-19 pandemic in Paris, France: prospective observational study. BMJ. 2020;369:m2094. doi:10.1136/bmj.m2094
52. Lévy Y, Wiedemann A, Hejblum BP, et al. CD177, a specific marker of neutrophil activation, is associated with coronavirus disease 2019 severity and death. iScience. 2021;24(7):102711. doi:10.1016/j.isci.2021.102711
53. Fuzo CA, Fraga-Silva TFC, Maruyama SR, et al. The turning point of COVID-19 severity is associated with a unique circulating neutrophil gene signature. Immunology. 2023;169(3):323–343. doi:10.1111/imm.13631
54. Bennett DL, Clark AJ, Huang J, Waxman SG, Dib-Hajj SD. The role of voltage-gated sodium channels in pain signaling. Physiol Rev. 2019;99(2):1079–1151. doi:10.1152/physrev.00052.2017
 © 2024 The Author(s). This work is published and licensed by Dove Medical Press Limited. The
full terms of this license are available at https://www.dovepress.com/terms
and incorporate the Creative Commons Attribution
- Non Commercial (unported, 3.0) License.
By accessing the work you hereby accept the Terms. Non-commercial uses of the work are permitted
without any further permission from Dove Medical Press Limited, provided the work is properly
attributed. For permission for commercial use of this work, please see paragraphs 4.2 and 5 of our Terms.
© 2024 The Author(s). This work is published and licensed by Dove Medical Press Limited. The
full terms of this license are available at https://www.dovepress.com/terms
and incorporate the Creative Commons Attribution
- Non Commercial (unported, 3.0) License.
By accessing the work you hereby accept the Terms. Non-commercial uses of the work are permitted
without any further permission from Dove Medical Press Limited, provided the work is properly
attributed. For permission for commercial use of this work, please see paragraphs 4.2 and 5 of our Terms.
Recommended articles
Transcriptome Analysis Identifies Biomarkers for the Diagnosis and Management of Psoriasis Complicated with Depression
Xia X, Yu H, Li Y, Liang Y, Li G, Huang F
Clinical, Cosmetic and Investigational Dermatology 2023, 16:1287-1301
Published Date: 18 May 2023
Identification of Key Genes and Pathways in Oxaliplatin-Induced Neuropathic Pain Through Bioinformatic Analysis
Lou Y, Xu X, Wang R, Yao D
Journal of Pain Research 2024, 17:1639-1650
Published Date: 3 May 2024
Weighted Gene Coexpression Network Analysis Identifies Neutrophil-Related Molecular Subtypes and Their Clinical Significance in Gastric Cancer
Chen C, Shao Y, Ye C, Yu X, Hu M, Yan J, Ye G
Cancer Management and Research 2025, 17:397-418
Published Date: 28 February 2025
The Comprehensive Analysis of Weighted Gene Co-Expression Network Analysis and Machine Learning Revealed Diagnostic Biomarkers for Breast Implant Illness Complicated with Breast Cancer
Huang Z, Wang H, Pang H, Zeng M, Zhang G, Liu F
Breast Cancer: Targets and Therapy 2025, 17:305-324
Published Date: 10 April 2025
Identification and Validation of Aging-Related Genes in IgA Nephropathy in the Asian Population

Shu J, Li H, Li H
International Journal of General Medicine 2025, 18:3851-3870
Published Date: 12 July 2025