Back to Journals » International Journal of General Medicine » Volume 15
Integrated Analysis of Microarray Studies to Identify Novel Diagnostic Markers in Bladder Pain Syndrome/Interstitial Cystitis with Hunner Lesion
Authors Cheng XF, Zeng ZH, Deng W, Liu YF, Zhou XC, Zhang C, Wang GX
Received 2 December 2021
Accepted for publication 4 March 2022
Published 19 March 2022 Volume 2022:15 Pages 3143—3154
DOI https://doi.org/10.2147/IJGM.S351287
Checked for plagiarism Yes
Review by Single anonymous peer review
Peer reviewer comments 3
Editor who approved publication: Dr Scott Fraser
Xiao-Feng Cheng,* Zhen-Hao Zeng,* Wen Deng, Yi-Fu Liu, Xiao-Chen Zhou, Cheng Zhang, Gong-Xian Wang
Department of Urology, The First Affiliated Hospital of Nanchang University, Nanchang City, People’s Republic of China
*These authors contributed equally to this work
Correspondence: Gong-Xian Wang, Department of Urology, The First Affiliated Hospital of Nanchang University, Nanchang City, 330000, Jiangxi Province, People’s Republic of China, Email [email protected]
Background: The aim of this study was to identify novel genetic features of Hunner’s lesion interstitial cystitis (HIC) via comprehensive analysis of the Gene Expression Omnibus (GEO) database.
Methods: The GSE11783 and GSE28242 datasets were downloaded from GEO for further analysis. Differentially expressed genes (DEGs) were identified and analyzed for functional annotation. The diagnostic markers for HIC were screened and validated using the least absolute shrinkage and selection operator (LASSO) logistic regression and support vector machine recursive feature elimination (SVM-RFE) algorithms. Finally, the cell-type identification by estimating relative subsets of RNA transcripts (CIBERSORT) algorithm was adopted to investigate the correlation between immune cell infiltration and diagnostic markers in HIC.
Results: A total of 7837 DEGs were identified in GSE11783 and 1583 DEGs in GSE28242. Venn diagrams were used to obtain 16 overlapping upregulated and 67 overlapping downregulated DEGs separately. The LASSO logistic model and SVM-RFE algorithm were used to identify 6 genes including KRT20, SLFN11, CD86, ITGA4, PLAC8, and BTN3A3 from DEGs as diagnostic markers for HIC. Their diagnostic potential in HIC and bladder pain syndrome/interstitial cystitis (BPS/IC) were acceptable. PLAC8 exhibited the best diagnostic performance in BPS/IC with an area under the curve of 0.916. The results of immune infiltration involving GSE11783 revealed that the plasma cell ratio (p = 0.017), activated memory CD4+ T cells (p = 0.009), activated dendritic cells (p = 0.01), eosinophils (p = 0.004), and neutrophils (p = 0.03) were significantly higher in HIC than in normal samples, in contrast to resting mast cells (p = 0.022). A positive correlation existed between diagnostic markers and infiltrating immune cells.
Conclusion: KRT20, SLFN11, CD86, ITGA4, PLAC8, and BTN3A3 represent novel and potent diagnostic markers for HIC. They also exhibit certain diagnostic potential in BPS/IC. Immune cell infiltration might play a key role in the pathogenesis and progression of BPS/IC.
Keywords: interstitial cystitis, Hunner’s lesion, immune cells, diagnostic marker, Gene Expression Omnibus
Introduction
Bladder pain syndrome/interstitial cystitis (BPS/IC) is a prevalent pain syndrome predominantly affecting females. The symptoms of BPS include disrupted urine storage and pelvic pain. Due to different terms used to describe this condition and the different diagnostic criteria, the prevalence of BPS/IC is highly variable. In the United States, the reported prevalence ranged from an estimated 2.7% to 6.5% among females aged 18 years and older1 and 1.9% to 4.2% among all males.2 Based on the typical findings of the cystoscopy examination, such as pathognomonic Hunner’s lesions (HL) in the bladder wall, the IC terminology was first used by Skene in 1887. The standard definition of all currently accepted BPS/IC is pain syndrome mainly perceived as related to the bladder, which is not secondary to other causes, with co-existing lower urinary tract symptoms such as urinary urgency and frequency.
However, the pathophysiologic mechanisms underlying BPS/IC are still largely unknown. The risk factors for BPS/IC are multiple, including depression, functional somatic disorders, asthma, autoimmune diseases, rheumatoid, and inflammatory bowel disease. Several theories have been attempted to explain the mechanism underlying this condition. According to one of the widely accepted theories, an initial damage or defect in the bladder mucosa triggers chronic inflammatory state. It is extremely difficult to diagnose BPS/IC. The differential diagnosis includes overactive bladder, vesical stones, bladder cancer, and urethral diverticula. Studies of BPS/IC are hindered by the lack of uniform definition and the absence of a validated diagnostic marker. Simultaneously, the efficacy of most treatments for BPS/IC is limited by inadequate insight into the etiology and pathogenesis of the disease. In 2004, the European Society for the Study of Interstitial Cystitis (ESSIC) described the standards for patient evaluation.3 IC/BPS has been subdivided into Hunner’s lesion interstitial cystitis (HIC) and non-Hunner lesion bladder pain syndrome and interstitial cystitis (NH-BPS/IC) according to cystoscopy and biopsy findings.4 Hunner’s lesion was defined by ESSIC as “a circumscript, reddened mucosal area with small vessels radiating towards a central scar … ”.5 Patients diagnosed with HL were also designated as type 3C in this system. Different types respond differently to various treatments. For example, cyclosporine A is effective in treating HIC with limited efficacy in NH-BPS/IC.6
Therefore, the purpose of this study was to identify novel gene signatures of HIC via integrated analysis of several microarray studies to further screen diagnostic markers for IC/BPS and to explore the underlying etiological mechanisms to some extent.
Materials and Methods
Microarray Datasets of BPS/IC
We retrieved the appropriate BPS/IC gene expression dataset from the Gene Expression Omnibus (GEO) database (https://www.ncbi.nlm.nih.gov/geo/). We systematically searched the microarray studies using the terms: “Interstitial cystitis,” “Bladder pain syndrome,” “Gene expression,” “Homo sapiens,” and “Microarray.” Datasets were selected according to the following eligibility criteria: (1) Raw data or gene expression profiling by array available in GEO; (2) including cases of HIC and controls.
Dataset Analyses and Screening of Differentially Expressed Genes (DEGs)
First, we downloaded the HIC gene expression matrix and associated annotation files from the GEO database and mapped the microarray probes to gene symbols using the corresponding annotation files. If multiple probes were mapped to the same gene symbol, the mean value was adopted. The datasets were evaluated for quality and raw data were normalized by quantiles if needed. The inter-batch difference was removed using the ComBat method of the “sva” R package as needed. DEGs between HIC tissue and normal control bladder tissue were determined in each microarray using “limma” R package. The |log2 fold change (FC)| > 1 and p-value < 0.05 were used as the cut-off criteria to determine DEGs.
Functional Enrichment Analysis
The “clusterProfiler” R package is regarded as the most common functional annotation tool used in Gene Ontology (GO) functional enrichment analysis and Kyoto Encyclopedia of Genes and Genomes (KEGG) pathway analysis.7 We uploaded the significant genes for DEG analysis to investigate their potential functions. A p-value < 0.05 and a false discovery rate (FDR) < 0.05 are considered as significant enrichment.
Protein–Protein Interaction (PPI) Network Analysis
We uploaded the overlapping upregulated and downregulated DEGs genes of both datasets to the STRING database (http://www.string-db.org/) and then selected genes with confidence > 0.4 for PPI network analysis.8 We used Cytoscape software to map the PPI network of the STRING database. Each node in Cytoscape represents a gene or protein, and the edges between nodes represent molecular interactions.
Screening and Verification of Diagnostic Markers
The least absolute shrinkage and selection operator (LASSO) logistic regression9 and support vector machine recursive feature elimination (SVM-RFE) algorithms10 were used for feature selection and screening of diagnostic markers for HIC. The quality of the expression matrices GSE11783 and GSE28242 datasets was controlled. The HIC and control data were extracted and merged into an independent dataset. The joint diagnostic efficiency of the diagnostic markers obtained was verified based on this independent and full combined dataset. The LASSO algorithm was employed with the “glmnet” R package.11 Besides, SVM-RFE is a machine learning method based on a support vector machine, which is used to identify the best variables by deleting SVM generated eigenvectors. The SVM module was established to further determine the diagnostic value of these biomarkers in IC using the “e1071” R package.12 Eventually, we combined the genes analyzed using either LASSO or SVM-RFE algorithm for further investigation.
Analysis of Immune Infiltration and Correlation of Diagnostic Markers
The R language source code of the cell-type identification by estimating relative subsets of RNA transcripts (CIBERSORT) software was available from the CIBERSORT database, so the immune cell infiltration data matrix was obtained using the code and p < 0.05 as a filter criterion. Only the GSE11783 dataset was adopted for the analysis of immune cell infiltration; however, the GSE28242 dataset was not included because the sample was derived from urine sediment. Principal component analysis (PCA) was further performed using the “ggplot2” R package and a two-dimensional PCA clustering plot was drawn. Meanwhile, violin plots were visualized to display the differences in immune cell infiltration. Spearman correlation analysis of diagnostic markers and infiltrating immune cells was performed using the “psych” package, and the “ggplot2” package was used to visualize the results.
Results
Dataset Screening and Identification of DEGs
A total of 5 BPS/IC–related datasets were retrieved from the GEO database, of which only GSE11783, GSE28242, and GSE57560 datasets containing cases of BPS/IC associated with Henner’s lesions were included according to the established inclusion criteria. However, the GSE57560 dataset failed to reveal the profiles of specific HIC patients, and therefore excluded from further analyses. The quality of both GSE11783 and GSE28242 datasets was further assessed. The GSE11783 datasets included 10 BPS/IC samples (5 samples without HL and 5 samples with HL) and 6 non-BPS/IC samples, while the GSE28242 datasets included 8 BPS/IC samples (5 samples without HL and 3 samples with HL) as well as 5 non-BPS/IC samples. To eliminate individual differences between samples, the GSE11783 microarray dataset was first standardized by quantiles. The inter-batch difference of GSE11783 was also eliminated using the ComBat method. Homogeneity of all samples in each dataset was accepted. DEGs were filtered out using the “limma” package in R based on the screening criteria. Volcano plots of the two microarray DEGs are shown in Figure 1A and B.
 |
Figure 1 Volcano plot, Venn diagram, and expression heatmaps of DEGs in GSE11783 and GSE28242 datasets. (A) Volcano plot of DEGs in GSE11783; (B) volcano plot of DEGs in GSE28242; (C) Venn diagram of overlapping upregulated DEGs; (D) Venn diagram of overlapping downregulated DEGs; (E) expression heatmaps of overlapping DEGs. Abbreviation: DEGs, differentially expressed genes. |
The GSE11783 included 7837 DEGs and the GSE28242 included 1583 DEGs. Among the DEGs derived from the two GEO datasets, we obtained 16 overlapping upregulated (Figure 1C) and 67 overlapping downregulated (Figure 1D) DEGs, respectively, using Venn diagrams. Expression heatmaps of overlapping DEGs were also drawn using the expression data derived from GSE28242 and GSE11783 datasets (Figure 1E). These plots show that the expression of the selected genes varied significantly between the HIC group and the control group.
Functional Annotation and PPI Network Analysis of DEGs
The 83 DEGs (16 upregulated genes and 67 downregulated genes) were uploaded for GO and KEGG analysis. The results of GO analysis revealed that leukocyte migration (GO:0050900; p-value = 2.38e-05) was the most enriched, followed by MHC class II protein complex (GO:0042613; p-value = 6.30e-05), MHC protein complex (GO:0042611; p-value = 2.13e-04), and others (Table 1 and Figure 2A). In addition, KEGG pathway enrichment analysis indicated that Staphylococcus aureus infection (hsa05150; p-value = 1.03e-07), intestinal immune network for IgA production (hsa04672; p-value = 8.01e-06), and rheumatoid arthritis (hsa05323, p-value =1.37e-05) were significantly enriched as shown in Table 1 and Figure 2A.
 |
Table 1 GO and KEGG Analysis of DEGs Associated with HIC |
 |
Figure 2 GO, KEGG, and PPI network analysis of DEGs. (A) GO enrichment and KEGG analysis, with the horizontal axis representing −log10 (p.adjust) under the GO and KEGG terms. (B) The PPI network of DEGs in HIC (STRING). Abbreviations: BP, biological process; CC, cellular components; DEGs, differentially expressed genes; GO, Gene Ontology; KEGG, Kyoto Encyclopedia of Genes and Genomes; MF, molecular function; PPI, protein–protein interaction. |
PPI network analysis of DEGs was performed with the STRING database, and the results were visualized using Cytoscape software. The connections between nodes in the PPI analysis were visualized to determine the interactions between proteins encoded by DEGs in the HIC (Figure 2B).
Screening and Verification of Diagnostic Markers
The LASSO logistic regression algorithm was adopted to identify 9 genes from DEGs as diagnostic markers of HIC, namely SPINK1, KRT20, SLFN11, CD86, MMP12, ITGA4, PLAC8, SLAMF8, and BTN3A3. The SVM-RFE algorithm was also adopted to identify 13 genes from DEGs as diagnostic signatures, specifically ITGA4, BTN3A3, SLFN11, EPSTI1, CD86, HAPLN3, CD38, CWH43, ACP5, PLAC8, MPEG1, KRT20, and MCUB. The two gene datasets obtained by both algorithms overlap yielding 6 genes as diagnostic markers, exactly KRT20, SLFN11, CD86, ITGA4, PLAC8, and BTN3A3 (Figure 3A). The expression levels of these genes in the expression matrices of GSE11783 and GSE28242 for HIC versus control samples were further compared and the differences were statistically significant (all p < 0.001) (Figure 4). The diagnostic sensitivity of these markers was excellent, and the areas under the receiver operating characteristic (ROC) curves (AUC) of KRT20, SLFN11, CD86, ITGA4, PLAC8, and BTN3A3 were 0.977, 1.000, 0.989, 1.000, 0.943, and 1.000, respectively. Their diagnostic potential in IC/BPS was further validated, as shown in Figure 3B. The diagnostic efficacy of all the aforementioned diagnostic markers in IC/BPS was acceptable, and PLAC8 exhibited the best diagnostic performance with an AUC of 0.916.
 |
Figure 3 (A) Venn diagram of overlapped DEGs obtained via LASSO and SVM-REF algorithms. (B) ROC curves of KRT20, SLFN11, CD86, ITGA4, PLAC8, and BTN3A3 in BPS/IC. Abbreviations: AUC, the areas under the receiver operating characteristic curves; BPS/IC, bladder pain syndrome/interstitial cystitis; DEGs, differentially expressed genes; LASSO, least absolute shrinkage and selection operator; ROC, receiver operating characteristic curves; SVM-REF, support vector machine recursive feature elimination. |
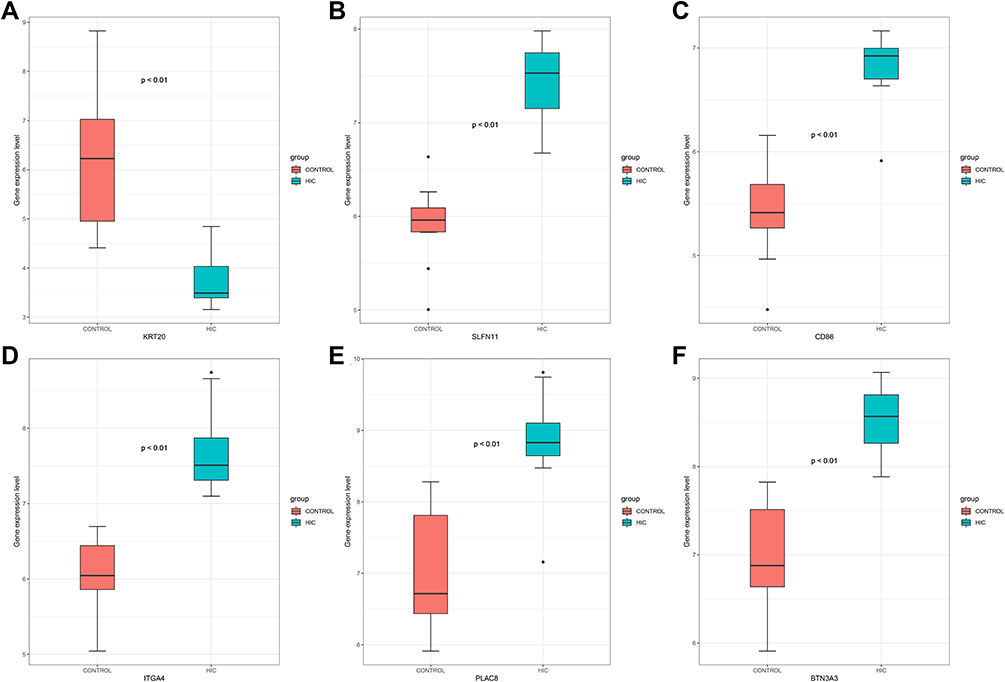 |
Figure 4 Boxplot of expression levels in HIC and control samples, KRT20 (A), SLFN11 (B), CD86 (C), ITGA4 (D), PLAC8 (E), and BTN3A3 (F), respectively. Abbreviation: HIC, Hunner’s lesion interstitial cystitis. |
Immune Cell Infiltration
The proportion of immune cell infiltration in GSE11783 was evaluated using the CIBERSORT algorithm, which revealed that memory B cells, CD4+ memory resting T cells, and plasma cells were the most infiltrating cells, especially in HIC tissues, as shown in Figure 5A. The levels of immune infiltration of different samples of GSE11783 are shown in Figure 5B. However, the proportion of immune cell infiltration in tissues was apparently different as shown in Figure 5C, which indicated that the ratio of plasma cells (p = 0.017), T cells CD4+ memory activated (p = 0.009), dendritic cells activated (p = 0.01), eosinophils (p = 0.004), and neutrophils (p = 0.03) were significantly higher in HIC than in normal samples, in contrast to mast cells resting (p = 0.022). PCA cluster analysis was further performed and the results showed significant differences in immune cell infiltration between HIC and normal samples (Figure 5D). PCA cluster analysis can be used to analyze consistent biological reproducibility and variability between different groups.
 |
Figure 5 Immune cell infiltration of GSE11783. (A) The proportion of immune cell infiltration in HIC and normal sample; (B) immune infiltration levels of different samples; (C) violin diagram of the proportion of 22 types of immune cells; the red marks represent the difference in infiltration between the two groups of samples; (D) PCA cluster analysis; (E) correlation heatmaps between KRT20, SLFN11, CD86, ITGA4, PLAC8, BTN3A3, and infiltrating immune cells. *p < 0.05, **p < 0.01, ***p < 0.001. Abbreviations: HIC, Hunner’s lesion interstitial cystitis; PCA, principal component analysis. |
Correlation Between Diagnostic Markers and Infiltrating Immune Cells
Correlation analysis revealed that KRT20 was negatively correlated with plasma cells, activated CD4 memory T cells, eosinophils, and neutrophils, but positively correlated with resting memory CD4 T cells, M2 macrophages, and resting mast cells. SLFN11 was negatively correlated with resting memory CD4 T cells, but positively correlated with plasma cells, activated memory CD4 T cells, gamma/delta T cells, activated dendritic cells, and eosinophils. CD86 was negatively correlated with resting memory CD4 T cells and resting mast cells, but positively correlated with plasma cells, activated memory CD4 T cells, activated dendritic cells, and eosinophils. ITGA4 was negatively correlated with resting mast cells, but positively correlated with memory B cells, plasma cells, activated memory CD4 T cells, activated dendritic cells, eosinophils, and neutrophils. PLAC8 was positively correlated with plasma cells, activated memory CD4 T cells, activated dendritic cells, and eosinophils. BTN3A3 was negatively correlated with resting memory CD4 T cells, M2 macrophages, and resting mast cells, but positively correlated with plasma cells, activated memory CD4 T cells, activated dendritic cells, eosinophils, and neutrophils (Figure 5E).
Discussion
Based on Skene AJC’s description, the first case of BPS/IC was reported by Guy L Hunner over a century ago.13,14 Studies involving BPS/IC suggested that Hunner’s lesion was not the only hallmark of BPS/IC, and patients exhibited a heterogeneity of bladder lesions.15,16 Therefore, only IC patients with Hunner’s lesion and healthy controls in the dataset were evaluated in this study. Owing to the lack of objective diagnostic indicators, the diagnosis of BPS/IC is often established based on patients’ subjective symptoms, which lead to heterogeneous patient populations. The challenge of patient identification invariably leads to deferred treatment and severely impaired quality of life. In addition, the study indicated that HIC is a distinct immune-related disease characterized by multiple immune cell infiltrations.17–19 Therefore, it is critical to identify specific diagnostic markers and analyze the pattern of immune cell infiltration in HIC to improve the quality of life of BPS/IC patients. With rapid advances in science and technology, bioinformatics provides a powerful tool for screening molecular markers, and machine learning tools facilitate the analysis of patterns of immune cell infiltration associated with the disease. In this study, we sought to identify the diagnostic markers for BPS/IC and further explore the role of immune cell infiltration in HIC.
The study revealed a total of 83 common DEGs shared by GSE28242 and GSE11783 datasets (Figure 1C and D). Functional Annotation analysis further showed that DEGs were mainly related to leukocyte migration, MHC class II protein complex, and MHC class II protein complex binding. The main pathways enriched by KEGG include Staphylococcus aureus infection, intestinal immune network for IgA production, and rheumatoid arthritis. The above results indicate that immune response plays an important role in HIC.
LASSO logistic regression is a machine learning method that identifies variables by seeking λ with the lowest classification error. SVM-RFE is also a machine learning method for support vector machines that identifies the best variables by subtracting the feature vectors generated by SVM. The LASSO logistic model and the SVM-RFE algorithm were adopted to identify diagnostic markers, namely KRT20, SLFN11, CD86, ITGA4, PLAC8, and BTN3A3. The differences in the expression of these genes in HIC and healthy controls were statistically significant (p < 0.01) (Figure 4), which suggests that the genes have a diagnostic role in HIC. KRT20 is a uroepithelial-specific gene expressed poorly in HIC.20 Gamper et al also demonstrated the low expression of KRT20 as a uroepithelial marker in HIC compared with healthy controls (p < 0.0001).21 The hyperexpression of the urothelial genes in HIC might be attributed to the loss of urothelium in the HL. Puck et al reported that the SLFN11 gene was highly expressed in monocytes and monocyte-derived dendritic cells compared with T cells.22 Meanwhile, Watanabe et al showed that SLFN11 was irreversibly induced by long-term inflammation. Consistently, SLFN11 was highly expressed in the mucosa of ulcerative colitis, but not in normal mucosa. SLFN11 plays a significant role in mucosal damage in ulcerative colitis and represents a potential new target for mucosal regeneration.23 Similarly, this study also confirmed the elevated expression of SLFN11 in HIC and therefore represents a diagnostic marker in BPS/IC. CD86 plays an essential role in the amplification and maintenance of inflammation in vivo.24,25 Dendritic cell activation is characterized by enhanced surface expression of costimulatory molecules, including CD40 and CD86.26 The results of this study also demonstrated that the proportion of activated HIC dendritic cells was significantly higher than that of normal healthy tissue, which indicated partly that BPS/IC was associated with immune processes. ITGA4 is a member of the integrin family of transmembrane receptors. ITGA4 regulates cellular processes such as migration and motility.27 Genetic variants in ITGA4 affect monocyte-lymphocyte ratios and are widely considered as susceptibility genes for autoimmune disease.28,29 PLAC8, previously known as onzin, was first identified in human dendritic cells.30 PLAC8 expression was subsequently detected in bone marrow and lymphocytes, as well as in epithelial cells of the lung and intestine.31 PLAC8 plays a key role in T cell clearance of Chlamydia infection in the reproductive tract.32 Shi et al reported that PLAC8 was associated with malignant progression and poor prognosis in clear cell renal cell carcinoma.33 Therefore, it is hypothesized that PLAC8 is involved in the development and progression of HIC. Butyrophilin (BTN), first identified in milk, is a type I transmembrane protein belonging to the immunoglobulin superfamily. Different members of the BTN family play various roles in immune regulation, tumorigenesis, and progression. BTN3A3 is the third BTN subfamily membrane protein A3. Both BTN2A2 and BTN3A3 were significantly elevated in ulcerative colitis compared to healthy normal tissue.34 Thus, it is postulated that BTN3A3 serves in the mechanism of HIC. The diagnostic efficacy of the above genes in BPS/IC was further explored, as shown in Figure 3B.
To further explore the role of immune cell infiltration in HIC, we performed a systematic evaluation of immune infiltration in HIC using the CIBERSORT algorithm (Figure 5A–C). The percentage of immune cell infiltration in the tissue was apparently different, as shown in Figure 5C, suggesting that the percentage of plasma cells (p = 0.017), activated memory CD4+ T cells (p = 0.009), activated dendritic cells (p = 0.01), eosinophils (p = 0.004) and neutrophils (p = 0.03) was significantly higher in HIC than in normal samples, in contrast to resting mast cells (p = 0.022). Further PCA clustering analysis revealed a significant difference in immune cell infiltration between HIC and normal samples (Figure 5D). The current study indicated that the proportion of plasma cells in HIC was significantly higher than in healthy normal tissues, which is consistent with a previous study.35 Plasma cells maintain the balance between autoimmune and inflammatory processes. However, plasma cells can induce chronic inflammation in autoimmune disease by continuously secreting pathogenic antibodies, leading to episodes of symptomatic flare-ups.36 Jhang et al reported bladder biopsy results involving 352 patients with IC/BPS suggesting plasma cell infiltration in 15.3% of patients.37 Activated memory CD4 T cells are also known as CD3+ CD4+ HLA-DR+ cells. HLA-DR within T cells includes a subset of regulatory T cells that display regulatory and functional phenotypes.38 Studies have shown that the expression of CD3+CD4+ HLA-DR+ was significantly increased in patients with polymyositis (p < 0.01).39 However, the mechanism of action of CD3+ CD4+ HLA-DR+ cells in BPS/IC is unclear. The initiation of an effective immune response requires innate immune cells such as dendritic cells.40 Dendritic cells (DCs) perform an essential role as innate immune cells, triggering the adaptive immune response.41 DCs play a pivotal role in maintaining immune homeostasis, and dysregulation of DCs triggers autoimmune and chronic inflammatory diseases.42 DCs are a critical immune cell component regarded as essential for autoimmune pathogenesis.43 Studies reveal that hyperactivation of DCs plays a key role in the autoimmune response associated with systemic lupus erythematosus.44,45 Thus, the findings suggest partially that IC is an autoimmune-related disease. Jhang et al reported bladder biopsy results of 69.6% of patients with BPS/IC carrying bladder inflammation and 9.1% associated with eosinophilic infiltration.37 The present study also demonstrated that the neutrophil-to-eosinophil ratio was significantly higher in patients with HIC, which is in accordance with our results. It is known that mast cells interact with nerves in several diseases, such as multiple sclerosis, atopic dermatitis, irritable bowel syndrome, and IC.46 In the study, resting mast cells in HIC showed a decreasing trend, while activated mast cells showed an increasing trend. Mast cells are turned off in the resting status, while they are turned on to degranulate upon activation. In the resting status, mast cells use a plastic repertoire to restrict immune function in the absence of microenvironment activation.47 However, current studies involving mast cell density in HIC/IC appear to report conflicting findings.16 Our findings suggest that reduced expression of resting mast cells in HIC may lead to an imbalance between immunity and tolerance to inflammatory processes. The results showed a positive correlation between diagnostic markers and infiltrating immune cells (Figure 5E), which further indicated that immune cells play an essential role in the pathogenesis and progression of IC/BPS.
We adopted novel algorithms such as SVM-RFE and LASSO logistic regression to screen for diagnostic markers of HIC and used CIBERSORT to analyze immune cell infiltration in HIC tissues. However, our study suffers from several limitations. Our study involved secondary mining and analysis of the GEO dataset. No HIC datasets were available and the small sample size of the datasets included was a limitation. Although the study results are consistent with some previous studies, the reliability of the results requires further experimental validation.
Conclusions
KRT20, SLFN11, CD86, ITGA4, PLAC8, and BTN3A3 showed excellent diagnostic value for HIC, and for BPS/IC partially. The percentage of immune cell infiltration in HIC tissue varied significantly, with plasma cells, T-cell CD4 memory activation, dendritic cell activation, eosinophils, and neutrophils significantly elevated in HIC than in normal tissues, with the opposite for resting mast cells. Meanwhile, a favorable correlation existed between the diagnostic markers screened and immune cell infiltration in HIC, further indicating that the immune response might play a pivotal role in the pathogenesis and progression of BPS/IC.
Data Sharing Statement
Gene datasets and clinical information of patients with BPS/IC are available from the GEO database (https://www.ncbi.nlm.nih.gov/geo/).
Ethics Statement
The Ethics Committee of the First Affiliated Hospital of Nanchang University concluded that no ethical review was required for this study due to the patient data sourced from public databases. These data received informed consent from patients and ethical approval from the corresponding institutional ethics committees prior to disclosure.
Funding
This work was supported by the National Natural Science Foundation of China under Grant 82060467.
Disclosure
The authors report there are no competing interests to declare.
References
1. Berry SH, Elliott MN, Suttorp M, et al. Prevalence of symptoms of bladder pain syndrome/interstitial cystitis among adult females in the United States. J Urol. 2011;186(2):540–544. doi:10.1016/j.juro.2011.03.132
2. Suskind AM, Berry SH, Ewing BA, Elliott MN, Suttorp MJ, Clemens JQ. The prevalence and overlap of interstitial cystitis/bladder pain syndrome and chronic prostatitis/chronic pelvic pain syndrome in men: results of the RAND interstitial cystitis epidemiology male study. J Urol. 2013;189(1):141–145. doi:10.1016/j.juro.2012.08.088
3. Nordling J, Anjum FH, Bade JJ, et al. Primary evaluation of patients suspected of having interstitial cystitis (IC). Eur Urol. 2004;45(5):662–669. doi:10.1016/j.eururo.2003.11.021
4. Han E, Nguyen L, Sirls L, Peters K. Current best practice management of interstitial cystitis/bladder pain syndrome. Ther Adv Urol. 2018;10(7):197–211. doi:10.1177/1756287218761574
5. Doggweiler R, Whitmore KE, Meijlink JM, et al. A standard for terminology in chronic pelvic pain syndromes: a report from the chronic pelvic pain working group of the international continence society. Neurourol Urodyn. 2017;36(4):984–1008. doi:10.1002/nau.23072
6. Sairanen J, Tammela TL, Leppilahti M, et al. Cyclosporine A and pentosan polysulfate sodium for the treatment of interstitial cystitis: a randomized comparative study. J Urol. 2005;174(6):2235–2238. doi:10.1097/01.ju.0000181808.45786.84
7. Yu G, Wang LG, Han Y, He QY. clusterProfiler: an R package for comparing biological themes among gene clusters. Omics. 2012;16(5):284–287. doi:10.1089/omi.2011.0118
8. Szklarczyk D, Gable AL, Lyon D, et al. STRING v11: protein-protein association networks with increased coverage, supporting functional discovery in genome-wide experimental datasets. Nucleic Acids Res. 2019;47(D1):D607–d613. doi:10.1093/nar/gky1131
9. Tibshirani RJ. Regression shrinkage and selection via the LASSO. J R Stat Soc. 1996;73(1):273–282. doi:10.1111/j.1467-9868.2011.00771.x
10. Suykens J, Vandewalle J. Least squares support vector machine classifiers. Neural Process Lett. 1999;9(3):293–300. doi:10.1023/A:1018628609742
11. Friedman J, Hastie T, Tibshirani R. Regularization paths for generalized linear models via coordinate descent. J Stat Softw. 2010;33(1):1–22. doi:10.18637/jss.v033.i01
12. Huang ML, Hung YH, Lee WM, Li RK, Jiang BR. SVM-RFE based feature selection and Taguchi parameters optimization for multiclass SVM classifier. Sci World J. 2014;2014:795624. doi:10.1155/2014/795624
13. Skene AJC. Diseases of the bladder and urethra in women. Am J Med Sci. 1879;78(156):524–527. doi:10.1097/00000441-187910000-00026
14. Hunner GL, Rare A. Type of bladder ulcer in women: report of cases. South Med J. 1915;8(5):410. doi:10.1097/00007611-191505000-00031
15. Koziol JA, Adams HP, Frutos A. Discrimination between the ulcerous and the nonulcerous forms of interstitial cystitis by noninvasive findings. J Urol. 1996;155(1):87–90. doi:10.1016/S0022-5347(01)66551-0
16. Whitmore KE, Fall M, Sengiku A, Tomoe H, Logadottir Y, Kim YH. Hunner lesion versus non-Hunner lesion interstitial cystitis/bladder pain syndrome. Int J Urol. 2019;26(Suppl 1):26–34. doi:10.1111/iju.13971
17. Akiyama Y, Yao JR, Kreder KJ, et al. Autoimmunity to urothelial antigen causes bladder inflammation, pelvic pain, and voiding dysfunction: a novel animal model for Hunner-type interstitial cystitis. Am J Physiol Renal Physiol. 2021;320(2):F174–F182. doi:10.1152/ajprenal.00290.2020
18. Fall M, Johansson SL, Vahlne A. A clinicopathological and virological study of interstitial cystitis. J Urol. 1985;133(5):771–773. doi:10.1016/S0022-5347(17)49221-4
19. Wang X, Liu W, O’Donnell M, et al. Evidence for the role of mast cells in cystitis-associated lower urinary tract dysfunction: a multidisciplinary approach to the study of chronic pelvic pain research network animal model study. PLoS One. 2016;11(12):e0168772. doi:10.1371/journal.pone.0168772
20. Gamper M, Viereck V, Geissbühler V, et al. Gene expression profile of bladder tissue of patients with ulcerative interstitial cystitis. BMC Genomics. 2009;10:199. doi:10.1186/1471-2164-10-199
21. Gamper M, Viereck V, Eberhard J, et al. Local immune response in bladder pain syndrome/interstitial cystitis ESSIC type 3C. Int Urogynecol J. 2013;24(12):2049–2057. doi:10.1007/s00192-013-2112-0
22. Puck A, Aigner R, Modak M, Cejka P, Blaas D, Stöckl J. Expression and regulation of Schlafen (SLFN) family members in primary human monocytes, monocyte-derived dendritic cells and T cells. Results Immunol. 2015;5:23–32. doi:10.1016/j.rinim.2015.10.001
23. Watanabe S, Nishimura R, Shirasaki T, et al. Schlafen 11 is a novel target for mucosal regeneration in ulcerative colitis. J Crohns Colitis. 2021;15(9):1558–1572. doi:10.1093/ecco-jcc/jjab032
24. Sansom DM, Manzotti CN, Zheng Y. What’s the difference between CD80 and CD86? Trends Immunol. 2003;24(6):313–318. doi:10.1016/S1471-4906(03)00111-X
25. Rutkowski R, Moniuszko T, Stasiak-Barmuta A, et al. Cd80 and cd86 expression on lps-stimulated monocytes and the effect of cd80 and cd86 blockade on il-4 and ifn-gamma production in nanotopic bronchial asthma. Arch Immunol Ther Exp. 2003;51(6):421–428.
26. Reis e Sousa C. Dendritic cells in a mature age. Nat Rev Immunol. 2006;6(6):476–483. doi:10.1038/nri1845
27. Hsia DA, Lim ST, Bernard-Trifilo JA, et al. Integrin alpha4beta1 promotes focal adhesion kinase-independent cell motility via alpha4 cytoplasmic domain-specific activation of c-Src. Mol Cell Biol. 2005;25(21):9700–9712. doi:10.1128/MCB.25.21.9700-9712.2005
28. Lin BD, Willemsen G, Fedko IO, et al. Heritability and GWAS studies for monocyte-lymphocyte ratio. Twin Res Hum Genet. 2017;20(2):97–107. doi:10.1017/thg.2017.3
29. Du J, Chen S, Shi J, et al. The association between the lymphocyte-monocyte ratio and disease activity in rheumatoid arthritis. Clin Rheumatol. 2017;36(12):2689–2695. doi:10.1007/s10067-017-3815-2
30. Rissoan MC, Duhen T, Bridon JM, et al. Subtractive hybridization reveals the expression of immunoglobulin-like transcript 7, Eph-B1, granzyme B, and 3 novel transcripts in human plasmacytoid dendritic cells. Blood. 2002;100(9):3295–3303. doi:10.1182/blood-2002-02-0638
31. Ledford JG, Kovarova M, Koller BH. Impaired host defense in mice lacking ONZIN. J Immunol. 2007;178(8):5132–5143. doi:10.4049/jimmunol.178.8.5132
32. Johnson RM, Kerr MS, Slaven JE. Plac8-dependent and inducible NO synthase-dependent mechanisms clear Chlamydia muridarum infections from the genital tract. J Immunol. 2012;188(4):1896–1904. doi:10.4049/jimmunol.1102764
33. Shi L, Xiao L, Heng B, Mo S, Chen W, Su Z. Overexpression of placenta specific 8 is associated with malignant progression and poor prognosis of clear cell renal cell carcinoma. Int Urol Nephrol. 2017;49(7):1165–1176. doi:10.1007/s11255-017-1578-y
34. Lebrero-Fernández C, Wenzel UA, Akeus P, et al. Altered expression of Butyrophilin (BTN) and BTN-like (BTNL) genes in intestinal inflammation and colon cancer. Immun Inflamm Dis. 2016;4(2):191–200. doi:10.1002/iid3.105
35. Akiyama Y, Morikawa T, Maeda D, et al. Increased CXCR3 expression of infiltrating plasma cells in hunner type interstitial cystitis. Sci Rep. 2016;6:28652. doi:10.1038/srep28652
36. Hiepe F, Dörner T, Hauser AE, Hoyer BF, Mei H, Radbruch A. Long-lived autoreactive plasma cells drive persistent autoimmune inflammation. Nat Rev Rheumatol. 2011;7(3):170–178. doi:10.1038/nrrheum.2011.1
37. Jhang JF, Hsu YH, Jiang YH, Ho HC, Kuo HC. Clinical relevance of bladder histopathological findings and their impact on treatment outcomes among patients with interstitial cystitis/bladder pain syndrome: an investigation of the European Society for the study of interstitial cystitis histopathological classification. J Urol. 2021;205(1):226–235. doi:10.1097/JU.0000000000001334
38. Revenfeld ALS, Bæk R, Jørgensen MM, Varming K, Stensballe A. Induction of a regulatory phenotype in CD3+ CD4+ HLA-DR+ T cells after allogeneic mixed lymphocyte culture; indications of both contact-dependent and -independent activation. Int J Mol Sci. 2017;18(7):1603. doi:10.3390/ijms18071603
39. Ishii W, Matsuda M, Shimojima Y, Itoh S, Sumida T, Ikeda S. Flow cytometric analysis of lymphocyte subpopulations and TH1/TH2 balance in patients with polymyositis and dermatomyositis. Intern Med. 2008;47(18):1593–1599. doi:10.2169/internalmedicine.47.0967
40. Hansen LW, Yang WL, Bolognese AC, et al. Treatment with milk fat globule epidermal growth factor-factor 8 (MFG-E8) reduces inflammation and lung injury in neonatal sepsis. Surgery. 2017;162(2):349–357. doi:10.1016/j.surg.2017.02.006
41. Silveira GF, Strottmann DM, de Borba L, et al. Single point mutations in the helicase domain of the NS3 protein enhance dengue virus replicative capacity in human monocyte-derived dendritic cells and circumvent the type I interferon response. Clin Exp Immunol. 2016;183(1):114–128. doi:10.1111/cei.12701
42. Ichikawa R, Takayama T, Yoneno K, et al. Bile acids induce monocyte differentiation toward interleukin-12 hypo-producing dendritic cells via a TGR5-dependent pathway. Immunology. 2012;136(2):153–162. doi:10.1111/j.1365-2567.2012.03554.x
43. Kim N-S, Torrez T, Langridge W. LPS enhances CTB-INSULIN induction of IDO1 and IL-10 synthesis in human dendritic cells. Cell Immunol. 2019;338:32–42. doi:10.1016/j.cellimm.2019.03.003
44. Castellano G, Cafiero C, Divella C, et al. Local synthesis of interferon-alpha in lupus nephritis is associated with type I interferons signature and LMP7 induction in renal tubular epithelial cells. Arthritis Res Ther. 2015;17(1):72. doi:10.1186/s13075-015-0588-3
45. Blanco P, Palucka AK, Gill M, Pascual V, Banchereau J. Induction of dendritic cell differentiation by IFN-alpha in systemic lupus erythematosus. Science. 2001;294(5546):1540–1543. doi:10.1126/science.1064890
46. Bauer O, Razin E. Mast cell-nerve interactions. News Physiol Sci. 2000;15:213–218. doi:10.1152/physiologyonline.2000.15.5.213
47. Frossi B, Mion F, Tripodo C, Colombo MP, Pucillo CE. Rheostatic functions of mast cells in the control of innate and adaptive immune responses. Trends Immunol. 2017;38(9):648–656. doi:10.1016/j.it.2017.04.001
 © 2022 The Author(s). This work is published and licensed by Dove Medical Press Limited. The
full terms of this license are available at https://www.dovepress.com/terms
and incorporate the Creative Commons Attribution
- Non Commercial (unported, 3.0) License.
By accessing the work you hereby accept the Terms. Non-commercial uses of the work are permitted
without any further permission from Dove Medical Press Limited, provided the work is properly
attributed. For permission for commercial use of this work, please see paragraphs 4.2 and 5 of our Terms.
© 2022 The Author(s). This work is published and licensed by Dove Medical Press Limited. The
full terms of this license are available at https://www.dovepress.com/terms
and incorporate the Creative Commons Attribution
- Non Commercial (unported, 3.0) License.
By accessing the work you hereby accept the Terms. Non-commercial uses of the work are permitted
without any further permission from Dove Medical Press Limited, provided the work is properly
attributed. For permission for commercial use of this work, please see paragraphs 4.2 and 5 of our Terms.