")
Back to Journals » Diabetes, Metabolic Syndrome and Obesity » Volume 16
Integrated Analysis of Ferroptosis and Immunity-Related Genes Associated with Diabetic Kidney Disease
Authors Wang J, Wang L, Pang Z, Ge Q, Wu Y, Qi X
Received 7 September 2023
Accepted for publication 9 November 2023
Published 23 November 2023 Volume 2023:16 Pages 3773—3793
DOI https://doi.org/10.2147/DMSO.S434970
Checked for plagiarism Yes
Review by Single anonymous peer review
Peer reviewer comments 3
Editor who approved publication: Prof. Dr. Juei-Tang Cheng
Jingjing Wang,1 Lin Wang,1 Zhe Pang,1 Qingmiao Ge,1 Yonggui Wu,1,2 Xiangming Qi1
1Department of Nephropathy, The First Affiliated Hospital of Anhui Medical University, Hefei, Anhui, 230022, People’s Republic of China; 2Center for Scientific Research of Anhui Medical University, Hefei, Anhui, 230022, People’s Republic of China
Correspondence: Yonggui Wu; Xiangming Qi, Department of Nephropathy, The First Affiliated Hospital of Anhui Medical University, Hefei, Anhui, People’s Republic of China, Tel +86 551 6292 2111, Email [email protected]; [email protected]
Purpose: Diabetic kidney disease (DKD) is the leading cause of chronic kidney disease (CKD) worldwide. Elucidation of the molecular mechanisms underlying ferroptosis and immunity in DKD could aid the development of potentially effective therapeutics. This study aimed to perform an integrated analysis of ferroptosis and immune-related differentially expressed mRNAs (DEGs) in DKD.
Materials and Methods: Gene expression profiles of samples obtained from patients with DKD and controls were downloaded from the Gene Expression Omnibus (GEO) database. The potential differentially expressed genes (DEGs) were screened using R software, and ferroptosis immune-related differentially expressed genes (FIRDEGs) were extracted from the DEGs. We performed functional enrichment analyses, and constructed protein–protein interaction (PPI) networks, transcription factor (TFs)-gene networks, and gene-drug networks to explore their potential biological functions. Correlation analysis and receiver operating characteristic curves were used for evaluating the FIRDEGs. We used the CIBERSORT algorithm to examine the composition of immune cells and determine the relationship between FIRDEG signatures and immune cells. Finally, the RNA expression of six FIRDEGs was validated in animal kidney samples using RT-PCR.
Results: We identified 80 FIRDEGs and performed their functional analyses. We identified six hub genes (Ccl5, Il18, Cybb, Fcgr2b, Myd88, and Ccr2) using PPI networks and predicted potential TF gene networks and gene-drug pairs. Immune cells, including M2 macrophages, resting mast cells, and gamma-delta T cells, were altered in DKD; the FIRDEGs (Fcgr2b, Cybb, Ccr2, and Ccl5) were closely correlated with the infiltration abundance of M2 macrophages and gamma-delta T cells. Finally, the hub genes were verified in mouse kidney samples.
Conclusion: We identified six hub FIRDEGs (Ccl5, Il18, Cybb, Fcgr2b, Myd88, and Ccr2) in DKD, and predicted the potential transcription factor gene networks and possible treatment targets for future research.
Keywords: diabetic kidney disease, ferroptosis, immunity, bioinformatics
Introduction
Chronic diseases such as diabetes are becoming increasingly prevalent each year owing to the steadily growing older population, which poses a significant burden to the public healthcare system.1 Diabetic kidney disease (DKD) is a serious microcirculatory complication in the late stages of diabetes and is the leading cause of chronic kidney disease.2 According to reports, 35–40% of diabetic patients will experience irreparable kidney impairment and advance to DKD.3 The precise pathophysiology of DKD is currently unknown, and there is a lack of effective therapies. Therefore, exploring the mechanisms underlying DKD and identifying drugs to treat these conditions have become the therapeutic priorities.
Ferroptosis is a type of cell death caused by iron-dependent lipid peroxidation.4 In DKD, ferroptosis produces large amounts of reactive oxygen species, causing kidney damage through oxidative stress.5 Inhibiting ferroptosis could be a strategy to treat DKD.6 Ferroptosis offers a new perspective on the pathogenesis of DKD; it is a complicated physiological process regulated by multiple genes and its specific regulatory mechanisms require further investigation.
There is a relationship between ferroptosis and immune cell infiltration. Ferroptotic cells can initiate macrophage recruitment7 and affect macrophage polarization via iron metabolism.8 Immune cells undergo phagocytosis and iron accumulation. Activated immune cells secrete certain cytokines9 and ROS10 to regulate ferroptosis. Li et al11 and Ma et al12 suggested a possible connection between immunity and ferroptosis in DKD; however, the precise mechanisms remain unknown. The role of ferroptosis in immunotherapy has received increasing attention.13 Altering macrophage polarization could help treat cancer by altering the tumor microenvironment.14–16 Therefore, further studies on reliable biomarkers connected to the ferroptosis-immune crosstalk in DKD may provide new perspectives on the pathophysiology of the disease and potential treatment options.
This study aimed to perform an integrated analysis of ferroptosis and immune-related differentially expressed genes (FIRDEGs) in DKD. In this study, we searched for differentially expressed genes (DEGs) in the GSE30122, GSE30528, and GSE30529 datasets to investigate the primary pathogenesis of DKD. An integrated analysis of ferroptosis and immune-related DEGs was performed to observe immune cell infiltration and its relationship with ferroptosis. In addition, the expression, function, and regulatory elements of FIRDEGs were observed and investigated. The RNA expression of FIRDEGs was validated in animal kidney samples using reverse transcription-polymerase chain reaction (RT-PCR). The finding offers a possible therapeutic target for treating patients with DKD and provides new information on the mechanism of DKD cell death.
Materials and Methods
Data Acquisition
The gene expression profiles of GSE30122,17 GSE30528,17 and GSE3052917 were downloaded from the Gene Expression Omnibus (GEO)18 based on the GPL571[HG-U133A_2] Affymetrix Human Genome U133A 2.0 Array platform and annotated using the R package GEOquery.19 Nineteen kidney samples from patients with DKD and 50 from normal controls in GSE30122, 9 DKD samples and 13 normal control samples in GSE30528, and 10 DKD samples and 12 normal control samples in GSE30529 were included in the study.
Ferroptosis-related genes (FRGs) were obtained from three databases: GeneCards (http://www.genecards.org/), MSigDB (https://www.gsea-msigdb.org/gsea/msigdb/),20 and FerrDb (http://www.zhounan.org/ferrdb/).21 Immune-related genes (IRGs) were obtained from GeneCards and MSigDB databases.
Analysis of DEGs
To identify the pathways and biological mechanisms related to DKD, we used the limma package22 to find DEGs in GSE30122, GSE30528, and GSE30529. The threshold was defined as a P-value < 0.05, and |log2FoldChange| > 0.23 In this study, DEGs with logFoldChange (FC) > 0 and P < 0.05 were considered upregulated genes, whereas those with logFoldChange < 0 and P < 0.05 were considered downregulated genes.
To analyze the FIRDEGs correlated with DKD, co-DEGs and ferroptosis immune-related genes (FIRGs) were analyzed together and the results were plotted as a Venn diagram. The R package pheatmap was used to create the heat map, and ggplot2 was used to draw the volcano map.
Gene Ontology and Pathway Enrichment Analysis
The packages “cluster Profiler”24 in R software were used to perform Gene Ontology (GO) and Kyoto Encyclopedia of Genes and Genomes (KEGG) pathway enrichment analyses for FIRDEGs. P-values were adjusted using the Benjamini–Hochberg (BH) method. P < 0.05 was used as the threshold for statistical significance, and a false discovery rate (FDR) < 0.05 was considered significant.
Distribution of a predefined gene set was evaluated using GSEA to ascertain the contribution of each gene to the phenotype. In this study, the logFC value was used for molecular ordering to evaluate significant enrichment in the predefined gene set, and the clusterProfiler package was used to conduct enrichment analysis on all genes related to the phenotype. The parameters used in GSEA were as follows: seed, 2020; number of calculations, 1000; number of genes contained in each gene set, at least 10; and number of genes contained, at most 500. P-values were adjusted using the BH method. GSEA of the GSE30122 dataset was performed using gene set collections (h.all.v7.4. symbols.gmt) from MSigDB. If P < 0.05 and FDR <0.25, enrichment was regarded as significant.
Protein-Protein Interaction (PPI) Network
PPI networks were investigated using the STRING database25 and visualized using Cytoscape software. CytoHubba26 of Cytoscape was used to score each node gene using five algorithms: Degree Correlation (DEGREE), Maximum Neighborhood Component (MNC), Maximal Clique Centrality (MCC), Edge Percolated Component (EPC), and Density of Maximum Neighborhood Component (DMNC). The top 15 node genes as scored by the algorithms were selected as hub genes.
Multi-Factor Regulatory Network
Interactions between target genes and miRNAs were predicted using two databases: ENCORI27 (https://starbase.sysu.edu.cn/) and miRDB28 (http://mirdb.org/). We used the CHIPBase database29 (https://rna.sysu.edu.cn/chipbase/) and hTFtarget database30 (http://bioinfo.life.hust.edu.cn/hTFtarget) for predicting the associations between transcription factors (TF) and hub genes. The DGIdb database31 (http://www.dgidb.org) was used to identify potential metabolites or compounds associated with hub genes. Cytoscape software was used to visualize mRNA-miRNA, mRNA-TF, and mRNA-drug interaction networks.
Evaluation of Immune Cell Infiltration
Gene expression profile data were uploaded to the CIBERSORT website32 (https://cibersort.stanford.edu) to obtain an immune cell infiltration matrix. Differences in immune cell infiltration between normal and DKD groups were assessed using the Wilcoxon test. The correlation between different immune cells was calculated using Spearman’s analysis and visualized using the R package ggplot2. The R package ggplot2 was used to visualize the heat map of the correlation between FIRDEGs and infiltrating immune cells.
Correlation Analysis with Renal Function
The association between FIRDEGs expression and clinical characteristics was validated using the NephroSeq v5 online database (http://v5.nephroseq.org) using Pearson’s correlation analysis.
Receiver Operating Characteristic (ROC) Curve
To identify the underlying mechanisms and related biological characteristics of hub genes in DKD, the correlations between hub genes were displayed using a group comparison map and a correlation heatmap for the GSE30122, GSE30528, and GSE30529 datasets. The R package pROC was used to visualize the ROC curves of hub genes between the normal and DKD groups. The area under the curve (AUC) was calculated to assess the diagnostic effect of hub genes on DKD.
Validation of FIRDEGs in a Mouse Model
Animal Model
Animal models of type 2 diabetes (db/db male mice (n = 6)) and db/m male mice (n = 6) were used as controls. All the mice were fed until they were 20-week-old. Metabolic cages were used to collect 24-hour urine from mice. Glucose meters (Roche Diagnostics, Shanghai, China) were used to monitor fasting blood glucose levels. After the mice were anesthetized, blood was collected through the orbit and centrifuged to preserve the upper serum. After sacrifice, kidney and body weight were recorded. Kidney tissues were collected following cardiac perfusion and frozen at −80°C. The animal experiments were carried out in line with the National Institutes of Health Guide for the Care and Use of Laboratory Animals and were granted permission by the Anhui Medical University Animal Ethics Committee (LLSC20221089).
Chemicals and Reagents
Hematoxylin and eosin (H&E) and periodic acid–Schiff (PAS) staining kits were acquired from Solarbio (Beijing, China). Immunohistochemistry (IHC) kits were obtained from Beijing Zhongshan Company (Beijing, China). The PCR amplification kit was acquired from Shanghai Yeasen Company (Shanghai, China). Mouse monoclonal anti-Gpx4 antibody (1:100, cat number:67763-1-Ig) was provided by Proteintech (Wuhan, China). Mouse monoclonal anti-Acsl4 antibody (1:100, cat number: sc-365230) was provided by Santa Cruz Biotechnology (CA, USA). Mouse urine albumin, serum creatinine, and serum urea nitrogen detection kits were purchased from the Nanjing Jiancheng Bioengineering Institute (Nanjing, China).
Pathological Staining of Kidney Tissues
H&E and PAS staining were performed followed the manufacturer’s methods. IHC assay was performed as previously described.33 After dewaxing the kidney tissues, the antigens were extracted by boiling in citrate buffer. The sections were blocked with peroxidase and 10% normal goat serum, and then incubated with primary antibodies at 4 °C overnight. They were then incubated with secondary antibodies for 1 h at 37 °C; this was followed by chromogenic detection with 3, 3’-diaminobenzidine.
RT-PCR Assay
Total RNA was extracted from the kidney tissue of mice following the manufacturer’s instructions. Reverse transcription and RT-PCR were performed using the Hifair II First Strand cDNA Synthesis Kit and SYBR Green Kit (Yeason Biotech, Shanghai, China), respectively. The RT-PCR primer sequences are listed in Table 1.
 |
Table 1 Primer Sequences of RT-PCR |
Statistical Analysis
All statistical analyses were performed using the R package (V4.1.2). Comparisons involving continuous variables between two groups were performed using Student’s t-test for normally distributed variables and the Mann–Whitney U-test for non-normally distributed variables. Categorical variables were compared using the chi-square or Fisher’s exact tests. Spearman correlation coefficients were calculated to analyze the correlations. All P-values were two-sided, and statistical significance was set at P < 0.05.
Results
Identification of Differential Expression Genes
The study design is presented in Figure 1.
 |
Figure 1 Flow chart of the study design. Abbreviations: FIRDEGs, ferroptosis immune-related differentially expressed genes; GSEA, Gene Set Enrichment Analysis; GO, Gene Ontology; KEGG, Kyoto Encyclopedia of Genes and Genomes; PPI network, Protein-protein interaction network; TF, Transcription factors; Co-DEGs, Common differentially expressed genes; ROC, Receiver operating characteristic curve. |
Three datasets, GSE30122, GSE30528, and GSE30529, were used to identify DEGs. Normalized boxplots for each dataset are shown in Supplementary Figure 1. The DEGs were visualized using a volcano map (Figure 2A–C) and heatmap (Figure 2D–F).
 |
Figure 2 Differential gene analysis of diabetic kidney diseases databases. (A) The volcano map of GSE30122. (B) The volcano map of GSE30528. (C) The volcano map of GSE30529. (D) The heatmap of GSE30122. (E) The heatmap of GSE30528. (F) The heatmap of GSE30529. (G) Venn diagram of the Co-DEGs in GSE30122, GSE30528 and GSE30529. (H) Venn diagram of Co-DEGs and FIRGs. Abbreviations: Co-DEGs, Common differentially expressed genes; FIRGs, ferroptosis immune-related genes; DKD, Diabetic kidney disease. |
A total of 3521 DEGs were found in GSE30122, including 1320 upregulated and 2201 downregulated genes (Figure 2A). The top ten upregulated DEGs were Ltf, Igj, C3, Serpina3, Evi2a, Col6a3, Cxcl6, Ly96, Cpa3, and Cd53, whereas the top ten downregulated DEGs were B3gnt1, Lpl, Avpi1, Nell1, Hrg, Fgf9, Kat2b, Apold1, Magi2, and Il12ra2 (Figure 2D). GSE30528 contained 3440 DEGs, with 1714 upregulated and 1726 downregulated genes (Figure 2B). The top 10 upregulated DEGs (Olfml3, Serpina3, Igj, C1qb, C1qa, Ltf, Vtcn1, Vsig4, Pycard, and Ap1m2) and the top 10 downregulated DEGs (Arhgap19, Lox, Plce1, C1orf21, Magi2, Lrrc2, Fbxl7, Dach1, Fam65a, and Dpysl3) are shown in Figure 2E. GSE30529 included 4270 DEGs, comprising 1490 upregulated and 2780 downregulated genes in DKD (Figure 2C). Positive correlations among the top 10 DEGs were found for Ltf, Hopx, Psmb9, Igj, C3, C1s, Evi2a, Col6a3, Serpina3, and Tac1, whereas the top 10 downregulated DEGs were Avpi1, Egf, Nell1, Nr0b2, Arsf, Lpl, Thy1, Hrg, B3gnt1, and G6pc (Figure 2F).
Identification of FIRDEGs
When the word “ferroptosis” was used as the search tag, 698 FRGs were retrieved from GeneCards; 64, from MSigDB; and 339, from FerrDb. Together, 853 FRGs were obtained after the union (Supplementary Table 1). When the word “immune” was used as the search tag, 17,731 and 772 IRGs were retrieved from GeneCards and MSigDB, respectively. After intersection of sets, the final number was: 711 IRGs (Supplementary Table 2). After combining FRGs and IRGs, 1500 FIRGs were obtained (Supplementary Table 3). A Venn diagram was created according to the different gene expression patterns of the three datasets (GSE30122, GSE30528, and GSE30529) and 558 co-DEGs were identified (Figure 2G). Finally, the overlap of the co-DEGs and FIRGs yielded 80 FIRDEGs (Figure 2H). The FIRDEGs are shown in Supplementary Table 4.
GO and KEGG Pathway Enrichment Analysis
GO and KEGG enrichment analyses were performed to evaluate the functions of FIRDEGs in patients with DKD. GO analysis consisted of three parts: cellular components (CC), biological processes (BP), and molecular functions (MF). Among them, the JAK−STAT (GO:0007259), MAPK (GO:0051403), cell growth (GO:0016049), and gliogenesis (GO:0042063) pathways were significantly associated with CC. Specific granules (GO:0042581), membrane rafts (GO:0045121), tertiary granules (GO:0070820), and granular membranes (GO:0035579) were significantly associated with BP. For MF, glycosaminoglycan binding (GO:0005539), integrin binding (GO:0005178), cytokine receptor activity (GO:0004896), and amyloid beta binding (GO:0001540) were significant (Figure 3A, C, and E, Table 2). In addition, KEGG pathway analysis revealed some Hippo signaling pathways, comprising ECM-receptor interaction, focal adhesion, lipid and atherosclerosis, chemokine signaling pathway, and PI3K-Akt signaling pathway (Figure 3B, D, and F, Table 3).
 |
Table 2 GO Enrichment Analysis Results of Ferroptosis Immune Related DEGs |
 |
Table 3 KEGG Enrichment Analysis Results of Ferroptosis Immune Related DEGs |
 |
Figure 3 Go and KEGG Functional enrichment analysis. The bubble chart of (A) GO and (B) KEGG enrichment analyses of FIRDEGs. The circular trellis of (C) GO and (D) KEGG enrichment analyses of FIRDEGs. The bar graph of (E) GO and (F) KEGG enrichment analyses of FIRDEGs. The screening criteria for GO and KEGG enrichment items were P < 0.05 and FDR < 0.05. Abbreviations: FIRDEGs, ferroptosis immune-related differentially expressed genes; GO, Gene Ontology; KEGG, Kyoto encyclopedia of genes and genomes. |
Gene Set Enrichment Analysis
We conducted GSEA to identify the most-enriched gene sets in the DKD and normal control groups. GSEA (Supplementary Table 5 and Figure 4A) indicated that the top four most-significantly enriched gene sets related to the DKD group were PI3K pathway (Figure 4B, NES = −1.848, P < 0.01, FDR = 0.041), IL-10 pathway (Figure 4C, normalized enrichment score [NES] = 2.032, P < 0.01, FDR = 0.031), Notch pathway (Figure 4D, NES = −1.456, P < 0.05, FDR = 0.212), and IL-17 pathway (Figure 4E, NES = 1.901, P < 0.01, FDR = 0.031).
 |
Figure 4 Gene set enrichment analysis. (A) GSEA plot showing most enriched gene sets in the DKD group and normal controls. The differential expression genes in GSE30122 were significantly enriched in (B) PI3K pathway, (C) IL10 pathway, (D) Notch pathway and (E) IL17 pathway. The screening criteria for GSEA items were P < 0.05 and FDR < 0.25. Abbreviations: DKD, Diabetic kidney disease; GSEA, Gene set enrichment analysis; NES, normalized enrichment score. |
Construction of PPI Network of the FIRDEGs
A PPI network was created for FIRDEGs using the STRING database based on a minimum correlation coefficient greater than 0.400 (Figure 5A). We used five algorithms (MCC, MNC, EPC, degree, and DMNC) to calculate the scores for the node genes. Figure 5B shows the Venn maps of the most common genes of the top 15 FIRDEGs chosen using the five algorithms. Finally, six common hub genes (C-C chemokine ligand 5 [Ccl5], interleukin 18 [Il18], cytochrome b-245 beta chain [Cybb], fc fragment of IgG receptor IIb [Fcgr2b], myeloid differentiation factor 88 [Myd88], and C-C chemokine receptor 2 [Ccr2]) were extracted from the Venn diagrams (Figure 5C).
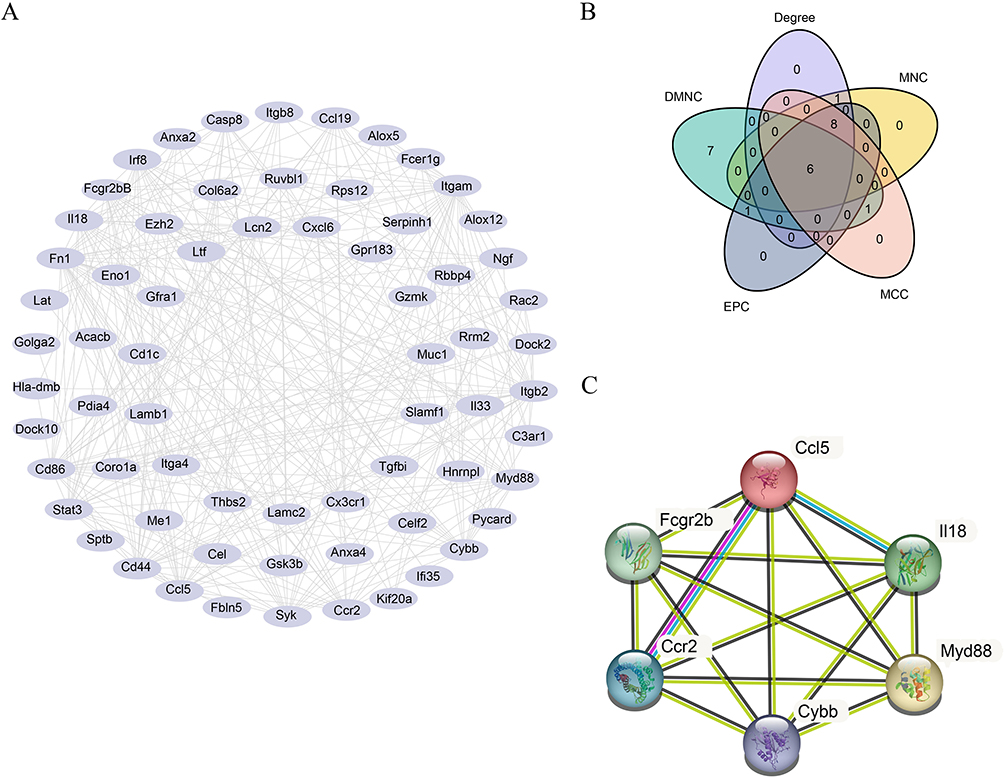 |
Figure 5 Protein–Protein Interaction Network. (A) PPI network of FIRDEGs. (B) Venn maps of common genes of the top 15 FIRDEGs were selected using five algorithms: MCC, MNC, EPC, Degree and DMNC. (C) PPI network of the six hub genes. Abbreviations: FIRDEGs, ferroptosis immune-related differentially expressed genes; PPI, protein-protein interaction; Degree, Degree correlation; MNC, Maximum neighborhood component; MCC, Maximal clique centrality; EPC, Edge percolated component; DMNC, Density of maximum neighborhood component. |
Multi-Factor Regulatory Analysis
The synthesis and function of protein-coding genes are heavily regulated by TF and miRNAs. We obtained mRNA-miRNA data from the ENCORI and miRDB databases to predict miRNAs interacting with the six hub genes. The intersection of the two databases was visualized using Cytoscape. The mRNA-miRNA interaction network was composed of two hub genes (Il18 and Myd88) (Figure 6A) and 20 miRNA molecules, which constituted 20 pairs of mRNA-miRNA interactions (Supplementary Table 6). The intersection of the CHIPBase and hFtarget databases is shown in Figure 6B. A regulatory network of mRNA-TFs was established involving four hub genes (Myd88, Ccl5, Fcgr2b, and Il18) and 12 TFs, which constituted 17 pairs of mRNA-TF interactions (Supplementary Table 7). The DGIdb database was searched to find potential medications or chemical compounds targeting the hub genes. The mRNA-drug interaction network (Figure 6C) revealed 29 potential medications or chemical compounds linked to five hub genes (Il18, Cybb, Fcgr2b, Myd88, and Ccr2) (Supplementary Table 8).
 |
Figure 6 Multi-factor regulatory analysis. (A) The mRNA-miRNA interaction network of hub genes. (B) The mRNA-TF interaction network of the hub genes. (C) The mRNA–drug interaction network of hub genes. Abbreviation: TF, Transcription factor. |
Expression and Correlation Analysis of Hub Genes
To further investigate the expression of six FIRDEGs (Ccl5, Il18, Cybb, Fcgr2b, Myd88, and Ccr2) in DKD, a correlation analysis was performed on their expression levels in GSE30122 (Figure 7A), GSE30528 (Figure 7C), and GSE30529 (Figure 7E) between the normal and DKD groups. Six hub genes (Ccl5, Cybb, Fcgr2b, Myd88, Ccr2, and Il18) in GSE30122, five (Cybb, Fcgr2b, Myd88, Ccl5, and Ccr2) in GSE30528, and four (Ccl5, Myd88, Ccr2, and Fcgr2b) in GSE30529 were statistically significant (P < 0.01). Correlation heat maps among the hub genes in GSE30122 (Figure 7B), GSE30528 (Figure 7D), and GSE30529 (Figure 7F) were plotted to determine the correlations between the six FIRDEGs. The results showed a clear association between FIRDEGs in the three databases.
 |
Figure 7 Expression differences and correlation analysis of hub genes. Group comparison of the expression of hub genes in datasets (A) GSE30122, (C) GSE30528, and (E) GSE30529. Correlation heatmap of hub gene expression in datasets (B) GSE30122, (D) GSE30528, and (F) GSE30529. Vs Normal group, *P < 0.05, **P < 0.01 and ***P < 0.001. |
The correlation between FIRDEGs and renal function in clinical patients was analyzed using the NephroSeq database (Figure 8A–L). Ccl5 (R = −0.693, P = 0.026, reporter Woroniecka et al17) and Il18 (R = −0.711, P = 0.014, reporter Schmid et al34) were negatively correlated with glomerular filtration rate (GFR). Ccr2 (R = 0.675, P = 0.016, reporter Ju et al35), Cybb (R = 0.489, P = 0.047, reporter Ju et al36), Fcgr2b (R = 0.586, P = 0.013, reporter Ju et al36), and Il18 (R = 0.697, P = 0.017, reporter Schmid et al34) were positively correlated with serum creatinine. We constructed ROC curves and calculated the AUC to explore the significance of hub genes in identifying the normal and DKD groups (Figure 9). All six hub genes showed good diagnostic values in the GSE30122, GSE30528, and GSE30529 datasets. Fcgr2b (AUC = 0.957) and Myd88 (AUC = 0.923) in GSE30528 and Ccl5 (AUC = 0.925), Myd88 (AUC = 0.958), and Ccr2 (AUC = 0.983) in GSE30529 had high diagnostic value, with an AUC > 0.9.
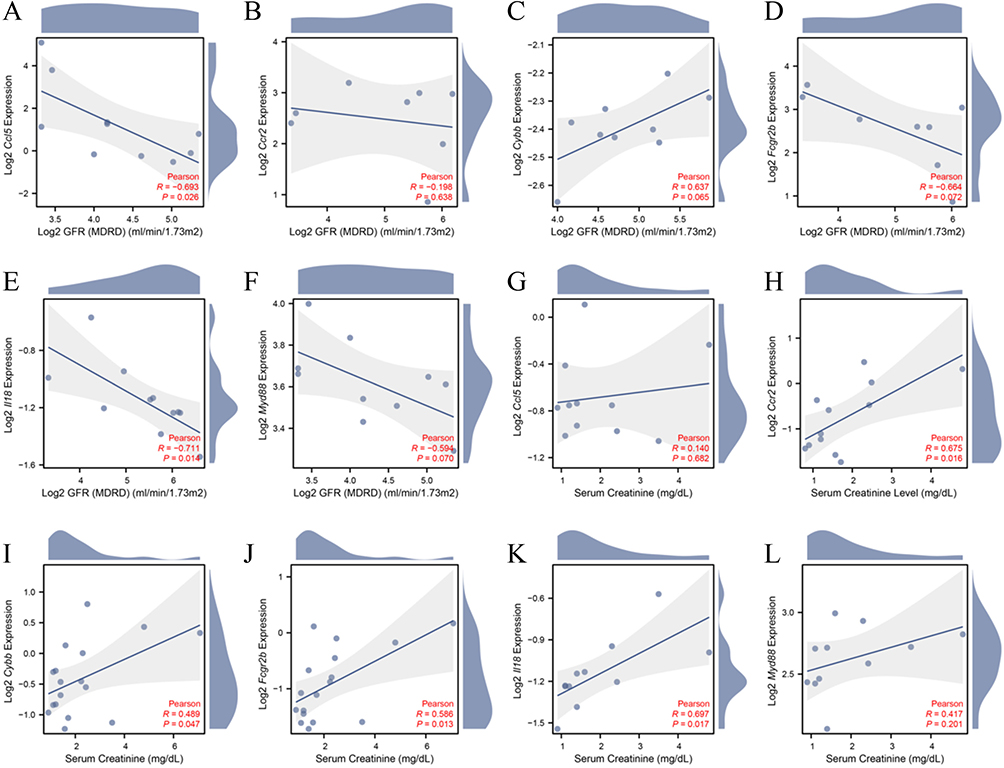 |
Figure 8 Clinical relevance of the expression of ferroptosis immune-related DEGs. Correlation analysis between GFR and (A) Ccl5, (B) Ccr2, (C) Cybb, (D) Fcgr2b, (E) Il18, (F) Myd88; Correlation analysis between serum creatinine and (G) Ccl5, (H) Ccr2, (I) Cybb, (J) Fcgr2b, (K) Il18, (L) Myd88. |
 |
Figure 9 ROC curve analysis. ROC curves for (A) Ccl5, (B) Il18, (C) Cybb, (D) Fcgr2b, (E) Myd88, and (F) Ccr2 in the GSE30122 dataset. ROC curve of (G) Ccl5, (H) Il18, (I) Cybb, (J) Fcgr2b, (K) Myd88, and (L) Ccr2 in the GSE30528 dataset. ROC curves of (M) Ccl5, (N) Il18, (O) Cybb, (P) Fcgr2b, (Q) Myd88, and (R) Ccr2 in the GSE30529 dataset. Abbreviations: ROC, Receiver operating characteristic curve; AUC, area under the curve. |
Evaluation of Immune Cell Infiltration
The GSE30122 expression profile data were uploaded to the CIBERSORTx website, where the algorithm was performed to determine the relationship between the 22 different types of immune cells and the expression profile data of the samples from different groups (normal/DKD). The composition of the 22 types of immune cells in GSE30122 for each sample is shown as a histogram (Figure 10A); the color corresponds to the proportion of various immune cells in each sample. We compared the abundance of different immune cells between the normal and DKD groups (Figure 10B). The results indicated that M2 macrophages, resting mast cells, and gamma-delta T cells were the most significant infiltrating immune cells (P <0.001). In addition, M1 macrophages (P <0.01), activated mast cells (P <0.01), plasma cells (P <0.01), M0 macrophages (P <0.05), resting NK cells (P <0.05), T follicular helper cells (P <0.05), and regulatory T cells (P <0.05) differed in their infiltration abundance. Correlation analysis was conducted to determine the relationship between FIRDEGs signature and differential immune cell infiltration abundance. In Figure 10C, FIRDEGs are correlated with the infiltration abundance of various immune cells. Among them, Fcgr2b, Cybb, Ccr2, and Ccl5 had a strong correlation with the infiltration abundance of M2 macrophages and gamma-delta T cells.
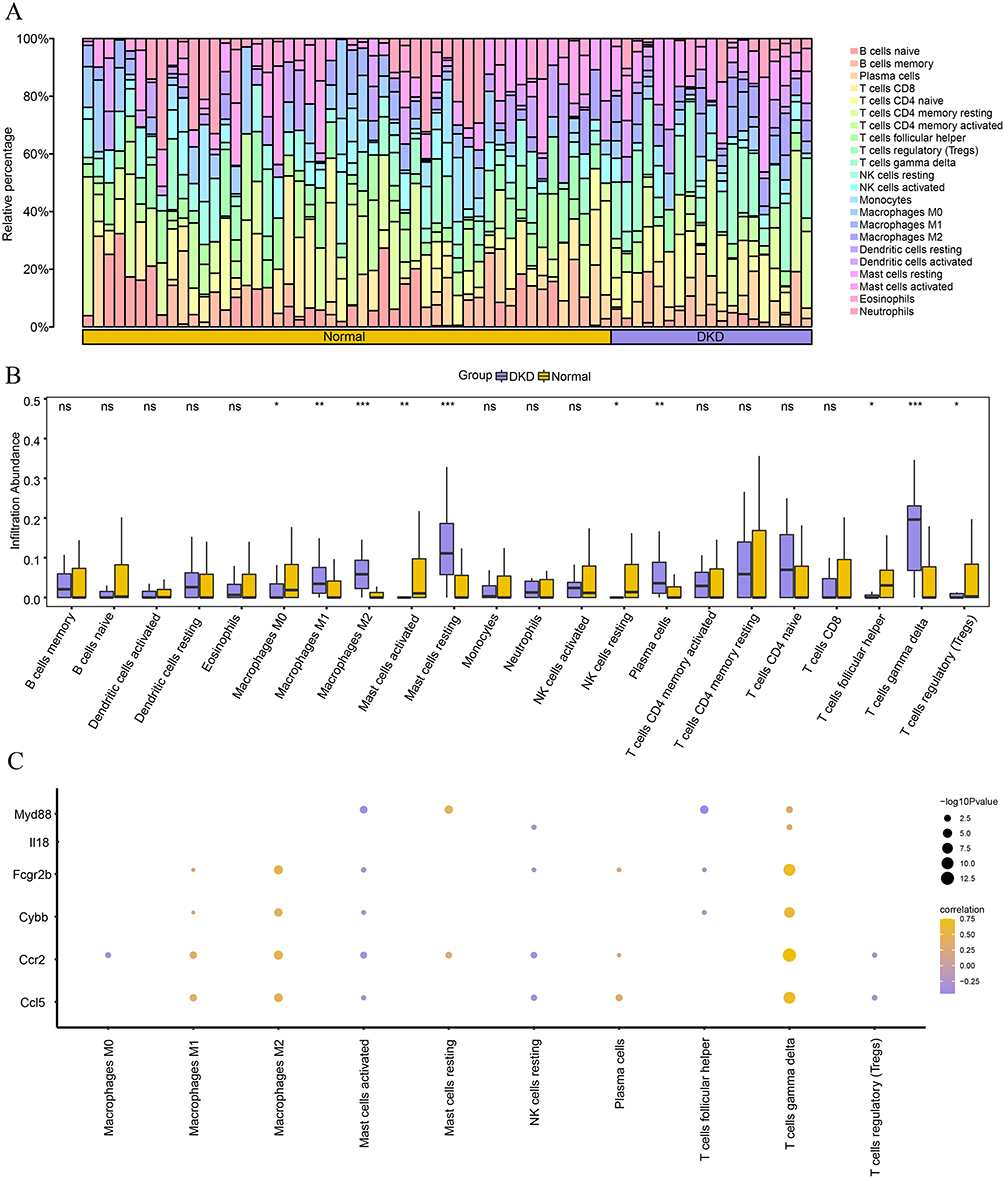 |
Figure 10 Immune cell-infiltration analysis of GSE30122 dataset. (A) Bar chart of immune cell infiltration in the dataset. (B) Comparison of immune cell infiltration between normal and NC groups. (C) Correlation heatmap of FIRDEGs and immune cells in GSE30122 dataset. Vs Normal group; *P < 0.05; **P < 0.01 and ***P < 0.001. Abbreviation: ns, no significant. |
Validation of the Hub Genes in Mouse Kidney Samples
At 20-weeks of age, db/db mice showed significantly higher blood glucose, kidney/body weight ratio, 24-hour urinary albumin excretion (UAE), serum creatinine, and serum urea nitrogen levels than db/m mice (Figure 11A–E). Pathological staining of mouse kidney cortical area is shown in Figures 11F and G. Compared to the control group, characteristic pathological changes, such as increased glomerular size, cast formation, and tubular dilatation, were observed in the kidneys of the model mice. The Paller score (for evaluating tubular damage) and mesangial area/glomerular area were significantly higher in db/db mice than in db/m mice. These results show that db/db mice have pathologically significant kidney damage compared with db/m mice. Gpx4 and Acsl4 are key proteins involved in the physiological process of ferroptosis. The protein expression of Gpx4 and Acsl4 was significantly different in the kidneys cortical area of db/db mice compared to that in db/m mice (P < 0.05; Figure 12A–D). To confirm the expression levels of the six FIRDEGs, we performed RT-PCR on the kidney tissue of a mouse model. The mRNA expression levels of Ccl5, Il18, Cybb, Fcgr2b, Myd88, and Ccr2 were significantly higher in the db/db group compared to that in the db/m (P < 0.01; Figure 12E–J).
 |
Figure 11 Basic information of mouse model. (A) Kidney weight/body weight ratio. (B) Blood glucose level. (C) 24 h urine albumin excretion levels. (D) Serum creatinine level. (E) Serum urea nitrogen. (F) H&E staining of the mouse kidneys. (G) PAS staining of mouse kidneys. The results are expressed as the mean ± SD. **P < 0.01, ***P < 0.001, ****P < 0.0001 vs db/m. All figures scale bar = 50 μm. |
 |
Figure 12 Validation of ferroptosis immune-related DEGs in mouse model. (A) IHC assay of Gpx4 protein expression in the mouse kidneys. (B) IHC assay of Acsl4 protein expression in the mouse kidneys. The AOD of (C) Gpx4 and (D) Acsl4 between two groups. (E–J) Relative expression of mRNA by RT-PCR (n = 6). The results are expressed as the mean ± SD. **P < 0.01, ***P < 0.001, ****P < 0.0001 vs db/m. All figures scale bar = 50 μm. |
Discussion
DKD is a major cause of end-stage renal disease and its prevalence is increasing annually. The pathogenesis of DKD is complicated, and there is no effective treatment.2 Abnormal iron metabolism is closely linked to impaired renal function and disease progression in patients with DKD. Iron deposition in the tubular epithelial cells of patients might cause nephrotoxicity and kidney damage.37 Gpx4 is a predictor of DKD progression in type 2 diabetes mellitus.38 However, the specific mechanisms underlying ferroptosis in DKD remain unclear. Accumulating evidence suggests that ferroptosis is associated with immunity. Iron is required for activated T cells. T cell proliferation could be inhibited by iron deficiency, whereas iron overload may lead to an imbalance in CD4+ and CD8+ T cells.39 In macrophages, deletion of Slc7a11 promotes ferritin atrophy caused by iron overload-induced ferroptosis.40 Therefore, we speculate that ferroptosis is strongly linked to the immune status of DKD and could trigger inflammatory factors that influence the onset of DKD. However, the mechanisms underlying the abnormal ferroptosis and immune inflammation in DKD remain unclear.
In this study, we conducted an integrated analysis to identify the ferroptosis- and immune-related genes in patients with DKD. We downloaded three datasets from the GEO database to identify DKD-related DEGs. By overlapping DEGs with ferroptosis- and immune-related genes, 80 FIRDEGs were identified. The GO results revealed that FIRDEGs were primarily involved in cytokine production, inflammation, and immunity. KEGG enrichment analysis revealed that FIRDEGs were enriched in the PI3K-Akt, NF-kappa B, NOD-like receptor, Toll-like receptor, and IL17 signaling pathways. GSEA indicated that the IL10, IL17, PI3K, and Notch pathways were the most enriched gene sets in DKD. Therefore, FIRDEGs are closely linked to important pathogenic pathways in DKD. Subsequently, we identified six hub genes (Ccl5, Ccr2, Cybb, Fcgr2b, Il18, and Myd88) from the 80 FIRDEGs and predicted mRNA-miRNA, mRNA-TF, and mRNA-drug pairs. To examine the diagnostic and prognostic value of FIRDEGs, we performed ROC curve analysis in DKD; Il18 and Cybb had a certain accuracy (AUC > 0.7 in three datasets), whereas Ccl5, Fcgr2b, Myd88, and Ccr2 were highly accurate (AUC > 0.8 in three datasets) in predicting DKD. In addition, we used RT-PCR to confirm the expression of the six hub genes in the kidney samples from db/db mouse model, and the results were generally consistent with those of RNA sequencing.
Urinary sediment Ccl5 mRNA could be a prospective prognostic biomarker for DKD.41 Ccr2 is the most common receptor for the C-C chemokine ligand 2 (Ccl2; formerly called monocyte chemoattractant peptide-1).42 Blockade of Ccl2/Ccr2 signaling ameliorates kidney injury in db/db mice.43 Cybb encodes the Nox2 protein, which is involved in the oxidative stress response. Inhibition of Nox2 activation could be beneficial for the prevention or treatment of DKD.44 Fcgr2b is associated with acute kidney injury45 and IgA nephropathy.46 Urinary Il18 levels are independently associated with mortality in patients with DKD;47 in addition, the Il18 protein level in the renal tissue is considered an effective biomarker for renal pathology.48 Myd88 is a crucial adaptor protein involved in TLR signaling. The polymorphisms in the TLR-Myd88-NF-κB signaling pathway confer genetic susceptibility to DKD.49 By searching the Nephroseq database, we found that FIRDEGs were correlated with some renal function indicators in patients with DN, indicating that these six genes have clinical value.
DKD is an inflammatory disease driven by immune cells in addition to the traditional metabolic and hemodynamic risk factors.50,51 In this study, we analyzed the trend of immune cell infiltration in DKD and examined the correlation between FIRDEGs and immune cells. Spearman correlation analysis revealed that the expression profiles of FIRDEGs were linked to certain immune cells, particularly M2 macrophages and gamma-delta T cells. Macrophages can be divided into M0/M1 and M2 types. M0 macrophages are differentiated into two distinct subtypes: classically activated (M1) and selectively activated (M2) macrophages.52 M2 macrophages are mainly activated in DKD, and the balance of M1/M2 macrophages is related to the renal microenvironment, which could affect the progression.53 In patients with DKD, T cell infiltration can lead to immune cell accumulation and an increase in the expression of various inflammatory factors in the kidney, eventually aggravating the progression of DKD.54 Gamma delta T cells are unconventional T cells that primarily recognize antigens in the absence of classical restrictions via the major histocompatibility complex (MHC).55 Gamma-delta T cells can produce inflammatory cytokines, like Il17a, which are involved in the onset of DKD, ischemia-reperfusion injury, fibrosis, and et al56,57 To some extent, these genes can be used as target genes to study the relationship between ferroptosis and immunity in DKD. The gene-drug network suggests potential drugs for the treatment of DKD. However, this finding must be validated in future studies.
This study has certain limitations as it only provides preliminary clues about the underlying mechanisms rather than conclusive evidence. First, it relied mainly on database mining without sufficient experimental validation. Second, only mouse models were used for validation and the sample size was small. There are several differences between mice and humans at the genomic and biological levels. Further verification with clinical specimens and in vitro experiments is needed in the future. Third, we did not conduct validation after successfully predicting transcription factors, miRNAs, and therapeutic agents. Finally, the co-expression relationship between FIRDEGs and immune cells requires further verification.
Conclusion
This study is the first to analyze DEGs associated with ferroptosis and immunity in DKD and to predict their correlation with immune infiltration. It offers new avenues for the investigation of possible drug targets for the management of DKD-related ferroptosis and immune disorders.
Data Sharing Statement
All information in this study is taken from published sources, and it is appropriately recognized or referenced.
Statement of Ethics
According to Anhui Medical University’s Ethics Committee, the analysis of data from a public database does not involve the collection of clinical samples, so it is exempt from approval. The animal experiments were approved by the Anhui Medical University Animal Ethics Committee (LLSC20221089).
Author Contributions
All authors made a significant contribution to the work reported, whether in the conception, study design, execution, acquisition of data, analysis, and interpretation, or in all these areas, took part in drafting, revising, or critically reviewing the article, gave final approval of the version to be published, have agreed on the journal to which the article has been submitted, and have agreed to be accountable for all aspects of the work.
Funding
This research was supported financially by Provincial Natural Science Foundation of Anhui (grant no. 1908085MH245).
Disclosure
The authors report no conflicts of interest in this work.
References
1. Shlisky J, Bloom DE, Beaudreault AR, et al. Nutritional considerations for healthy aging and reduction in age-related chronic disease. Adv Nutr. 2017;8(1):17–26. doi:10.3945/an.116.013474
2. Zhang L, Long J, Jiang W, et al. Trends in chronic kidney disease in China. N Engl J Med. 2016;375(9):905–906. doi:10.1056/NEJMc1602469
3. Selby NM, Taal MW. An updated overview of diabetic nephropathy: diagnosis, prognosis, treatment goals and latest guidelines. Diabetes Obes Metab. 2020;22(Suppl 1):3–15. doi:10.1111/dom.14007
4. Yu Y, Yan Y, Niu F, et al. Ferroptosis: a cell death connecting oxidative stress, inflammation and cardiovascular diseases. Cell Death Discov. 2021;7(1):193. doi:10.1038/s41420-021-00579-w
5. Feng X, Wang S, Sun Z, et al. Ferroptosis enhanced diabetic renal tubular injury via HIF-1alpha/HO-1 pathway in db/db Mice. Front Endocrinol. 2021;12:626390. doi:10.3389/fendo.2021.626390
6. Kim S, Kang SW, Joo J, et al. Characterization of ferroptosis in kidney tubular cell death under diabetic conditions. Cell Death Dis. 2021;12(2):160. doi:10.1038/s41419-021-03452-x
7. Luo X, Gong HB, Gao HY, et al. Oxygenated phosphatidylethanolamine navigates phagocytosis of ferroptotic cells by interacting with TLR2. Cell Death Differ. 2021;28(6):1971–1989. doi:10.1038/s41418-020-00719-2
8. Kao JK, Wang SC, Ho LW, et al. M2-like polarization of THP-1 monocyte-derived macrophages under chronic iron overload. Ann Hematol. 2020;99(3):431–441. doi:10.1007/s00277-020-03916-8
9. Lu K, Dong S, Xia T, Mao L. Kupffer cells degrade (14)C-labeled few-layer graphene to (14)CO(2) in liver through erythrophagocytosis. ACS Nano. 2021;15(1):396–409. doi:10.1021/acsnano.0c07452
10. West AP, Brodsky IE, Rahner C, et al. TLR signalling augments macrophage bactericidal activity through mitochondrial ROS. Nature. 2011;472(7344):476–480. doi:10.1038/nature09973
11. Ni L, Cao J, Yuan C, Zhou LT, Wu X. Expression of ferroptosis-related genes is correlated with immune microenvironment in diabetic kidney disease. Diabetes Metab Syndr Obes. 2022;15:4049–4064. doi:10.2147/DMSO.S388724
12. Ma J, Li C, Liu T, et al. Identification of markers for diagnosis and treatment of diabetic kidney disease based on the ferroptosis and immune. Oxid Med Cell Longev. 2022;2022:9957172. doi:10.1155/2022/9957172
13. Jiang P, Yang F, Zou C, et al. The construction and analysis of a ferroptosis-related gene prognostic signature for pancreatic cancer. Aging. 2021;13(7):10396–10414. doi:10.18632/aging.202801
14. Hsieh CH, Hsieh HC, Shih FS, et al. An innovative NRF2 nano-modulator induces lung cancer ferroptosis and elicits an immunostimulatory tumor microenvironment. Theranostics. 2021;11(14):7072–7091. doi:10.7150/thno.57803
15. Li Z, Rong L. Cascade reaction-mediated efficient ferroptosis synergizes with immunomodulation for high-performance cancer therapy. Biomater Sci. 2020;8(22):6272–6285. doi:10.1039/d0bm01168a
16. Gu Z, Liu T, Liu C, et al. Ferroptosis-strengthened metabolic and inflammatory regulation of tumor-associated macrophages provokes potent tumoricidal activities. Nano Lett. 2021;21(15):6471–6479. doi:10.1021/acs.nanolett.1c01401
17. Woroniecka KI, Park AS, Mohtat D, Thomas DB, Pullman JM, Susztak K. Transcriptome analysis of human diabetic kidney disease. Diabetes. 2011;60(9):2354–2369. doi:10.2337/db10-1181
18. Barrett T, Wilhite SE, Ledoux P, et al. NCBI GEO: archive for functional genomics data sets--update. Nucleic Acids Res. 2013;41(Database issue):D991–D995. doi:10.1093/nar/gks1193
19. Chodary Khameneh S, Razi S, Shamdani S, Uzan G, Naserian S. Weighted correlation network analysis revealed novel long non-coding RNAs for colorectal cancer. Sci Rep. 2022;12(1):2990. doi:10.1038/s41598-022-06934-w
20. Liberzon A, Birger C, Thorvaldsdottir H, Ghandi M, Mesirov JP, Tamayo P. The molecular signatures database (MSigDB) hallmark gene set collection. Cell Syst. 2015;1(6):417–425. doi:10.1016/j.cels.2015.12.004
21. Zhou N, Bao J. FerrDb: a manually curated resource for regulators and markers of ferroptosis and ferroptosis-disease associations. Database. 2020;2020. doi:10.1093/database/baaa021
22. Ritchie ME, Phipson B, Wu D, et al. limma powers differential expression analyses for RNA-sequencing and microarray studies. Nucleic Acids Res. 2015;43(7):e47. doi:10.1093/nar/gkv007
23. Zhou M, Hu L, Zhang Z, Wu N, Sun J, Su J. Recurrence-associated long non-coding RNA signature for determining the risk of recurrence in patients with colon cancer. Mol Ther Nucleic Acids. 2018;12:518–529. doi:10.1016/j.omtn.2018.06.007
24. Yu G, Wang LG, Han Y, He QY. clusterProfiler: an R package for comparing biological themes among gene clusters. OMICS. 2012;16(5):284–287. doi:10.1089/omi.2011.0118
25. Wakonig B, Auersperg AMI, O’Hara M. String-pulling in the Goffin’s cockatoo (Cacatua goffiniana). Learn Behav. 2021;49(1):124–136. doi:10.3758/s13420-020-00454-1
26. Chin CH, Chen SH, Wu HH, Ho CW, Ko MT, Lin CY. cytoHubba: identifying hub objects and sub-networks from complex interactome. BMC Syst Biol. 2014;8(Suppl 4):S11. doi:10.1186/1752-0509-8-S4-S11
27. Wang W, Zhang J, Wang Y, Xu Y, Zhang S. Identifies microtubule-binding protein CSPP1 as a novel cancer biomarker associated with ferroptosis and tumor microenvironment. Comput Struct Biotechnol J. 2022;20:3322–3335. doi:10.1016/j.csbj.2022.06.046
28. Chen Y, Wang X. miRDB: an online database for prediction of functional microRNA targets. Nucleic Acids Res. 2020;48(D1):D127–D131. doi:10.1093/nar/gkz757
29. Zhou KR, Liu S, Sun WJ, et al. ChIPBase v2.0: decoding transcriptional regulatory networks of non-coding RNAs and protein-coding genes from ChIP-seq data. Nucleic Acids Res. 2017;45(D1):D43–D50. doi:10.1093/nar/gkw965
30. Zhang Q, Liu W, Zhang HM, et al. hTFtarget: a comprehensive database for regulations of human transcription factors and their targets. Genomics Proteomics Bioinformatics. 2020;18(2):120–128. doi:10.1016/j.gpb.2019.09.006
31. Cotto KC, Wagner AH, Feng YY, et al. DGIdb 3.0: a redesign and expansion of the drug-gene interaction database. Nucleic Acids Res. 2018;46(D1):D1068–D1073. doi:10.1093/nar/gkx1143
32. Steen CB, Liu CL, Alizadeh AA, Newman AM. Profiling cell type abundance and expression in bulk tissues with CIBERSORTx. Methods Mol Biol. 2020;2117:135–157. doi:10.1007/978-1-0716-0301-7_7
33. Liu XQ, Jiang L, Li YY, et al. Wogonin protects glomerular podocytes by targeting Bcl-2-mediated autophagy and apoptosis in diabetic kidney disease. Acta Pharmacol Sin. 2022;43(1):96–110. doi:10.1038/s41401-021-00721-5
34. Schmid H, Boucherot A, Yasuda Y, et al. Modular activation of nuclear factor-kappaB transcriptional programs in human diabetic nephropathy. Diabetes. 2006;55(11):2993–3003. doi:10.2337/db06-0477
35. Ju W, Greene CS, Eichinger F, et al. Defining cell-type specificity at the transcriptional level in human disease. Genome Res. 2013;23(11):1862–1873. doi:10.1101/gr.155697.113
36. Ju W, Nair V, Smith S, et al. Tissue transcriptome-driven identification of epidermal growth factor as a chronic kidney disease biomarker. Sci Transl Med. 2015;7(316):316ra193. doi:10.1126/scitranslmed.aac7071
37. Liao CM, Wulfmeyer VC, Chen R, et al. Induction of ferroptosis selectively eliminates senescent tubular cells. Am J Transplant. 2022;22(9):2158–2168. doi:10.1111/ajt.17102
38. Wang YH, Chang DY, Zhao MH, Chen M. Glutathione peroxidase 4 is a predictor of diabetic kidney disease progression in type 2 diabetes mellitus. Oxid Med Cell Longev. 2022;2022:2948248. doi:10.1155/2022/2948248
39. Shaw J, Chakraborty A, Nag A, Chattopadyay A, Dasgupta AK, Bhattacharyya M. Intracellular iron overload leading to DNA damage of lymphocytes and immune dysfunction in thalassemia major patients. Eur J Haematol. 2017;99(5):399–408. doi:10.1111/ejh.12936
40. Li S, Huang Y. Ferroptosis: an iron-dependent cell death form linking metabolism, diseases, immune cell and targeted therapy. Clin Transl Oncol. 2022;24(1):1–12. doi:10.1007/s12094-021-02669-8
41. Feng ST, Yang Y, Yang JF, et al. Urinary sediment CCL5 messenger RNA as a potential prognostic biomarker of diabetic nephropathy. Clin Kidney J. 2022;15(3):534–544. doi:10.1093/ckj/sfab186
42. Ito S, Nakashima H, Ishikiriyama T, et al. Effects of a CCR2 antagonist on macrophages and Toll-like receptor 9 expression in a mouse model of diabetic nephropathy. Am J Physiol Renal Physiol. 2021;321(6):F757–F770. doi:10.1152/ajprenal.00191.2021
43. Seok SJ, Lee ES, Kim GT, et al. Blockade of CCL2/CCR2 signalling ameliorates diabetic nephropathy in db/db mice. Nephrol Dial Transplant. 2013;28(7):1700–1710. doi:10.1093/ndt/gfs555
44. Kim HR, Kim SY. Perilla frutescens sprout extract protect renal mesangial cell dysfunction against high glucose by modulating AMPK and NADPH oxidase signaling. Nutrients. 2019;11(2). doi:10.3390/nu11020356
45. Saisorn W, Saithong S, Phuengmaung P, et al. Acute kidney injury induced lupus exacerbation through the enhanced neutrophil extracellular traps (and apoptosis) in fcgr2b deficient lupus mice with renal ischemia reperfusion injury. Front Immunol. 2021;12:669162. doi:10.3389/fimmu.2021.669162
46. Zhou XJ, Cheng FJ, Qi YY, et al. FCGR2B and FCRLB gene polymorphisms associated with IgA nephropathy. PLoS One. 2013;8(4):e61208. doi:10.1371/journal.pone.0061208
47. Chen TK, Coca SG, Thiessen-Philbrook HR, et al. Urinary biomarkers of tubular health and risk for kidney function decline or mortality in diabetes. Am J Nephrol. 2022;53(11–12):775–785. doi:10.1159/000528918
48. Johnson NH, Keane RW, de Rivero Vaccari JP. Renal and inflammatory proteins as biomarkers of diabetic kidney disease and lupus nephritis. Oxid Med Cell Longev. 2022;2022:5631099. doi:10.1155/2022/5631099
49. Guo C, Zhang L, Nie L, et al. Association of polymorphisms in the MyD88, IRAK4 and TRAF6 genes and susceptibility to type 2 diabetes mellitus and diabetic nephropathy in a southern Han Chinese population. Mol Cell Endocrinol. 2016;429:114–119. doi:10.1016/j.mce.2016.04.003
50. Yuan Y, Li L, Zhu L, et al. Mesenchymal stem cells elicit macrophages into M2 phenotype via improving transcription factor EB-mediated autophagy to alleviate diabetic nephropathy. Stem Cells. 2020;38(5):639–652. doi:10.1002/stem.3144
51. Klessens CQF, Zandbergen M, Wolterbeek R, et al. Macrophages in diabetic nephropathy in patients with type 2 diabetes. Nephrol Dial Transplant. 2017;32(8):1322–1329. doi:10.1093/ndt/gfw260
52. Tang PM, Nikolic-Paterson DJ, Lan HY. Macrophages: versatile players in renal inflammation and fibrosis. Nat Rev Nephrol. 2019;15(3):144–158. doi:10.1038/s41581-019-0110-2
53. Tesch GH. Macrophages and diabetic nephropathy. Semin Nephrol. 2010;30(3):290–301. doi:10.1016/j.semnephrol.2010.03.007
54. Lampropoulou IT, Stangou M, Sarafidis P, et al. TNF-alpha pathway and T-cell immunity are activated early during the development of diabetic nephropathy in Type II Diabetes Mellitus. Clin Immunol. 2020;215:108423. doi:10.1016/j.clim.2020.108423
55. Ribot JC, Lopes N, Silva-Santos B. gammadelta T cells in tissue physiology and surveillance. Nat Rev Immunol. 2021;21(4):221–232. doi:10.1038/s41577-020-00452-4
56. Cortvrindt C, Speeckaert R, Moerman A, Delanghe JR, Speeckaert MM. The role of interleukin-17A in the pathogenesis of kidney diseases. Pathology. 2017;49(3):247–258. doi:10.1016/j.pathol.2017.01.003
57. Peng X, Xiao Z, Zhang J, Li Y, Dong Y, Du J. IL-17A produced by both gammadelta T and Th17 cells promotes renal fibrosis via RANTES-mediated leukocyte infiltration after renal obstruction. J Pathol. 2015;235(1):79–89. doi:10.1002/path.4430
 © 2023 The Author(s). This work is published and licensed by Dove Medical Press Limited. The full terms of this license are available at https://www.dovepress.com/terms.php and incorporate the Creative Commons Attribution - Non Commercial (unported, v3.0) License.
By accessing the work you hereby accept the Terms. Non-commercial uses of the work are permitted without any further permission from Dove Medical Press Limited, provided the work is properly attributed. For permission for commercial use of this work, please see paragraphs 4.2 and 5 of our Terms.
© 2023 The Author(s). This work is published and licensed by Dove Medical Press Limited. The full terms of this license are available at https://www.dovepress.com/terms.php and incorporate the Creative Commons Attribution - Non Commercial (unported, v3.0) License.
By accessing the work you hereby accept the Terms. Non-commercial uses of the work are permitted without any further permission from Dove Medical Press Limited, provided the work is properly attributed. For permission for commercial use of this work, please see paragraphs 4.2 and 5 of our Terms.