Back to Journals » Journal of Inflammation Research » Volume 16
Integrated Analysis Identifies Upregulated SAMD9L as a Potential Biomarker Correlating with the Severity of Primary Sjögren’s Syndrome
Authors Zhou D ![]() , Yu X, Yu K, Ren Y
, Yu X, Yu K, Ren Y ![]() , Yang K, Wang X
, Yang K, Wang X ![]() , Wang Q
, Wang Q ![]()
Received 23 April 2023
Accepted for publication 25 July 2023
Published 28 August 2023 Volume 2023:16 Pages 3725—3738
DOI https://doi.org/10.2147/JIR.S413581
Checked for plagiarism Yes
Review by Single anonymous peer review
Peer reviewer comments 2
Editor who approved publication: Professor Ning Quan
Donghai Zhou,1,* Xue Yu,2,* Kai Yu,3 Yating Ren,2 Kepeng Yang,1 Xinchang Wang,1 Qiao Wang4
1Department of Rheumatology, The Second Affiliated Hospital of Zhejiang Chinese Medical University, Hangzhou, Zhejiang Province, 310005, People’s Republic of China; 2The Second Clinical Medical College, Zhejiang Chinese Medical University, Hangzhou, Zhejiang Province, 310005, People’s Republic of China; 3Department of Hepatology 1, Xixi Hospital of Hangzhou, Hangzhou, Zhejiang Province, 310023, People’s Republic of China; 4College of Basic Medical Science, Zhejiang Chinese Medical University, Hangzhou, Zhejiang Province, 310053, People’s Republic of China
*These authors contributed equally to this work
Correspondence: Qiao Wang; Xinchang Wang, Email [email protected]; [email protected]
Background: Primary Sjögren’s syndrome (pSS) is an autoimmune disease with lymphocytic infiltration of the salivary and lachrymal glands, whose present disease-specific objective indicators are few and have shortcomings that should be addressed. An integrated analysis of sequencing data from different cohorts has the potential to unveil novel biomarkers in pSS.
Methods: We identified 3 GEO datasets, including gene expression data from minor salivary gland (MSG) biopsy samples of 49 patients with pSS and 31 non-pSS and whole blood cells of 30 pSS patients and 30 healthy controls (HCs). Differentially expressed genes (DEGs) involved in pSS were identified from these datasets. Function Enrichment Analyses of common upregulated DEGs and PPI (protein-protein interaction) networks were performed. Furthermore, we have carried out further analysis of these DEGs to explore their potential clinical significance and diagnostic efficacy as a biomarker for pSS. Sterile Alpha Motif Domain Containing 9 Like (SAMD9L), one of the DEGs, has been identified as a promising candidate biomarker that correlates with the severity of pSS. This has been validated by analyzing local clinical samples from 30 pSS and non-pSS patients’ MSG biopsies, as well as serum samples of 18 pSS and HC individuals. Finally, we performed correlation analysis to understand the relationship between SAMD9L and infiltrated immune cells.
Results: We identified 10 common highly expressed DEGs in pSS of different tissues. These genes were mainly involved in virus infection-related pathways and inferno-related pathways. GEO data and our clinical data showed that SAMD9L increases with disease severity. Public and local cohorts showed that SAMD9L has high diagnostic performance (AUC=0.845– 0.867) as a biomarker, and its AUC was comparable to the Focus score when combined with RF or SSA.
Conclusion: Up-regulated SAMD9L may serve as a promising novel pSS diagnostic biomarker and have potential value for evaluating the severity of pSS.
Keywords: Sjögren’s syndrome, SAMD9L, biomarker, integrated analysis
Introduction
Sjögren’s syndrome (SS) is a systemic autoimmune disease characterized by high lymphocyte infiltration of exocrine glands. It occurs mainly in its primary form (pSS) and affects 0.5–1.0% of the population.1,2 In the recent SS diagnostic criteria, the classification criteria are based on objective indicators such as minor salivary gland (MSG) biopsy, serological markers, and the quantification of the secretory function of the lacrimal and salivary glands.3 Although the diagnostic sensitivity of the new classification has improved compared with the old classification criteria, improvements can still be made in SS diagnosis. In serological markers, a study showed that the sensitivity of anti-SSA antibodies was 79.7%, and the specificity was 94.1% according to the 2002 American-European Consensus Group (AECG) classification criteria; It is also present in systemic lupus erythematosus (SLE), other systemic rheumatic diseases, and healthy controls.4 Moreover, anti-SSB antibodies are ineffective SS diagnostic indicators according to the latest 2016 ACR/EULAR classification criteria. In addition, ocular staining can lead to irritation of the eyes and generally requires the operation of an ophthalmologist.5 Thus, it is necessary to determine more easy-to-use disease-relevant markers to update classification criteria.
Immune cell infiltration can reflect the severity of diseases and evaluate the effectiveness of therapy in cancer and autoimmune diseases. Lymphocyte infiltration is an important feature of SS MSG lesions. T lymphocytes and B lymphocytes make up the majority of inflammatory cells in the immune infiltrating tissue, while antigen-presenting cells have been reported in heavy infiltrates. Christodoulou et al suggested that total T cells, CD4+ T cells, T regulatory cells (Tregs), B lymphocytes, macrophages, and interdigitating dendritic cells were significantly different among target tissues with mild, intermediate, or severe inflammatory lesions.6 Biomarkers that correlate with lymphocyte infiltration may partly replace MSG biopsy to diagnose SS, especially when a false-negative result occurs in the biopsy. A recent example is the CXCL13 gene, which has been shown to be a promising biomarker reflecting the inflammatory infiltrate in SS.7
In recent years, advancements in genome sequencing technologies have led to the generation of a tremendous volume of high-throughput biomedical data, which require extensive bioinformatics to process and interpret these data. Various tools have been developed for the integrative analysis of transcriptomic profiles in bulk samples, providing opportunities to identify potential prognostic markers and therapeutic targets. For example, Luo identified 51 common upregulated genes among 5 pSS microarray and RNA-seq datasets, using WGCNA analysis to find the key module genes and inflammation-related pathways and eventually obtaining 7 ICOS-relevant hub genes in pSS pathogenesis.8 In this study, we analyzed three pSS sequencing datasets via integrated bioinformatics analysis and further screened an immune infiltration correlated gene, demonstrating that a potential biomarker can distinguish pSS from non-pSS with relatively high specificity and correlate with pSS disease severity.
Materials and Methods
The Flowchart
The flowchart, as depicted in Figure 1, provides a representation of our study design. Firstly, we obtained GEO datasets to identify the common differentially expressed genes (DEGs) involved in primary Sjögren’s syndrome (pSS). Subsequently, we performed function enrichment analyses of the common upregulated DEGs and constructed protein-protein interaction (PPI) networks. Next, we conducted further analysis of these DEGs to investigate their potential clinical significance and diagnostic efficacy as a biomarker for pSS using clinical data from the GEO dataset. Among the DEGs, SAMD9L emerged as a promising candidate biomarker that exhibits a correlation with the severity of pSS. Finally, the diagnostic efficiency and disease severity correlation of SAMD9L were validated using our clinical data. Additionally, correlation analyses were performed to explore the relationship between SAMD9L and infiltrating immune cells.
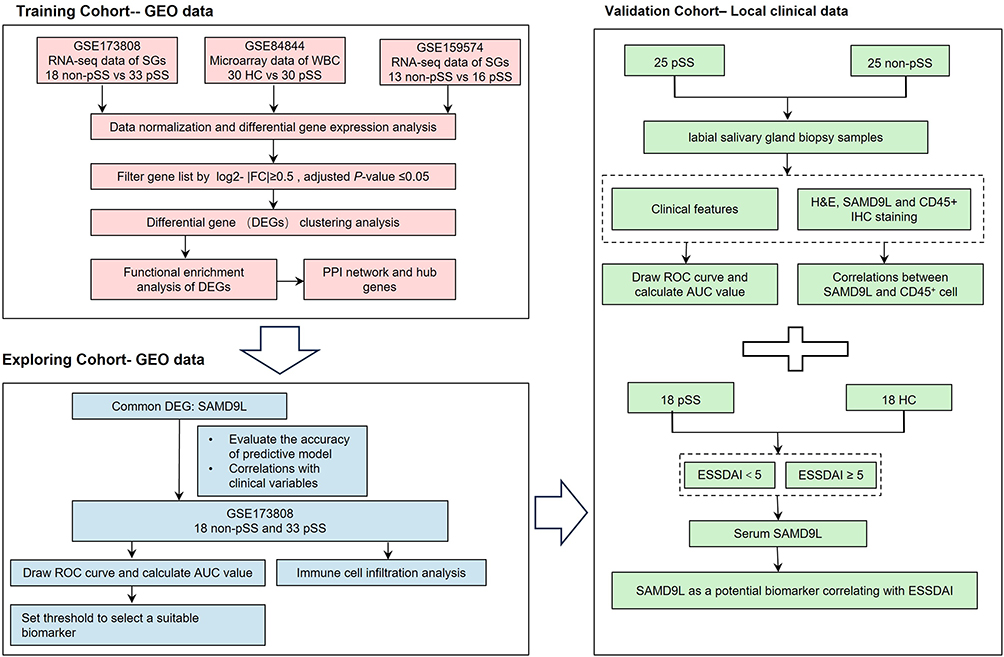 |
Figure 1 Flowchart of the study. |
Data Download and Preprocessing
Based on the primary aims of this study, one microarray and two RNA-seq datasets were chosen for subsequent analysis. The pSS datasets GSE84844,9 GSE173808,10 and GSE15957411 were downloaded from the corresponding supplementary file from the Gene Expression Omnibus (GEO, https://www.ncbi.nlm.nih.gov/geo/). The microarray datasets, GSE84844, contained 30 pSS and 30 healthy controls (HCs) whole blood cell samples. The high-throughput sequencing datasets, GSE173808 and GSE159574, contained 33 pSS and 18 control salivary gland samples and 16 pSS and 13 non-pSS salivary gland samples, respectively.
Bioinformatics Analysis
According to the platform file, gene probes and ensemble IDs were converted to gene symbols. The mean value was calculated for multiple probes corresponding to the gene name. Genes with low expression levels across all samples were removed, and data were normalized using the “NormalizeBetweenArrays” tool. Differentially expressed genes (DEGs) were identified using the “limma” package with a cutoff criteria of absolute log2 Fold-Change≥0.5 and adjusted P-value ≤0.05.12 The results were visualized using a volcano map. Venn diagrams were used to display the common DEGs from the three datasets using FunRich software (Version 3.1.3). Gene Ontology (GO) annotation was performed using the GOplot and ggplot2 package in R. A P-value <0.05 was set as the cutoff criterion for significance. The correlation between the 10 common DEGs was visualized using the “Corrplot” package in R. Protein-protein interaction (PPI) network data was downloaded from the Search Tool for the Retrieval of Interacting Genes database (https://string-db.org/), and diagrams were drawn using Cytoscape software (version 3.5.0). The number of gene nodes in the PPI network was calculated and visualized using the R package. Genes with high module membership were considered hub genes and were selected as candidate genes.
Screening Common DEGs Related to Clinical Indicators and Identifying Candidate Biomarker of pSS via GEO Data
To study the correlation between the candidate hub DEG (SAMD9L) identified by PPI and pSS-related clinical indicators, we further analyzed the data using the GSE173808 dataset. ESSDAI was classified into three groups from moderate to severe: 0–4; 5–13, ≥14; MSG focus score was classified into four groups from moderate to severe: <1, 1–1.9, 2–2.9, ≥3; and RF and SSA were grouped positive and negative. To evaluate the clinical value of candidate genes, the expression levels of hub DEGs in clinically relevant subgroups were plotted as bar graphs, and the correlations between clinical parameters were drawn as Corrplots by R. GSE84844 microarray data (HC n=30, pSS n=30) were used to confirm the relative expression levels of SAMD9L in pSS patients and HCs. To analyze diagnostic values, including the area under the curve (AUC), sensitivity, and specificity, the pROC package was used to compute the receiver operating characteristic analysis (ROC) curves of candidate genes and clinical parameters obtained from the GSE173808 dataset.
Histochemical and Immunohistochemical Staining in MSGs
A total of 50 participants were included in this part, comprising 25 patients with pSS diagnosed in accordance with the revised 2016 ACR/EULAR classification criteria and 25 non-pSS patients who served as the control group (Table 1). These individuals were recruited from patients who undergo examinations of the MSGs at the Second Affiliated Hospital of Zhejiang Chinese Medical University. The MSGs from pSS patients and non-pSS were fixed in 4% formalin, dehydrated, embedded in paraffin, and sectioned for immunohistochemical staining. For immunohistochemistry assays, the slides were probed with an anti-SAMD9L primary antibody (Proteintech, China) and an anti-CD45 antibody (Proteintech, China). The tissue section images were captured and processed by K-Viewer software (version 1.5.5.5). The percentage of SAMD9L positive areas was calculated with Image Pro Plus 6.0 software. Four fields per sample were randomly selected based on DAPI staining and were averaged.
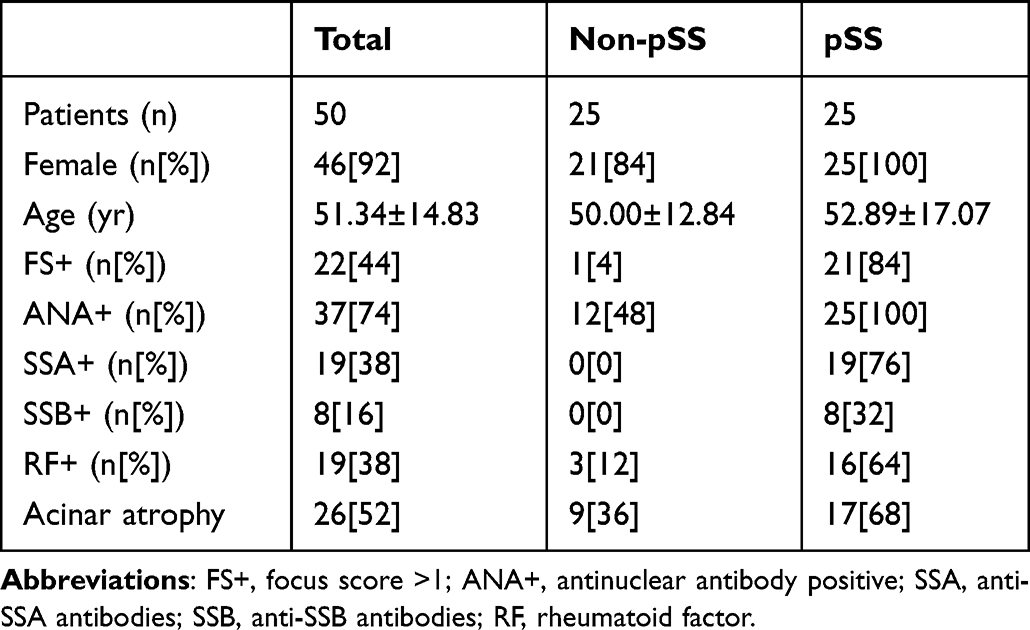 |
Table 1 Clinical Characteristics of Patients with Salivary Gland Origin |
Serum SAMD9L Expression in pSS with Different ESSDAI
To further validate SAMD9L expression levels in serum, samples of healthy controls (n=18) and pSS patients (n=18) were collected from the Second Affiliated Hospital of Zhejiang Chinese Medical University. The baseline characteristics of pSS and HCs who agreed to provide serum samples were shown in Supplementary Table 1. To evaluate the relationship between disease activity and serum expression level, the pSS cohort was divided into Sjögren’s syndrome disease activity index (ESSDAI) < 5 and ESSDAI ≥ 5 subgroups. Serum SAMD9L expression levels were measured by ELISA (Jianglaibio, China) according to the manufacturer’s protocol.
Identifying Potential Biomarker of pSS via Clinical Data
Collecting SAMD9L positive areas, SSA positive status, and serum RF values from our clinical data. Then, logistic regression models were built using the function glm of the R package. ROC analyses were performed with the “pROC” package, and the “ggplot2” package was used to visualize data.
Statistical Analysis
The common DEGs associated with clinical features were batch-filtered using non-parametric analyses. Inter-group differences were evaluated using the Wilcox and Kruskal–Wallis tests with a P-value <0.01. Univariate analyses were conducted using the SPSS software (Version 20). For normally distributed continuous variables, the data were analyzed using the Student’s t-test. To avoid conforming to the normally distributed continuous variables, the data were analyzed using a non-parametric test (Mann–Whitney U-test). The Chi-square test was used for categorical data.
Results
Identification of DEGs Involved in pSS
A total of 1068 genes were overexpressed in pSS patients compared with non-pSS patients, and 146 genes were downregulated in salivary glands (GSE173808), as shown in Figure 2A. A total of 259 genes were upregulated in pSS patients compared with HC, and 21 genes were downregulated in whole blood cells (GSE84844), as shown in Figure 2B. A total of 41 genes were upregulated in pSS patients compared with non-pSS patients, and 1 gene was downregulated in salivary glands (GSE159574), as shown in Figure 2C. Taking the intersection of DEGs from three datasets, 10 common DEGs were reserved, as shown in Figure 2D, including SAMD9L, TFEC, EPSTI1, ICOS, CXCL10, TRIM22, SAMD9, PARP9, PARP12, and GBP1.
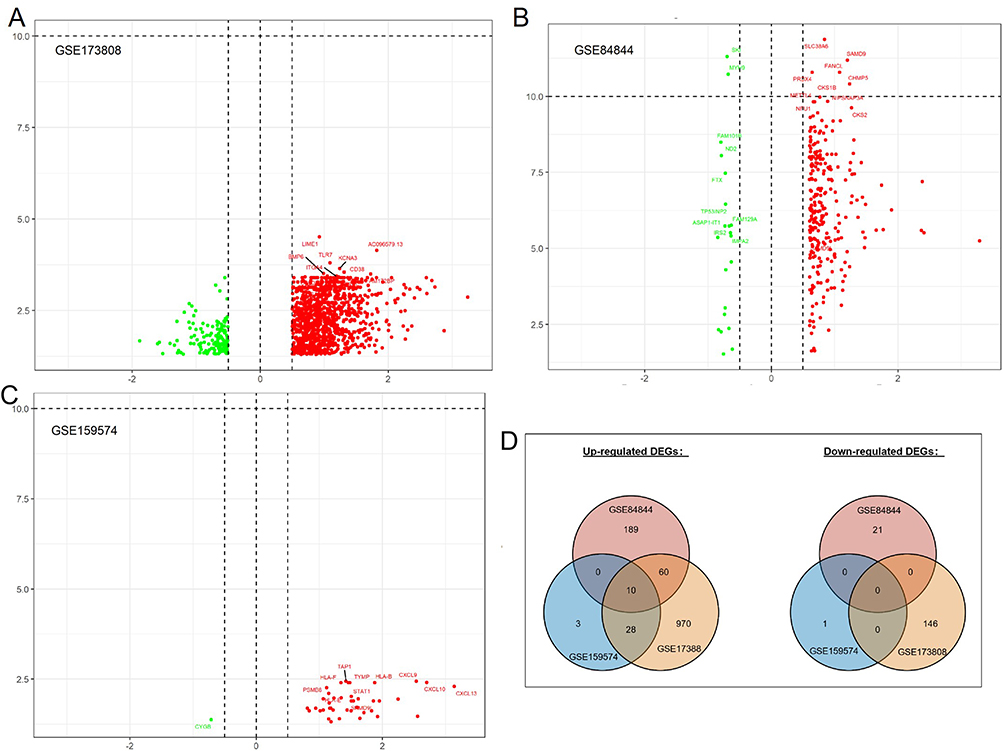 |
Figure 2 Volcano plot showing the gene expression changes in pSS of different tissues: (A) DEGs of non-pSS vs pSS in RNA-seq of the minor salivary gland, (B) DEGs of pSS vs HC in RNA-seq data of whole blood cells, (C) DEGs of non-pSS vs pSS in RNA-seq of minor salivary glands, and (D) Venn diagram showing the common DEGs of the 3 datasets. (A–C): Green represents down-regulated, and red represents up-regulated genes. |
Function Enrichment Analysis of Common Upregulated DEGs
Using the DAVID database, we conducted Function Enrichment Analysis on the 10 common DEGs. The top five GO terms related biological processes among DEGs were response to virus, cellular response to interferon-gamma, and interferon-gamma-mediated signaling pathway (Figure 3A and B). The terms related to molecular functions were mainly involved in NAD+ ADP-ribosyltransferase activity, transcription corepressor activity, and transferase activity, transferring pentosyl groups (Figure 3D and E). In addition, there is no significant correlation between the external side of the plasma membrane, the site of DNA damage, and the Cajal body in relation to the cellular components (Figure 3C and D). These genes could be related to multiple biological pathways orchestrating pSS.
 |
Figure 3 Functional enrichment analysis of upregulated DEGs. The significantly enriched (A and B) GO-biological processes, (C) GO-cellular component, and (D and E) GO-molecular function. |
Screening of Hub Common DEGs That Associates with Clinical Indicators
The Corrplot indicated that the 10 common DEGs were highly correlated with each other (Figure 4A). Among the 10 common DEGs, SAMD9L, EPSTI1, CXCL10, TRIM22, SAMD9, PARP9, PARP12, and GBP1 with 3 or more adjacent nodes were regarded as hub DEGs (Figure 4B and C). Especially, the PPI network showed that SAMD9L was the dominant node with the highest degree.
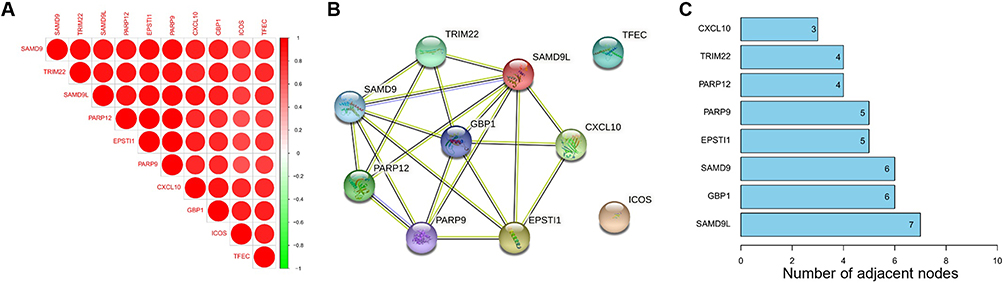 |
Figure 4 Correlation analysis of 10 common DEGs (A) Corrplot of 10 genes, (B) PPI network of 10 genes, (C) PPI node counts. |
Exploring of Hub Common DEGs Related to Clinical Indicators via GEO Data
We carried out further research to investigate SAMD9L expression among subgroups of clinical metrics related to pSS. The clinicopathologic characteristics of the 51 study patients from GSE173808 are shown in Supplementary Table 2. No significant differences were observed in age, sex, or ESSDAI (P>0.05). The expression of ICOS, EPSTI1, and SAMD9L in MSG tissue was significantly higher in pSS patients than in non-pSS patients (P<0.001); more SSA+ and RF+ patients in the pSS group than in the non-pSS group (P<0.001). In terms of the above four clinical parameters: Focus score, ESSDAI, SSA, and RF value, the results indicated that 3 genes, namely, SAMD9L, ICOS, and EPSTI1, had intergroup differences (P<0.05) at the same time (Supplementary Table 3).
Given the integrated analysis results and the research progress of the above-mentioned genes in this field, we focused on the SAMD9L gene and conducted a more detailed grouping. The results showed that the expression of SAMD9L in the pSS group was significantly increased compared with that in the HCs (P<0.0001, Figure 5A). Similarly, the SAMD9L expression level became significantly higher in the pSS group than that of the non-pSS group (P<0.0001, Figure 5B). The expression of SAMD9L showed a significant increase when the MSG focus score increased. (Figure 5C). Moreover, the expression level of SAMD9L in the ESSDAI ≥14 group was higher than that in the ESSDAI≤4 group (P<0.05, Figure 5D). The expression levels of SAMD9L in SSA-negative and RF-negative patients were lower than those in the positive patients (P<0.0001, Figure 5E and F).
 |
Figure 5 Levels of SAMD9L expression in pSS-related clinical metrics subgroup and their correlation. (A) SAMD9L levels in HC and pSS groups. (B) SAMD9L levels in non-pSS and pSS groups. (C) SAMD9L levels in 4 levels of focus score: <1, 1–1.9, 2–2.9, ≥3. (D) SAMD9L levels in 3 levels of ESSDAI: ≤4, 5–13, ≥14. (E and F) SAMD9L levels in SSA and RF negative and positive groups. |
Verifying the Differences in SAMD9L Expression via Clinical Samples
MSG samples and related clinical information were obtained from 25 pSS and 25 non-pSS subjects to further validate the SAMD9L expression using IHC. Table 1 displays the demographic and clinical characteristics of the participants. The pathology sections showed that there were obvious focal lymphocyte infiltration, acinar atrophy, and duct dilation in MSG of pSS. Consistently, SAMD9L in MSGs significantly increased than in the non-pSS group (Figure 6A). The quantitative analysis of the SAMD9L positive area showed a significant increase in pSS than that of non-pSS (Figure 6B). As shown in Figure 6C, ELISA tests of the SAMD9L expression levels in the serum from HCs and pSS were consistent with the IHC results. The SAMD9L expression was higher in pSS than in HC (P<0.01). Comparisons between subgroups were made to verify the differential expression of SAMD9L between patients with different disease activities. Likewise, the expression level of SAMD9L in the ESSDAI ≥5 group was higher than that in the ESSDAI<5 group (P<0.05, Figure 6D).
 |
Figure 6 Higher SAMD9L expression in pSS patients than in non-pSS. (A) representative HE staining, SAMD9L staining of MSGs from pSS and non-pSS; (B) quantification analysis of SAMD9L positive area. (C) Serum SAMD9L levels of HC and pSS patients. (D) Serum SAMD9L levels of ESSDAI<5 and ≥5. ***P<0.001, *P<0.05. |
Diagnostic Value of SAMD9L for pSS
To evaluate the diagnostic value of SAMD9L in pSS diagnosis, we plotted the ROC curves using the SAMD9L gene expression level and RF and SSA values in MSG by the GEO data. For comparison, we also plot ROC curves according to whether FS is positive or not. The results showed a good performance with an AUC of 0.845, and the classification model reached higher performance when combined with RF or SSA (AUC=0.874, AUC=0.891, respectively, Figure 7A). When it comes to the focus score, the corresponding area under the ROC curve was 0.882 (Figure 7B). To further test the model prediction performance, we further cross-validated with leave-one-out validation. To further test our findings, we conducted validation in our local clinical data. The percentage of SAMD9L positive areas showed a good performance with an AUC of 0.876, and the AUC reached 0.918 when combined with RF (Figure 7C). Notably, the diagnostic performance of SAMD9L+RF was significantly better than that of SAMD9L (P=0.038, Supplementary Table 4). From the ROC curves, we found that the FS (AUC=0.900 in the validation cohort, Figure 7D) was better than the single SAMD9L while not as good as SAMD9L+RF.
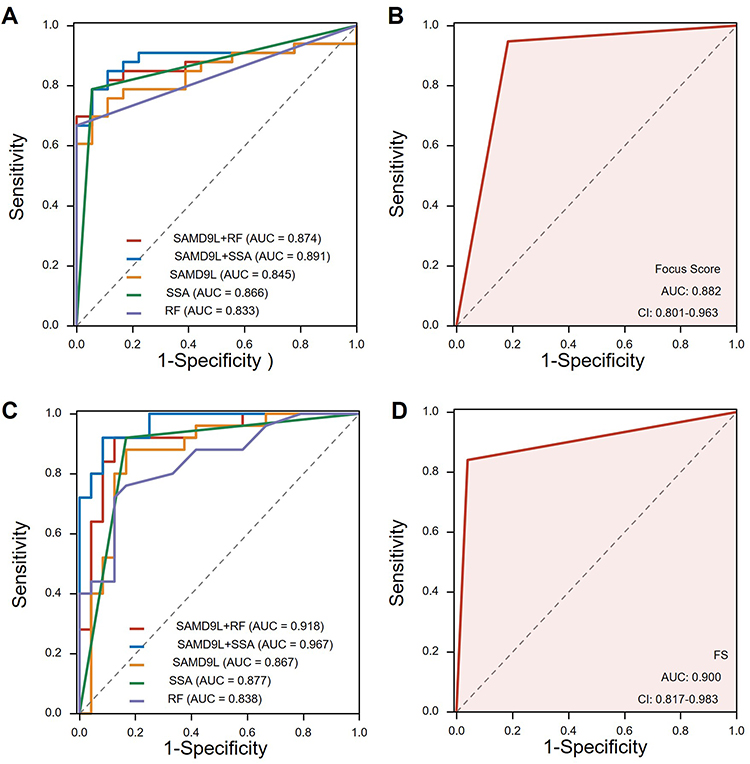 |
Figure 7 Receiver operating characteristic curve of pSS prediction. (A) ROC curves using the SAMD9L gene expression level in MSG by the GEO data. (B) ROC curves according to whether the focus score >1 or not from GEO data. (C) ROC curves using the percentage of SAMD9L positive areas by our clinical data. (D) ROC curves drawn by focus score >1 or not using our clinical data. Abbreviations: AUC, area under the curve; FS, focus score. |
Correlation Between SADM9L and Immune Cells
To explore the underlying mechanisms associated with SAMD9L in pSS, we extracted the gene expression matrix from GSE173808. As shown in Figure 8A and B, the percentage of CD45+ immune cells in MSGs of pSS was significantly higher than that of non-pSS. A strong positive correlation was found between SAMD9L and labial CD45 percentage. Likewise, CD45 staining of our clinical samples confirmed consistent results (Figure 8C). Furthermore, the CIBERSORT algorithm was used to estimate the relative proportions of 22 infiltrated immune cell types in the MSGs (Supplementary Figure 1). Four out of the 22 types of cells, including B memory cells, CD4+ T memory activated cells, and M1 and M2 macrophages increased remarkably in pSS. In contrast, the proportion of B naive cells, CD4+ T memory resting cells, and monocytes decreased (Supplementary Figure 2). Moreover, a correlation analysis between the expression of SAMD9L and the infiltration fraction of immune cells revealed that the expression of SAMD9L was positively correlated with the infiltration fraction of macrophages M1 and gamma delta T cells, while it was negatively correlated with plasma cells (Figure 8D–F). Moreover, Co-expression analysis of macrophage marker and SAMD9L positive cells were performed. The results showed that there was a positive correlation between the expression of SAMD9L and the infiltration fraction of macrophage M1 (Supplementary Figure 3).
 |
Figure 8 Correlation between the expression of SAMD9L and immune cells. (A) percentage of CD45+immune cells in MSGs of pSS significantly higher than that of non-pSS. (B) a strong positive correlation was found between SAMD9L and labial CD45 percentage (C) CD45 staining of MSGs from pSS and non-pSS; (D–F) correlation between the expression of SAMD9L and infiltration fraction of immune cells. ***P<0.001. |
Discussion
The diagnosis of SS has undergone a development process from rough to fine, from subjective symptoms to objective indicators. The early diagnosis criteria for SS in the 1960s only needed to meet two of the three characteristics: keratoconjunctivitis, xerostomia, and RA. The subsequent discovery of SS serum markers and salivary gland biopsy further improved the specificity of SS classification. Since then, researchers have made many efforts to improve the diagnostic power of the SS classification criteria in terms of mouth and eye symptoms, objective measurements of lacrimal and salivary gland involvement, MSG biopsy, and autoantibodies. Compared with the first widely accepted 2002 revised AECG criteria, the 2012 criteria sought to classify patients with pSS solely based on objective items. However, the 2012 criteria were criticized as being unduly invasive as they required a slit lamp examination and corneal staining and/or lip biopsy. The 2016 ACR/EULA classification criteria for SS built a weighted scoring system and removed anti-La/SS-B antibodies as a serologic item. Despite recent advances, the present classification criteria are far from perfect for several reasons; for example, ocular staining can lead to irritation of the eyes and generally requires the operation of an ophthalmologist, and SSA has a high false-negative rate.5 It is imperative to discover and validate new SS biomarkers. In our study, we screened and validated SAMD9L as a novel gene that could be detected in pathology sections of the salivary gland and serum. SAMD9L has a suitable correlation with disease activity indices and infiltrated immune cells. Diagnosis efficiency analysis showed that SAMD9L could serve as a diagnostic biomarker with a high mean AUC value, especially when it was combined with RF. Preliminary studies suggest that SAMD9L increased with disease severity.
In our study, datasets from two types of pSS tissues were used to explore the DEGs. We identified 10 common upregulated DEGs between non-pSS and pSS from one microarray and two RNA-seq datasets, including SAMD9, TFEC, EPSTI1, ICOS, CXCL10, TRIM22, SAMD9L, PARP9, PARP12, and GBP1. Function Enrichment Analysis suggested that these genes are mainly involved in the defense response after virus infection and the subsequent interferon-mediated response. Among them, some genes are involved in the pSS pathogenesis. For example, CXCL10 is involved in the accumulation of infiltrating T cells in the salivary glands of pSS patients and induces CXCR3+ macrophage migration into the salivary glands; PARP-9 is overexpressed in pSS and could enhance the infiltration of mononuclear cells by upregulating CXCL10 expression.13,14 Further analysis revealed that SAMD9L was the dominant node with the highest degree in the PPI network diagram of the 10 genes, suggesting that they take effect in a synergistic manner and that SAMD9L is located at the core position in relevant biological processes. However, to the best of our knowledge, the role of a single SAMD9L gene in pSS has not yet been studied. This is despite its inclusion by Khuder SA in a diagnostic expression profile consisting of 19 genes related to pSS.15
To further investigate the potential clinical relevance of SAMD9L, correlation analyses were performed between DEGs and crucial clinical parameters. Among DEGs of function unknown in pSS, TFEC, SAMD9L, and SAMD9, SAMD9L was the only gene shown to differ between clinical indicators. The SAMD9L gene is located on chromosome 7q21.2 of the human genome, sharing considerable sequence similarity with its paralog SAMD9 in a head-to-tail orientation.16 As a novel gene discovered in recent years, little is known about its function in autoimmune diseases. Nevertheless, its importance has been emphasized in many physiological functions and pathological progression in tumors and viral infections. Recent studies have shown that SAMD9L can also be a genetic cause of myelodysplastic syndromes (MDSs), acute myeloid leukemia (AML) with monosomy 7, ataxia-pancytopenia syndrome, and myelodysplastic syndrome.17–21 Moreover, germline loss-of-function mutations in these genes have recently been described in children with systemic autoinflammatory disease but with no apparent risk of MDS or AML.17,22 Gain-of-function mutations increase infantile MDSs associated with monosomy 7 (MDS/–7) at extraordinarily high frequencies. In solid malignant tumors, its expression is deregulated in hepatocellular carcinoma (HCC) patients with hepatitis B virus (HBV) infection.23 SK-hep-1 and MHCC-97H cells with stable SAMD9L knockdown exhibited enhanced tumorigenicity in athymic mice; this may be due to the elevated activity of the Wnt/β-catenin pathway. Notably, SAMD9L plays a crucial role against viral infections such as the poxvirus family and West Nile virus infection.24,25 SAMD9L functions as a restriction factor forming a critical host barrier together with its homoparalogs SAMD9 that some viruses, such as poxviruses, must overcome to establish infection.26 SAMD9L overexpression can be induced by IFN type I and interferon regulatory factor (IRF) 1 and IRF2; the loss of IRF2 leads to SAMD9L suppression and enables cancer cells to escape from T cells.27–29 Studies have attempted to link pSS to the human Epstein–Barr virus, cytomegalovirus, T-lymphotropic virus type 1, hepatitis B, and hepatitis C because of their suppressive effects on T cell immunity and the ability to establish continual infection.30,31 Moreover, pSS etiology presents a highly expressed type I interferon signature in the peripheral blood and salivary glands of patients, a hallmark of host defense against viral infection. Consequently, we speculate that the increase of SAMD9L in pSS relates to its involvement in regulating the differentiation of immune cells and the body’s antiviral response.
Owing to the above-mentioned clinical and pathological correlations between SAMD9L, we evaluated its feasibility as a biomarker. GEO and local clinical data show that SAMD9L’s diagnostic performance as a biomarker is between RF and SSA and is lower than the focus score. However, when combined with diagnostically less atopic RF, its diagnostic sensitivity reached levels comparable to those of SSA and focus scores. Salivary gland biopsy is the gold standard for the diagnosis of SS, with sensitivity and specificity >80%.32 We believe that this finding is of significant importance in the diagnosis of SS, particularly in cases with negative anti-SSA results or salivary gland focus score < 1.
To understand the clinical significance behind the elevated levels of SAMD9L in pSS, we performed immune infiltration assays. CD45 is a hallmark molecule of lymphocytes. As expected, the proportion of CD45+ cells in the salivary glands of pSS patients was significantly increased in GEOs and our clinical samples, and SAMD9L expression was strongly correlated with labial CD45. Further analysis of immune infiltration showed that SAMD9L was highly correlated with macrophage M1, had a certain correlation with delta T cell, and had a negative correlation with plasma cell expression. In pSS, the role of the above three cells in the pathogenesis of the disease is still inconclusive. Virus infection is an important cause of pSS pathogenesis, and M1 is a polarized phenotype of classical activation of macrophages, which mainly produces pro-inflammatory factors. Under the induction of IFN-γ, TLRs on macrophages highly express co-stimulators after recognizing pathogens that activate T cells to clear the virus. γδT activated in the early stage of intracellular infection can release granzyme, perforin, and IFN-γ to kill and clear virus-infected target cells. Generally, viral infection activates the innate immune response, and virus-derived nucleic acid activates pDC through TLR9 and TLR7, secretes IFN-α, and then activates autoreactive B to promote its differentiation into plasma cells. We speculate that the negative correlation observed in this study may be due to the fact that the process is regulated by multiple factors and levels.
Despite its strengths, this study has some deficiencies that need to be improved in future research. Due to ethical issues and technical difficulties in extracting RNA from pathological sections, we were unable to verify the expression of SAMD9L in MSG tissues. Next, we will further study the expression of SAMD9L in peripheral blood PBMCs and expand the sample size to detect the correlation between SAMD9L and disease severity. Additionally, the clinical significance of SAMD9L in lymphomas that are susceptible to occurring alongside pSS will also be explored. Nevertheless, this study suggests that SAMD9L has the potential to be used as a novel biomarker associated with disease severity in pSS.
Conclusion
Our study is the first to report on the diagnostic efficacy of the individual SAMD9L gene as a biomarker for pSS and its correlation with disease severity. The up-regulated SAMD9L may serve as a promising novel pSS diagnostic biomarker. When combined with traditional pSS diagnostic markers such as RF and SSA, its diagnostic efficacy can be significantly improved. As a gene that is rarely reported in the pathogenesis of pSS, the expression level of SAMD9L increases with the severity of the disease. Our findings could help to improve the efficiency of pSS classification diagnosis, evaluate disease activity, monitor treatment response, and potentially become targets for therapeutic intervention in the future.
Data Sharing Statement
The original contributions presented in the study are publicly available. This data can be found here: Gene Expression Omnibus (GEO) (https://www.ncbi.nlm.nih.gov/geo/) (Accessions: GSE84844, GSE173808, and GSE159574).
Ethics Approval and Informed Consent
The use of specimens was carried out with the participants’ written informed consent in accordance with the principles of the Declaration of Helsinki. Our research was approved by the Ethics Committee of the Second Affiliated Hospital of Zhejiang Chinese Medical University (2021-LW-015-01). All participant records/information was anonymized and de-identified before analysis. Because this was an observational study and not a clinical trial, it was not registered in a clinical trials registry.
Acknowledgments
Donghai Zhou and Xue Yu are co-first authors for this study. Xinchang Wang and Qiao Wang are co-correspondence authors for this study. We thank the contributors of the GEO (http://www.ncbi.nlm.nih.gov/geo/) database for sharing their data on open access.
Author Contributions
All authors made a significant contribution to the work reported, whether that is in the conception, study design, execution, acquisition of data, analysis and interpretation, or in all these areas; took part in drafting, revising or critically reviewing the article; gave final approval of the version to be published; have agreed on the journal to which the article has been submitted; and agree to be accountable for all aspects of the work. Xinchang Wang and Qiao Wang are conjointly designated as corresponding authors.
Funding
This research was supported by the National Natural Science Foundation of China (82074341), the Foundation from Zhejiang Provincial Administration of Traditional Chinese Medicine (2021ZQ028), the Zhejiang Provincial Natural Science Foundation of China (LQ22H270011), Foundation of Zhejiang Chinese Medicine University (2020ZR10) and Foundation from Zhejiang Provincial Administration of Traditional Chinese Medicine (2023ZL057).
Disclosure
The authors declared that there are no conflicts of interest in this work.
References
1. Tsuboi H, Asashima H, Takai C, et al. Primary and secondary surveys on epidemiology of Sjögren’s syndrome in Japan. Mod Rheumatol. 2014;24(3):464–470. doi:10.3109/14397595.2013.843765
2. Glover K, Mishra D, Singh TRR. Epidemiology of ocular manifestations in autoimmune disease. Front Immunol. 2021;12:744396. doi:10.3389/fimmu.2021.744396
3. Shiboski CH, Shiboski SC, Seror R, et al. 2016 American College of Rheumatology/European league against rheumatism classification criteria for primary Sjögren’s Syndrome: a consensus and data-driven methodology involving three international patient cohorts. Arthritis Rheumatol. 2017;69(1):35–45. doi:10.1002/art.39859
4. Shunle C, Hejian Z. Rheumatology.
5. Whitcher JP, Shiboski CH, Shiboski SC, et al. A simplified quantitative method for assessing keratoconjunctivitis sicca from the Sjögren’s Syndrome International Registry. Am J Ophthalmol. 2010;149(3):405–415. doi:10.1016/j.ajo.2009.09.013
6. Christodoulou MI, Kapsogeorgou EK, Moutsopoulos HM. Characteristics of the minor salivary gland infiltrates in Sjögren’s syndrome. J Autoimmun. 2010;34(4):400–407. doi:10.1016/j.jaut.2009.10.004
7. Chatzis L, Goules AV, Stergiou IE, Voulgarelis M, Tzioufas AG, Kapsogeorgou EK. Serum, but not saliva, CXCL13 levels associate with infiltrating CXCL13+ cells in the minor salivary gland lesions and other histologic parameters in patients with Sjögren’s Syndrome. Front Immunol. 2021;12:705079. doi:10.3389/fimmu.2021.705079
8. Luo J, Liao X, Zhang L, et al. Transcriptome sequencing reveals potential roles of in primary Sjögren’s syndrome. Front Cell Dev Biol. 2020;8:592490. doi:10.3389/fcell.2020.592490
9. Tasaki S, Suzuki K, Nishikawa A, et al. Multiomic disease signatures converge to cytotoxic CD8 T cells in primary Sjögren’s syndrome. Ann Rheum Dis. 2017;76(8):1458–1466. doi:10.1136/annrheumdis-2016-210788
10. Luo J, Liao X, Zhang L, et al. Transcriptome sequencing reveals potential roles of ICOS in primary Sjögren’s syndrome. Front Cell Dev Biol. 2020;8:592490.
11. Verstappen GM, Gao L, Pringle S, et al. The transcriptome of paired major and minor salivary gland tissue in patients with primary Sjögren’s syndrome. Front Immunol. 2021;12:681941. doi:10.3389/fimmu.2021.681941
12. Ritchie ME, Phipson B, Wu D, et al. limma powers differential expression analyses for RNA-sequencing and microarray studies. Nucleic Acids Res. 2015;43(7):e47. doi:10.1093/nar/gkv007
13. Aota K, Ono S, Yamanoi T, Kani K, Momota Y, Azuma M. MMP-9 inhibition suppresses interferon-γ-induced CXCL10 production in human salivary gland ductal cells. Inflammation. 2019;42(6):2148–2158. doi:10.1007/s10753-019-01079-x
14. Tian Q, Zhao H, Ling H, et al. Poly(ADP-Ribose) polymerase enhances infiltration of mononuclear cells in primary Sjögren’s syndrome through interferon-induced protein with tetratricopeptide repeats 1-mediated up-regulation of CXCL10. Arthritis Rheumatol. 2020;72(6):1003–1012. doi:10.1002/art.41195
15. Khuder SA, Al-Hashimi I, Mutgi AB, Altorok N. Identification of potential genomic biomarkers for Sjögren’s syndrome using data pooling of gene expression microarrays. Rheumatol Int. 2015;35(5):829–836. doi:10.1007/s00296-014-3152-6
16. Li CF, MacDonald JR, Wei RY, et al. Human sterile alpha motif domain 9, a novel gene identified as down-regulated in aggressive fibromatosis, is absent in the mouse. BMC Genom. 2007;8:92. doi:10.1186/1471-2164-8-92
17. Tesi B, Davidsson J, Voss M, et al. Gain-of-function mutations cause a syndrome of cytopenia, immunodeficiency, MDS, and neurological symptoms. Blood. 2017;129(16):2266–2279. doi:10.1182/blood-2016-10-743302
18. Klco JM, Mullighan CG. Advances in germline predisposition to acute leukaemias and myeloid neoplasms. Nat Rev Cancer. 2021;21(2):122–137. doi:10.1038/s41568-020-00315-z
19. Asou H, Matsui H, Ozaki Y, Nagamachi A, Nakamura M, Aki D. Inaba T: identification of a common microdeletion cluster in 7q21.3 subband among patients with myeloid leukemia and myelodysplastic syndrome. Biochem Biophys Res Commun. 2009;383(2):245–251. doi:10.1016/j.bbrc.2009.04.004
20. Chen D-H, Below JE, Shimamura A, et al. Ataxia-pancytopenia syndrome is caused by missense mutations in SAMD9L. Am J Hum Genet. 2016;98(6):1146–1158. doi:10.1016/j.ajhg.2016.04.009
21. Nagamachi A, Matsui H, Asou H, et al. Haploinsufficiency of SAMD9L, an endosome fusion facilitator, causes myeloid malignancies in mice mimicking human diseases with monosomy 7. Cancer Cell. 2013;24(3):305–317. doi:10.1016/j.ccr.2013.08.011
22. de Jesus AA, Hou Y, Brooks S, et al. Distinct interferon signatures and cytokine patterns define additional systemic autoinflammatory diseases. J Clin Invest. 2020;130(4):1669–1682. doi:10.1172/JCI129301
23. Wang Q, Zhai -Y-Y, Dai J-H, Li K-Y, Deng Q, Han Z-G. SAMD9L inactivation promotes cell proliferation via facilitating G1-S transition in hepatitis B virus-associated hepatocellular carcinoma. Int J Biol Sci. 2014;10(8):807–816. doi:10.7150/ijbs.9143
24. Meng X, Schoggins J, Rose L, et al. C7L family of poxvirus host range genes inhibits antiviral activities induced by type I interferons and interferon regulatory factor 1. J Virol. 2012;86(8):4538–4547. doi:10.1128/JVI.06140-11
25. Li J, Ding SC, Cho H, Chung BC, Gale M, Chanda SK, Diamond MS. A short hairpin RNA screen of interferon-stimulated genes identifies a novel negative regulator of the cellular antiviral response. mBio. 2013;4(3):e00385–e00313. doi:10.1128/mBio.00385-13
26. Meng X, Zhang F, Yan B, et al. A paralogous pair of mammalian host restriction factors form a critical host barrier against poxvirus infection. PLoS Pathog. 2018;14(2):e1006884. doi:10.1371/journal.ppat.1006884
27. Liao W, Overman M, Boutin A, et al. KRAS-IRF2 axis drives immune suppression and immune therapy resistance in colorectal cancer. Cancer Cell. 2019;35(4):559–572.e557. doi:10.1016/j.ccell.2019.02.008
28. Dunn G, Bruce A, Sheehan K, et al. A critical function for type I interferons in cancer immunoediting. Nat Immunol. 2005;6(7):722–729. doi:10.1038/ni1213
29. Kivity S, Arango MT, Ehrenfeld M, et al. Infection and autoimmunity in Sjogren’s syndrome: a clinical study and comprehensive review. J Autoimmun. 2014;51:17–22. doi:10.1016/j.jaut.2014.02.008
30. Liu Z, Chu A. Sjögren’s syndrome and viral infections. Rheumatol Ther. 2021;8(3):1051–1059. doi:10.1007/s40744-021-00334-8
31. Fisher B, Jonsson R, Daniels T, et al. Standardisation of labial salivary gland histopathology in clinical trials in primary Sjögren’s syndrome. Ann Rheum Dis. 2017;7(76):1161–1168. doi:10.1136/annrheumdis-2016-210448
32. Jonsson R, Brokstad KA, Jonsson MV, Delaleu N, Skarstein K. Current concepts on Sjögren’s syndrome - classification criteria and biomarkers. Eur J Oral Sci. 2018;1(126 Suppl 1):37–48. doi:10.1111/eos.12536
 © 2023 The Author(s). This work is published and licensed by Dove Medical Press Limited. The
full terms of this license are available at https://www.dovepress.com/terms
and incorporate the Creative Commons Attribution
- Non Commercial (unported, 3.0) License.
By accessing the work you hereby accept the Terms. Non-commercial uses of the work are permitted
without any further permission from Dove Medical Press Limited, provided the work is properly
attributed. For permission for commercial use of this work, please see paragraphs 4.2 and 5 of our Terms.
© 2023 The Author(s). This work is published and licensed by Dove Medical Press Limited. The
full terms of this license are available at https://www.dovepress.com/terms
and incorporate the Creative Commons Attribution
- Non Commercial (unported, 3.0) License.
By accessing the work you hereby accept the Terms. Non-commercial uses of the work are permitted
without any further permission from Dove Medical Press Limited, provided the work is properly
attributed. For permission for commercial use of this work, please see paragraphs 4.2 and 5 of our Terms.
Recommended articles
Identification of KRBA1 as a Potential Prognostic Biomarker Associated with Immune Infiltration and m6A Modification in Hepatocellular Carcinoma
Liu Y, Fu B, Yu Z, Song G, Zeng H, Gong Y, Ding Y, Huang D
Journal of Hepatocellular Carcinoma 2022, 9:497-516
Published Date: 31 May 2022
Expression, Clinical Significance, Immune Infiltration, and Regulation Network of miR-3940-5p in Lung Adenocarcinoma Based on Bioinformatic Analysis and Experimental Validation
Lin Z, Huang W, Xie Z, Yi Y, Li Z
International Journal of General Medicine 2022, 15:6451-6464
Published Date: 6 August 2022
CSTF2 Acts as a Prognostic Marker Correlated with Immune Infiltration in Hepatocellular Carcinoma
Zhang W, Wan Y, Zhang Y, Liu Q, Zhu X
Cancer Management and Research 2022, 14:2691-2709
Published Date: 12 September 2022
Downregulation of ST6GAL1 Promotes Liver Inflammation and Predicts Adverse Prognosis in Hepatocellular Carcinoma
Liu R, Cao X, Liang Y, Li X, Jin Q, Li Y, Du H, Zao X, Ye Y
Journal of Inflammation Research 2022, 15:5801-5814
Published Date: 10 October 2022
Comprehensive Analysis of the Expression, Prognosis, and Biological Significance of PLOD Family in Bladder Cancer
Chen R, Jiang M, Hu B, Fu B, Sun T
International Journal of General Medicine 2023, 16:707-722
Published Date: 24 February 2023