")
Back to Journals » Infection and Drug Resistance » Volume 17
Insights into the in-vitro Susceptibility and Drug–Drug Interaction Profiles Against Drug-Resistant and Susceptible Mycobacterium tuberculosis Clinical Isolates in Amhara, Ethiopia
Authors Seid A , Girma Y, Dereb E, Kassa M, Nureddin S, Abebe A, Berhane N
Received 19 September 2023
Accepted for publication 5 January 2024
Published 10 January 2024 Volume 2024:17 Pages 89—107
DOI https://doi.org/10.2147/IDR.S440947
Checked for plagiarism Yes
Review by Single anonymous peer review
Peer reviewer comments 2
Editor who approved publication: Professor Suresh Antony
Aynias Seid,1,2 Yilak Girma,3 Eseye Dereb,3 Meseret Kassa,3 Semira Nureddin,4 Ayenesh Abebe,3 Nega Berhane2
1Department of Biology, College of Natural and Computational Science, Debre-Tabor University, Debre-Tabor, Ethiopia; 2Department of Medical Biotechnology, Institute of Biotechnology, University of Gondar, Gondar, Ethiopia; 3TB Culture Laboratory, University of Gondar Comprehensive Specialized Hospital, Gondar, Ethiopia; 4Department of Biology, College of Natural and Computational Science, Woldia University, Woldia, Ethiopia
Correspondence: Aynias Seid, Email [email protected]
Background: In Ethiopia, tuberculosis (TB) is a major public health problem. The aim of the study was to determine the in vitro susceptibility level of drugs and drug interaction profiles against drug-resistant and susceptible M. tuberculosis clinical isolates. A laboratory-based cross-sectional study was conducted between January 2023 and August 2023. GenoType MTBDRplus v.2.0 was facilitated in genetic mutation detection. Minimum inhibitory concentration (MIC) was determined using resazurin microtitre assay (REMA), while fractional inhibitory concentration index (FICI) using resazurin drug combination microtitre assay (REDCA) for in vitro quantitative susceptibility and drug interaction prediction.
Results: Among 32 clinical isolates, a total of 14 (43.8%) RIF, 20 (62.5%) INH, 2 (6.3%) EMB-related resistant and 14 (43.8%) MDR isolates were identified. Five of RIF-resistant isolates (55.6%) carrying rpoB common mutations at codon S450L were associated with high levels of RIF-resistance with MICs of ≥ 2μg/mL, whereas 100% of isolates harboring rpoB substitutions at codons D435V and H445Y were linked with moderate or low-level RIF-resistance in the MIC ranges from 0.5 to 1μg/mL. A proportion of 81.8% of isolates harboring katG S315T mutations were associated with high-level INH resistance (MIC ≥ 1μg/mL), while the 18.2% of isolates with S315T katG mutations and 100% of isolates with inhA C-15T mutations were linked to the low-level of INH resistance with MIC variability from 0.25 to 0.5μg/mL. Our results indicated that most FICIs of the dual drugs INH+RIF and INH+LEV combination for 9 (28.1%) and 4 (12.5%) INH-resistant isolates, respectively, were ≤ 0.5, whereas triple drugs INH+RIF+EMB, INH+RIF+LEV and INH+EMB+LEV combination for 6 (18.8%), 11 (34.4%) and 8 (25%) INH-resistant isolates were from 0.62 to 0.75, all showed synergistic effect.
Conclusion: The study highlights that isolates with rpoB S450L and katG S315T substitutions were associated with high level of RIF and INH resistance. It is concluded that REDCA can quantitatively determine anti-mycobacterial synergy and that LEV being of potential use against INH-resistant isolates including MDR-TB when combined with RIF+INH and INH+EMB.
Keywords: drug combination, drug interaction, MIC, mutations, synergism
Introduction
Tuberculosis (TB) remains a major global health concern, and the emergence of multidrug- and extensively drug-resistant (MDR/XDR-TB) has further complicated its diagnosis, treatment and control.1 The WHO advocates a standardized chemotherapy for drug-susceptible TB with generic, fixed-dose combinations (FDCs) and a daily dosing frequency. This is recommended for reasons of adherence, cost-effectiveness, and logistical simplicity.2 The treatment plan involves the long-term combination of all four first-line drugs (FLDs) during a 2-month intensive phase, followed by a 4-month continuation phase with just rifampicin (RIF) and Isoniazid (INH) in order to prevent relapse and the development of drug resistance.2 However, this protocol is no longer appropriate for managing the high rates of drug resistance in TB cases. Some of the significant risk factors associated with drug resistance include mutations in genes that confer resistance,3 the genetic background of the strain, TB/HIV co-infection, and environmental influences such as poor diagnostic capacity, improper prescription of drugs, insufficient patients’ follow-up, lack of patient compliance, and high incidence of relapsed TB history.4–6
An early and rapid diagnosis of TB is important in determining the appropriate TB treatment and preventing the spread of drug resistant (DR) TB. The conventional phenotypic Mycobacterium Growth Indicator Tube (MGIT) 960 macro-dilution method, using a single critical concentration (CC) per drug, has been used to determine susceptibility profiles of M. tuberculosis isolates individually. However, it is time-consuming, expensive, and technically complex.7 Although currently available molecular assays can overcome some disadvantages of the MIGT 960 CC method, they are expensive and cannot identify all genetic loci associated with drug resistance.8,9 Treating TB not only benefits the individual patient but also the community as a whole. However, the level of drug resistance can impact treatment choices and outcomes. The treatment of DR-TB patients requires an individualized regimen that depends on the level of inhibitory for drug resistance, TB/HIV co-infection status, drug–drug interactions,10 and the drug’s toxicity to the patient that may lead to treatment interruptions and influence the treatment success.11,12 This in turn could promote the development of drug resistance.13
However, in some situations, especially when the treatment fails, or in immunocompromised individual, the drug’s minimum inhibitory concentration (MIC) determination could help to establish a new therapeutic scheme to treat patients with resistant TB. The susceptibility of drugs in vitro, as determined by MIC and the synergism of drug interactions, can be studied using various methods.14 Among these, the colorimetric resazurin microtiter assay (REMA) and resazurin drug combination microtiter assay (REDCA) have gained greater attention due to its simplicity, lack of need for sophisticated equipment or highly trained personnel and relatively short turnaround time in detecting M. tuberculosis within 8–10 days in a 96-well microplate.15–18 The REMA/REDCA method is based on the oxidation-reduction colorimetric indicator resazurin (also known as alamar blue) after exposing M. tuberculosis to various drugs in vitro. A change in the indicator’s color is directly proportional to the number of viable mycobacteria in the medium.15 Unlike MGIT based on single critical concentration, MIC testing a wider range of drug concentrations is a valuable tool for determining the significance of low-level resistance to RIF, which causes diagnostic and treatment challenges, is significant in our population, and may be underreported. The interactions of drugs in combination have not been routinely considered in therapeutic regimens, possibly due to the absence of in vitro markers indicating this combined effect. However, with the increasing prevalence of drug-resistant TB, it is essential to design new synergy-based therapeutic regimens to restore the antibiotic sensitivity of drug-resistant strains. This can be achieved by assessing the inhibitory activity when two or more drugs are combined.18,19
Investigating the susceptibility of M. tuberculosis clinical isolates in vitro, as well as their drug interaction profiles, is crucial for providing insights into the efficacy of drugs alone and in combination. It is also important for developing alternative treatment strategies. This information can help clinicians make informed decisions about treatment options and combat the growing challenge of drug resistance.7,20,21 To our knowledge, the association of resistance-conferring gene mutations with the MIC levels of RIF and INH resistance is not investigated, and there is currently a lack of comprehensive data on drug interaction profiles in drug combinations. Therefore, the aim of this study was to determine the in vitro susceptibility and drug–drug interaction profiles of clinical isolates of M. tuberculosis.
Materials and Methods
Study Settings, Design and Period
A laboratory-based cross-sectional study was conducted between January 2023 and August 2023 in the Northwest Amhara region of Ethiopia. For the present study, among 168 phenotypic CCs MGIT 960 resulted isolates, a total of 32 stored clinical isolates of M. tuberculosis (20 resistant and 12 susceptible isolates) were used due to resource constraints.22 A reference H37Rv drug-susceptible M. tuberculosis strain and molecular-grade water were used as positive and negative growth controls, respectively. The experiment was conducted at the University of Gondar Comprehensive Specialized Hospital (UoGCSH) TB culture laboratory. The UoGCSH is a fully equipped and certified laboratory for the manipulation of TB cultures and the performance of phenotypic and genotypic susceptibility testing. It serves MDR-TB patients from neighboring woredas and zones in the Amhara regional state.
Inclusion and Exclusion Criteria
The clinical isolates of M. tuberculosis that had genotypic and phenotypic MGIT susceptibility results, along with the correct patient identification number and socio-demographic data, were included in this study. However, isolates that had no susceptibility results and non-tuberculosis mycobacteria (NTM) isolates were excluded from the study.
Study Variables
The socio-demographic and clinical determinant factors of the patients were considered independent variables, while the MIC and fractional inhibitory concentration index (FICI) drug interaction responses of RIF, INH, and EMB drugs in alone, double and triple drug combinations were considered dependent variables.
Phenotypic and Genotypic Susceptibility Testing of Clinical Isolates
Initially, sputum samples were collected from pulmonary TB patients who tested positive on the GeneXpert in the Amhara region of Ethiopia. Digestion and decontamination of specimens was performed using the N-acetyl-L-cysteine-sodium hydroxide (NALC-NaOH) method and then inoculated onto Lowenstein-Jensen (LJ) egg medium slants. The slants were incubated at 37°C for up to 8 weeks and monitored weekly for growth.23 Confirmation of the M. tuberculosis complex isolates was done through antigenic testing (SD Bioline TB Ag MPT64, Standard Diagnostics, Inc., South Korea).24 The culture-positive M. tuberculosis clinical isolates were freshly sub-cultured on liquid medium and subjected to drug susceptibility testing using the rapid automated MGIT 960 SIRE method using CCs of 0.1 INH, 1.0 RIF, and 5.0 EMB in μg/mL.
The GenoType® MTBDRplus line probe assay (LPA) version 2.0 was used for detection of resistance-conferring mutations in the rpoB, katG, and inhA genes that confer resistance to RIF and INH according to the manufacturer’s instructions (Hain Life Science, Nehren, Germany).8,9 DNA was extracted from the culture isolates, and the amplified products were hybridized using specific oligonucleotide probes that were immobilized on the strip. The strip contained control zones (CC, AC, rpoB, katG, and inhA) and additional probes to detect specific mutations for rpoB, katG, and inhA genes. The M. tuberculosis clinical isolates were then sub-cultured and stored at −80 °C with the 7H9 broth base until further analysis was needed.
Mycobacterium tuberculosis Inoculum Preparation
To prepare the suspension of the tested M. tuberculosis clinical isolates for REDCA, a loopful of colonies was scraped off from a well-grown fresh LJ subculture that was 21–28 days old. The M. tuberculosis colonies were then transferred to a tube that contained 3–5 glass beads and 3 mL of M7H9 broth that was supplemented with OADC enrichment (Oleic Acid, Albumin, Dextrose, and Catalase) from (Becton Dickinson/BD Difco BBL in New Jersey, USA). The culture pellet was vortexed for at least 1 minute and then left for 5 minutes. The supernatant was transferred to a new sterile vial and allowed to settle for 15 minutes. The suspension was adjusted to the same turbidity as the 1.0 McFarland standards. The suspension was then further diluted with a 1:10 ratio in 7H9 broth that was supplemented with OADC at the time of inoculation into the 96-well microplates.17,25,26
Drug Stocks and Growth Indicator Reagent Preparations
The first-line INH, RIF, and EMB and second-line drug Levofloxacin (LEV) anti-TB drugs (Sigma-Aldrich Chemicals GmbH, Steinheim, Germany) were obtained in pure powder form and stored at −20°C as per the manufacturer’s instructions. Stock solutions of the INH, RIF, and EMB drugs were made at concentrations of 1 mg/mL in sterile distilled water, 10 mg/mL in methanol, and 10 mg/mL in sterile distilled water, respectively.16 Small amounts of each stock solution were kept at −20°C until needed. At the time of the experiment, a working solution for each drug concentration was prepared by diluting stock solutions in M7H9 broth that was supplemented with OADC (BD Difco BBL, NJ, USA)15 at four times (4x) the final highest concentration (4µg/mL for INH, 8µg/mL for RIF, and 32 µg/mL for LEV, and 64µg/mL for EMB). The final drug concentrations tested were 1µg/mL for INH, 2µg/mL for RIF,27,28 8 µg/mL for LEV and 16µg/mL for EMB in 96-well plates.29,30 LEV was found to be more efficacious than other ofloxacin (OFX) when incorporated into multidrug regimens for treatment of MDR-TB.15 The resazurin reagent was obtained in the form of resazurin sodium salt powder. A fresh working solution of resazurin sodium salt was prepared in sterile distilled water at a concentration of 0.02% (wt/vol) (0.02g/100mL in sterile distilled water) (Acros, Morris Plains, NJ, USA). The solution was filter-sterilized and stored at 4°C for up to 7 days.25,31–33
Resazurin-Based Colorimetric Microtiter Assay
In vitro susceptibility testing and synergistic effects of drug combinations were determined using the REMA25,31–33 and REDCA15,16 assays, respectively. The REMA and REDCA experimental setups used micro-dilution in 96-well microplates (BD Falcon, USA) to test the susceptibility of three first-line drugs RIF, INH, and EMB individually, as well as double drug combination (RIF+INH, INH+EMB, RIF+LEV, INH+LEV, and EMB+LEV) and triple drugs (RIF+INH+EMB, RIF+INH+LEV, and EMB+INH+LEV) interactions against clinical isolates of M. tuberculosis (Table 1).
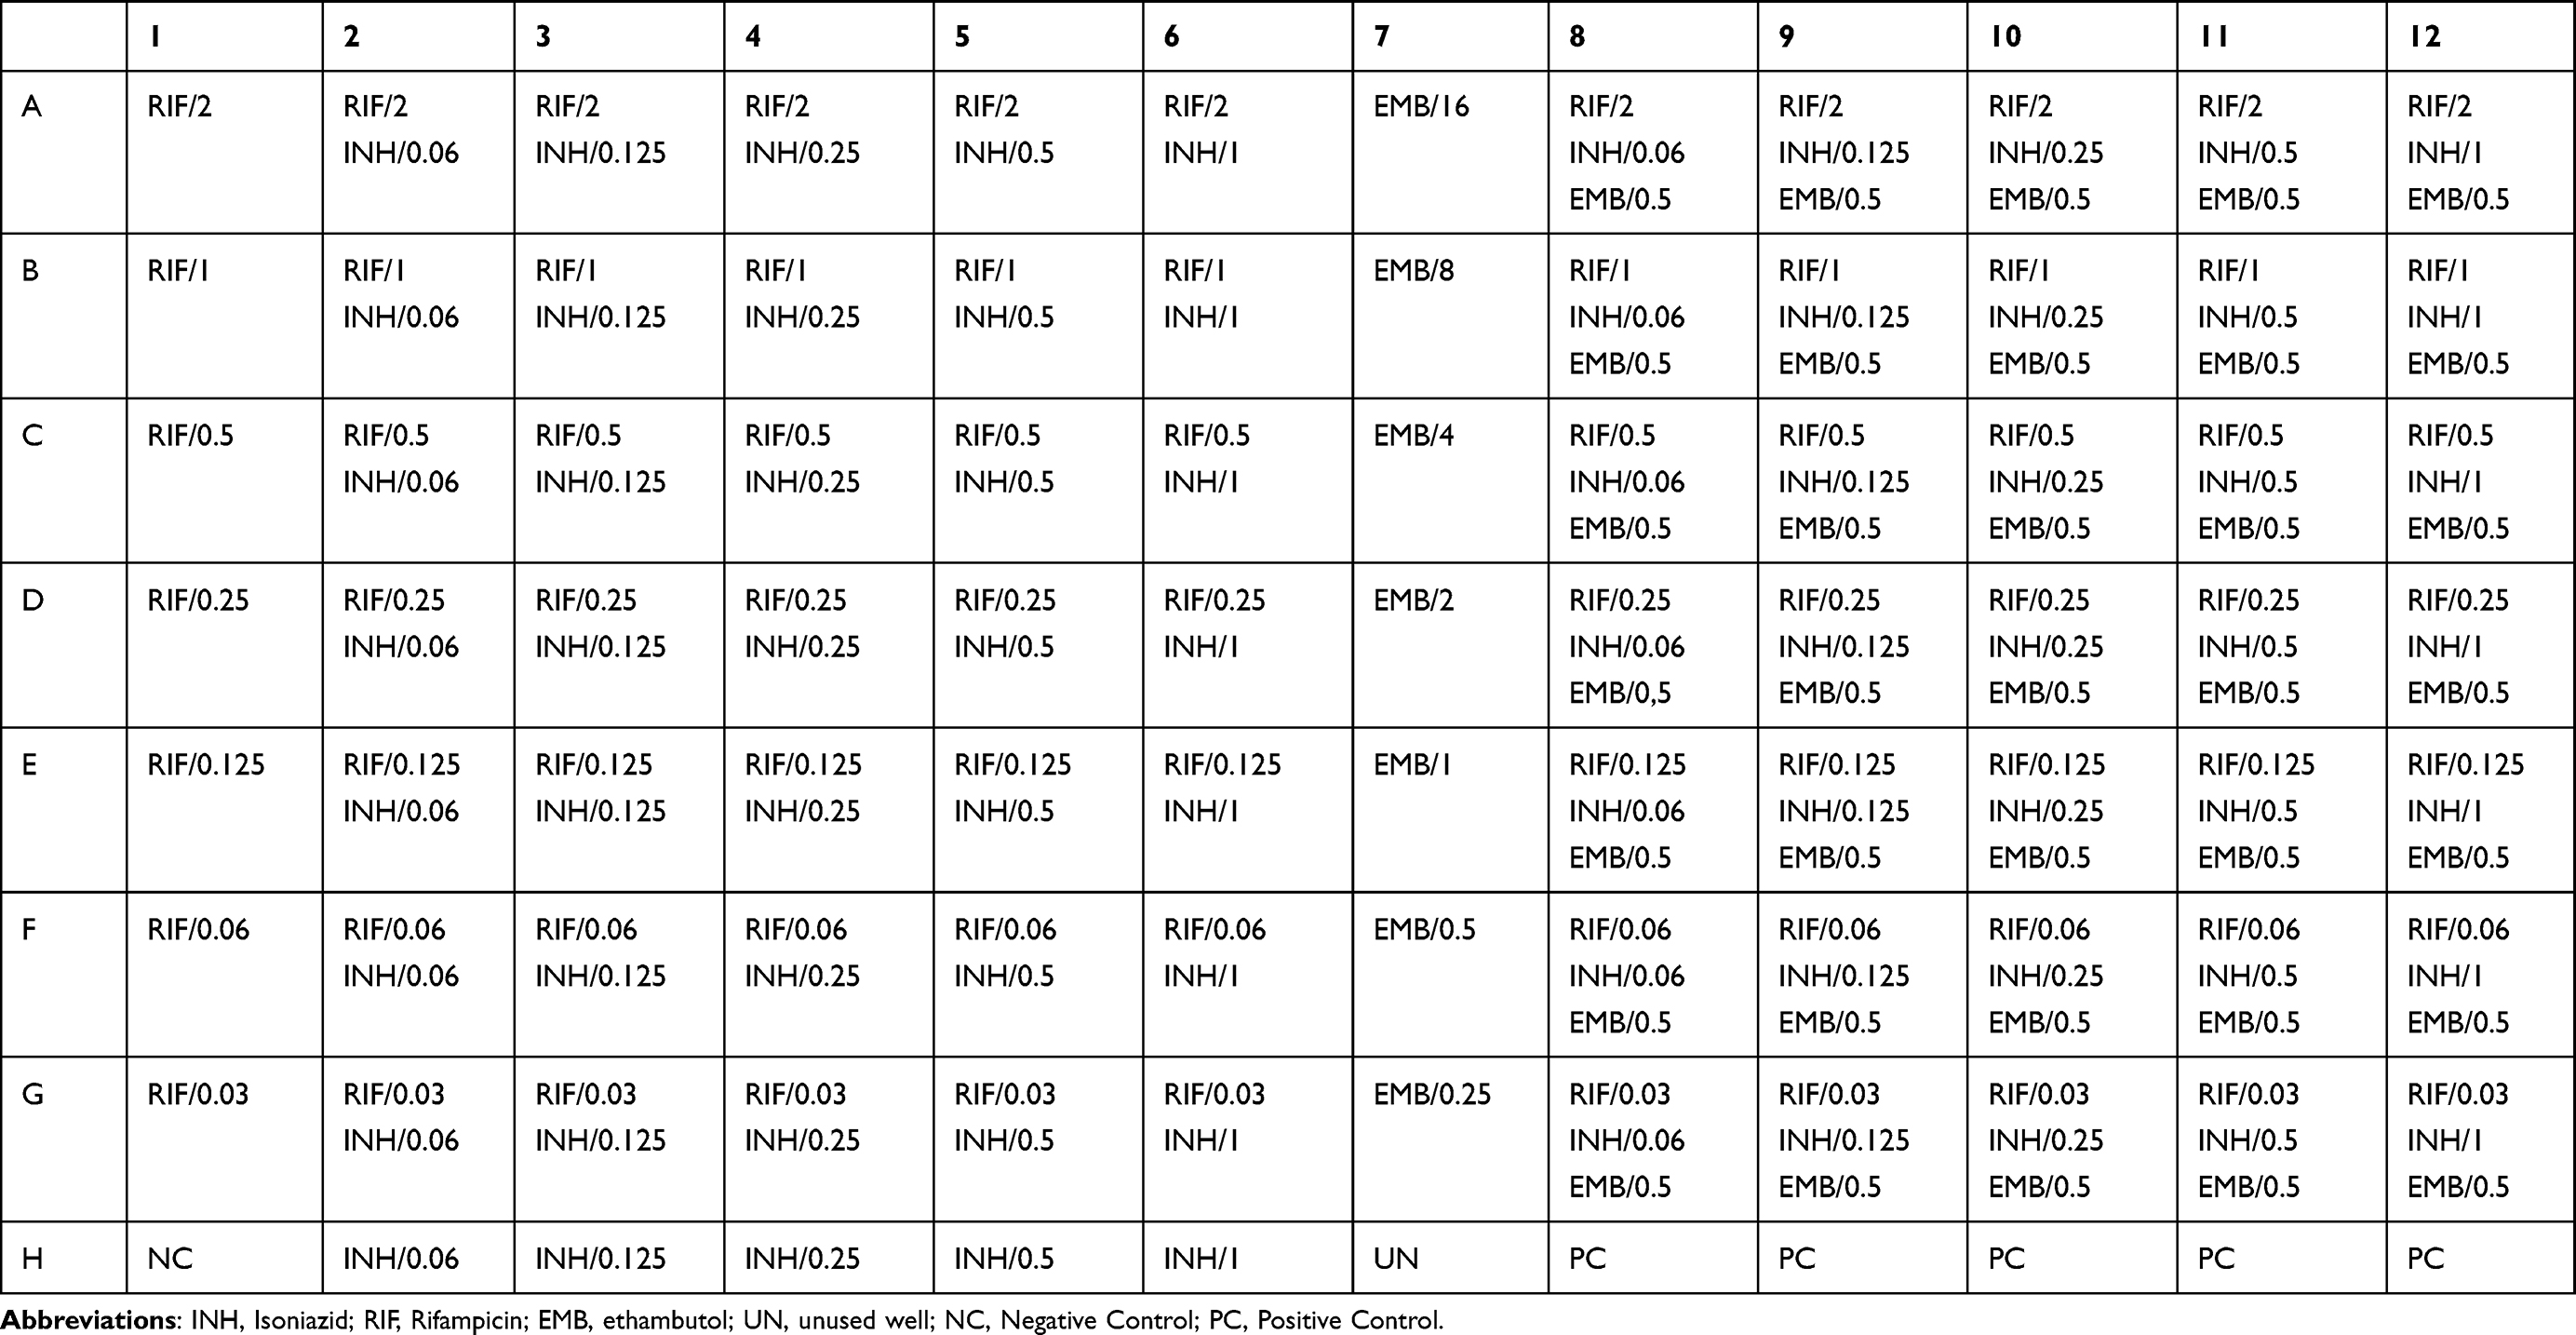 |
Table 1 Preparation of Drug MICs (µg/mL) in 96-Wells Micro-Dilution Plate Assay |
Briefly, 100µL of M7H9 broth supplemented with OADC was aseptically dispensed into all-96-well microplates. One hundred microliters of the working RIF concentration (4x) was dispensed into wells of A1-A5 and A8-A11 containing 100µL 7H9-S broth, but A6 and A12 had an 8x final drug concentration. Serial two-fold micro-dilution of RIF was prepared from A1-A6 to G1-G6 and A8-A12 to G8-G12 wells using a multichannel pipette with a volume of 100µL concentration, and finally 100µL portions were discarded from the last row (G1-G6 and G8-G12). Moreover, 100µL working INH drug concentrations (4x) were delivered to A6-H6 and A12-H12 wells. Serial two-fold dilutions of INH were prepared from A6-H6 to A2-H2 and A12-H12 to A8-H8 wells, and the final volume of 100µL solutions from A2-G2 and A8-G8 wells were discarded. Also, the working solutions of EMB or LEV were dispensed into the remaining well A7, and its double serial dilution was performed from A7 to G7, and a 100µL solution was discarded to obtain the final-tested concentration. One-hundred microliters of inoculum were used as per well of microplates using a multichannel pipette, except for the H1, H7, and H8-H12 wells. H1 wells with only medium and sterile distilled water were used as a negative control as per each batch of tested M. tuberculosis clinical isolates. H7 was unused well. H8-H12 wells containing 7H9 medium without drugs and 10−2 bacterial inoculum dilution were used as a positive bacterial growth control in each plate.15,16,25,31–33
In the study, in a single 96-well microplate, wells A1-A6 and A6-H6 have the final highest concentrations of RIF and INH, respectively, in order to determine the drug susceptibility pattern and evaluate pairwise-drug interactions, while wells A8-A12, A12-H12, and A7 also have the highest concentrations of RIF, INH, and EMB, as well as LEV, respectively, for assessing the in vitro triple-drug interaction potential against each M. tuberculosis clinical isolate by microdilution-based REDCA assay. The triple drug combination (eg, RIF+INH+EMB) REDCA method was principally based on the standard two-drug (eg, RIF+INH and INH+EMB) combination, where dispensing the serially diluted drugs along the X-axis and Y-axis in a 96-well plate, respectively, while the third drug (LEV or EMB) was then dispensed on the A8-H8 to A12-H12 wells with one of the serial concentrations from the MIC range (eg, MIC of 0.5 for EMB and 0.25 for LEV).18 Finally, 200µL of sterile distilled water was added to all outer perimeter wells to avoid evaporation during the incubation. The microplates were sealed with aluminum plate seals, placed on a plate shaker for 30 minutes, and incubated at 37 °C in a normal atmosphere for 7 days.15,16,25,31–33
After one week of incubation time, 30µL of freshly prepared 0.02% resazurin (Acros, Morris Plains, NJ, USA) working solutions were added to each REMA microplate well, and the microplates were incubated for additional 24–48 hours at 37 °C in a normal atmosphere. A color change from blue (the oxidized state) to pink/purple (the reduced state) indicated the reduction of the resazurin agent by bacterial metabolism. This reduction of resazurin is directly proportional to the presence of viable bacterial growth called resistance strains. A change in color of the growth control well from blue to pink indicated the proper growth of the isolate, and no color change in the sterile control well indicated the absence of contaminants.25,31–33
Determination the Minimum Inhibitory Concentrations (MICs)
The MIC was determined in triplicate for anti-TB drugs against each isolate using REMA through visual reading of the color change in 96-well microplates.25,31–34 The individual MICs for INH, RIF, LEV and EMB were determined for each isolate and H37Rv reference strain using a serial two-fold micro-dilution of each drug’s working solution concentration with the final MIC ranges of 1–0.06µg/mL for INH, 2–0.03µg/mL for RIF,27,28 8–0.125µg/mL for LEV15 and 16–0.25µg/mL for EMB.29,30 A color change from blue to pink/purple was considered as bacterial growth by reducing of resazurin. The MIC was defined as the lowest drug concentration that inhibited visible bacterial growth by no resazurin color change from blue to pink in the micro-wells. Isolates were considered resistant if the MIC values were ≥0.25μg/mL for INH, ≥0.5μg/mL for RIF,25,30,31 ≥2μg/mL for LEV and ≥4μg/mL for EMB, which were the cut-off breakpoint concentrations.29 The MIC results for RIF classified as wild-type strains with rpoB mutations that are not associated with resistance were grouped with a MIC range of <0.25μg/mL, strains with rpoB mutations associated with low-level RIF resistance were included with a MIC range of 0.25 to 1.0μg/mL, and rpoB mutations associated with high-level RIF resistance were grouped with a MIC of ≥2μg/mL.
Prediction of Drug–Drug Interaction Profiles
The in vitro double and triple interactions between anti-TB drugs were evaluated in triplicate using the modified micro-dilution REDCA method, by employing resazurin as mycobacterial growth indicator agent.15,16 The potential combinatorial effects of multiple drugs (drug–drug interaction responses) were determined by the FICI using the MIC results for each combination experiment of isolate. This evaluation was performed in triplicate. The FICI for pairwise interaction between two drugs was calculated using the following formula: ∑ FICI2= FICA + FICB = (MICA+B/ MICA) + (MICB+A/ MICB), where MICA+B represents the MIC of drug A in combination with drug B; MICB+A, the MIC of drug B in combination with drug A; and MICA, the MIC of drug A tested alone, and MICB, the drug B tested alone. The pairwise (two-drug) interaction response was interpreted based on the FICI result and being considered synergistic interaction (FICI ≤ 0.5), indifference or additive interaction (FICI ˃ 0.50 ≤ 4), and antagonistic interaction (FICI ˃4).15,18 Furthermore, the FICI for the triple-drug interaction was computed using the following formula: ∑ FICI3= FICA + FICB + FICC = (MICA+B+C / MICA) + (MICB+A+C/ MICB) + (MICC+B+A/ MICC), where MICA+B+C represents the MIC of drug-A in combination with drug-B and drug-C; MICB+A+C, the MIC of drug-B in combination with drug-A and drug-C; MICC+B+A, the MIC of drug-C in combination with drug-B and drug-A; and MICA, MICB and MICC, the MIC of drug-A, drug-B and drug-C, respectively, when tested alone. The FICI values were interpreted as synergistic when FICI ≤ 0.75, indifferent when 0.75 ˃ FICI ≤ 4, and antagonistic when FICI ˃ 4 for the three-drug interaction response.14,18,27
Statistical Analysis
All the data were recorded and entered into Epi-Data v.3.1. The susceptibility profile of each isolate was determined by measuring the MICs of each drug. Descriptive statistics were used to analyze the distribution of MIC and FICI responses in double and triple drug combination values of MDR, RIF, and INH resistant isolates. A p-value ≤0.05 was considered statistically significant. The sensitivity, specificity, positive predictive value (PPV), and negative predictive value (NPV) of the micro-dilution REMA assay for susceptibility testing of RIF, INH, and MDR-TB were evaluated in comparison to the gold standard MGIT 960. The kappa (k) statistic was used to assess the agreement between REMA and MGIT 960-determined resistance. All statistical analyses were performed using SPSS V. 23.0.
Results
In vitro Susceptibility Profiles of Clinical Isolates
Among 168 DST resulted isolates from pulmonary TB patients, a total of 32 clinical isolates of M. tuberculosis were used in the study. Of which, 20 (62.5%) of isolates were obtained from male participants and the age range of 18–44 years with the mean age of 31 years. The prevalence of 11 (34.4%) study patients had a history of previous TB treatment, whereas 9 (28.1%) were TB with HIV co-infected cases.
All the tested isolates of the MIC results using the REMA micro-wells were done on the 8–9 days of incubation. No contaminated isolate was observed. Eighteen isolates (56.3%) were found to be RIF-susceptible in REMA micro-plate (MIC < 0.5μg/mL); while 14 (43.8%) isolates were RIF-resistant, of which 5 isolates (35.7%) were high-level of resistance with MIC values of ≥2μg/mL. The most of the high-level RIF resistant isolates (4/5, 80.0%) analyzed in this study were linked with TB/HIV co-infected cases and (3/5, 60.0%) were recorded as retreated patients of TB cases. Twelve isolates (37.5%) were found to be INH-susceptible (MIC < 0.25μg/mL); whereas 20 isolates (62.5%) were INH-resistant, of which 9 isolates (45.0%) showed high-level of resistance with the MIC value of ≥1μg/mL. Three and one isolates were detected as resistant to RIF and INH using REMA plate MIC ≥ 0.5μg/mL and ≥0.25μg/mL, respectively, as previously defined as susceptible by CCs MIGT 960 method, whereas two and three isolates were MIC-resistance to RIF and INH that were resistance undetected to RIF and INH by MDRTBplus assay, respectively. Fourteen isolates (43.8%) were resistant to both RIF and INH and categorized as MDR-TB, where the MICs ≥0.5 and 0.25μg/mL for RIF and INH, respectively (Table 2). Among the MDR-TB isolates, the rate of TB/HIV co-infected patients and previously treated cases were 42.9% and 35.7%, respectively, whereas an equal proportion of 33.3% INH mono-resistant isolates were found from TB/HIV co-infected patients and previously treated cases.
 |
Table 2 Frequency of M. tuberculosis Isolates with Minimum Inhibitory Concentration (MIC) of Drugs (n = 32) |
Distribution of Mutation Patterns and Their Association with the MICs
The distribution of different drug resistance mutation patterns and their relationship with the MIC level of RIF and INH drugs was investigated. Interestingly, 55.6% (5/9) of isolates having rpoB common mutations at codon S450L (codon 531 in the E. coli numbering system) were developed a higher-level RIF-resistance with MICs of ≥2μg/mL, whereas four of isolates (100%) carried rpoB gene substitutions at codons D435V and H445Y (codons 516 and 526 in the E. coli numbering system) were linked with moderate and low-level RIF-resistance in the MIC ranges from 0.5 to 1μg/mL. A frequency of three isolates (100%) with unknown mutations in the rpoB gene was associated with low-level RIF-resistance with a MIC of 0.5μg/mL. All the isolates (100%) harboring katG and inhA mutations at codons S315T and C-15T by the MTBDRplus LPA were revealed with MICs of ≥0.25μg/mL and determined to be resistant to INH. A proportion of 81.8% (9/11) M. tuberculosis clinical isolates conferring known S315T mutations in the katG gene were revealed high-level INH resistance with the MIC of ≥1μg/mL. However, 18.2% (2/11) of isolates harboring specific S315T katG mutations and 100% of isolates (2/2) with unknown mutations at katG gene and 100% (4/4) of isolates carried common C-15T mutations at inhA gene were showed a low-level INH resistance with the MIC values of 0.25–0.5μg/mL (Table 2).
Prediction of Drug–Drug Interaction Profiles in M. tuberculosis Isolates
The synergistic, indifferent, or antagonistic effects of each drug combination on the clinical isolates of M. tuberculosis are presented in Tables 3 and 4. Among the 20 INH-resistant clinical isolates that had MICs ranging from 1 to 0.25μg/mL and 12 INH-susceptible isolates with the MIC values ranging from 0.125 to 0.06μg/mL for INH alone; the individual MICs of drugs in the dual combination of INH+RIF and INH+LEV were decreased from one to two dilutions (INH ranging from 0.25 to 0.06μg/mL), showing synergistic interaction with a FICI value of 0.5 against 9/32 (28.1%) and 4/32 (12.5%) INH-resistant isolates, respectively, while there was no clear synergism effect in the INH+EMB combination in a condition of certain concentration. However, FICI in any of tested dual-drug combinations for all INH-susceptible isolates were ranged from 1 to 2, all showing indifference, where the MICs decreased to one dilution or no dilution change (Table 3). The MICs of drugs in the triple-drug combination INH+RIF+EMB, INH+RIF+LEV, and INH+EMB+LEV against the 6/32 (18.8%), 11/32 (34.4%), and 8/32 (25%) INH-resistant isolates, respectively, were decreased the individual MICs from one to two dilutions (INH ranging from 0.25 to 0.06μg/mL) showing synergistic effect with a FICI value of ≤0.75 (Table 4).
 |
Table 3 MICs and FICI of the INH, RIF, EMB and LEV in Double Drug Combination Against M. tuberculosis Clinical Isolates |
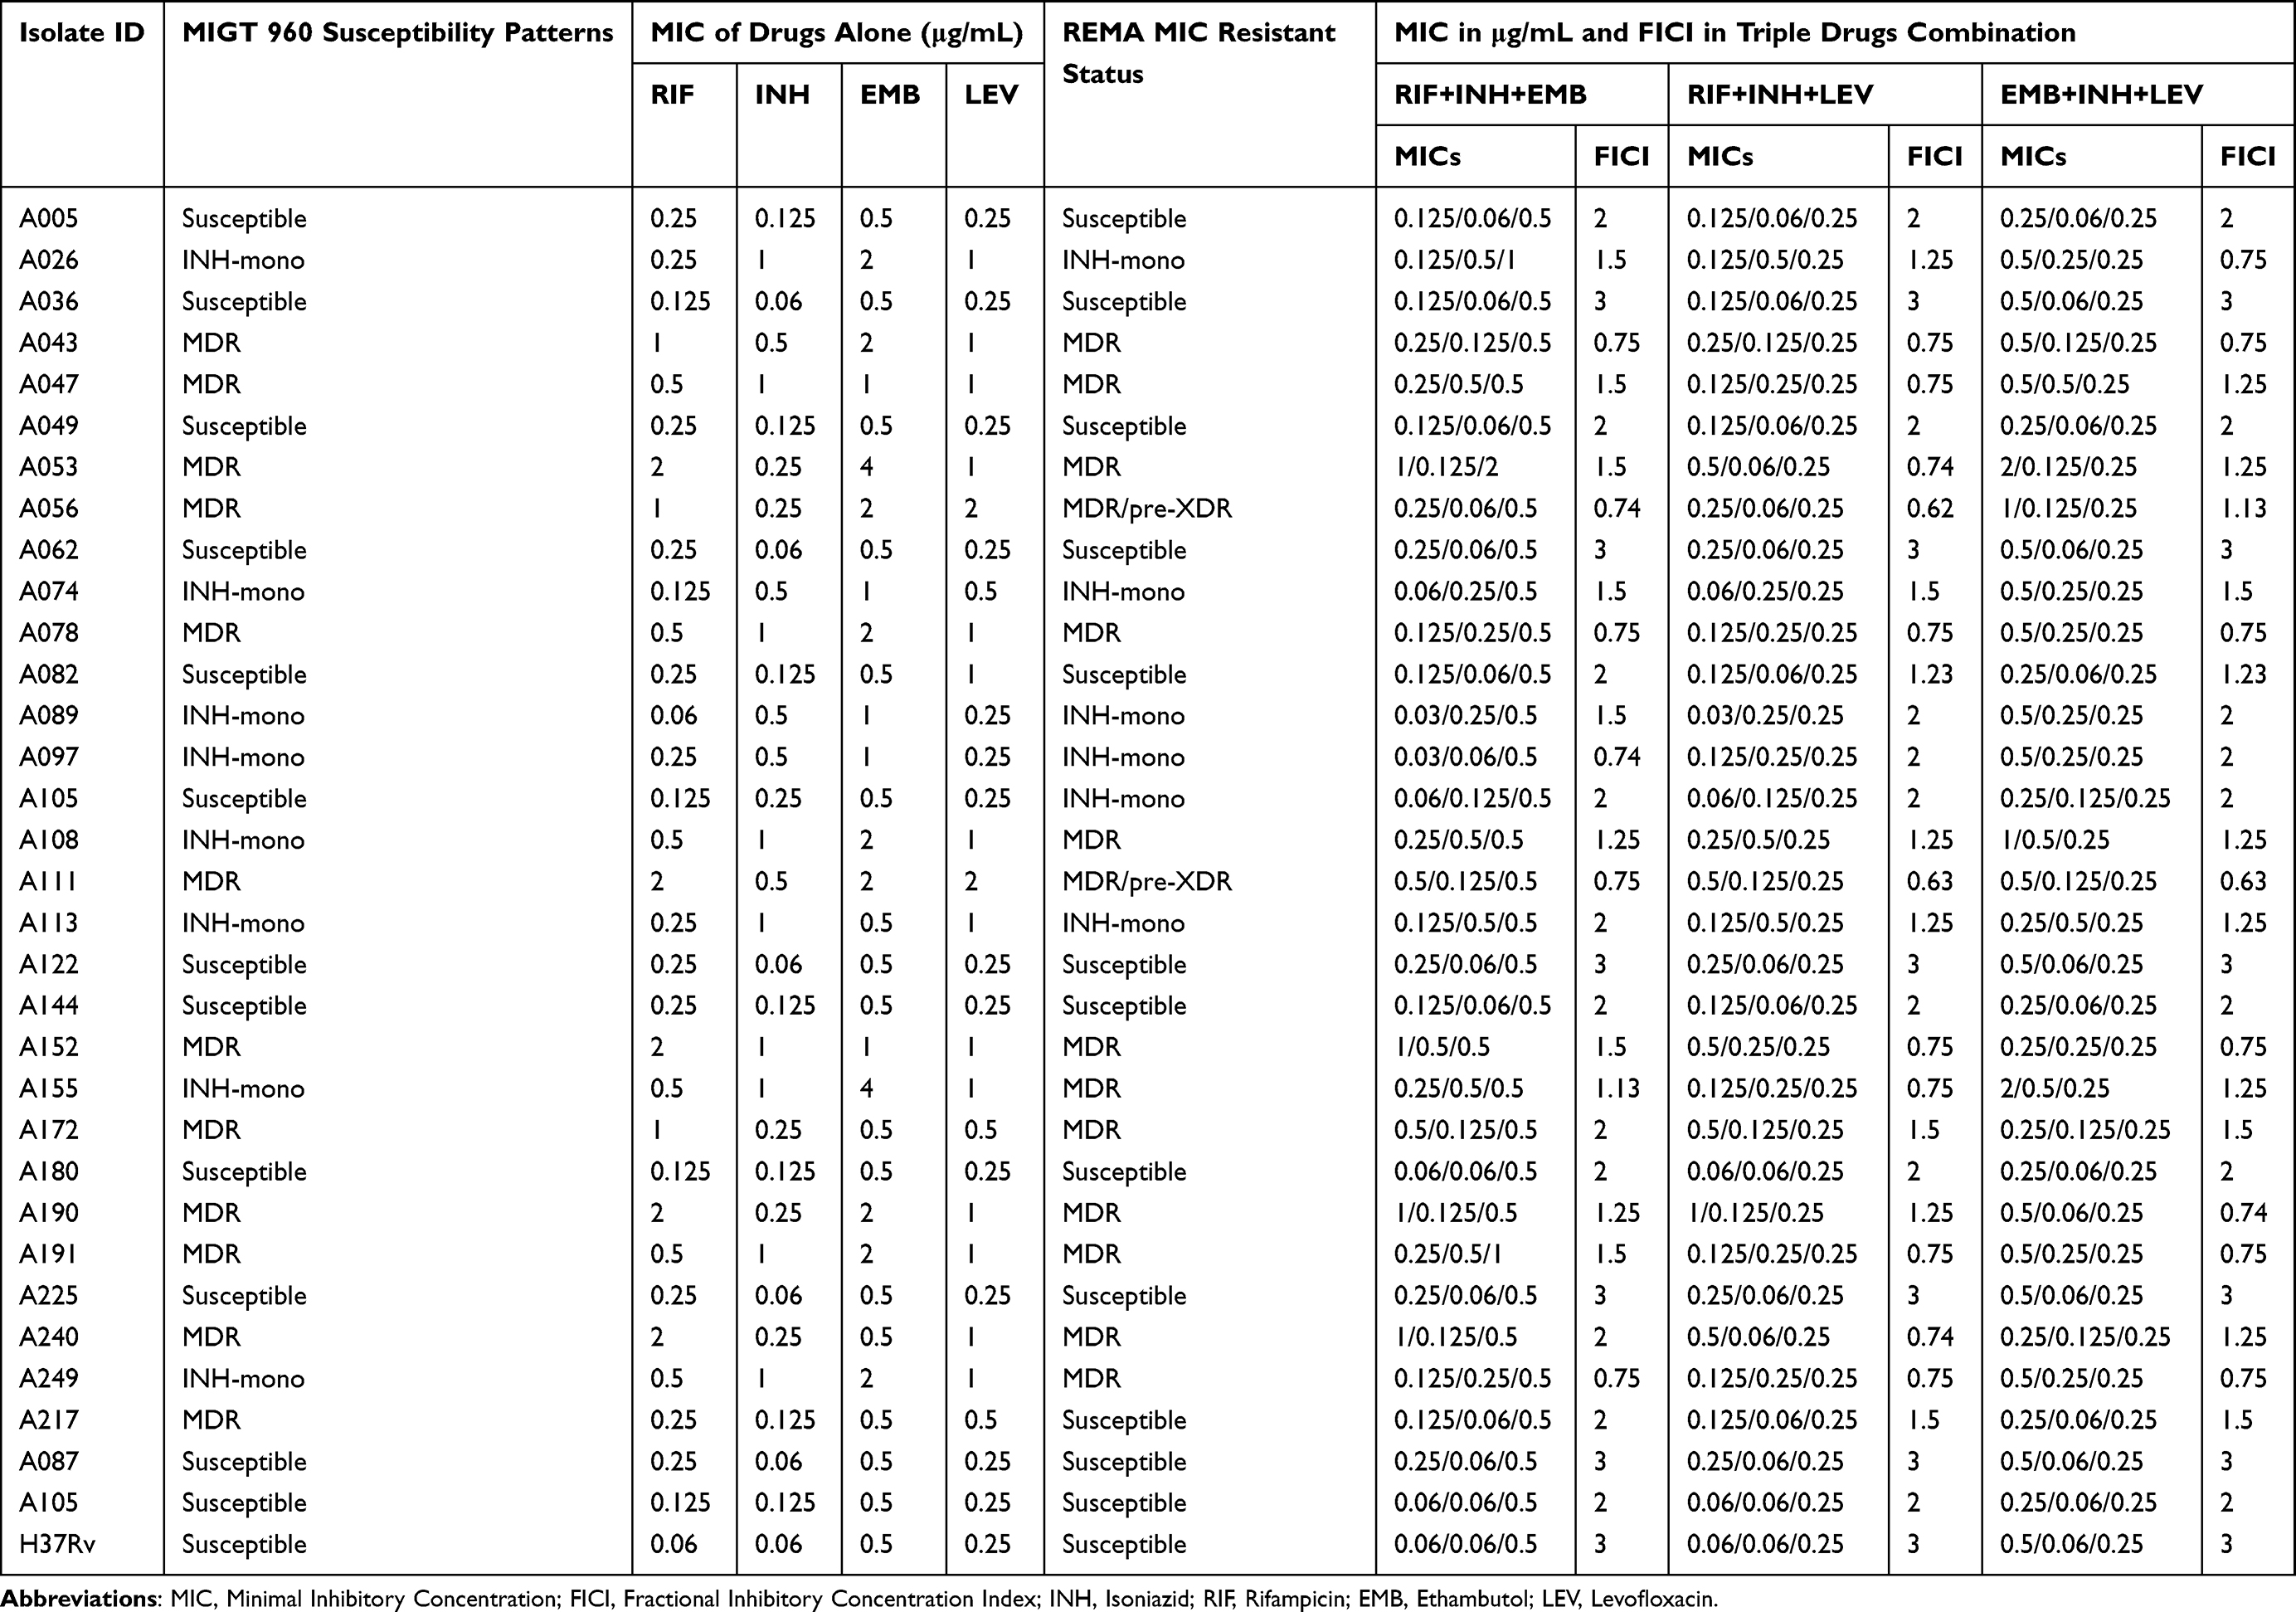 |
Table 4 MICs and FICI of the INH, RIF, EMB and LEV in Triple Drugs Combination of the Tested M. tuberculosis Clinical Isolates |
Moreover, the REMA assay found that the MIC value of RIF alone ranged from 2 to 0.5µg/mL for 14/32 (43.8%) resistant isolates and from 0.25 to 0.06µg/mL for 18/32 (56.2%) susceptible isolates. Of which, the MIC values of drugs in the dual drugs combination RIF+INH and RIF+LEV were decreased from one to two dilutions against 5/32 (15.6%) and 4/32 (12.5%) MDR isolates, respectively, leading synergistic activity with a FICI value of 0.5. However, the most studied clinical isolates exhibited indifferent with the FICI values from 1 to 2 against the pairwise INH+EMB (32/32, 100%), EMB+LEV (30/32, 93.8%), RIF+INH (23/32, 71.9%), RIF+LEV and INH+LEV (28/32, 87.5%) drug combination, where the MICs of each drugs did not differ from the individual MICs or decreased the individual MICs up to one dilution (Table 3). The individual MICs in the triple drug combination of RIF+INH+EMB, RIF+INH+LEV and EMB+INH+LEV against the 5/32 (15.6%), 11/32 (34.4%) and 7 (21.9%) MDR isolates, respectively, were decreased from one to two dilutions ranging from 0.5 to 0.06μg/mL, showing synergistic interaction with the FICI values from 0.62 to 0.75; while most of the studied 23/32 (71.9%), 21/32 (65.6%) and 24/32 (75%) clinical isolates, in respective triple drug combination, did not differ from the individual MIC or decreased the individual MIC up to one dilution, indicating indifference with FICI values from 1.13 to 3 (Table 4). There was a significant difference in the synergistic effect for drug-resistant isolates against the combination INH+RIF vs RIF+LEV (p = 0.026), RIF+LEV vs RIF+INH+LEV (p = 0.002), INH+LEV vs EMB+INH+LEV (p = 0.013) and RIF+INH+EMB vs RIF+INH+LEV (p < 0.001). Nevertheless, no statistical difference was observed in the synergistic effect for RIF+INH vs INH+LEV (p = 0.887), RIF+LEV vs INH+LEV (p = 0.435), and RIF+INH vs RIF+INH+LEV (p = 0.469) combination against drug-resistant isolates (Table 5).
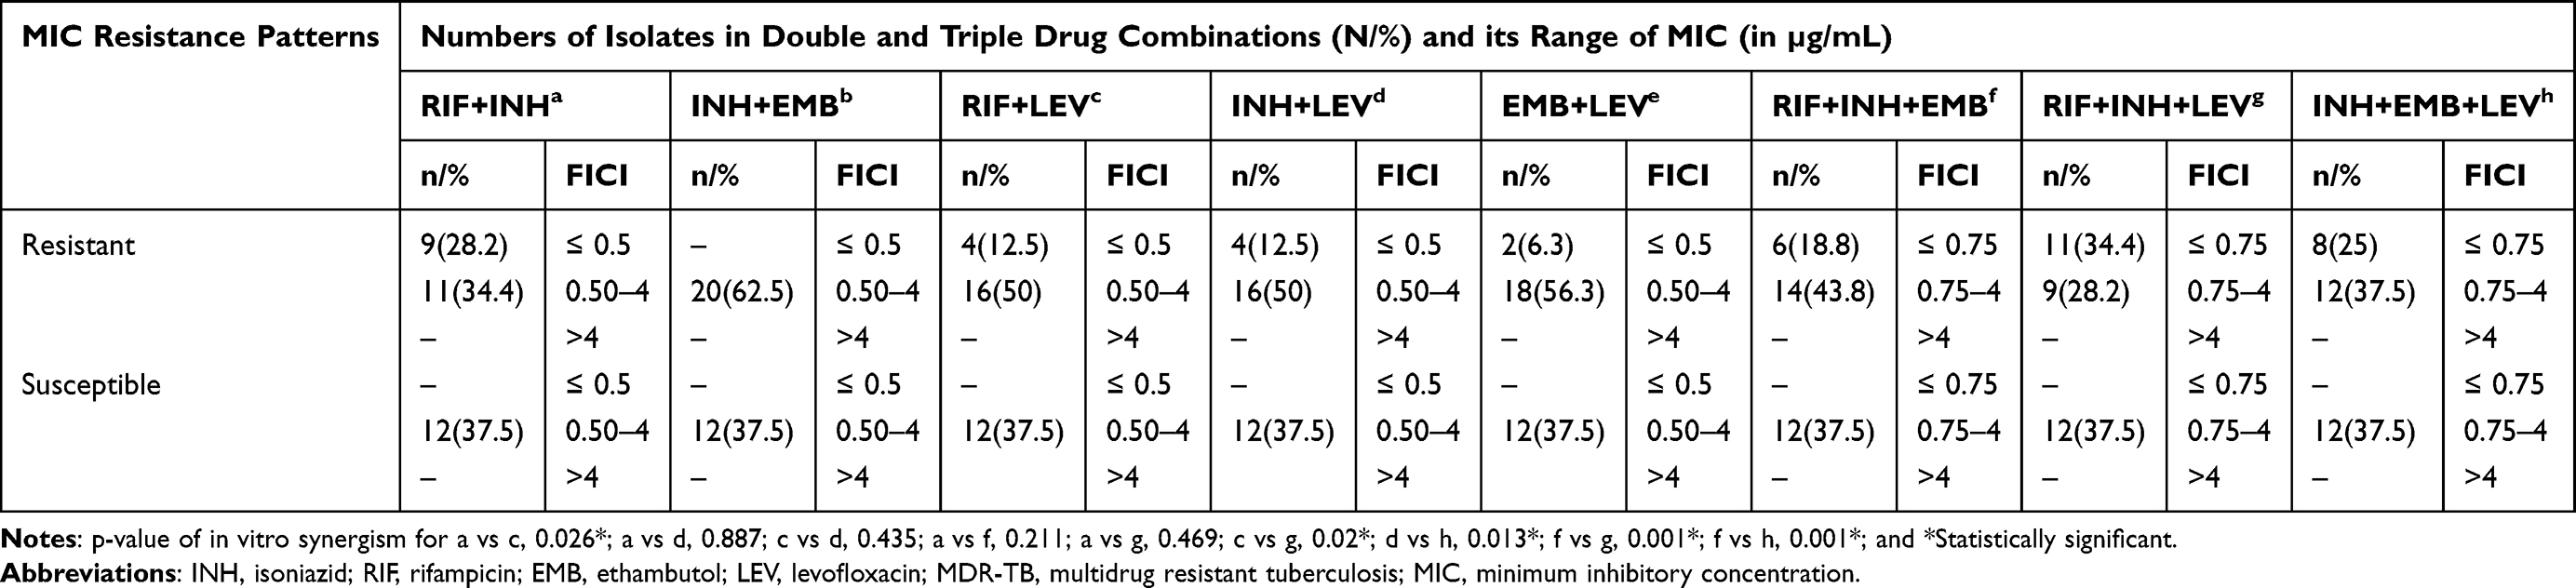 |
Table 5 Distribution of Isolates and Comparison of FICI in Double and Triple Drug Combinations Using REDCA Assay (n = 32) |
Evaluation Performance of Resazurin Microtitre Assay (REMA)
The study also showed the utility performance of REMA assay for in vitro susceptibility patterns compared to the gold standard phenotypic BACTEC MGIT 960 DST method as shown in Table 6. Of the 32 tested M. tuberculosis clinical isolates for susceptibility profile, both methods were revealed a total of 19 resistant isolates (59.4%) for INH. Two isolates were produced discordant result, where one isolate being INH-resistant at MIC of 0.25μg/mL in REMA assay but susceptible at CCs 0.1μg/mL in MGIT 960 system, while a single isolate was INH-susceptible at MIC of 0.125μg/mL that was INH-resistant to MGIT 960. The REMA assay’s sensitivity, specificity, PPV, and NPV for the detection of INH-resistance were 95.0%, 91.7%, 95.0% and 91.7%, respectively, compared to the MGIT 960 system. Besides, 11 isolates (34.4%) were found to be RIF-resistant and 17 isolates (53.1%) were RIF-susceptible by both methods. However, four isolates produced discordant results; three isolates were determined to be low-level RIF-resistant to the REMA assay at MIC value 0.5μg/mL but RIF-susceptible to the MGIT 960 at 1.0μg/mL, while a single isolate was RIF-susceptible at MIC 0.25μg/mL but RIF-resistant in MIGT 960. The REMA assay was demonstrated a 91.7% of sensitivity, 85.0% of specificity, 78.6% of PPV and 94.5% of NPV for identifying RIF-resistant isolates, as well as MDR-TB isolates. The two susceptibility testing methods had excellent agreement of 87% in detecting INH and 75% for both RIF and MDR-TB.
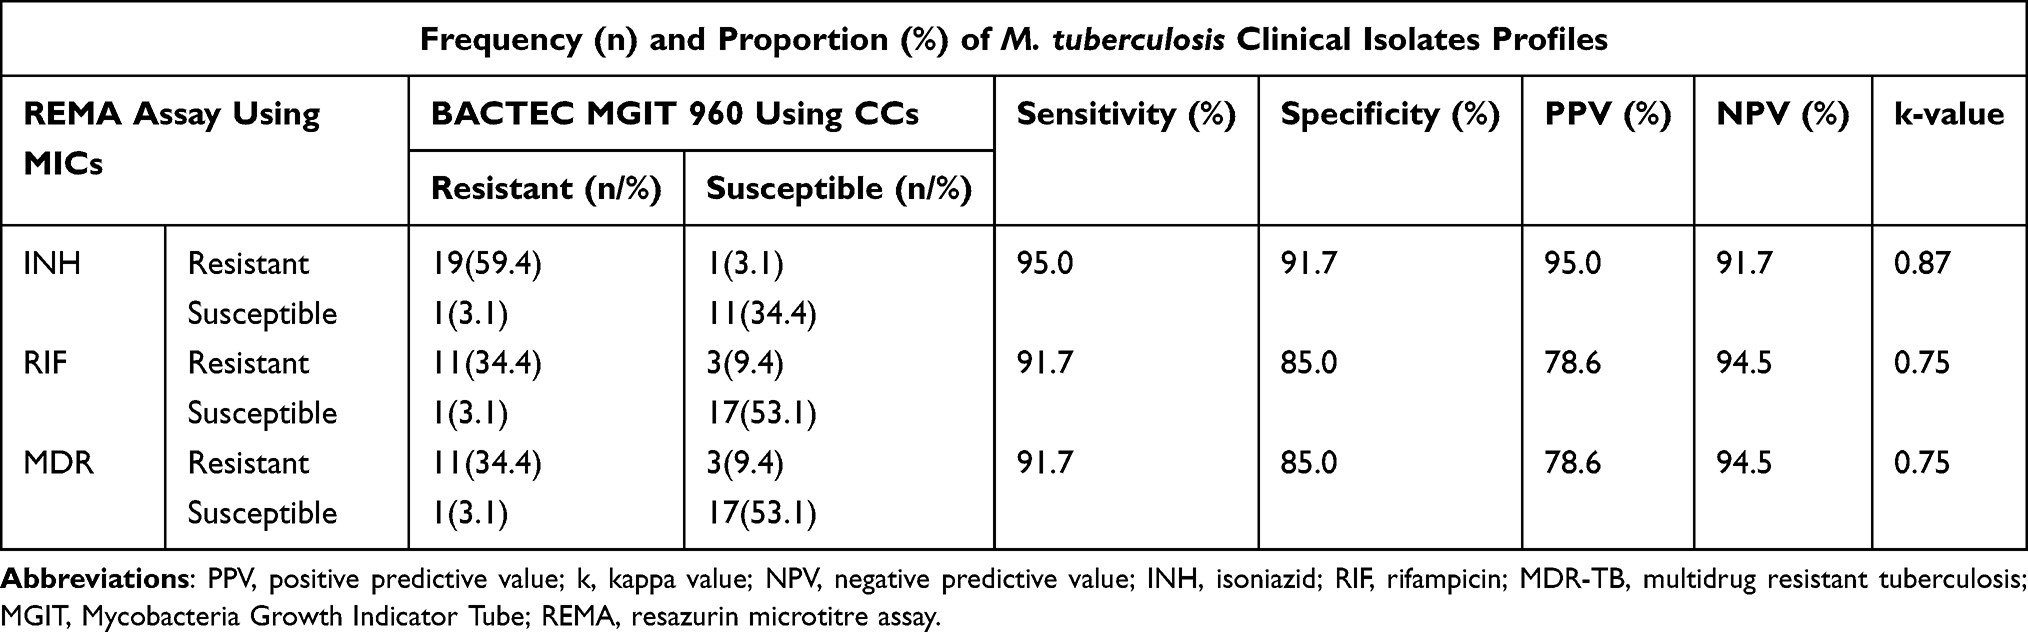 |
Table 6 Diagnostic Utility of the REMA Assay for Susceptibility Testing as Compared with Gold Standard MGIT 960 (n = 32) |
Discussion
The emergence of MDR-TB is a serious public health problem.34 The SLDs have to be used for treatment of MDR/XDR-TB patients but are consistently difficult with less effectiveness, less availability in low-income countries, more toxicity, and higher costs. Susceptibility testing using MIC instead of the CCs shows that some FLDs act inhibitory in slightly higher concentrations in vitro.21 Thus, to our knowledge, this is the first study to investigate the distributions of MIC values and in vitro synergism effect in double and triple drug combinations against M. tuberculosis clinical isolates.
The present study showed that different drug resistance conferring mutations in the rpoB, katG, and inhA genes underlying resistance to RIF and INH were associated with different MIC ranges. Among the 14 (43.8%) RIF-resistant isolates with the MIC value ≥0.5μg/mL, the 5 (35.7%) isolates harbored high-level RIF-resistance at the MIC value ≥2μg/mL, while 9 (64.3%) isolates were exhibited a low-level RIF-resistance with MIC diversity ranges from 0.5 to 1μg/mL in REMA plate which previously defined as susceptible isolates by CCs MIGT 960 at 1μg/mL or that were no carried specific mutations in the rpoB gene underlying drug-resistance using LPA. This finding was slightly lower than the previous studies that showed a rate of 61.5% high-level RIF-resistance and 38.5% low-level RIF-resistance in Vietnam,31 73.2% high-level and 26.8% low-level RIF-resistance among Brazilian clinical isolates using the REMA assay,32 and 100% MDR-TB isolates displaying high-level RIF-resistance with MICs ≥32µg/mL on LJ medium in Germany.21
Herein, five of nine RIF-resistant clinical isolates (55.6%) in this study, which carried common mutations at codons S450L in the rpoB gene, were found to have high-level resistance to RIF with a MIC value ≥2μg/mL, while four isolates (100%) that carried rpoB gene substitutions at codons D435V and H445Y were exhibited moderate and low-level RIF resistance, with MIC values ranging from 0.5 to 1μg/mL on the REMA plate. Interestingly, a similar finding was identified in previous study where RIF-resistant strains having mutations rpoB mutants at codons S450L (100%) were associated with elevated MICs of resistance in Romania using the MycoTB assay.7 However, other studies demonstrated that the RIF-resistant strains having mutations rpoB mutants at different codons S450L, H445Y, H445D were linked with high levels of MICs resistance in China by microplate Alamar blue assay,34 and isolates with harboring substitutions at codons S450L, H445Y, H445D, and D435G were associated with high levels of MIC resistance, while mutation at codon L430P was related to low-level RIF resistance using either MycoTB or REMA MIC testing.35–39 Nevertheless, the MIC of a RIF-resistant strain increased up to 32µg/mL when it contained L430P mutation along with D435G mutation. This suggests that the L430P mutation alone is responsible for low-level RIF-resistance and only affects the MIC when it co-exists with additional mutations that are responsible for high RIF-resistance.39 Earlier study has shown that RIF-resistant strains with double mutations in the rpoB gene are associated with high-level resistance of MIC with ≥16µg/mL, as determined by whole-genome sequencing (WGS) and MycoTB MIC testing.36 Over 95% of RIF-resistant isolates have been found to have mutations in the rpoB gene within the RRDR region. Mutations at codons 450, 445 and 435 in the RRDR are generally linked to high levels of RIF resistance, while specific amino acid substitutions at codons 430, 433, 434, 437, 451, and 452 are associated with lower levels of resistance.37,39 This suggests that the position and nature of the amino acid substitution strongly influences the MIC levels. The type and frequency of rpoB mutations related to RIF resistance may vary depending on the setting and level of resistance.34 When compared to M. tuberculosis populations with isolates exhibiting high MICs, isolates with low-level resistance may have lower fitness in the presence of RIF. The cost of resistance has been identified as a crucial factor in the spread of DR-TB strains. The competitive fitness of M. tuberculosis strains is not only dependent on the specific rpoB mutation (eg, S450L versus H445Y), but also on the strain’s genotype. Fitness varies significantly between lineages, even when the rpoB mutation and resistance level are identical.40
Moreover, three strains that initially appeared to be resistant to RIF with no common mutations in the rpoB gene were later found to be able to grow at a MIC of 0.5 to 1 µg/mL as determined by MIC assay in our study. This finding is consistent with earlier reports, where four strains with low-level RIF resistance had no mutations in the RRDR region,34 and two strains with high-level resistance and six strains with low-level resistance had no mutations in the entire rpoB gene.39 This suggests that MIC is important in detecting borderline RIF-resistance in M. tuberculosis strains, especially when it is associated with low-level resistance and difficult to detect using traditional phenotypic methods like MIGT 960 with a single concentration of 1µg/mL, as well as genotypic methods like LPA. Treatment outcomes for patients with borderline RIF-resistance have been linked to treatment failures.20,41,42
In addition, information on the level of resistance to INH is important to guide the treatment choice with high dose of INH for MDR-TB isolates with katG mutations.21 The present study revealed that a proportion of 62.5% (20/32) isolates were INH resistance with the MIC values of ≥0.25μg/mL. Among INH-resistant isolates which carrying mutations in the katG gene by MTBDRplus assay, 81.8% (9/11) isolates were associated with high level of INH resistance at the MIC ≥ 1μg/mL and four of isolates (100%) with mutations at the inhA gene displayed low-level INH resistance with the MIC ranges from ≥0.25 to 0.5μg/mL. Previous studies described similar findings, a study in Ethiopia reported that a proportion of 88.5% MDR-TB isolates occurring mutations in the katG gene exhibited a moderate-level INH resistance (MIC ≥ 2 to 4 μg/mL) and 7.7% isolates with mutations in the inhA gene detected by the MTBDRplus showed a low-level INH resistance (MIC ≤ 0.5μg/mL) using MYCOTB MIC plates,20 84.2% high-level and 15.8% low-level resistance to INH,32 the katG S315T mutation (100%) was associated with elevated MICs in Romania using MycoTB assay,7 an equal proportion of 50% high-level and low-level INH-resistance in Vietnam using REMA MIC assay.31
The present study suggests that different resistance mutations lead to distinct MICs, some of which may still be overcome by increased dosing. Conversely, a study conducted in Germany reported that 88.6% and 83.3% MDR-TB strains showed low-level INH and EMB resistance with a MIC value of 1 to 8µg/mL for INH and 0.5 to 10µg/mL for EMB on LJ/7H10 medium, respectively; while 11.4% and 16.7% isolates revealed high-level INH and EMB resistance at a MIC above 8µg/mL for INH and 20µg/mL for EMB.21 This suggests that high-dose INH (15–20 mg/kg daily) than the standard dose (3–5mg/kg daily) and EMB (up to 25 mg/kg) could be benefit in treating MDR-TB patients harboring a high proportion of katG gene mutations if low-level resistance MIC testing is detected. Different drug resistance genetic mutations inside the resistance determining region of rpoB and katG are associated with distinct MIC levels of resistance to RIF and INH.43 The INH-resistant strains having mutation katG S315T was significantly associated with high-level of MICs in M. tuberculosis,7,37 and rpoB S450L and katG S315T mutations of clinical M. tuberculosis isolates are known to be low-cost genetic variants and are associated with high-level of MIC resistance to RIF and INH, respectively,44 while lower-levels of resistance are related with T-8A and C-15T mutations in the inhA region.37 Commonly, high-levels (MIC≥1µg/mL) and low-levels (MIC<1µg/mL) of resistance have been linked with mutations in the katG and inhA genes, respectively.
The MICs in the double drugs INH+RIF, RIF+LEV, INH+LEV and EMB+LEV combination were decreased the individual MIC from one to two dilutions, showing synergistic effect (FICI = 0.5) against 9/32 (28.1%), 4/32 (12.5%) 4/32 (12.5%) and 2/32 (6.3%) INH-resistant isolates, respectively, but not in those which were drug-susceptible by the REDCA assay, where the synergistic difference of NH+RIF vs RIF+LEV for drug-resistant isolates was significant (p = 0.026). This finding is in agreement with previous studies that the RIF+INH combination showed a synergistic effect for 13.8% (4/29) clinical MDR-isolates18 and EMB+LEV combination against two MDR of ten resistant M. tuberculosis clinical Brazilian isolates (20.0%) as determined by REDCA assay.15 However, previous studies showed no synergism effect in RIF+INH combination against M. tuberculosis on checkerboard titration assay.19,45 This might be due to the difference in the isolate and patient characteristics. INH+LEV against drug-resistant or susceptible isolates as shown by both checkerboard and REDCA assays,15 and a combination of pasiniazid (Pa) with rifapentine (RFP) more likely to show in vitro synergism than that of the standard INH+RIF combinations (P < 0.0001), which can provide a new regimen for retreatment TB patients.18
The potential combined effect of triple drugs combination INH+RIF+EMB, INH+RIF+LEV, and INH+EMB+LEV in our study exhibited a synergistic activity with FICI value of ≤0.75 against 6/32 (18.8%), 11/32 (34.4%), and 8/32 (25%) INH-resistant isolates, respectively, where the individual MIC from decreased one to two dilutions. This finding is in agreement with previous studies that showed a synergistic effect for RIF+INH+EMB combination by 3D-chequerboard assay against two resistant isolates (20%) (FICI = 0.72),45 RIF+INH+EMB for twelve (100%) INH-resistant isolates (FICI = 0.31–0.38) and ofloxacin (OFX)+RIF+EMB drug combination (FICI = 0.31–0.62) in 21 out of the 23 isolates (91.3%),14 and the INH and RIF combined to LEV at ¼ MIC for 40% of resistant isolates and no antagonism was observed among the tested drugs.17 In our study, the RIF+INH+LEV combination showed significantly more synergism than that of the RIF+INH+EMB for drug-resistant isolates (p < 0.001), which is consistent with a study revealed that the OFX+RIF+EMB combination showed significantly more synergism than that of the INH+RIF+EMB combination (p = 0.007).14 This suggests that the FQs groups, either LEV or OFX, displayed better efficacy and potentially greater power than EMB or INH when used in triple combinations for drug-resistant and susceptible isolates. This combination may be an effective therapeutic option for the treatment of both the drug susceptible and resistant M. tuberculosis infections by restoring susceptibility against M. tuberculosis strains carrying genetic resistance to any one of the partner drugs. Rifamycin derivatives such as RIF, unfortunately, have the potential to cause drug–drug interactions through either enzymatic and/or transporter induction. On the other hand, EMB, which also affects mycobacterial cell wall synthesis, did not exhibit synergy with RIF.46 This implies that the three-drug combinations might have synergistic activity when compared to individual or two-drug regimens. In our study, during triple-drug combination of INH and RIF with 0.5µg/mL MIC of EMB, the MIC values of INH and RIF were decreased the individual MIC from one to two dilutions. This suggests that the synergistic or even antagonistic activity of a specific combination against a particular microorganism is not only a property of each drug but also depending on the dose of each drug in the combination. This assumption is supported by Santos et al.17 Our finding is clearly inconsistent with the in vitro synergism activity of INH+RIF+EMB combination against two INH-susceptible isolates (18.2%) (FICI = 0.6).14 The inconsistency of the synergism interaction profile in different studies with similar anti-TB drugs could be attributed to patient-specific characteristics, such as variations in drug-metabolizing enzymes (CYP). These variations can affect the rate at which drugs are broken down and eliminated from the body, which may potentially lead to interactions if one drug inhibits or induces the activity of these enzymes. A study of three drug combination using sub-MIC spectinomycin (SPT)+RIF+INH resulted in enhanced activity in vitro against RIF-mono-resistant rpoB S450L mutant, but similar effect was not observed for the INH-mono-resistant strain harboring inhA promoter -c15t mutation. The ability of INH to inhibit cytochrome P450 (CYP) may contribute to synergy in the RIF and INH with SPT combination when the active form of INH is not rapidly eliminated inside M. tuberculosis and when SPT acts by further reducing the activity of CYPs.19 The elevated levels of CYP have been associated with drug resistance due to the enhanced rate of elimination of the drugs by metabolism.47 Furthermore, the synergy of drug interactions and positive epistasis between low-cost drug resistance-conferring mutations in rpoB S450L and katG S315T may also be influenced by the phylogenetic background of M. tuberculosis strains.48 Different regions could exhibit diverse strains that possess various resistance patterns, resulting in complex drug interactions and posing a challenge for “one-size-fits-all” regimens and predicting treatment outcomes.
One more finding in our study has revealed an excellent sensitivity and specificity of 95% and 91.7% for detecting INH-resistance, respectively, 91.7% and 85% for RIF-resistance/MDR-TB when compared to the phenotypic BACTEC MIGT960 as a reference method. This finding is consistent with previous studies conducted the sensitivity and specificity of REMA were 89% and 68% for identifying isolates resistant to RIF, respectively, and 95% and 96% for INH compared to the proportion method (PM) in South Africa;25 94.5% and 100% for RIF, and 92.7% and 98% for INH compared to PM in India;30 100% and 98.9% for RIF, 100% and 99.4% for INH, and 100% and 99.5% for MDR-TB strains compared to the MGIT 960 DST in Vietnam;31 95% and 100% for RIF, 100% and 100% for INH compared to MIGT 960 in Brazil;32 91.3% and 100% for RIF, and 100% and 90.4% for INH compared to MIGT 960 in Turkey;49 colorimetric tetrazolium microplate assay (TEMA) was 100% and 86% in detecting RIF resistance, and 100% and 100% for INH compared to LJ in Ethiopia;50 and MycoTB assay demonstrates improved performance with a sensitivity of 96.2% and specificity of 95%, using a MIC cutoff of 0.5μg/mL for low-level RIF-resistance in New York.36
In the present study, two strains with MICs of 0.5μg/mL would not be classified as RIF-resistant by genotypic LPA and phenotypic MIGT at 1.0μg/mL, but they exhibited an equal MIC to the rpoB wild-type strains. This implies that the low-level resistance mutations in rpoB underscore the value of genotypic methods for diagnosing RIF-resistance, particularly methods that interrogate the full-length rpoB gene. The absence of mutation in rpoB gene does not rule out the possibility of RIF-resistance by another mechanism, but no other genetic loci involved with RIF-resistance have been well characterized thus far. This might be due to the strains harboring such uncommon mutations within the RRDR in the rpoB gene when tested by LPA, results in false-positive predictions of resistance as well as the other mutations that are not targeted by LPA, which may underscore the value of genotypic LPA for identifying RIF-resistance. The relationship between the low-level RIF-resistance disputed variants of the rpoB gene and poor patient outcomes as well as the elevated MICs caused by these mutations has led to a recent change in the CCs recommended by the WHO for RIF from 1 to 0.5µg/mL in MGIT 960 DST to involve low-level resistant isolates.51 However, it is important to appreciate that there are unknown resistance mechanisms, inadequate limits of detection, and epistatic interaction that could all play a role.7 Therefore, there is a need for WGS with MIC testing that predicts drug susceptibility in a number of phenotypically susceptible isolates and finds disputed mutations conferring low-level drug resistance. Those methods overcame the limitations of CCs MIGT 960 and probe-based genotyping methods and are important to guide the clinical decision-making process and facilitate therapeutic drug monitoring, ultimately leading to a better treatment outcome. In the absence of WGS or MIC testing, most of the mutations that confer low-level RIF resistant isolates may have gone completely undetected, potentially leading to treatment failure and the acquisition of further resistance to drugs.36
Strength and Limitation of the Study
To the best of our knowledge, this study is the first to employ resazurin to assess the in vitro susceptibility and anti-mycobacterial synergistic activity of RIF, INH, EMB and LEV agents in drug-resistant and susceptible M. tuberculosis clinical isolates. The REMA/REDCA approach that performed in a single microplate experiment is cost-effective compared to MIGT 960 and checkerboard methods for testing of susceptibility and drug interaction profiles, respectively. Nevertheless, the study has its own limitations. First, the small number of M. tuberculosis clinical isolates were evaluated. Second, probe-based MTBDRplus assay is limited to common mutations, and there is a need of WGS data analysis. Third, limited classical anti-TB drug combinations and drug–drug interaction performed between the currently available classical FLDs and LEV but unable to incorporate new generation of drugs, second-line injectable agents and certain anti-retroviral drug combinations for TB/HIV co-infected patients. There are reasonable chances of clinically important drug–drug interactions between RIF (CYP enzyme inhibitor) and anti-retroviral drugs (ARVs) that may account for poor MDR-TB/HIV treatment outcomes.47 Therefore, further investigations on WGS with MIC and FICI testing will be needed that include a large sample size, new anti-TB drugs, and ARVs to allow for personalized treatment of TB patients with HIV co-infection in low-income countries like Ethiopia.
Conclusion
Diagnosing all types of drug resistance patterns can be challenging, particularly when genotypic LPA and phenotypic MIGT 960 DST results are discordant. Detection of isolates with rare mutations that cause diagnostic and treatment challenges by both testing is significant. The MIC determination in REMA assay is powerful to understand the profiles of drug resistance when isolates were phenotypically susceptible and carried unknown mutations. Low-level RIF-resistance M. tuberculosis isolates cause diagnostic and treatment challenges and the data related to the low-level RIF-resistant of TB incidences are still lacking. Moreover, over half of MDR-TB isolates had moderate level INH resistant indicates the potential benefit of high-dose INH treatment in a high proportion of katG gene harboring MDR-TB isolates if aligned with MIC values. The in vitro synergistic effects of three-drug combination of RIF+INH with LEV showed better efficacy and being of potential use in INH-resistant isolates. The REDCA result makes us hopeful in future investigations to test the synergism of different combination of drugs before formulating new chemotherapy regimens against clinical isolates of M. tuberculosis which is inexpensive and the use of resazurin reagent makes the visual reading of the assay to be more reliable. It will be useful for designing and simplifying therapeutic decision-making to optimize regimen efficacy in resistant cases. Due to small sample size, it is necessary to do more research on this method to investigate the application value. Clinical practice should prioritize strategies that promote its reliability.
Abbreviations
DST, drug susceptibility testing; EMB, ethambutol; FICI, fractional inhibitory concentration index; HIV, human immunodeficiency virus; INH, isoniazid; LEV, levofloxacin; LJ, Lowenstein-Jensen; MDR-TB, multidrug-resistant tuberculosis; MIC, minimum inhibitory concentration; RIF, rifampicin; STR, streptomycin; TB, tuberculosis; WHO, World Health Organization; WGS, whole genome sequencing.
Data Sharing Statement
Datasets used in the study are available from the corresponding author upon reasonable request.
Ethical Approval and Consent
The study was ethically approved by the Institutional Review Board (IRB) of the University of Gondar (UoG) (Ref: VP/RTT/05/829) after reviewing the study proposal. A written letter of support was obtained from the Amhara Public Health Institute (APHI), Bahir Dar branch (Ref: APHI/W/D/03/146). In addition, written informed consent was obtained from all study participants before starting of the study. The ethics was carried out in line with the ethical standards laid down in the Declaration of Helsinki.
Acknowledgments
First and foremost, the authors would like to acknowledge all the study participants for their willingness to participate in this study and for providing the necessary information. The University of Gondar, Institute of Biotechnology, Department of Medical Biotechnology; UoGCSH TB Culture laboratory staff acknowledged for their remarkable support during the study.
Author Contributions
All authors made a significant contribution to the work reported, whether that is in the conception, study design, execution, acquisition of data, analysis and interpretation, or in all these areas; took part in drafting, revising or critically reviewing the article; gave final approval of the version to be published; have agreed on the journal to which the article has been submitted; and agree to be accountable for all aspects of the work.
Funding
This work was financially supported by the University of Gondar (UoG), Gondar, Ethiopia. The funding source did not have any involvement in the study design, data collection, analysis and interpretation of data, preparation of the manuscript, and/or decision to submit the article for publication.
Disclosure
The authors have declared that no competing interests exist.
References
1. World Health Organization. Global TB report 2022. Geneva: World Health Organization; 2022. Available from: https://www.who.int/publications/i/item/9789240061729.
2. World Health Organizaton. Treatment Guidelines for Drug-Resistant Tuberculosis. Geneva, Switzerland: World Health Organizaton; 2016.
3. Gardee Y, Dreyer AW, Koornhof HJ, Omar SV, Silva P, Bhyat Z. Evaluation of the GenoType MTBDRsl tuberculosis isolates in South Africa. J Clin Microbiol. 2017;55(3):791–800. doi:10.1128/JCM.01865-16
4. Mgogwe J, Semvua H, Massay O, Nyombi B, Chilongola J. Demographic and clinical determinants of multi drug resistant tuberculosis among HIV infected patients in Tanzania. Int J Med Med Sci. 2020;12(2):23–32. doi:10.5897/IJMMS2020.1415
5. Sharma SK, Mohan A. Multidrug-resistant tuberculosis: a menace that threatens to destabilize tuberculosis control. Chest. 2006;130(1):261–272. doi:10.1378/chest.130.1.261
6. Mesfin EA, Beyene D, Tesfaye A, et al. Drug-resistance patterns of Mycobacterium tuberculosis strains and associated risk factors among multi drug-resistant tuberculosis suspected patients from Ethiopia. PLoS One. 2018;3(16):1–16. doi:10.1371/journal.pone.0197737
7. Ruesen C, Riza AL, Florescu A, et al. Linking minimum inhibitory concentrations to whole genome sequence-predicted drug resistance in Mycobacterium tuberculosis strains from Romania. Sci Rep. 2018;8(1):1–8. doi:10.1038/s41598-018-27962-5
8. World Health Organization. Line probe assays for detection of drug-resistant tuberculosis: interpretation and reporting manual for laboratory staff and clinicians. World Health Organization; 2022. Available from: https://www.who.int/publications/i/item/9789240046665.
9. Hain LifeScience. GenoType MTBDRplus v.2.0. Molecular genetic assay for identification of the M. tuberculosis complex and its resistance to rifampicin and isoniazid from clinical specimens and cultivated samples; 2015.
10. Seid A, Berhane N. Molecular mechanisms of genetic interaction (epistasis) in the evolution and management of antibiotic resistance tuberculosis: current consequence and future perspectives. Int J Pathog Res. 2021;6(2):58–70. doi:10.9734/ijpr/2021/v6i230160
11. Wilson JW, Nilsen DM, Marks SM. Multidrug-resistant tuberculosis in patients with human immunodeficiency virus. Management considerations within high-resourced settings. Ann Am Thorac Soc. 2020;17(1):16–23. doi:10.1513/AnnalsATS.201902-185CME
12. Khan MSA. Combination of Drugs: An Effective Approach for Enhancing the Efficacy of Antibiotics to Combat Drug Resistance. Springer Nature; 2019.
13. Pooranagangadevi N, Padmapriyadarsini C. Treatment of tuberculosis and the drug interactions associated with HIV-TB co-infection treatment. Front Trop Dis. 2022;3:1–11. doi:10.3389/fitd.2022.834013
14. Rey-jurado E, Tudó G, Antonio J, González-martín J. Synergistic effect of two combinations of antituberculous drugs against Mycobacterium tuberculosis. Tuberculosis. 2012;92(3):260–263.
15. Caleffi-Ferracioli KR, Maltempe FG, Siqueira VLD, Cardoso RF. Fast detection of drug interaction in Mycobacterium tuberculosis by a checkerboard resazurin method. Tuberculosis. 2013;93(6):660–663. doi:10.1016/j.tube.2013.09.001
16. Caleffi-Ferracioli KR, Amaral RCR, Demitto FO, et al. Morphological changes and differentially expressed efflux pump genes in Mycobacterium tuberculosis exposed to a rifampicin and verapamil combination. Tuberculosis. 2016;97:65–72. doi:10.1016/j.tube.2015.12.010
17. de Souza Santos NC, de Lima Scodro RB, de Almeida AL, et al. Combinatory activity of linezolid and levofloxacin with antituberculosis drugs in Mycobacterium tuberculosis. Tuberculosis. 2018;111:41–44. doi:10.1016/j.tube.2018.05.005
18. Ying R, Huang X, Gao Y, et al. In vitro synergism of six antituberculosis agents against drug-resistant mycobacterium tuberculosis isolated from retreatment tuberculosis patients. Infect Drug Resist. 2021;14:3729–3736. doi:10.2147/IDR.S322563
19. Omollo C, Singh V, Kigondu E, et al. Developing synergistic drug combinations to restore antibiotic sensitivity in drug-resistant mycobacterium tuberculosis. Antimicrob Agents Chemother. 2021;65(5). doi:10.1128/AAC.02554-20
20. Getahun M, Blumberg HM, Ameni G, Beyene D, Kempker RR. Minimum inhibitory concentrations of rifampin and isoniazid among multidrug and isoniazid resistant Mycobacterium tuberculosis in Ethiopia. PLoS One. 2022;17(9):1–10.
21. Schönfeld N, Bergmann T, Vesenbeckh S, et al. Minimal inhibitory concentrations of first-line drugs of multidrug -resistant tuberculosis isolates. Lung India. 2012;29(4):309–312. doi:10.4103/0970-2113.102794
22. Seid A, Girma Y, Abebe A, Dereb E, Kassa M, Berhane N. Characteristics of TB / HIV co-infection and patterns of multidrug-resistance tuberculosis in the Northwest Amhara, Ethiopia. Infect Drug Resist. 2023;16:3829–3845. doi:10.2147/IDR.S412951
23. GLI. Mycobacteriology laboratory manual. Global laboratory initiative; advancing TB diagnosis; 2014:47–51.
24. Pinhata JMW, Lemes RA, Simeão FCDS, De Souza AR, Chimara E, Ferrazoli L. Use of an immunochromatographic assay for rapid identification of Mycobacterium tuberculosis complex clinical isolates in routine diagnosis. J Med Microbiol. 2018;67(5):683–686. doi:10.1099/jmm.0.000726
25. Jaglal P, Pillay M, Mlisana K. Resazurin microtitre plate assay and Sensititre® MycoTB for detection of Mycobacterium tuberculosis resistance in a high tuberculosis resistance setting. Afr J Lab Med. 2019;8(1):1–9. doi:10.4102/ajlm.v8i1.840
26. Rakhmawatie MD, Wibawa T, Lisdiyanti P, et al. Evaluation of crystal violet decolorization assay and resazurin microplate assay for antimycobacterial screening. Heliyon. 2019;5(8):e02263. doi:10.1016/j.heliyon.2019.e02263
27. Rey-Jurado E, Tudó G, De La Bellacasa JP, Espasa M, González-Martín J. In vitro effect of three-drug combinations of antituberculous agents against multidrug-resistant Mycobacterium tuberculosis isolates. Int J Antimicrob Agents. 2013;41(3):278–280. doi:10.1016/j.ijantimicag.2012.11.011
28. Patil SS, Mohite ST, Kulkarni SA, Udgaonkar US. Resazurin tube method: rapid, simple, and inexpensive method for detection of drug resistance in the clinical isolates of Mycobacterium tuberculosis. J Glob Infect Dis. 2014;6(4):151–156. doi:10.4103/0974-777X.145239
29. Jadaun GPS, Agarwal C, Sharma H, et al. Determination of ethambutol MICs for Mycobacterium tuberculosis and Mycobacterium avium isolates by resazurin microtitre assay. J Antimicrob Chemother. 2007;60(1):152–155. doi:10.1093/jac/dkm117
30. Dixit P, Singh U, Sharma P, Jain A. Evaluation of nitrate reduction assay, resazurin microtiter assay and microscopic observation drug susceptibility assay for first line antitubercular drug susceptibility testing of clinical isolates of M. tuberculosis. J Microbiol Methods. 2012;88(1):122–126. doi:10.1016/j.mimet.2011.11.006
31. Nguyen NTB, Molicotti P, Hung T, et al. Application of the resazurin microtitre assay for the detection of isoniazid and/or rifampicin resistant Mycobacterium tuberculosis clinical isolates in Central Vietnam. J Med Pharm. 2020;10:1.
32. Miyata M, Rogério Pavan F, Nakamura Sato D, et al. Comparison of resazurin microtiter assay performance and BACTEC MGIT 960 in the susceptibility testing of Brazilian clinical isolates of Mycobacterium tuberculosis to four first-line drugs. Brazilian J Microbiol. 2013;44(1):281–285. doi:10.1590/S1517-83822013005000028
33. Khalifa RA, Nasser MS, Gomaa AA, Osman NM, Salem HM. Resazurin microtiter assay plate method for detection of susceptibility of multidrug resistant Mycobacterium tuberculosis to second-line anti-tuberculous drugs. Egypt J Chest Dis Tuberc. 2013;62(2):241–247. doi:10.1016/j.ejcdt.2013.05.008
34. Hameed HMA, Fang C, Liu Z, et al. Characterization of genetic variants associated with rifampicin resistance level in Mycobacterium tuberculosis clinical isolates collected in Guangzhou Chest Hospital, China. Infect Drug Resist. 2022;15:5655–5666. doi:10.2147/IDR.S375869
35. Hameed HM, Islam MM, Chhotaray C, et al. Molecular targets related drug resistance mechanisms in MDR-, XDR-, and TDR-Mycobacterium tuberculosis strains. Front Cell Infect Microbiol. 2018;8(114). doi:10.3389/fcimb.2018.00114
36. Shea J, Halse TA, Kohlerschmidt D, et al. Low-level rifampin resistance and rpoB mutations in Mycobacterium tuberculosis: an analysis of whole-genome sequencing and drug susceptibility test data in New York. J Clin Microbiol. 2021;59(4). doi:10.1128/JCM.01885-20
37. Jamieson FB, Guthrie JL, Neemuchwala A, Lastovetska O, Melano RG, Mehaffy C. Profiling of rpoB mutations and MICs for rifampin and rifabutin in mycobacterium tuberculosis. J Clin Microbiol. 2014;52(6):2157–2162. doi:10.1128/JCM.00691-14
38. Rukasha I, Said HM, Omar SV, et al. Correlation of rpoB mutations with minimal inhibitory concentration of rifampin and rifabutin in Mycobacterium tuberculosis in an HIV/AIDS endemic setting, South Africa. Front Microbiol. 2016;7:1–7. doi:10.3389/fmicb.2016.01947
39. Li MC, Lu J, Lu Y, et al. RpoB mutations and effects on rifampin resistance in mycobacterium tuberculosis. Infect Drug Resist. 2021;14:4119–4128. doi:10.2147/IDR.S333433
40. Koch A, Mizrahi V, Warner DF. The impact of drug resistance on Mycobacterium tuberculosis physiology: what can we learn from rifampicin? Emerg Microbes Infect. 2014;3:1.
41. Miotto P, Cabibbe AM, Borroni E, Degano M, Cirilloa DM. Role of disputed mutations in the rpoB gene in interpretation of automated liquid MGIT culture results for rifampin susceptibility testing of mycobacterium tuberculosis. J Clin Microbiol. 2018;56(5).
42. Torrea G, Kcs N, Van Deun A, et al. Variable ability of rapid tests to detect Mycobacterium tuberculosis rpoB mutations conferring phenotypically occult rifampicin resistance. Sci Rep. 2019;9:1–9. doi:10.1038/s41598-019-48401-z
43. Zaw MT, Emran NA, Lin Z. Mutations inside rifampicin-resistance determining region of rpoB gene associated with rifampicin-resistance in Mycobacterium tuberculosis. J Infect Public Health. 2018;11(5):605–610. doi:10.1016/j.jiph.2018.04.005
44. Brandis G, Pietsch F, Alemayehu R, Hughes D. Comprehensive phenotypic characterization of rifampicin resistance mutations in Salmonella provides insight into the evolution of resistance in Mycobacterium tuberculosis. J Antimicrob Chemother. 2015;70(3):680–685. doi:10.1093/jac/dku434
45. Bhusal Y, Shiohira CM, Yamane N. Determination of in vitro synergy when three antimicrobial agents are combined against Mycobacterium tuberculosis. Int J Antimicrob Agents. 2005;26(4):292–297. doi:10.1016/j.ijantimicag.2005.05.005
46. Yan L, Zhang L, Yang H, Xiao H. In vitro synergism testing of three antimicrobial agents against multidrug- resistant and extensively drug-resistant Mycobacterium tuberculosis by checkerboard method. J Mol Pharm Org Process Res. 2015;3(1):3–6.
47. Mukonzo J, Aklillu E, Marconi V, Schinazi RF. Potential drug–drug interactions between antiretroviral therapy and treatment regimens for multi-drug resistant tuberculosis: implications for HIV care of MDR-TB co-infected individuals. Int J Infect Dis. 2019;83:98–101. doi:10.1016/j.ijid.2019.04.009
48. Li Q, Jiao W, Yin Q, et al. Positive epistasis of major low-cost drug resistance mutations rpoB 531-TTG and katG 315-ACC depends on the phylogenetic background of Mycobacterium tuberculosis strains. Int J Antimicrob Agents. 2017;49(6):757–762. doi:10.1016/j.ijantimicag.2017.02.009
49. Coban AY, Uzun M, Akgunes A, Durupinar B. Comparative evaluation of the microplate nitrate reductase assay and the resazurin microtitre assay for the rapid detection of multidrug resistant Mycobacterium tuberculosis clinical isolates. Mem Inst Oswaldo Cruz, Rio Janeiro. 2012;107(5):578–581. doi:10.1590/S0074-02762012000500002
50. Hundie GB, Woldemeskel D, Gessesse A, Cardona P-J. Evaluation of direct colorimetric MTT assay for rapid detection of rifampicin and isoniazid resistance in Mycobacterium tuberculosis. PLoS One. 2016;11(12):1–14. doi:10.1371/journal.pone.0169188
51. World Health Organization. Technical Report on Critical Concentrations for Drug Susceptibility Testing of Isoniazid and the Rifamycins (Rifampicin, Rifabutin and Rifapentine). Geneva: World Health Organization; 2021.
 © 2024 The Author(s). This work is published and licensed by Dove Medical Press Limited. The full terms of this license are available at https://www.dovepress.com/terms.php and incorporate the Creative Commons Attribution - Non Commercial (unported, v3.0) License.
By accessing the work you hereby accept the Terms. Non-commercial uses of the work are permitted without any further permission from Dove Medical Press Limited, provided the work is properly attributed. For permission for commercial use of this work, please see paragraphs 4.2 and 5 of our Terms.
© 2024 The Author(s). This work is published and licensed by Dove Medical Press Limited. The full terms of this license are available at https://www.dovepress.com/terms.php and incorporate the Creative Commons Attribution - Non Commercial (unported, v3.0) License.
By accessing the work you hereby accept the Terms. Non-commercial uses of the work are permitted without any further permission from Dove Medical Press Limited, provided the work is properly attributed. For permission for commercial use of this work, please see paragraphs 4.2 and 5 of our Terms.