Back to Journals » Journal of Multidisciplinary Healthcare » Volume 16
Innovative Macula Capillaries Plexuses Visualization with OCTA B-Scan Graph Representation: Transforming OCTA B-Scan into OCTA Graph Representation
Authors Al-Hinnawi AR ![]() , Al-Latayfeh M
, Al-Latayfeh M ![]() , Tavakoli M
, Tavakoli M ![]()
Received 1 August 2023
Accepted for publication 1 November 2023
Published 15 November 2023 Volume 2023:16 Pages 3477—3491
DOI https://doi.org/10.2147/JMDH.S433405
Checked for plagiarism Yes
Review by Single anonymous peer review
Peer reviewer comments 2
Editor who approved publication: Dr Scott Fraser
Supplementary video of "Transforming OCTA B-Scan into OCTA graphs" [ID 433405].
Views: 99
Abdel-Razzak Al-Hinnawi,1 Motasem Al-Latayfeh,2 Mitra Tavakoli3
1Department of Medical Imaging, Faculty of Allied Medical Sciences, Isra University, Amman, Jordan; 2Department of Special Surgery, Faculty of Medicine, The Hashemite University, Zarqa, Jordan; 3Exeter Centre of Excellence for Diabetes Research, National Institute for Health and Care Research (NIHR) Exeter Clinical Research Facility, and Institute of Biomedical and Clinical Sciences, University of Exeter Medical School, Exeter, UK
Correspondence: Abdel-Razzak Al-Hinnawi, Technology of Medical Imaging Department, Faculty of Allied Medical Sciences, Isra University, Queen Alia Airport, Amman, 11622, Jordan, Tel +962780515199, Email [email protected]; [email protected]
Purpose: The aim of this study is to transform optical coherence tomography angiography (OCTA) scans into innovative OCTA graphs, serving as novel biomarkers representing the macular vasculature.
Patients and Methods: The study included 90 healthy subjects and 39 subjects with various abnormalities (29 with diabetic retinopathy, 5 with age-related macular degeneration, and 5 with choroid neovascularization). OCTA 5μm macular coronal views (MCVs) were generated for each subject, followed by blood vessel segmentation and skeleton processing. Subsequently, the blood vessel density index, blood vessel skeleton index, and blood vessel tortuosity index were computed. The graphs of each metric were plotted against the axial axes of the OCTA B-scan, representing the integrity of vasculature at successive 5μm macular depths.
Results: The results revealed two significant findings. First, the B-scans from OCTA can be transformed into OCTA graphs, yielding three specific OCTA graphs in this study. These graphs provide new biomarkers for assessing the integrity of deep vascular complex (DVC) and superficial vascular complex (SVC) within the macula. Second, a statistically significant difference was observed between normal (n=90) and abnormal (n=39) subjects, with a t-test p-value significantly lower than 0.001. The Mann–Whitney u-test also yielded significant difference but only between the 90 normal and 29 DR subjects.
Conclusion: The novel OCTA graphs offer a unique representation of the macula’s SVC and DVC, suggesting their potential in aiding physicians in the diagnosis of eye health within OCTA clinics. Further research is warranted to finalize the shape of these newly derived OCTA graphs and establish their clinical relevance and utility.
Plain Language Summary: The current state of optical coherence tomography angiography (OCTA) machines lacks the provision of OCTA graphs depicting macula vasculature. This article presents a new technique that transforms OCTA B-Scan data into OCTA plots, representing the vasculature through graphs or curves. The results showed that:The method is an innovative and successful endeavor to transform the OCTA scan data into a graphical representation, introducing an innovative representation of the macula capillaries’ plexuses’ diffusion.The method successfully characterized and distinguished the superficial from the deep capillaries plexuses in the macula.The physicians observed that the new method can be of futuristic advantage to OCTA clinics in monitoring patient’s health and probably differentiating the normal from abnormal OCTA patients, but this needs dedicated clinical research.
Keywords: macula vasculature, medical imaging informatics, medical imaging processing procedures, optical coherence tomography angiography, vision science
Graphical Abstract:

Introduction
Medical imaging informatics is a research field that transforms medical image data into attributes known as biomarkers, which represent normal anatomical integrity and pathological occurrences. The World Health Organization defines biomarkers as substances, structures, or processes measurable in the body or its products, capable of influencing or predicting the occurrence of diseases or outcomes.1 In medical imaging, these biomarkers play a crucial role in helping clinicians assess disease progression, make diagnostic decisions, and extract reliable measurements for patient evaluation. As a result, biomarkers have widespread applications in medical imaging research, clinical practice, and education.2 A graphical summary created from image-data, for instance, can help track the progression of an illness, the effectiveness of treatment, and the identification of atypical physiology. As an example, graphs of the thickness of the retina nerve fiber layer (RNFL biomarker) from optical coherence tomography (OCT) imaging of the eye assist physicians in diagnosing their patients and recommending treatments.3
Optical coherence tomography angiography (OCTA) has emerged as the leading imaging technique for assessing the vasculature of the eye,4 particularly in the macula. Due to its non-invasive nature and high-resolution imaging capabilities, OCTA provides valuable insights into the intricate vascular network of the ocular region. By leveraging the principles of optical coherence tomography, OCTA enables the visualization of blood flow patterns and the identification of vascular abnormalities, offering clinicians a powerful non-invasive tool for diagnosing and monitoring various ocular conditions.4,5 OCTA devices offer recognized biomarkers, which provide valuable quantitative and qualitative information, for assessing the eye’s vasculature and thus aiding in the diagnosis and management of ocular conditions. One of the OCTA biomarkers is the density maps of blood vessels in various macular regions. These maps enable the visualization of disruptions in capillary networks caused by conditions such as choroidal neovascularization (CNV), age-related macular degeneration (AMD), and diabetic retinopathy (DR). By assessing the density of blood vessels, clinicians can gain insights into the extent and severity of vascular changes associated with these conditions.5,6 In addition to vessel density maps, OCTA machines calculate metrics such as the area, perimeter, and circularity of specific macular regions, including the Fovea Avascular Zone (FAZ).5,7 These metrics provide quantitative measurements that help assess the size, shape, and characteristics of the FAZ. Analyzing these parameters can aid in the evaluation of conditions affecting retinal perfusion and the identification of changes in the FAZ associated with various retinal diseases. The macular layers’ thicknesses are also displayed in the form of a table, providing a complementary diagnosis of the macula’s health.5,6,8 Moreover, OCTA devices display the percentage of asymmetry between the right eye (OD) and left eye (OS) in macula vascular density through maps.9,10 These maps represent quantitative differences in vascular density between the two eyes. However, currently, available OCTA machines do not provide OCTA graphs or charts specifically illustrating the diffusion of macula vasculature. The study presented in this paper aims to address this gap by focusing on developing OCTA graphs/charts, providing a novel approach to analyzing and visualizing vascular characteristics.
The exploration and development of OCTA biomarkers have been a prominent research topic in the literature since the 2010s. The continuous advancements in OCTA technology and analysis techniques have significantly contributed to the growing body of literature on OCTA biomarkers over the past decade.11,12 Numerous studies have focused on investigating and establishing novel quantitative and qualitative OCTA biomarkers of the ocular vasculature, offering valuable insights into various retinal and choroidal conditions. Indicators such as perfusion, area, and skeleton have been examined to estimate vascular density. These metrics provide a perception of blood flow, spatial coverage, and vessel architecture, aiding in the assessment of ocular conditions.13–16 According to the findings, they were useful in observing the spatial distribution of vessels, which can be harmed by conditions including AMD, DR, and CNV. As an alternative, researchers suggested certain OCTA complexity measurements such as the tortuosity of the vasculature, fractal dimension analysis, texture, and branching points.15,17–19 The findings demonstrated their ability to evaluate the macular vasculature for being intact (ie, normal) or disrupted (ie, abnormal). All of these metrics have one thing in common: they finally give quantitative representations that, rather than OCTA graphs, indicate the morphology and spatial propagation of arteries in the macula. This study examines the viability of creating new OCTA graphs depictions of capillary plexuses from OCTA examination data.
This study introduces a new method for generating OCTA graphs, which effectively represents the vasculature at successive 5µm macula depths using OCTA B-Scan data. Three new OCTA graphs have been proposed and tested on a dataset of 129 OCTA exams, consisting of 90 normal cases and 39 cases with DR, AMD, and CNV. The results demonstrate that the new OCTA graphs can monitor the macular blood vessels at 5µm sequential depths and may have a possible potential to differentiate between abnormal and normal vasculature. These findings suggest that the new OCTA graphs could be valuable in the diagnosis procedures of OCTA clinics. However, further research is needed to refine the presentation of these OCTA plots and demonstrate their clinical applicability.
Material
Macula
The macula, a pigmented area with an oval shape in the center of the retina of the human eye, contains high-resolution photoreceptor cells (ie the Rods that are responsible for scotopic vision, and the Cones that are responsible for photonic vision), hence any damage to the macula will affect vision for human.20,21 It is made up of the perifovea, parafovea, and fovea, which also contains the foveolar and Umbo areas. Seven distinct structures (ie layers) can be seen in macular histology: the Internal Limiting Membrane (ILM), Nerve Fiber Layer (NFL), Ganglion Cell (GC), Inner Plexiform Layer (IPL), Inner Nuclear layer (INL), Outer Plexiform Layer (OPL), Outer Nuclear Layer (ONL), External Limiting Membrane (ELM), and Retinal pigment epithelium (RPE) and the Bruch’s Complex (BC).22,23 The NFL, IPL, and OPL are the three layers in which the vascular plexuses are normally located. The superficial vascular complex (SVC) and deep vascular complex (DVC) are further terms used to classify the vasculature plexuses. Approximately, the NFL, GC, and IPL levels are part of the SVC, and the OPL and ONL layers are part of the DVC.24 Figure 1 depicts the layers and zones of the macula; the figure was created using images that were posted online by the Cleveland Clinic and Wikipedia.25,26
 |
Figure 1 Macula in human eye: layers, zones, and OCTA FOVs. |
Optical Coherence Tomography Angiography (OCTA)
In order to visualize the erythrocyte flow in the eye, OCTA uses interference between transmitted and reflected LASER beams, an ocular non-invasive vascular imaging approach.5,27 The OCTA 3D volume of axial cross sections is produced by a sequence of OCTA A-Scans, as seen in the blue cross sections of Figure 1. To find the blood flow, each A-Scan is performed multiple times at predetermined time intervals. The OCTA B-Scan, or “cube of OCTA A-Scans”, is created from the accumulation of all A-scans and allows the identification of many retinal illnesses.28 A frame-still of an A-Scan frame from the OCTA B-Scan is shown in (Figure 2A). Blood appears to be flowing as a bright white light.
 |
Figure 2 Examples of OCTA A-Scan frame (A) and the four typical projections from OptoVue OCTA machine for a normal subject (B–E): ILM-IPL projection (B), IPL-OPL projection (C), OPL-BM projection (D), and BM-+30µm projection (E). |
The 3×3mm and 6×6mm fields of view (FOV) are two options, as shown in Figure 1. The former was referred to as the 3M-OCTA and shows the vasculature at the fovea and parafovea areas, while the latter, which also shows the perifovea region, was referred to as the 6M-OCTA. Four projections of the choriocapillaris and choroid vasculature are produced by the OCTA device from the OCTA B-Scan: the ILM-IPL (superficial), IPL-OPL, OPL-BM, and BM+30µm.22–24,27 These projections demonstrate blood flow in macular slabs, enabling the diagnosis or follow-up of various eye illnesses.28,29 Depending on the predetermined FOV of the OCTA test, each projection is either 3×3mm or 6×6mm in size. Figure 2B–E displays instances of the four projections obtained from the OptoVue OCTA machine.
RTVue-XR (OptoVue, Canada), is a spectral domain OCTA device. The split-spectrum amplitude-decorrelation angiography (SSADA) algorithm is a specific computer program used by this OCTA device to detect, process, and display OCTA data. It uses a 70KHz LASER beam of 840nm wavelength. The spatial resolution of the OCTA images produced by 70,000 A-Scans per second is 5µm, 10µm, and 15µm for the axial axis, 3M-OCTA transversal axes, and 6M-OCTA transversal axes, respectively. This OCTA machine served as a source for all of the research subjects in this publication.
OCTA Dataset
From the OCTA-500 dataset version no. 1,29,30 which contains 200 3M OCTA (160 healthy and 40 abnormal subjects), a dataset of 129 subjects was obtained. The 129 subjects were all 3M-OCTA B-Scans, consisting of 90 normal cases and 39 abnormal ones (29 DR, 5 CNV, and 5 AMD instances). The decision was made based on the criterion that the 3M-OCTA B-Scan was obtained in a way that the macula layers appeared almost horizontal within the OCTA volume, as shown in Figures 2A and 3. It will be clarified in the following sections of the study why this criterion is so important for reaching the research goals. All 3M-OCTA subjects were acquired using the OptoVue OCTA machine, and the volume of the 3M OCTA B-Scan was 304x304x640px after bilinear interpolation.30 In other words, the 3M-OCTA B-Scan was composed of 304 A-scans, each of which encompassed a rectangular plane of OCTA information with the dimensions 304×640px, as shown in (Figure 2A). The 3M OCTA B-scan, therefore, exhibited a transversal resolution of 10µm (3mm/304≈10µm) and an axial resolution of 5µm (3mm/640≈5µm). Table 1 gives a description of the experimental dataset. The Institutional Human Subjects Committee gave its approval after the OCTA-500 subjects were recruited in accordance with the ethical research standards outlined in the Declaration of Helsinki.29,30 Therefore, there were no medical records in the 129 subjects except of being anonymous OCTA images along with their diagnosis only. The severity of all subjects is unknown. Research consent is not required by the Institutional Review Board at Isra University as there are no human or animal volunteers involved in this research.
 |
Table 1 Summary of the Experimental Dataset |
 |
Figure 3 Method block diagram for generating OCTA graphs from OCTA scans and the BVAI graph of 90 normalsubjects. |
Al-Hinnawi et al suggested the idea of “slice top-to-Bottom” the OCTA data in the OCTA B-Scan cube in order to reconstruct and visualize the macula coronal views (MCVs) of the capillary network.31,32 Twenty instances from the OCTA-500 dataset were used in the investigation. The trials produced a renovated OCTA cube with the dimensions 640x304x304px, which is known as the OCTA MCV volume (Table 1). The Supplemental Video, named “Example of 640 OCTA MCVs (#10323 Normal)”, provides an illustration. The resulting OCTA volume specifically consisted of 640 MCVs, each of which is a square measuring 304×304px. As a result, the OptoVue OCTA machine’s axial resolution (5µm) became the MCV thickness (ie each MCV shows the macula vasculature in a 5µm macula thickness). They stated that the resulting 640 5µm-thickness MCVs could help the ophthalmologist precisely visualize and then diagnose the 3D shape and 3D spread of any vasculature disease. Figure 4a shows a sample of one MCV out of the 640 MCVs of the subject in Figure 2A. All subjects in the research dataset were processed to produce the OCTA 3D volume (Table 1). The experimental dataset in this paper is deposited at IEEE Data Port,32 which is the same depository place of the previous publication in reference.31 The dataset is also deposited at Mendeley Data.33
 |
Figure 4 A sample macula coronal view (MCV) (a), segmented vessels (b), skeletonized vessels (c) for 28 years old female normal OD subject. |
Methods
The current state of OCTA machines lacks the provision of OCTA graphs depicting macula vasculature. This article presents a new technique that converts OCTA B-Scan data into OCTA plots, representing the vasculature through graphs or curves. By employing this innovative approach, three distinct OCTA graphs were successfully generated, applicable to any OCTA exam.
Figure 3 visually portrays the block diagram of the suggested method and highlights one of the resulting OCTA graphs, effectively showcasing the creative reflection of the OCTA signal at successive macula depths. The subsequent subsections expound upon the detailed steps involved in the processing, providing an in-depth understanding of the proposed methodology.
MCV Threshold and Skeleton
The capillary network in the 640 MCVs was segmented. A threshold of 10% of the greatest intensity found in each MCV was used for this procedure. As a result, the remaining MCV pixels are set to white, while all MCV pixels with values lower than 10% are set to black. In each frame of the 640 MCVs, this produced an MCV binary image that highlighted the blood vessels. An illustration of segmenting the image in Figure 4a is shown in Figure 4b. The segmented blood capillaries in all MCVs were then subjected to a skeleton procedure. A sample of the resulting skeleton is shown in Figure 4c (notice that Figure 4c depicts the skeleton of Figure 4b). Blood vessels of less than 5px were eliminated since they lacked useful measures (see the section after that). The connecting parts were then grouped, allowing each blood vessel to be identified by a different label. The placement of the MCV in the macula’s axial cross-section determines how many labels (or blood vessels) are present (red rectangular in Figure 1). For instance, the MCV in the IPL layer should result in more blood vessels than in the INL layer (Figures 2A and 3).
Blood Vessels Metrics
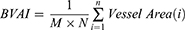
On the “binary” display of every blood vessel in each MCV, three suggestive metrics were derived. The three measurements are the Blood Vessels Area Index (BVAI), Blood Vessels Skeleton Index (BVSI), and Blood Vessels Tortuosity Index (BVTI). The segmented blood vessel image (Figure 4b) was used to calculate the BVAI, while the skeleton image (Figure 4c) was used to compute the BVSI and BVTI. The computation of these metrics is described by Equations 1 through 3.
Where:
BVAI: Blood vessel Area Index in one MCV
BVSI: Blood vessel Skeleton Index in one MCV
BVTI: Blood vessel Tortuosity Index in one MCV
M, N: the size of the MCV image, which is 304×304px in case of 3M OCTA
n: the number of vessels in one MCV
The sum of the pixels was used to calculate the vessel area and vessel skeleton, while Equation 4 was used to determine the vessel tortuosity. The Euclidean distance was determined using the coordinates of each vessel’s endpoints.

OCTA Biomarkers
The previous step was applied to all 640 MCVs in each subject. As a result, it was possible to “plot” an OCTA graph for each participant (ie an OCTA biomarker), indicating the tortuosity (BVTI) or plexiform density (BVAI and BVSI) of the blood vessels at various 5µm sections along the macula. Since each MCV represents a 5µm section in the macula, the novel OCTA biomarker would define the blood vessel throughout the whole macula’s histology. Thus, for each subject, OCTA BVAI, BVSI, and BVTI graphs (ie, three OCTA biomarkers) were created. For instance, the OCTA curve in Figure 4 shows the typical average shape of the OCTA BVAI graphs for the 90 normal subjects.
All processes were implemented in the MATLAB platform 2019a. The MATLAB code is added as a Supplement File. The results were generated using EXCEL Office 2019. They are attached as Supplementary Files demonstrating the results in detail. A personal computer (laptop PC) was used in all experiments, the PC’s main specifications are Intel®_CoreTM i7-6500U [email protected], 2 Core(s), 4 Logical Processor(s), 64 bits, and 8.00 GB RAM.
Results
The method was applied to all Macula Coronal Views (MCVs) in both normal (90 subjects) and abnormal (39 subjects) OCTA scans. Since all subjects have the same number of 640 MCVs, the mean value of each index (ie BVAI, BVSI, and BVTI) was calculated for the same MCV order in all subjects, according to their OCTA diagnosis as being normal, AMD, CNV, or DR. Values of the derived mean index are then plotted against their corresponding MCV sequential order. Figure 5 shows the resulting three OCTA graphs (ie OCTA BVAI, BVSI, and BVTI). Each OCTA graph shows the diffusion of blood vessels at various 5µm points along the macula.
 |
Figure 5 The resulting BVAI, BVSI, and BVTI OCTA graphs of the 90 normal, 5 AMD, 5 CNV, and 29 DR subjects derived from original OCTA B-Scans, the OCTA BVAI graph (A), the OCTA BVSI graph (B), the OCTA BVTI graph (C). |
The green curves in Figures 5A–C represent the average graph of the BVAI, BVSI, and BVTI from 90 healthy OCTA subjects. Whereas the dashed black, red, and blue curves, respectively, show the average graph from the 5 AMD, 5 CNV, and 29 DR subjects. Recalling that the MCV order reflects the “sequential 5µm depths” of the macula’s histology is noteworthy. The resulting OCTA graphs show that neither the start nor stop of the 5µm MCVs had any OCTA signals. These are locations that present no macula. In contrast, it was observed that all OCTA graphs exhibited a general increase as the MCV traversed and captured the vasculature at sequential depths within the macula. This observation is expected to be due to the oval shape of the macula, which results in a varying extent of blood vessel presence, reflecting the tortuosity (BVTI) or density (BVAI and BVSI) of the capillary network. As a result, the OCTA scan is now converted into OCTA graphs, which is the key finding in this paper. Two peaks were produced for the macula region, as shown in Figure 5, which stand in for the SVC and DVC (two plexiform blood arteries). The first peak corresponds to the SVC in the NFL and IPL layers, and the second peak to the DVC in the OPL layer, as explained in Figure 4. The first peak must have contained the GC. In contrast, the INL was seen as a valley in between the two crests. The graph’s two extremities were occupied by the ILM and BC films of the macula. The choroid region, which is located after the BC layer, is also included at the conclusion of the graphs. A difference can be seen when contrasting the graphs from normal and atypical subjects. Consequently, the second finding of this study is that these OCTA graphs can be generated to possibly distinguish between normal and abnormal patients, and they may be useful as an addition to the current ophthalmic displays used during OCTA examinations. The discussion section further explains these new OCTA graphs and their association to macula histology. Additionally, from Figure 5, the arithmetic differences between the OCTA graphs of normal and abnormal subjects were calculated. The mean, standard deviation (SD or STDEV), and mean ± 1.96 SD (ie upper and lower limits of differences) were deduced. The averages of normal and abnormal OCTA graphs were also calculated and then the mean averages was inferred. After that, these calculations were plotted according to the order of MCV’s sequence. Figure 6 and Table 2 illustrates the results, and they support previous observational findings from Figure 5.
 |
Table 2 The Calculations of Averages and Differences of Normal and Abnormal OCTA Graphs in Figure 5 |
 |
Figure 6 The averages and differences between the OCTA BVAI graphs (A), the averages and differences between the OCTA BVSI graphs (B), and the averages and differences between the OCTA BVTI graphs (C). |
Figures 5 and 6 demonstrate only the shape of the resulting graphs, which are considered as observational results. In order to perform a statistical analysis, the mean of each OCTA graph for each individual (n=129) was therefore determined. The statistical significance of the differences between the means of the normal and abnormal BVAI, BVSI, and BVTI OCTA graphs was then determined, as shown in Tables 3 and Table 4. Table 4 displays the analysis’s findings using the non-parametric Mann–Whitney Test under the presumption that the normal and pathological OCTA graphs have equal means, while Table 3 displays the findings using the parametric T-Test (two-tailed test of two samples with unequal variances). The difference between the 90 healthy and 39 abnormal participants was statistically significant (ie, a p-value much lower than 0.001) according to the T-Test. The Mann Whitney test, however, revealed only a substantial difference between the 29 DR and the 90 healthy subjects. There was no significant difference between the 5 AMD and 5 CNV on one side and the 90 healthy on the other. The Supplemental EXCELL Files include detailed presentations of all these outcomes. They statistically support the observational findings in Figures 5 and 6.
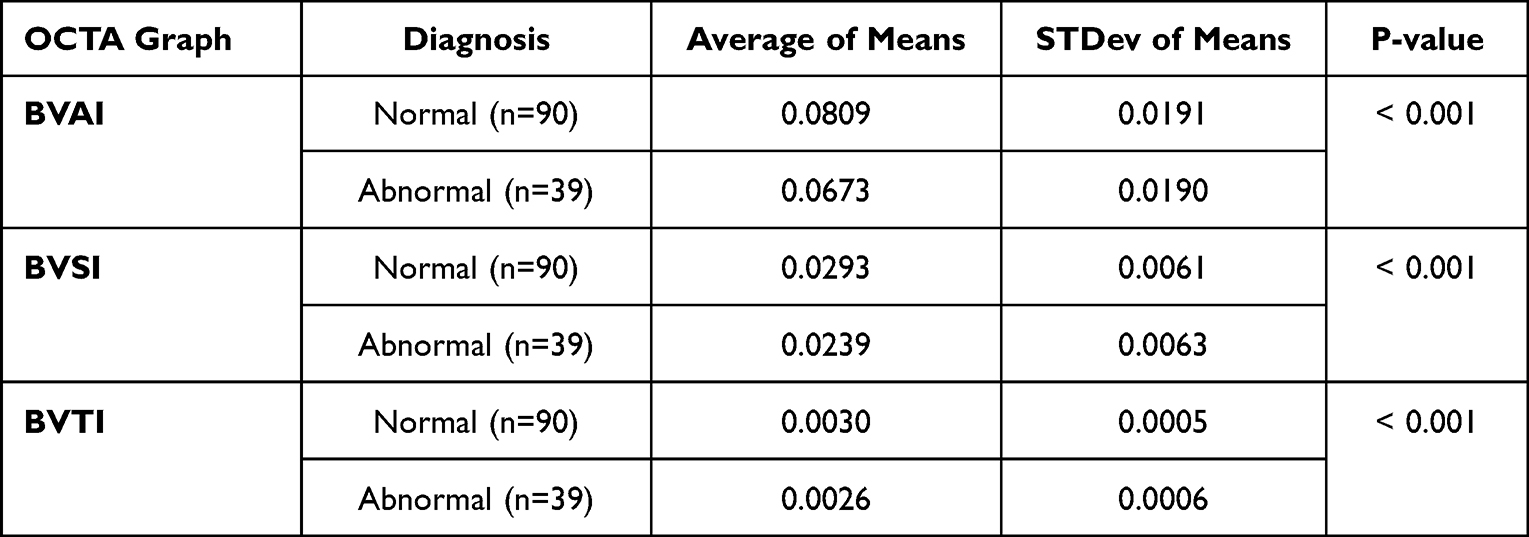 |
Table 3 The T-Test Statistical Comparison Between the Means of 90 Normal and 39 Abnormal BVAI, BVSI, and BVTI OCTA Graphs |
 |
Table 4 The Mann–Whitney Non-Parametric Statistical Comparison Between the Means of the 90 Normal and the 29 DR, 5 AMD, and 5 CNV Abnormal BVAI, BVSI, and BVTI OCTA Graphs |
Discussion
To the best of our knowledge, this study represents the first endeavor to visualize the macula vasculature through plotting the OCTA B-Scan data (Figure 4). The method successfully generated three new OCTA graphs of the macula’s SVC and DVC as shown in Figure 5 suggesting two novel insights with futuristic advantages. First insight, the main contribution of the paper, is the success in transforming the OCTA B-Scan into new OCTA informatics in the form of a new OCTA graph. This points to a clinically suggestive advantage in determining OCTA prognosis. For example, the OCTA graphs can be recorded in the OCTA clinic during the follow-up to observe the progress in the patient’s treatment plan. Also, it might be of value in the evaluation of disease severity. However, this requires further clinical validation studies of these new biomarkers.
On the other hand, the BVAI and BVSI graphs (top two charts in Figure 5) distinctly depicted the SVC and DVC as two separate distributions. They provided evidence of the incidence of vascular dropout in the SVC, DVC, or both. In contrast, the BVTI graph (bottom chart in Figure 5) monitored how much the capillaries were twisted or warped in the SVC and DVC. Therefore, the second insight from this paper is this: the OCTA graphs in Figure 5 show the probability to detect the incidence of macula vasculature disorders such as AMD, DR, and CNV.
The statistical analysis in Table 3 shows that there is a statistical significance (ie p-value<0.001) in the shape of the OCTA graphs between the normal (n=90) and abnormal (n=39) subjects. Table 4 shows that there is no significant difference between the CNV and AMD subjects in one side and the healthy subjects. This can be attributed directly to the very small size of the AMD and CNV subjects (ie n=5) and to the fact that the severity of subjects is unknown, which was previously explained in the material section and later raised as one of the future clinical issues requiring further studies. However, Table 4 also shows that the u-test yielded statistical significance between the 90 normal subjects and the 29 DR. Consequently, the proposed OCTA graphs imply futuristic advantage that they suggest the probable potential to be used in OCTA clinics to observe the occurrence of disruption (ie dropout) in vasculature. For instance, they have the potential to be used as an “add-on” to the current OCTA displays during the eye’s diagnosis similarly to the RNFL biomarker.3 Although the clinical value of these findings is yet to be evaluated, quantifying and then plotting the vascular density and tortuosity from 5µm cross sections in the macular region might be of value in diagnosing disease status and predicting functional outcomes; which will impact treatment decisions.
Figure 6 further supports the preceding findings. On the one hand, it is shown that the differences between normal and abnormal OCTA graphs follow the shape of the OCTA graphs in Figure 5. On the other hand, we show that the density difference values at the SVC and DVC can exceed the mean+1.96 SD (ie upper limit of the differences), indicating a sign of significance to observe macula vasculature disorders. The difference values at the SVC and DVC can record approximately up to 30% defect from their averages values, because of the occurrence of macula disorders. This is also proven in Table 2 which shows that the upper limits of the differences (Last Column) can record values similar to (in BVTI) or 50% defect (in BVAI and BVSI) from the mean of the averages value (Second Column). Therefore, Figure 6 sustains the insight of the potential of the new OCTA graphs to discern normal from abnormal OCTA subject, as previously deduced from Figure 5, Tables 3 and 4.
According to the macula histology in Table 1 in the reference,22 the ILM, NFL, GC, IPL, INL, OPL, ONL (including the inner and outer photoreceptor segments), and BC with the remaining layers have estimated thicknesses of 2.5µm, 18.4±6.4µm, 72.8±23.1µm, 36.9±8.9µm, 63.9±10.2µm, 62.7±21.3µm, 75.9±23.9µm, and 79.9±23.9µm, respectively. Other researchers, like the authors of the reference,23 also estimated approximate quantities. Accordingly, the macula’s SVC (ie NFL+GC+IPL) and DVC (OPL+ONL) are present in roughly 128.1±38.4µm and 138.6±45.2µm thickness, respectively. The macula is about 440±95.0µm thick overall.22 According to the method in this study, each MCV represents a thickness of 5µm, making a total of 640 MCVs equal to 3.2mm (ie 640×5µm=3.2mm), as demonstrated in Figure 4. Therefore, the OCTA graphs in Figure 5 can be translated as follows: there are approximately 0 to 220 MCVs (220×5µm=1.1mm), 221 to 440 MCVs (220×5µm=1.1mm), and 441 to 640 MCVs (200×5µm=1.0mm) for the outset macula, macula volume, and ending macula in the OCTA MCV cube. The oval shape of the macula makes the macula’s layers exist at approximately 1.1 mm from the axial axis in the OCTA B-Scan, as can be seen in Figure 4. Subsequently, there are roughly 220 MCVs (ie from ~220 to ~440 in Figure 5) presenting the macula layers. Despite the 129 subjects were all obtained from the OptoVue OCTA machine (840nm LASER beam, SSADA algorithm, 70,000 A-scans per second, axial resolution of 5µm, transversal resolution of 10 or 15µm, and A-scan depth of ∼3mm), it is anticipated that the method in Figure 4 can produce similar results from other vendors of OCTA machines.
In the literature, a number of OCTA biomarkers were investigated. The major category was examining the density of blood capillaries in terms of their perfusion, structure, and area.13–16,34–39 Another research area examined the measurement of blood vessel complexity using the following methods: calculating the vessels’ tortuosity, dividing the vessels’ skeleton over the area, dividing the vessels’ perimeter over the area, calculating the fractal dimension of the vessels’ distribution, and calculating the vessels’ branching point index.15,17–19,38,40–45 Despite the fact that all these studies successfully quantified vascular disruption, they either performed the measurements on the 2D OCTA slabs (like the examples in Figure 2) or on the entire 3D OCTA volume. Technically speaking, the 2D measurement approaches may include the claim that they were estimated from the superimposition (ie overlay) of several tens of micrometers to one 2D projection,5,12,28,32 not calculated on sequential axial 5µm MCVs as in this study. While 3D measuring techniques, however, have intrinsic difficulties when processing the entire 3D volume.12,15,37,38,46 Moreover, the results of these experiments are presented as OCTA quantities (ie, OCTA numerical representations), rather than OCTA chart representations of the capillary network at sequential 5µm macula depths as in this study. Studies of particular interest are those in references.24,47,48 The research team generated plots from OCTA B-scan as in this paper, revealing peaks corresponding to macula vascular histology. The method normalized the amplitude (ie intensity) of the OCTA signal by its logarithmic value and then set a condition to retain the decorrelation OCTA signals. The results show the possibility to plot the OCTA signal intensities coming from superficial and deep capillary plexuses in the macula. Whereas they plotted the OCTA signal intensities in relation to their axial position in the macula, this paper plotted the OCTA metrics relative to the axial position. In other words, while this paper proposes an image processing strategy, the results in references24,47,48 used methodology based on OCTA signal processing. Additionally, they performed the experiments on 3 OS and 6 OD subjects, while this paper experimented on 64 OS and 65 OD subjects. To conclude, technically, the method suggests a new strategy for achieving vasculature representation by applying the followings: 1-) generate the 5µm cross sections from the standard OCTA B-Scan, 2-) calculate macula vasculature measurements such as density and tortuosity on each cross-section frame, 3-) plot the OCTA graph representing the vasculature calculations at sequential 5µm depths, yielding new OCTA macula vasculature representation graphs. In contrast to 2D or 3D sampling and quantification presented in the literature, the method uses image processing strategies that utilize an entirely different philosophy.
There are three technical limitations, however, that require careful attention. First, as shown in Figures 1 and 4, the OCTA B-Scan must be “perfectly” centered in the fovea and constructed in such a way that the macula layers appear “perfectly” horizontal in the OCTA 3D volume. From a clinical perspective, this matter lies within the purview of medical professionals and clinicians who are integrating this system into their daily practice. Neglecting this aspect could lead to misalignment of macula layers, consequently causing MCVs to traverse multiple macula layers inaccurately, ultimately yielding imprecise OCTA graphs. Although the science of digital image processing can suggest solutions such as the rotation or re-registration of the 3D volume in the OCTA B-Scan, this would have technical arguments and would require dedicated research from the technical and clinical points of view. The second constraint is an important observation that arises from the presented OCTA graphs in Figure 5. In this depiction, the capillaries within the Nerve Fiber Layer (NFL) and Inner Plexiform Layer (IPL) are collectively represented in the initial peak. A more advantageous approach would have entailed their distinct presentation, as separating them could offer a more nuanced and detailed depiction of these layers in the OCTA graphs. The 129 subjects were all resized (OCTA-500 version 1) to 304×304×640px,30 which indirectly contributes to this constraint. The raw OCTA signals may have been slightly hampered by the resizing (ie linear interpolation) process. However, this matter is directly related to the OCTA B-Scan axial resolution. Therefore, we anticipate that acquiring the OCTA exams at better axial resolution than 5µm (ie less than 5µm) and processing the original OCTA B-Scan data (ie not the resized) may address this matter. The third constraint, the second peak (ie blood vessel density at DVC) appeared larger than the first peak (ie blood vessel density at SVC). This can be attributed to the OCTA artifact that the shadow of some of the large superficial blood vessels at SVC appears in the DVC as well.5,28 Removing this artifact would improve the precise representation of the DVC. Finally, if the test/re-test is another matter of importance, it is anticipated that the proposed strategy would yield approximately same graph as long as the same OCTA device, OCTA examination settings, and ‘almost’ same FOV were applied.
Following a comprehensive review of the preceding technical considerations, it is evident that the method, ie, the generation of OCTA graphs from OCTA scans, warrants further investigation across three key dimensions for future studies. Firstly, it is imperative to recognize that the newly generated OCTA graphs primarily represent preclinical outcomes. As such, a critical area for future research lies in delineating their clinical interpretation and their practical applicability for OCTA practitioners. It is noteworthy that this particular facet was not encompassed within the predetermined research objectives of this paper, signifying an avenue ripe for exploration such as the role of the patients’ etiology, severity of disease, refractive error (adjustment of axial length), and finalize to which extent the OCTA graphs would supplement benefits to the current clinical findings from the OCTA longitudinal level. The second dimension of future inquiry revolves around the exploration of additional OCTA metrics beyond the BVAI (Binarized Vessel Area Index), BVSI (Binarized Vessel Skeletonized Index), and BVTI (Binarized Vessel Tortuosity Index). Exploring the potential of generating OCTA graphs from a wider array of OCTA measures holds the promise of unearthing supplementary insights that may prove invaluable. Thirdly, it is paramount to extend our research efforts to encompass the evaluation of this methodology using a more comprehensive dataset, involving a 6M OCTA B-Scan configuration. We anticipate that this expanded dataset, characterized by a larger field of view (FOV) encompassing the perifoveal region of the macula, may yield results that not only echo previous findings but also potentially offer improved OCTA graphs. This expansion of scope presents an enticing prospect for future exploration.
Conclusion
In conclusion, the current study unveils two significant findings. First and foremost, it successfully illustrates the generation of OCTA graphs from the OCTA B-Scan, offering innovative visual depictions of capillary plexus density concerning their axial position. These graphs distinctively delineate the Superficial Vascular Complex (SVC) and Deep Vascular Complex (DVC) as distinct distributions. Secondly, the findings disclose a statistically significant differentiation between normal and abnormal cases using the t-test analysis. The Mann–Whitney u-test yielded also significant difference but only between normal and DR subjects. This discovery implies that OCTA graphs hold the potential to aid in the diagnosis and prognosis of disorders affecting the capillary networks within the macula. However, it is imperative to acknowledge that the methodology mandates precise centering of the OCTA examination and assumes a horizontal orientation of the macula in the OCTA B-Scan. It is worth noting that these results primarily focus on technical aspects, and further research is needed to refine the presentation of OCTA graphics and ascertain their clinical utility.
Acknowledgments
The authors are thankful to the OCTA-500 dataset’s owners and the IEEE data portal’s administrators for making the dataset available to scholars and permitting us to download files from the dataset.
Disclosure
The authors report no conflicts of interest in this work.
References
1. Strimbu K, Tavel JA. What are biomarkers? Curr Opin HIV AIDS. 2010;5(6):463. doi:10.1097/COH.0b013e32833ed177
2. Bakken S. Informatics and Data Science Approaches Address Significant Public Health Problems. Oxford University Press; 2023:1009–1010.
3. Gutiérrez-Ezquerro R, Salinas Martínez EM, Vidal-Oliver L, et al. The thickness of the retinal nerve fiber layer (RNFL) as a biomarker in uveitis. Ocul Immunol Inflamm;2023. 1–7. doi:10.1080/09273948.2023.2220787
4. Bui BV, Downie LE, Lindsay RG. Optical Coherence Tomography: Seeing the Unseen. Wiley Publishing Asia Pty Ltd Melbourne; 2019:193–194.
5. Kashani AH, Chen C-L, Gahm JK, et al. Optical coherence tomography angiography: a comprehensive review of current methods and clinical applications. Prog Retin Eye Res. 2017;60:66–100. doi:10.1016/j.preteyeres.2017.07.002
6. Cuenca N, Ortuño-Lizarán I, Sánchez-Sáez X, et al. Interpretation of OCT and OCTA images from a histological approach: clinical and experimental implications. Prog Retin Eye Res. 2020;77:100828. doi:10.1016/j.preteyeres.2019.100828
7. Eldaly Z, Soliman W, Sharaf M, et al. Morphological characteristics of normal foveal avascular zone by optical coherence tomography angiography. J Ophthalmol. 2020;2020:6. doi:10.1155/2020/8281459
8. Mu H, Li R-S, Yin Z, et al. Value of optical coherence tomography measurement of macular thickness and optic disc parameters for glaucoma screening in patients with high myopia. World J Clin Cases. 2023;11(14):3187. doi:10.12998/wjcc.v11.i14.3187
9. Chang P-Y, Wang J-Y, Wang J-K, et al. Asymmetry analysis of optical coherence tomography angiography macular perfusion density measurements in preperimetric and perimetric glaucoma. Sci Rep. 2020;10(1):14781. doi:10.1038/s41598-020-71757-6
10. Zhao T, Laotaweerungsawat S, Chen Y, et al. Right versus left eye asymmetry of microvasculature in diabetes revealed by optical coherence tomography angiography. Sci Rep. 2023;13(1):9332. doi:10.1038/s41598-023-36058-8
11. Augustin AJ, Atorf J. The value of optical coherence tomography angiography (OCT-A) in neurological diseases. Diagnostics. 2022;12(2):468. doi:10.3390/diagnostics12020468
12. Yao X, Alam MN, Le D, et al. Quantitative optical coherence tomography angiography: a review. Exp Biol Med. 2020;245(4):301–312. doi:10.1177/1535370219899893
13. Gołębiewska J, Biała-Gosek K, Czeszyk A, et al. Optical coherence tomography angiography of superficial retinal vessel density and foveal avascular zone in myopic children. PLoS One. 2019;14(7):e0219785. doi:10.1371/journal.pone.0219785
14. Khodabandeh A, Shahraki K, Roohipoor R, et al. Quantitative measurement of vascular density and flow using optical coherence tomography angiography (OCTA) in patients with central retinal vein occlusion: can OCTA help in distinguishing ischemic from non-ischemic type? Int J Retina Vitr. 2018;4(1):1–11. doi:10.1186/s40942-018-0152-9
15. Untracht GR, Dikaios N, Durrani AK, et al. Pilot study of optical coherence tomography angiography-derived microvascular metrics in hands and feet of healthy and diabetic people. Sci Rep. 2023;13(1):1122. doi:10.1038/s41598-022-26871-y
16. You QS, Chan JCH, Ng ALK, et al. Macular vessel density measured with optical coherence tomography angiography and its associations in a large population-based study. Invest Ophthalmol Vis Sci. 2019;60(14):4830–4837. doi:10.1167/iovs.19-28137
17. Gao W, Lin P, Li B, et al. Quantitative assessment of textural features in the early detection of diabetic retinopathy with optical coherence tomography angiography. Photodiagnosis Photodyn Ther. 2023;41:103214. doi:10.1016/j.pdpdt.2022.103214
18. Magesan K, Gnanaraj R, Tojjar J, et al. Fractal analysis of the macular region in healthy eyes using swept-source optical coherence tomography angiography. Graefes Arch Clin Exp Ophthalmol. 2023;1–8.
19. Martelli F, Giacomozzi C. Tortuosity index calculations in retinal images: some criticalities arising from commonly used approaches. Information. 2021;12(11):466. doi:10.3390/info12110466
20. Jonas JB, Bourne RRA, White RA, et al. Visual impairment and blindness due to macular diseases globally: a systematic review and meta-analysis. Am J Ophthalmol. 2014;158(4):808–815. doi:10.1016/j.ajo.2014.06.012
21. Zhou M, Duan P-C, Liang J-H, et al. Geographic distributions of age-related macular degeneration incidence: a systematic review and meta-analysis. Br J Ophthalmol. 2021;105(10):1427–1434. doi:10.1136/bjophthalmol-2020-316820
22. Curcio CA, Messinger JD, Sloan KR, et al. Human chorioretinal layer thicknesses measured in macula-wide, high-resolution histologic sections. Invest Ophthalmol Vis Sci. 2011;52(7):3943–3954. doi:10.1167/iovs.10-6377
23. Wang Q, AbouSamra A, Helaly HA, et al. Thickness of individual layers at the macula and associated factors: the Beijing Eye Study 2011. BMC Ophthalmol. 2020;20(1):1–11. doi:10.1186/s12886-019-1277-9
24. Campbell J, Zhang M, Hwang TS, et al. Detailed vascular anatomy of the human retina by projection-resolved optical coherence tomography angiography. Sci Rep. 2017;7(1):42201. doi:10.1038/srep42201
25. Clinic, C. Macula. 2022; Available from: https://my.clevelandclinic.org/health/body/23185-macula.
26. Wikipedia. Macula; 2023. Available from: https://en.wikipedia.org/wiki/Macula.
27. Mohammadi S, Gouravani M, Salehi MA, et al. Optical coherence tomography angiography measurements in multiple sclerosis: a systematic review and meta-analysis. J Neuroinflammation. 2023;20(1):85. doi:10.1186/s12974-023-02763-4
28. Ferrara D, Waheed NK, Duker JS. Investigating the choriocapillaris and choroidal vasculature with new optical coherence tomography technologies. Prog Retin Eye Res. 2016;52:130–155. doi:10.1016/j.preteyeres.2015.10.002
29. Li M, Chen Y, Ji Z, et al. Image projection network: 3D to 2D image segmentation in OCTA images. IEEE Trans Med Imaging. 2020;39(11):3343–3354. doi:10.1109/TMI.2020.2992244
30. Li M, Zhao J, Li M, et al. OCTA-500: a retinal dataset for optical coherence tomography angiography study. arXiv. 2020;2020:1.
31. Al-Hinnawi ARM. Reconstruction and VISUALIZATION OF 5µM SECTIONAL CORONAL VIEWS FOR MACULA VASCULATURE in OptoVue OCTA, in IEEEDataport. USA; 2023.
32. Al-Hinnawi A-RM, BaniMustafa A, Al-Latayfeh M, et al. Reconstruction and visualization of 5μm sectional coronal views for macula vasculature in OptoVue OCTA. IEEE Access. 2023;11:28280–28293. doi:10.1109/ACCESS.2023.3257720
33. Al-Hinnawi A-R. OCTA macula coronal views. Mendeley Data. 2023;1. doi:10.17632/p5h7x55zw7.1
34. Bartol-Puyal FDA, Isanta C, Calvo P, et al. Mapping of choriocapillaris vascular density in young and aged healthy subjects. Eur J Ophthalmol. 2022;32(5):2789–2800. doi:10.1177/11206721211067019
35. Pramil V, Levine ES, Waheed NK. Macular vessel density in diabetic retinopathy patients: how can we accurately measure and what can it tell us? Clin Ophthalmol. 2021;Volume 15:1517–1527. doi:10.2147/OPTH.S272328
36. Rabiolo A, Gelormini F, Sacconi R, et al. Comparison of methods to quantify macular and peripapillary vessel density in optical coherence tomography angiography. PLoS One. 2018;13(10):e0205773. doi:10.1371/journal.pone.0205773
37. Sarabi MS, Khansari MM, Zhang J, et al. 3D retinal vessel density mapping with OCT-angiography. IEEE J Biomed Health Inform. 2020;24(12):3466–3479. doi:10.1109/JBHI.2020.3023308
38. Sun Z, Yang D, Tang Z, et al. Optical coherence tomography angiography in diabetic retinopathy: an updated review. Eye. 2021;35(1):149–161. doi:10.1038/s41433-020-01233-y
39. Wei W, Zhang Q, Rayner SG, et al. Automated vessel diameter quantification and vessel tracing for OCT angiography. J Biophoton. 2020;13(12):e202000248. doi:10.1002/jbio.202000248
40. Abdelsalam MM, Zahran M. A novel approach of diabetic retinopathy early detection based on multifractal geometry analysis for OCTA macular images using support vector machine. IEEE Access. 2021;9:22844–22858. doi:10.1109/ACCESS.2021.3054743
41. Alam M, Le D, Lim JI, et al. Vascular complexity analysis in optical coherence tomography angiography of diabetic retinopathy. Retina. 2021;41(3):538–545. doi:10.1097/IAE.0000000000002874
42. Cheng KK, Oreská S, Špiritović M, et al. Macular vessel density, branching complexity and foveal avascular zone size in normal tension glaucoma. Sci Rep. 2021;11(1):1–9. doi:10.1038/s41598-020-79139-8
43. Liu J, Chen S, Xu Z, et al. Macular vascular complexity analysis of diabetes mellitus by swept-source optical coherence tomographic angiography. Ophthalmologica. 2023;245(6):538–545. doi:10.1159/000528073
44. Shi C, Chen Y, Kwapong WR, et al. Characterization by fractal dimension analysis of the retinal capillary network in Parkinson disease. Retina. 2020;40(8):1483–1491. doi:10.1097/IAE.0000000000002641
45. Xu Q, Sun H, Huang X, et al. Retinal microvascular metrics in untreated essential hypertensives using optical coherence tomography angiography. Graefes Arch Clin Exp Ophthalmol. 2021;259:395–403. doi:10.1007/s00417-020-04714-8
46. Zhang J, Qiao Y, Sarabi MS, et al. 3D shape modeling and analysis of retinal microvasculature in OCT-angiography images. IEEE Trans Med Imaging. 2019;39(5):1335–1346. doi:10.1109/TMI.2019.2948867
47. Hirano T, Chanwimol K, Weichsel J, et al. Distinct retinal capillary plexuses in normal eyes as observed in optical coherence tomography angiography axial profile analysis. Sci Rep. 2018;8(1):1–7. doi:10.1038/s41598-018-27536-5
48. Zhang M, Hwang TS, Campbell JP, et al. Projection-resolved optical coherence tomographic angiography. Biomed Opt Express. 2016;7(3):816–828. doi:10.1364/BOE.7.000816
 © 2023 The Author(s). This work is published and licensed by Dove Medical Press Limited. The
full terms of this license are available at https://www.dovepress.com/terms
and incorporate the Creative Commons Attribution
- Non Commercial (unported, 3.0) License.
By accessing the work you hereby accept the Terms. Non-commercial uses of the work are permitted
without any further permission from Dove Medical Press Limited, provided the work is properly
attributed. For permission for commercial use of this work, please see paragraphs 4.2 and 5 of our Terms.
© 2023 The Author(s). This work is published and licensed by Dove Medical Press Limited. The
full terms of this license are available at https://www.dovepress.com/terms
and incorporate the Creative Commons Attribution
- Non Commercial (unported, 3.0) License.
By accessing the work you hereby accept the Terms. Non-commercial uses of the work are permitted
without any further permission from Dove Medical Press Limited, provided the work is properly
attributed. For permission for commercial use of this work, please see paragraphs 4.2 and 5 of our Terms.