Back to Journals » OncoTargets and Therapy » Volume 9
Inhibitory effect of quercetin on epithelial to mesenchymal transition in SK-MEL-28 human melanoma cells defined by in vitro analysis on 3D collagen gels
Received 25 March 2016
Accepted for publication 11 July 2016
Published 19 October 2016 Volume 2016:9 Pages 6445—6459
DOI https://doi.org/10.2147/OTT.S109253
Checked for plagiarism Yes
Review by Single anonymous peer review
Peer reviewer comments 2
Editor who approved publication: Dr Faris Farassati
Dhairya H Patel,* Neeti Sharma*
Symbiosis School of Biomedical Sciences, Symbiosis International University, Gram – Lavale, Taluka – Mulshi, Pune, India
*These authors contributed equally to this work
Abstract: Considering the emerging concept of complementary and alternative medicine under the paucity of effective treatment for melanoma, we aimed to understand the effect of quercetin (Qu) on collagen I-induced epithelial–mesenchymal transition (EMT) in melanoma cells. To investigate the effect of Qu in melanoma cells, we used multiple methods, including real-time reverse transcription polymerase chain reaction, migration assay, and wound healing assay. We found that EMT was altered by Qu in melanoma cells. Qu-treated cells exhibited decreased migration and invasion activities. Mechanistically, a high expression of epithelial markers and a decrease in the expression of mesenchymal markers were found to be associated with reversal of EMT in melanoma cells. Time-dependent apoptosis was observed in Qu-treated melanoma cells, which was further confirmed by the upregulation in the protein levels of Caspase 3, a proapoptotic marker. Thus, our findings suggest Qu as a promising dietary compound under the new complementary and alternative medicine category of therapeutic drugs in the chemoprevention of melanoma.
Keywords: metastatic melanoma, epithelial to mesenchymal transition, quercetin, complementary and alternate medicine, chemoprevention
Introduction
Melanoma, once less considered, has gained a sheer alertness due to its increased mortality rate over the period of 50 years.1,2 Metastatic dissemination of invasive tumors leads to death from melanoma.3 Cutaneous melanoma originates from melanocytes, located in the epidermis at the basal layer, which produce melanin.4 The melanoma cells project potential events such as inadequate progression of maturation, which causes cytologic atypia and manifests expansile cellular growth by arresting cells in cell cycle, variable host immune response, and aberrant interaction with the dermal environment.5 Melanoma acquires cellular transformation and tumorigenesis through the metastatic cascade, which involves breaching of basement membrane barrier by epithelial–mesenchymal transition (EMT) along with extracellular matrix (ECM) remodeling (eg, proteinases MMP-9), dissociation of tumor cells, its invasion in the surrounding tissues, intravasation through blood or lymph vessels, extravasation of tumor cells arrested in the capillary bed, establishment of disseminated cells at the secondary site where they become capable of acquiring quiescence for a while, and finally outgrowth of micrometastases and macrometastases. However, a recent study states the presence of one more important step, named as premetastatic niche or step 0, which is created at the target site before the first tumor reaches the distinct location.6 Transition to metastatic tumor involves mechanism akin to EMT. Out of the three types of EMT known, the first two types, namely, type I and type II are involved in embryogenesis and fibrosis, respectively, whereas the EMT involved in tumor progression is termed as type III EMT.7 During EMT, the cells undergo three hallmark changes: first, epithelial cells gain mesenchymal markers (Vimentin); second, cytoskeleton modification occurs to obtain mesenchymal phenotypes; and third, they give up their polarity, adhesive nature, and epithelial markers (E-cadherin).8 BRAF somatic missense mutations in melanoma cells cause upregulation of Snail, an inducer of metastasis, by downregulating the three pathways, namely, MAPK, NF-κB, and PI3K/AKT pathways, and hence tremendously induces EMT; ~66% of malignant melanoma shows such mutations.3 Repression in an important cell adhesion molecule, E-cadherin, by Snail induces metastasis.9 Such EMT-like mechanisms can also be induced by external signals such as collagen I, an ECM molecule.10 α2β1 integrin and DDR1, the two receptors of collagen I, promote the downstream pathways that collectively upregulate N-cadherin expression,11 and hence, collagen I increases invasiveness in melanoma cells, suggesting its possible application in understanding type III EMT. Once the cells undergo such metastatic cascade, the disease becomes incurable and chemotherapeutic drugs prove futile to stop the progression of the disease and the patient experiences long-term side effects. In such cases, chemoprevention concept is emphasized to prevent, inhibit, or reverse carcinogenesis by using natural health products as complementary and alternative medicines (CAMs).12 Evidence shows that a high consumption of dietary compounds from fruits and vegetables is inversely correlated with the incidence of some cancers.13–15 Polyphenols, largely flavonoids, are the most explored dietary compounds because they are the basis of world diet and are potentially nontoxic molecules. One such flavonoid quercetin (Qu) has been reported to exert cancer-preventive effects such as antioxidant,16 antiproliferation,17 cell cycle arrest,18 and apoptotic activities,19,20 and hence it is also termed as chemopreventer.21 Natural food consumables such as vegetables (eg, onion), fruits (eg, apple), seeds, nuts, tea, and red wine substantially contain Qu.22,23 It has been observed that in nontransformed cells, Qu at a low concentration has little or no effect in inducing cell cycle arrest and/or causing apoptosis, but as the concentration becomes higher, it induces antiproliferative and proapoptotic effects.24 Dissimilarly, in cancer cells, Qu exerts the same antineoplastic effect at low concentrations; for example, Qu at the concentration of 3.5 μM induces anticancer effect in B16-BL6 murine melanoma cell line,25 thus proving its aptness as a CAM. The present study involves understanding the antigrowth and antimetastatic potential of Qu on highly metastatic human melanoma cells wherein collagen I was used as an inducer of EMT.
Materials and methods
Cell culture and Qu treatment
SK-MEL-28 human melanoma cell line purchased from the National Centre For Cell Science, Pune, India, was maintained in high glucose Dulbecco’s Modified Eagle’s Medium with 10% fetal bovine serum and additionally supplemented with 2 mM L-glutamine, 100 U/mL penicillin and l00 μg/mL streptomycin antibiotic solution, and 1.5 g/L sodium bicarbonate in humidified incubator at 37°C, 95% air, and 5% CO2 and grown as a monolayer in plastic tissue flasks, according to the recommendation of the American Type Culture Collection. SK-MEL-28 cell line under exponential growth phase was exposed to varying concentrations of Qu for varying periods of time depending upon the experimental requirement. Subdued lighting was used in all experimental protocol related to the drug so as to prevent photoisomerization.
Collagen I-coated wells preparation
Collagen I stock solution of 3.0 mg/mL was diluted to 50.0 μg/mL with sterile 1× phosphate-buffered saline (PBS) on ice. For collagen I coating, a monolayer of diluted collagen I solution was applied to the 100 mm plastic dishes, 18 mm cover slips, 96-well plates, and 12-well plates under sterile condition and allowed to settle for 3–4 hours in a laminar hood followed by 24 hours of incubation at 37°C for the polymerization of the gel. After a fine layer of collagen I coat was formed, the cells were directly seeded on it.
3-(4,5-Dimethylthiazol-2-yl)-2,5-diphenyltetrazolium bromide assay
SK-MEL-28 cells in log phase were trypsinized using trypsin/ethylenediaminetetraacetic acid solution, and the cell pellet was resuspended in a fresh 1 mL of complete Dulbecco’s Modified Eagle’s Medium. In all, 1.0×10⁴ cells/well were seeded in 96-well plates and were placed in a CO2 incubator for 24 hours. The next day, the cells were exposed to varied concentrations of Qu (5–70 μM). Following 24 hours of incubation, the medium containing Qu was discarded and 3-(4,5-dimethylthiazol-2-yl)-2,5-diphenyltetrazolium bromide (MTT) assay was performed to determine the half maximal inhibitory concentration (IC50) value for Qu. Briefly, the medium containing Qu was discarded followed by addition of 50 μL of 1 mg/mL MTT in the treatment wells. The culture plate was incubated in a CO2 incubator (dark condition) for 3–4 hours until a purple precipitate was visible. The formazan crystals were solubilized using 0.1 N acidified isopropanol (isopropanol + HCl) by thoroughly mixing the cell suspension. The plate was read on an enzyme-linked immunosorbent assay microplate reader at 570 nm.
Morphology assay
Morphology on different matrices
In all, 1.0×10⁴ SK-MEL-28 cells were seeded on cover slips containing plastic and collagen I matrices in a 35 mm culture plate, and cell morphology was observed at different time intervals up to 48 hours under a light microscope and imaged. Subsequently, the cells treated with 50 μM Qu concentration were also visualized to observe the morphological changes and imaged at the same time interval as that of control cells. Morphology was compared between collagen I and/or Qu-treated and Qu-untreated cells along with plastic and/or Qu-treated and Qu-untreated cells.
Change in morphology
A total of 1.0×10⁴ cells/well were seeded in 96-well plates on collagen I-coated matrix to observe the morphological difference of cells due to change in matrices and to check if the morphology of the cells coated on collagen I matrix was reversible. After 48 hours of incubation of cells in serum-containing medium, a confluent monolayer of cells on the collagen I-coated matrix was partially removed, by using a sterile 20 μL pipette tip, to expose SK-MEL-28 cells to the plastic matrix. The cells were allowed to grow again, and the images were captured at several time intervals to observe the change in the morphology of the cells due to change in matrices.
Cell proliferation assay
SK-MEL-28 cells growing logarithmically were seeded in 96-well plates on both plastic and collagen I-coated matrices at the density of 1.0×10⁴ cells/well. In all, 24 hours post-incubation in a CO2 incubator at a standard temperature, Qu treatment (50 μM) was given for 24 hours and 48 hours. Following the treatment, the medium containing Qu was discarded and cell proliferation rate was measured using MTT assay as described earlier. The % proliferation graph was plotted for both the matrices. The experiment was repeated in triplicates.
Cell adhesion assay
The adhesion property of SK-MEL-28 cells cultured on plastic and collagen I-coated matrices was compared by seeding 2.0×10⁵ cells/well in 24-well plates. Following 3 hours of incubation in a CO2 incubator, the medium was discarded and the cells were given a gentle wash with sterile 1× PBS to remove the unattached cells from the wells. Following this, the attached cells on matrices were imaged and the number of attached cells was counted on nine fields in each matrix. A graph was plotted between the number of attached cells per field against plastic and collagen I-coated matrices.
In vitro wound healing migration assay
Logarithmically growing SK-MEL-28 cells were plated in plastic and collagen I-coated 12-well plates at a density of 2.0×10⁵ cells/well until confluent, in order to evaluate the changes in the migratory behavior of cells due to collagen I and Qu. A continuous monolayer was allowed to be formed in the wells. After a monolayer was obtained, cells were serum starved overnight. The next day, the monolayer was wounded by manual scratching using a sterile 20 μL pipette tip, the cellular debris was removed by giving a gentle wash with complete medium to obtain a cellular line per well, and fresh medium was added, which served as the negative control. The medium containing Qu (50 μM) was added to the cells of the treatment group, which served as the positive control. Photographs were taken at 0 hour for both the groups at 10× magnification using a light microscope. Then, cells were incubated at a standard condition, and images of the scratch part were captured at regular intervals until complete migration was observed in the denuded area. Three spots were considered on the two parallel lines, and the distance between them was measured in the images at 0 hour, 24 hours, and 48 hours to calculate the % migration rate of cells for both plastic and collagen I-coated matrices, using the formula:26
|
In vitro chemotactic invasion assay
The influence of the chemotactic invasion property of collagen I as an ECM protein on the metastatic behavior of SK-MEL-28 cells was studied on agarose spots. In all, 15 mg of low melting point agarose was mixed with 3 mL of 1× PBS to make 0.5% of agarose solution. The solution was heated in the cell culture hood until boiling to facilitate dissolution. The solution was cooled to 40°C, and immediately 90 μL of agarose solution was pipetted out and 10 μL of PBS with and without collagen I was added. Sterile cover slips were placed in three 35 mm glass-bottomed culture dishes, and three spots of agarose (10 μL each) were placed on each cover slip for each experimental setup. Three experimental setups were prepared: one set containing agarose and PBS spots, second set containing agarose and collagen I spots, and third set containing agarose and collagen I with Qu spots. The spots were cooled at 4°C for 5 minutes and transferred to a 35 mm culture dish where SK-MEL-28 cells were seeded in the presence of complete medium. The culture dishes were then incubated for 24 hours in a CO2 incubator, and the spots were checked for the occurrence of invasion of cells into the spots. Images were captured by a light microscope, and based on that, the number of migratory cells in spots and the distance that the cells traveled through the spots were calculated for all the three experimental conditions and graphs were plotted for the same. An average of nine spots for each experimental condition was considered.27
Real-time reverse transcription polymerase chain reaction
A total of 2.0×10⁵ cells/well were seeded in 24-well plates. Qu treatment was given to the cells for 24 hours and 48 hours. Following treatment, TRIzol reagent was used to extract total RNA. RNA samples were quantified using NanoDrop spectrophotometer ND 2000 (Thermo Fisher Scientific, Waltham, MA, USA). RNA concentration used for reverse transcription was 2 μg/20 μL. cDNA was synthesized following manufacturer’s instructions of High-Capacity cDNA Reverse Transcriptase kit. Sealed 96-well polymerase chain reaction (PCR) plates were used to perform real-time PCR on cDNA samples prepared along with SYBR Green™ PCR Master Mix. The samples were analyzed using StepOnePlus™ Real-Time PCR System (Thermo Fisher Scientific). The ΔΔCt method was used to calculate the relative fold change of the transcript.28 Glyceraldehyde-3-phosphate dehydrogenase was considered as the endogenous expression standard.
Cell cycle analysis by flow cytometry
In all, 1.0×10⁶ cells were synchronized in 100 mm culture dishes by blocking their metabolic reaction. Cells were nutritionally deprived for 24 hours by eliminating serum from their culture medium. Following serum starvation, the cells were treated with Qu (50 μM), in the presence of complete medium, for 24 hours and 48 hours. Following treatment, adherent and floating cells were collected together through trypsinization and centrifuged to pellet down the cells. The cell pellet was washed with ice-cold 1× PBS, fixed with 0.2 mL of chilled 70% ethanol, and incubated for a minimum of 45 minutes at −80°C. The cells were rehydrated by discarding ethanol and resuspending in 0.2 mL of ice-cold 1× PBS. The cells were treated with 50 μL of RNase A (100 μg/mL) for 30 minutes at room temperature. After RNase A treatment, 450 μL of propidium iodide (PI; 50 μg/mL) was added and the cells were incubated for 1 hour at room temperature in the dark and the stained cell samples were analyzed using FACSCalibur™ flow cytometer (Becton Dickinson, San Jose, CA, USA). G0/G1, S, and G2/M phase populations were quantified using Cell Quest Pro software (BD Biosciences, USA). A total of 10,000 events were assessed.
Apoptosis induced by Qu
Caspases belong to cysteine proteases family and are the common downstream effectors of apoptosis; hence, they mediate cell death.29 The Caspase 3 colorimetric assay was performed to check the caspase-mediated apoptosis induced on SK-MEL-28 cells by Qu. Cells in the log phase were seeded as per 1.0×10⁶ cells/flask and incubated for 24 hours in a CO2 incubator at 37°C followed by Qu treatment (50 μM) for 24 hours and 48 hours. After treatment, cells were lysed using lysis buffer and cell lysate was transferred to flat-bottomed 96-well plates and incubated with Ac-DEVD-p-nitroaniline, a Caspase 3 peptide substrate for 2 hours at 37°C. Caspase 3 activity was measured at 405 nm in a microplate reader as per manufacturer’s instructions.
To confirm that Qu has proapoptotic potential, Annexin V-fluorescein isothiocyanate (FITC)/PI double-stained SK-MEL-28 melanoma cells were analyzed by a flow cytometer. About 1.0×10⁶ cells/flask were seeded and treated with Qu. Posttreatment, all the cells (floating and adherent) were collected together in staining tubes. After giving a PBS wash, the cells were resuspended in 1× Annexin-binding buffer. To each 100 μL of cell suspension, 5 μL of Annexin V-FITC and 1 μL of PI (100 μg/mL) were added according to manufacturer’s instructions and the cells were incubated at 37°C for 15 minutes. In all, 400 μL of 1× Annexin-binding buffer was used to dilute the cells and they were immediately analyzed by flow cytometry for fluorescence emission at 530 nm (FL1) and >570 nm (FL2). Totally, 10,000 events were assessed.
Statistical analysis
All experiments were performed in triplicates. Data were expressed as mean ± standard error of the mean. Statistical analyses were performed using Student’s t-test for comparison between treatment values and control values using Sigma plot 13.0 (SYSTAT software Inc., CA, USA). P<0.05 was considered to be statistically significant. The significance level was defined as *P<0.05, **P<0.01, and ***P<0.001.
Results
Determination of IC50
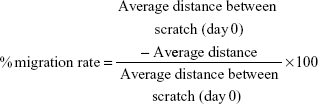
The cytotoxic effect of Qu was checked on SK-MEL-28 cells. Cell viability was determined by incubating cells with various concentrations of Qu (0–70 μM), and MTT assay was performed. In all, 24 hours post-incubation with Qu, the IC50 value obtained for SK-MEL-28 cells was 50 μM, the concentration at which the cell survival rate was reduced to 49.88% as correlated to the control population. Cytotoxicity to cells was reported at the concentration >60 μM. A dose-dependent decline in cell viability was detected (Figure 1), thus suggesting that Qu has dose-dependent inhibitory effects on cell viability of SK-MEL-28 cells (n=3; P<0.05).
 | Figure 1 Dose-dependent effect of Qu on SK-MEL-28 cell viability. |
Morphology assay
Morphology on different matrices
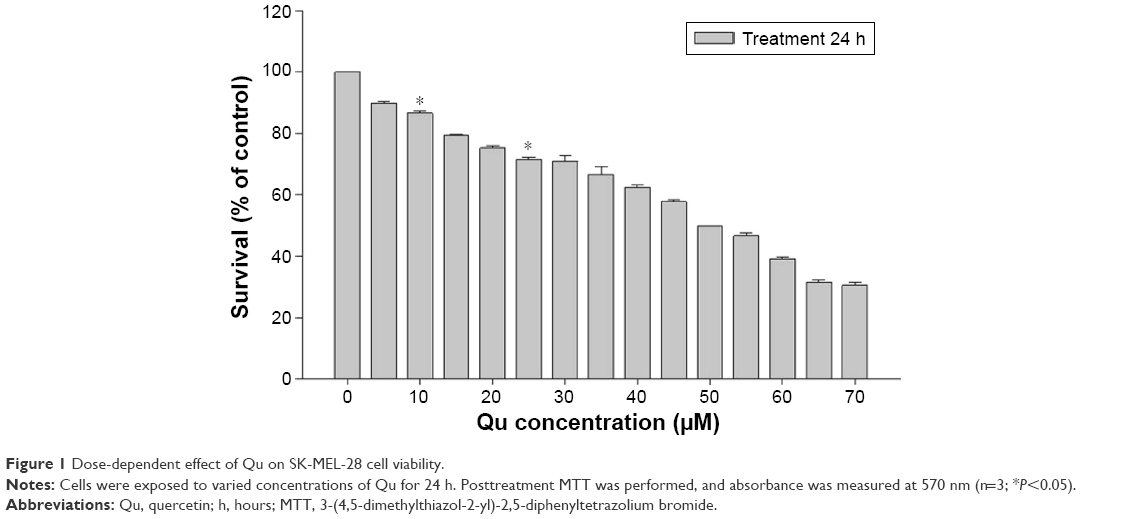
The morphological variance of SK-MEL-28 cells was observed on plastic and collagen I-coated matrices along with Qu treatment under standard conditions. The cells cultured on different matrices for 48 hours were imaged (20× magnification) at regular intervals. The imaged photographs showed the difference in morphology of cells on different matrices. As shown in figure 2Ai–iii, cells growing under the influence of collagen I matrix displayed a prominent feature of EMT by forming scattered and meshwork-like morphology, which has not been previously described for SK-MEL-28 cells. Upon Qu treatment at 24 and 48 hours, the cells seeded on collagen I matrix displayed apoptotic bodies (Figure 2Aiv–vi). However, cells seeded on the plastic matrix showed polygonal morphology, attributed to its nature under normal conditions (Figure 2Avii–ix). When these cells were exposed to the Qu for 24 and 48 hours, they exhibited circular distorted morphology (Figure 2Ax–xii). Overall, in both plastic and collagen I matrices, after 24 hours, with increase in treatment time, the cells lost their adherence properties, and floating cellular debris was observed in the medium, indicating occurrence of apoptosis in the cells; after 48 hours of treatment, the cells displayed morphological changes, characteristics of apoptosis, such as blebbing and reduction in cell volume and an increase in apoptotic bodies. Hence, Qu was observed to exert a time-dependent apoptotic effect. To understand if the morphological changes observed on collagen I matrix were reversible, the collagen I coat was partially removed from the 96-well plates and the cells were allowed to grow until confluence was achieved. It was observed that the meshwork of cells as grown on collagen I matrix (Figure 2Bi) when later exposed to the plastic matrix (Figure 2Bii) reverted to its normal polygonal morphology (Figure 2Biii and iv) and grew similarly to the cells on the plastic matrix (Figure 2Bv and vi). The images were captured after certain time intervals, which show cohesive cells grown in the scratched area surrounded by cell aggregate, hence indicating that collagen I acts as an inducer of EMT (n=3).
 | Figure 2 Collagen I and Qu influenced the normal morphology of SK-MEL-28 cells. |
Cell proliferation assay
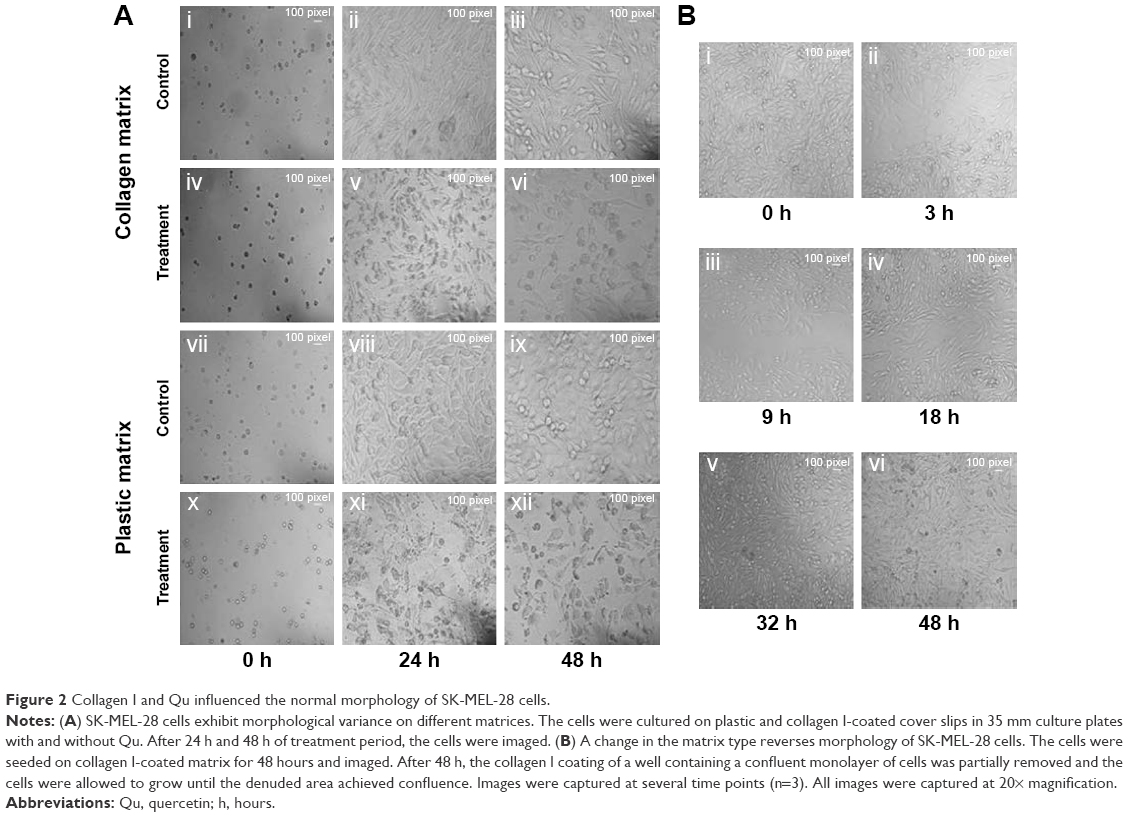
SK-MEL-28 melanoma cells were treated with both plastic and collagen I-coated matrices to evaluate its antiproliferative effect, and the results were analyzed using MTT assay. After 24 hours and 48 hours of treatment, MTT assay was performed as mentioned earlier and the graph of % proliferation in comparison to the control cells was plotted (Figure 3A). The graph depicts that the proliferation rate of the cells was remarkably reduced to 66.18% and 52.15% in the cases of collagen I-coated matrix and plastic matrix, respectively, post-24 hours of treatment. In the case of 48 hours of treatment, the reduction in the proliferation rate of cells was observed to be 26.30% and 21.81% for collagen I-coated matrix and plastic matrix, respectively, hence proving the antiproliferative activity of Qu in a time-dependent manner. The data collectively showed that regardless of an enhancement in the proliferation rate of SK-MEK-28 cells due to collagen I, Qu could ablate proliferation of cells.
 | Figure 3 (A) Effect of collagen I and Qu on SK-MEL-28 cell proliferation. The cells cultured on both the matrices were treated with 50 μM Qu for 24 h and 48 h, and MTT was performed. Statistical significance for all comparisons is indicated by asterisks (n=3; ***P<0.001, *P<0.05). (B) The cell growth is independent of cell adhesion property on different matrices. The cells were seeded on plastic and collagen I-coated matrices. After 3 hours of seeding, the cells were gently washed with 1× PBS. The images were captured, and the number of attached cells was counted per field (n=9). |
Cell adhesion assay
To understand if the alteration of matrices intervenes with the difference in the proliferation rate of SK-MEL-28 cells due to variance in their adhesion property on both collagen I and plastic matrices, the adhesion property of the cells was determined in 24-well plates. After three hours of incubation, the medium was discarded followed by removal of unattached cells by gentle wash with 1× PBS. Cell images were captured in nine different fields, and the attached cells were counted under microscope for both the matrices, ie, plastic and collagen I, and the graph of attached cells/field was plotted for each matrix. It was observed that the cells did not exhibit any significant difference in adhesion efficiency in different matrices, which could account for the different proliferation rates (Figure 3B). Therefore, the growth modulation of SK-MEL-28 cells on both the matrices is independent of their adhesion properties (n=9).
In vitro wound healing migration assay
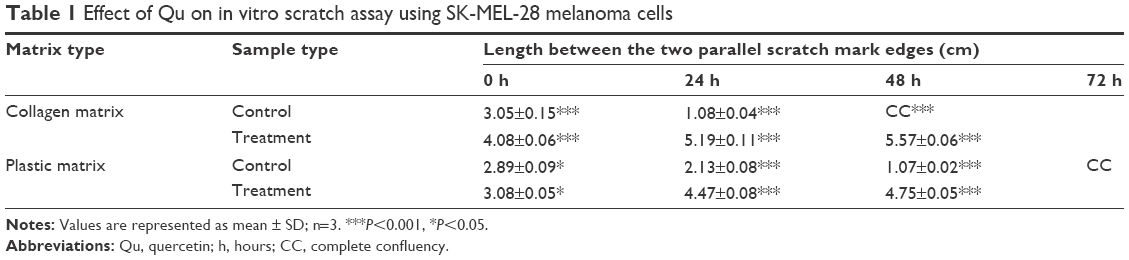
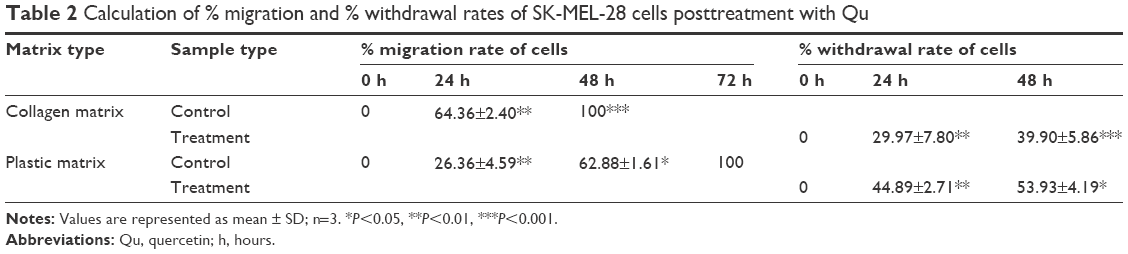
The migration potential of SK-MEL-28 cells was evaluated after intervention with Qu and collagen I. It was observed that the cells seeded on collagen I-coated matrix took 48 hours to achieve 100% confluence (Figure 4Ai–iii), while at the same time on the plastic matrix the cells were loosely closed (Figure 4Bi–iii). However, at 72 hours, the cells completely covered the denuded area (data not shown). The presence of collagen I caused faster migration of SK-MEL-28 across the matrix as compared to the plastic matrix, which indicates that the migration rate of SK-MEL-28 cells was induced by collagen I. The length between the two parallel scratch mark edges (Table 1) on the collagen I-coated matrix was 3.05±0.15 cm (0 hour) and 1.08±0.04 cm (24 hours), and there was complete closure of the gap at 48 hours. The length between the scratch mark edges on the plastic matrix was 2.89±0.09 cm at 0 hour, 2.13±0.08 cm at 24 hours, and 1.07±0.02 cm at 48 hours, and complete closure of the gap at 72 hours was observed. The % migration rate of cells for both the matrices was calculated as shown in Table 1, and the migration rate of cells on collagen I was found to be 64.36%±2.40% (24 hours) and 100% (48 hours). For the plastic matrix, the % migration rates obtained were 26.36%±4.59% (24 hours), 62.88%±1.61% (48 hours), and 100% (72 hours).
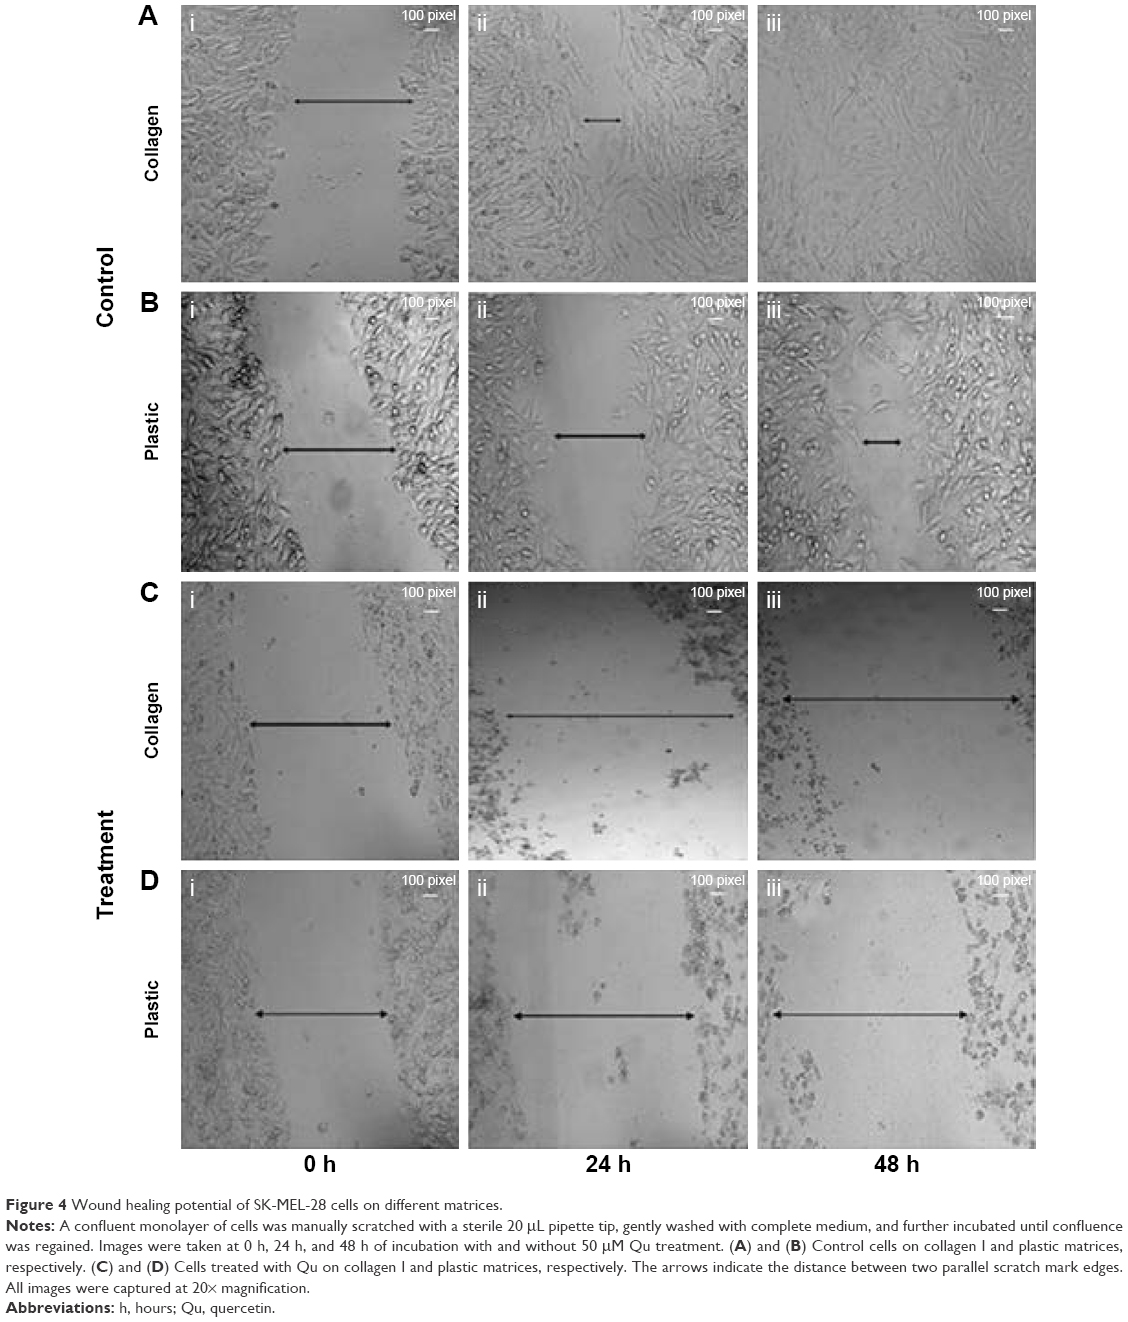 | Figure 4 Wound healing potential of SK-MEL-28 cells on different matrices. |
 | Table 1 Effect of Qu on in vitro scratch assay using SK-MEL-28 melanoma cells |
Upon treatment with Qu (50 μM), the cells presented a noticeable reduction in the migratory property on both the matrices, namely, plastic and collagen I. It was observed that 24 hours posttreatment with Qu, the cells showed distorted morphology on collagen I matrix (Figure 4Ci and ii). There was an increase in apoptosis, and no migration was observed in the treated cells as compared to the untreated cells. At 48 hours (Figure 4Ciii), complete cell death was observed along with cell debris floating on the medium. Similar phenomenon of distorted morphology was observed in the cells seeded on plastic matrix at 24 hours (Figure 4Di and ii), and at 48 hours floating cell debris was observed (Figure 4Diii), hence suggesting that Qu has a potential effect in reducing the migratory property of SK-MEL-28 melanoma cells and thus can help in reducing cancer metastasis. With Qu (50 μM), the length between scratch mark edges was 3.08±0.05 cm and 4.08±0.06 cm (0 hour) for plastic and collagen I matrices, respectively, and no closure of gap was observed in the subsequent period of incubation. Owing to loss of attachment property of cells after treatment, the denuded area displayed withdrawal of cells (Table 2). The distance between the two parallel scratch lines increased to 5.19±0.11 cm (24 hours) and 5.57±0.06 cm (48 hours) on the collagen I-coated matrix with a withdrawal rate of 29.97%±7.80% and 39.90%±5.86% for 24 hours and 48 hours, respectively. On the plastic matrix, the length between the scratch increased to 4.47±0.08 cm (24 hours) and 4.75±0.05 cm (48 hours) with a withdrawal rate of 44.89%±2.71% (24 hours) and 53.93%±4.19% (48 hours). The results indicate that Qu has significant antimigratory activity on the proliferation of SK-MEL-28 cells.
 | Table 2 Calculation of % migration and % withdrawal rates of SK-MEL-28 cells posttreatment with Qu |
In vitro chemotactic invasion assay
SK-MEL-28 cells showed faster migration rate on collagen I-coated matrix compared to plastic matrix, and to understand the mechanism driving this faster migration rate, in vitro agarose spot chemotactic invasion assay was performed. Briefly, three experimental conditions were considered using agarose spots. In the experimental condition 1, ie, agarose spot with PBS, the cells showed no motility (Figure 5Ai), which means no chemotactic invasion action was observed as no chemoattractant was present, and this condition served as the control. In experimental condition 2, which contained agarose spots with collagen I, the motility of cells was observed across the agarose spots, which showed the phenomenon of chemotactic invasion (Figure 5Aii). In contrast, experimental condition 3, which contained agarose spots with collagen I and Qu (50 μM), showed reduction in the migration rate (Figure 5Aiii), underlining that despite the influence of chemoattractant collagen I, which is also proved to be an inducer of EMT in SK-MEL-28 cells, Qu can induce antimigratory response. The collagen I-induced motility of cells was demonstrated by calculating the number of motile cells across the spots in all the three experimental condition setups; an average of nine spots was taken. The numbers of motile cells were found to be 0, 511, and 49.66 in spots with PBS, collagen I, and collagen I with Qu, respectively, indicating that Qu reduced the motility rate by approximately tenfold (Figure 5B). Similarly, the distance traveled by the cells across the agarose spots was measured to be 0 cm, 3.37 cm, and 2.10 cm in the cases of PBS, collagen I, and collagen I with Qu spots, respectively (Figure 5C). It can be determined from the images of experimental condition 2 and 3 that the cells remained attached to the cover slip and moved underneath the agarose spots rather than climbing on the top of it. It can thus be concluded that: 1) cells are on the same focal plane before and after entry into the agarose; 2) the line where the agarose starts is seen across the dorsal surface of the cells; and 3) the image contrast is markedly altered by the presence of the agarose on top of the cells.
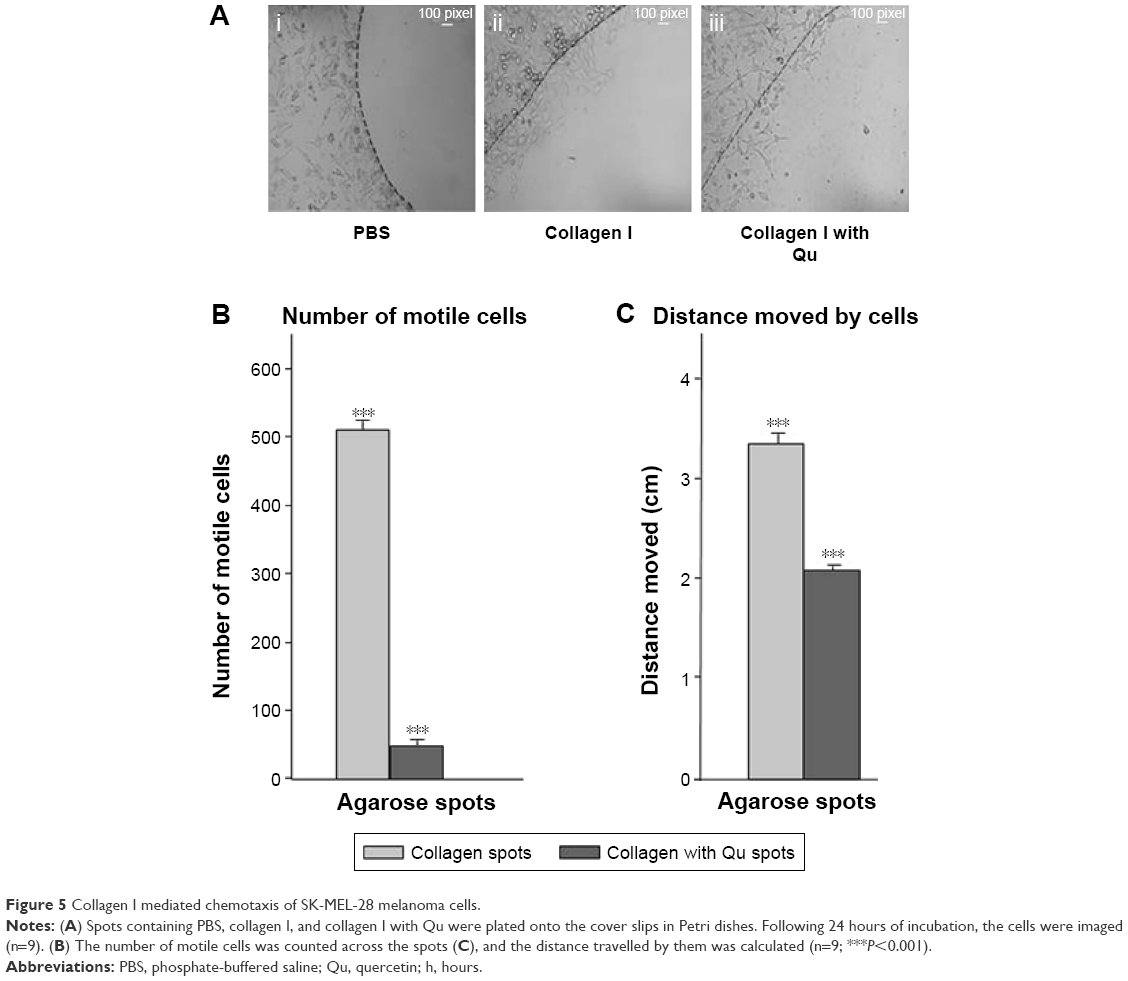 | Figure 5 Collagen I mediated chemotaxis of SK-MEL-28 melanoma cells. |
Qu effectively reverses EMT modulators
To interpret the mechanism involved in Qu-directed E-cadherin suppression and prevention of EMT-like phenomenon in melanoma, the mRNA expression levels of epithelial markers (VCAM1, β-catenin, E-cadherin, ICAM1), mesenchymal markers (Vimentin, N-cadherin, MMP-9), and initiators of EMT-like transition (SNAIL, SLUG, Twist, Survivin, Cyclin-D1) were analyzed using quantitative PCR. The expression level of these markers under the effect of collagen I was also calculated in terms of relative fold change. As given in Figure 6A and B, a significant upregulation in the expression of markers such as β-catenin, Vimentin, N-cadherin, SLUG, and Cyclin-D1 was observed in the presence of collagen I as compared to the plastic matrix (Figure 6), which affirms the role of collagen I in triggering the phenotypical change in epithelial cells and inducing EMT. Through post-Qu treatment, a downregulation in the expression of these markers was detected on both the matrices (Figure 6A, B, D, and E). Downregulation of transcripts such as Vimentin, N-cadherin, Twist, and SNAIL, posttreatment, signifies the importance of Qu in ceasing EMT progression. After treatment, an upregulation in the cell adhesion molecules, such as VCAM1, ICAM1, and E-cadherin, was observed, which indicates that Qu aids in maintaining the integrity of epithelial cells and prevents migration (Figure 6C and F).
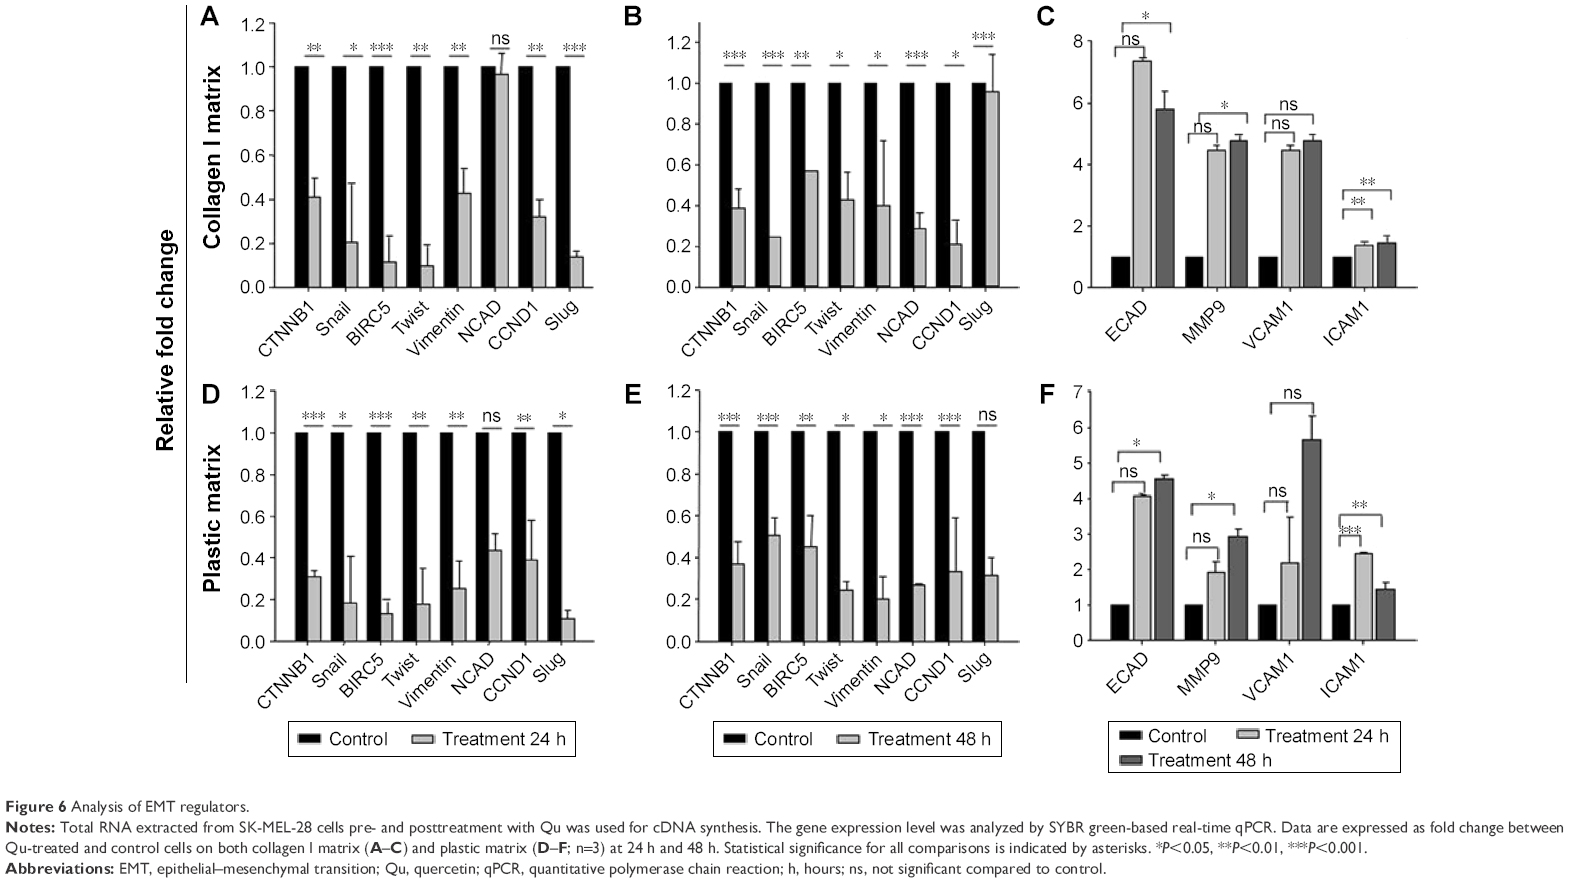 | Figure 6 Analysis of EMT regulators. |
Effect of Qu on cell cycle progression
Cell cycle progression was determined for the time-dependent effect of Qu using flow cytometric analysis (Figure 7A). Following treatment, SK-MEL-28 cells were observed to be arrested in the G2/M phase. As given in Figure 7Ai, the untreated cells displayed 20.17% of cell population in the G2/M phase and 4.19% of cell population in the sub-G1 phase (apoptotic cells) after 24 hours of incubation, while in the treated cells, the percentage increased to 23.93% in the G2/M phase and 14.17% in the apoptotic phase (Figure 7Aii). After 48 hours of treatment, the G2/M population exhibited an increase from 18.55% of control cells (Figure 7Aiii) to 19.52% of treated cells, and as much as 8.33% of cell population was in sub-G1 phase/apoptotic phase (Figure 7Aiv). An inverse correlation among the cell population of the G2/M phase and the cell population of the G0/G1 phase was observed (Figure 7B).
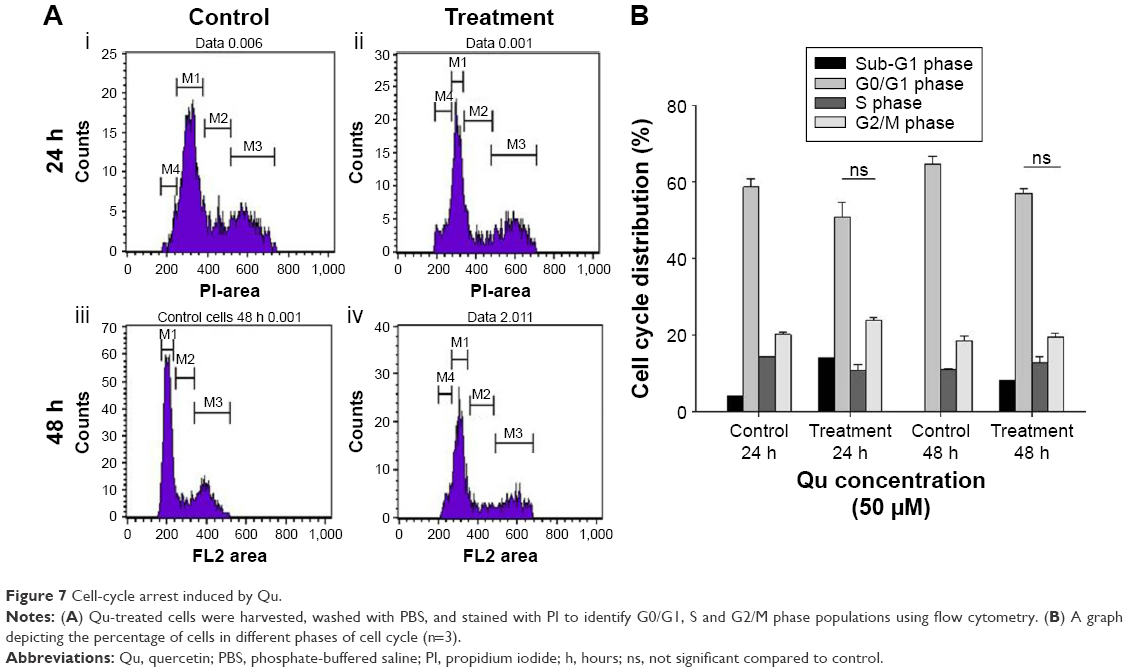 | Figure 7 Cell-cycle arrest induced by Qu. |
Apoptosis induced by Qu
Qu activates proapoptotic enzyme Caspase 3
The occurrence of cell death by the apoptotic pathway was verified by checking the availability of Caspase 3 in cell lysate. Qu-treated SK-MEL-28 cells were checked for Caspase 3 activity at 24 hours and 48 hours. The treated melanoma cells showed significant increase in Caspase 3 activity compared to the untreated cells, indicating apoptosis activation and thus validating all the previous results shown (Figure 8A).
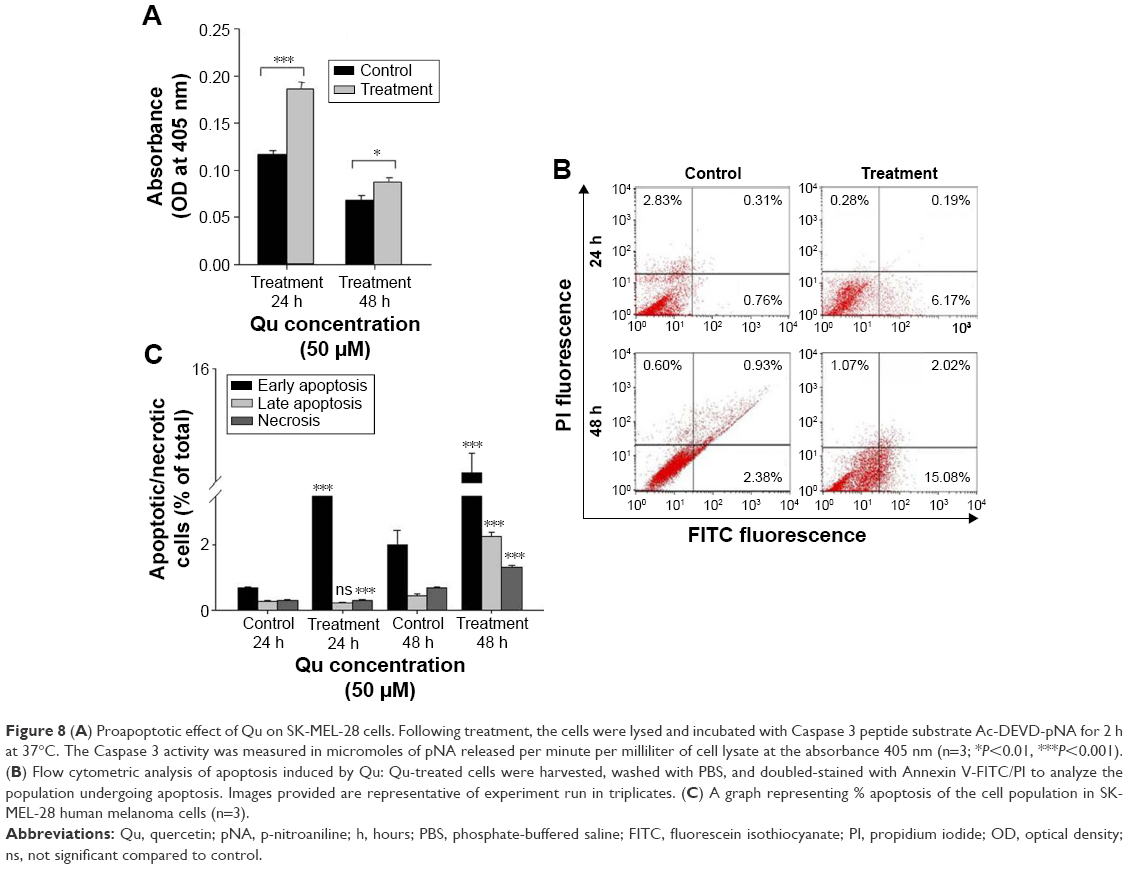 | Figure 8 (A) Proapoptotic effect of Qu on SK-MEL-28 cells. Following treatment, the cells were lysed and incubated with Caspase 3 peptide substrate Ac-DEVD-pNA for 2 h at 37°C. The Caspase 3 activity was measured in micromoles of pNA released per minute per milliliter of cell lysate at the absorbance 405 nm (n=3; *P<0.01, ***P<0.001). (B) Flow cytometric analysis of apoptosis induced by Qu: Qu-treated cells were harvested, washed with PBS, and doubled-stained with Annexin V-FITC/PI to analyze the population undergoing apoptosis. Images provided are representative of experiment run in triplicates. (C) A graph representing % apoptosis of the cell population in SK-MEL-28 human melanoma cells (n=3). |
Annexin V staining
Qu-treated SK-MEL-28 cells and untreated cells were harvested, and Annexin V-FITC/PI double-stained untreated and treated cells were investigated to calculate the percentage of hypodiploid cells (apoptotic cells) and diploid cells (nonapoptotic cells) using a flow cytometer. Ungated data were used to generate data plots (Figure 8B). The lower right quadrant represents early stage apoptotic cells stained by Annexin V-FITC; the upper right quadrant represents late stage apoptotic cells as positive for both the stains. Necrotic cells are represented in the upper left quadrant, which is stained only by PI, and the unstained cells represented in the lower left quadrant are the live cells. At 24 hours, the untreated cells presented 0.68% of early stage apoptotic cells and 0.26% of late apoptotic cells. Upon treatment, these percentages increased to 5.96% for early stage apoptosis, and in the case of late stage apoptosis, the percentage remained almost the same. At 48 hours, the percentage of early stage apoptotic cells was 2.02% and that of late stage apoptosis was 0.42%, which after treatment increased to 14.44% for early stage apoptosis and 2.24% for late stage apoptosis. In summary, 50 μM of Qu treatment to cells affected their survival rate by inducing cell death through total apoptosis (lower right + upper right) by 6.22% (24 hours) and 16.68% (48 hours; Figure 8C).
Discussion
The chemoprevention concept that works in reducing or preventing the carcinogenesis through intervention with natural or biological agents for a long time is increasingly building up scientific interest in the area where standard chemotherapeutic drugs fail to control metastasis of cancer.30 Epidemiological data show that lifestyle modification, which includes natural dietary factors, can effectively influence cancer probability.31–33 Among the most basic dietary phytochemicals, Qu is widely studied as a chemopreventor, which acts by modulating several signaling pathways involved in processes such as cell proliferation, apoptosis, cell migration, and metastasis.34 In this study, a time-dependent evaluation of the effect of Qu on the metastatic potential of SK-MEL-28 human melanoma cells was carried out. The study reports the IC50 of Qu on the SK-MEL-28 human melanoma cells. We observed that Qu at the concentration of >50 μM was found to be cytotoxic. It was concluded that the dose of 50 μM was optimum for conducting further experiments using the SK-MEL-28 cell line. The interaction of the cells with different matrices, namely, plastic and collagen I, and the antineoplastic activity of Qu were investigated. Polymerized collagen I gel was used to mimic the type III EMT that is induced during tumorigenesis in cells. As a part of the study, cell behavioral properties, such as morphology, proliferation, adhesion, migration, invasion, and apoptosis, were also observed in response to collagen I. Collagen I has been previously reported for inducing EMT-like phenotype in various other cancer cell lines.35 Our results show that SK-MEL-28 cells cultured on collagen I exhibited a meshwork-like morphology, which was found to be reversible when the cells were again exposed to the plastic matrix. Similar findings have been observed in human uterine leiomyoma smooth muscle cells cultured on fibrillar collagen-coated dishes.36 Unlike the cells grown on the plastic matrix, the cells grown on collagen I matrix showed scattered behavior, which is typical to EMT-like phenotype.35 Qu treatment promoted cell death, and it was found that this cell death was induced by apoptosis. Cells cultured on the collagen I matrix presented a higher proliferation rate similar to the plastic-coated dishes, which was again found to be consistent with the previously available data.37 It was observed that the increase in cell proliferation rate on collagen I matrix was independent of the adhesive property of cells on different matrices. The data also showed that collagen I enhanced the migrating ability of the cells, which allowed them to reach complete confluence in the scratched area much faster than the cells cultured on the plastic matrix. Type-I collagen is the main collagen found in bones, skin, tendon and newly healed wounds.38 When disruption of tissue occurs due to any injury, collagen I repairs the defect and regains its structure and function,39 which agrees with our results obtained. By mimicking such in vivo cell migration phenomenon in vitro, it was found that Qu has the potential to suppress the migratory phenotype of SK-MEL-28 cells. Our experiment further demonstrated that collagen I acted as a chemotactic stimulus for SK-MEL-28 cells, which played a role in the faster migration rate of cells on the collagen I matrix. The number of cells and their mortality across the spots was significantly higher in the presence of chemoattractant collagen I, thus suggesting that chemoattractant property of collagen I has ability to influence cells’ migratory behavior. The mechanism observed was similar to how collagen I acts as a chemoattractant for human fibroblasts in vivo to repair damaged tissue.40 As a part of the multistage metastatic process, cell matrix invasion is the chief phase.41 Our data revealed that Qu inhibited the SK-MEL-28 cell invasiveness in vitro, which underlines that its anti-invasive activity is a preeminent mechanism that prevents metastasis. Another hallmark event in the progression of metastasis is the shedding of cell adhesion molecules such as E-cadherin42 and β-catenin.43 Repression in the expression of E-cadherin involves transcription factors, namely, SNAIL/SNAI1, SLUG/SNAI2, and Twist.44 Our data of EMT modulators evince that after treatment with Qu, there was downregulation of factors such as Cyclin-D1, N-cadherin, Slug, Snail, Survivin, Twist, and Vimentin (E-cadherin repressors), where as an upregulation in E-cadherin, MMP-9, ICAM1, and VCAM1 (epithelial markers) was recorded, suggesting that Qu has the ability to reverse the EMT induced in the cells and thus it can stop the metastasis of cells even under the influence of EMT inducer collagen I. A universal phenomenon demonstrated by cancer cells is the deregulation of cell-cycle progression.45 During cell division, there are several checkpoints that act as surveillance. When DNA is damaged, the G1/S or G2/M checkpoint blocks cells, and hence, damaged cells are restored and their proliferation is prevented.46,47 In this study, Qu arrested the cells in the G2/M phase and thus inhibited the growth by disruption of cell-cycle progression. The mechanism that governs this process is yet to be systematically researched. Inhibition of tumor growth by phytochemicals incorporates a mechanism that involves apoptosis.48 Our study reports that Qu brings about time-dependent apoptosis in EMT-induced melanoma cells as confirmed by Annexin V-FITC/PI assay, which is similar to other reports wherein Qu has been shown to mediate apoptosis through the p38-directed signaling pathway.19 One of the mechanisms to induce apoptosis is through the intrinsic pathway controlled by mitochondria49 where it activates the caspase cascade.50 Caspases, members of the cysteine proteases family, act as executioners of apoptosis.51 Caspase 3 further activates Caspase 8 and Caspase 9 and mediates apoptosis. In our study too, upon treatment on melanoma cells, an increase in Caspase 3 was observed, which highlights one of the mechanisms adopted by Qu for inducing apoptosis.
Conclusion
Qu has promising effects on the inhibition of growth, invasion, and metastatic potential of melanoma and can be used as a CAM in chemoprevention or as a combination therapy after determining its properties in vivo.
Acknowledgment
This work was supported by Symbiosis Centre for Research and Innovation and Symbiosis School of Biomedical Sciences, Symbiosis International University, Lavale, Pune, India.
Disclosure
The authors report no conflicts of interest in this work.
References
Berwick M, Halpern A. Melanoma epidemiology. Curr Opin Oncol. 1997;9(2):178–182. | ||
Oliveria S, Dusza S, Berwick M. Issues in the epidemiology of melanoma. Expert Rev Anticancer Ther. 2001;1(3):453–459. | ||
Lin K, Baritaki S, Militello L, Malaponte G, Bevelacqua Y, Bonavida B. The Role of B-RAF mutations in melanoma and the induction of EMT via dysregulation of the NF-κB/Snail/RKIP/PTEN circuit. Genes Cancer. 2010;1(5):409–420. | ||
Xu X-Z, Garcia M, Li T-Y, et al. Cytoskeleton alterations in melanoma: aberrant expression of cortactin, an actin-binding adapter protein, correlates with melanocytic tumor progression. Mod Pathol. 2010;23(2):187–196. | ||
Miller AJ, Mihm MC. Mechanisms of disease: melanoma. N Engl J Med. 2006;355(1):51–65. | ||
Geiger TR, Peeper DS. New insight into EMT metastasis mechanism. Int Rev Cell Mol Biol. 2012;294:171–221. | ||
Kalluri R, Weinberg RA. The basics of epithelial-mesenchymal transition. J Clin Invest. 2009;119(6):1420–1428. | ||
Thiery J, Acloque H, Huang R, Nieto M. Epithelial-mesenchymal transitions in development and disease. Cell. 2009;139(5):871–890. | ||
Poser I, Dominguez D, Herreros G, Varnai A, Buettner R, Bosserhoff AK. Loss of E-cadherin expression in melanoma cells involves up-regulation of the transcriptional repressor Snail. J Biol Chem. 2001;276(27):24661–24666. | ||
Shintani Y, Wheelock MJ, Johnson KR. Phosphoinositide-3 kinase–Rac1–c-Jun NH2-terminal kinase signaling mediates collagen I–induced cell scattering and up-regulation of N-Cadherin expression in mouse mammary epithelial cells. Mol Biol Cell. 2006;17(7):2963–2975. | ||
Shintani Y, Fukumoto Y, Chaika N, Svoboda R, Wheelock MJ, Johnson KR. Collagen I – mediated up-regulation of N-cadherin requires cooperative signals from integrins and discoidin domain receptor. J Biol Chem. 2008;180(6):1277–1289. | ||
Kennedy DA, Hart J, Seely D. Cost effectiveness of natural health products: a systematic review of randomized clinical trials. Evid Based Complement Alternat Med. 2009;6(3):297–304. | ||
Knekt P, Kumpulainen J, Jarvinen R, et al. Flavonoid intake and risk of chronic diseases. Am J Clin Nutr. 2002;76(3):560–568. | ||
Van Duijnhoven FJ, Bueno-De-Mesquita HB, Ferrari P, et al. Fruit, vegetables, and colorectal cancer risk: the European Prospective Investigation into Cancer and Nutrition. Am J Clin Nutr. 2009;89(5):1441–1452. | ||
Kirsh VA, Peters U, Mayne ST, et al. Prospective study of fruit and vegetable intake and risk of prostate cancer. J Natl Cancer Inst. 2007;99(15):1200–1209. | ||
Kim GN, Jang HD. Protective mechanism of quercetin and rutin using glutathione metabolism on HO induced oxidative stress in HepG2 cells. Ann N Y Acad Sci. 2009;1171:530–537. | ||
Jeong J-H, An JY, Kwon YT, Rhee JG, Lee YJ. Effects of low dose quercetin: cancer cell-specific inhibition of cell cycle progression. J Cell Biochem. 2009;106(1):73–82. | ||
Zhang Q, Zhao X-H, Wang Z-J. Cytotoxicity of flavones and flavonols to a human esophageal squamous cell carcinoma cell line (KYSE-510) by induction of G2/M arrest and apoptosis. Toxicol In Vitro. 2009;23(5):797–807. | ||
Lee Y-K, Hwang J-T, Kwon DY, Surh Y-J, Park OJ. Induction of apoptosis by quercetin is mediated through AMPKalpha1/ASK1/p38 pathway. Cancer Lett. 2010;292(2):228–236. | ||
Tanigawa S, Fujii M, Hou D-X. Stabilization of p53 is involved in quercetin-induced cell cycle arrest and apoptosis in HepG2 cells. Biosci Biotechnol Biochem. 2008;72(3):797–804. | ||
Surh Y-J. Cancer chemoprevention with dietary phytochemicals. Nat Rev Cancer. 2003;3(10):768–780. | ||
Formica JV, Regelson W. Review of the biology of quercetin and related bioflavonoids. Food Chem Toxicol. 1995;33(12):1061–1080. | ||
Stewart AJ, Bozonnet S, Mullen W, Jenkins GI, Lean ME, Crozier A. Occurrence of flavonols in tomatoes and tomato-based products. J Agric Food Chem. 2000;48(7):2663–2669. | ||
Matsuo M, Sasaki N, Saga K, Kaneko T. Cytotoxicity of flavonoids toward cultured normal human cells. Biol Pharm Bull. 2005;28(2):253–259. | ||
Caltagirone S, Rossi C, Poggi A, et al. Flavonoids apigenin and quercetin inhibit melanoma growth and metastatic potential. Int J Cancer. 2000;87(4):595–600. | ||
Balekar N, Nakpheng T, Srichana T. Wound-healing potential of grandiflorenic acid isolated from Wedelia trilobata (L.) leaves. Songklanakarin J Sci Technol. 2013;35(5):537–546. | ||
Wiggins HL, Rappoport JZ. An agarose spot assay for chemotactic invasion. Biotechniques. 2010;48(2):121–124. | ||
Fleige S, Walf V, Huch S, Prgomet C, Sehm J, Pfaffl MW. Comparison of relative mRNA quantification models and the impact of RNA integrity in quantitative real-time RT-PCR. Biotechnol Lett. 2006;28(19):1601–1613. | ||
Chen Y, Kramer DL, Diegelman P, Vujcic S, Porter CW. Apoptotic signaling in polyamine analogue-treated SK-MEL-28 human melanoma cells. Cancer Res. 2001;61(17):6437–6444. | ||
Gibellini L, Pinti M, Nasi M, et al. Quercetin and cancer chemoprevention. Evid Based Complement Alternat Med. 2011;2011:591356. | ||
Danaei G, Hoorn SV, Lopez AD, Murray CJ, Ezzati M. Causes of cancer in the world: comparative risk assessment of nine behavioural and environmental risk factors. Lancet. 2005;366(9499):1784–1793. | ||
Terry P, Lagergren J, Hansen H, Wolk A, Nyren O. Fruit and vegetable consumption in the prevention of oesophageal and cardiac cancers. Eur J Cancer Prev. 2001;10(4):365–369. | ||
Baruah MM, Sharma N, Khandwekar AP. Flavonoids and prostate cancer. AIJRFANS. 2016;15(1):1–7. | ||
Radhakrishnan V, Arumugam A, Kanagaraj P, Venkataraman P, Krishnamoorthy G, Arunakaran J. Quercetin downregulates matrix metalloproteinases 2 and 9 proteins expression in prostate cancer cells (PC-3). Mol Cell Biochem. 2006;287(1–2):109–116. | ||
Shintani Y, Maeda M, Chaika N, Johnson KR, Wheelock MJ. Collagen I promotes epithelial-to-mesenchymal transition in lung cancer cells via transforming growth factor-beta signaling. Am J Respir Cell Mol Biol. 2008;38(1):95–104. | ||
Koohestani F, Braundmeier AG, Mahdian A, Seo J, Bi J, Nowak RA. Extracellular matrix collagen alters cell proliferation and cell cycle progression of human uterine leiomyoma smooth muscle cells. PLoS One. 2013;8(9):e75844. | ||
Fallica B, Maffei JS, Villa S, Makin G, Zaman M. Alteration of cellular behavior and response to PI3K pathway inhibition by culture in 3D collagen gels. PLoS One. 2012;7(10):e48024. | ||
Aramwit P, Kanokpanont S, De-Eknamkul W, Kamei K, Srichana T. The effect of sericin with variable amino-acid content from different silk strains on the production of collagen and nitric oxide. J Biomater Sci Polym Ed. 2009;20(9):1295–1330. | ||
Diegelmann RF, Evans MC. Wound healing: an overview of acute, fibrotic and delayed healing. Front Biosci. 2004;9:283–289. | ||
Postlethwaite AE, Seyer JM, Kang AH. Chemotactic attraction of human fibroblasts to type I, II, and III collagen and collagen-derived peptides. Cell Biol. 1978;75(2):871–875. | ||
Gupta GP, Massague J. Cancer metastasis: building a framework. Cell. 2006;127(4):679–695. | ||
Frixen UH, Behrens J, Sachs M, et al. E-Cadherin-mediated cell-cell adhesion prevents invasiveness of human carcinoma cells. J Cell Biol. 1991;113(1):173–185. | ||
Nelson WJ. Regulation of cell–cell adhesion by the cadherin–catenin complex. Biochem Soc Trans. 2008;36(pt 2):149–155. | ||
Peinado H, Olmeda D, Cano A. Snail, Zeb and bHLH factors in tumour progression: an alliance against the epithelial phenotype? Nat Rev Cancer. 2007;7(6):415–428. | ||
Hanahan D, Weinberg RA. Hallmarks of cancer: the next generation. Cell. 2011;144(5):646–674. | ||
Löbrich M, Jeggo PA. The impact of a negligent G2/M checkpoint on genomic instability and cancer induction. Nat Rev Cancer. 2007;7(11):861–869. | ||
Kastan MB, Bartek J. Cell-cycle checkpoints and cancer. Nature. 2004;432(7015):316–323. | ||
Chen C, Kong AN. Dietary cancer-chemopreventive compounds: from signaling and gene expression to pharmacological effects. Trends Pharmacol Sci. 2005;26(6):318–326. | ||
Green DR, Reed JC. Mitochondria and apoptosis. Science. 1998;281(5381):1309–1312. | ||
Zou H, Henzel WJ, Liu X, Lutschg A, Wang X. Apaf-1, a human protein homologous to C. elegans CED-4, participates in cytochrome c-dependent activation of caspase-3. Cell. 1997;90(3):405–413. | ||
Thornberry N, Lazebnik Y. Caspases: enemies within. Science. 1998;281(5381):1312–1316. |
 © 2016 The Author(s). This work is published and licensed by Dove Medical Press Limited. The
full terms of this license are available at https://www.dovepress.com/terms
and incorporate the Creative Commons Attribution
- Non Commercial (unported, 3.0) License.
By accessing the work you hereby accept the Terms. Non-commercial uses of the work are permitted
without any further permission from Dove Medical Press Limited, provided the work is properly
attributed. For permission for commercial use of this work, please see paragraphs 4.2 and 5 of our Terms.
© 2016 The Author(s). This work is published and licensed by Dove Medical Press Limited. The
full terms of this license are available at https://www.dovepress.com/terms
and incorporate the Creative Commons Attribution
- Non Commercial (unported, 3.0) License.
By accessing the work you hereby accept the Terms. Non-commercial uses of the work are permitted
without any further permission from Dove Medical Press Limited, provided the work is properly
attributed. For permission for commercial use of this work, please see paragraphs 4.2 and 5 of our Terms.