")
Back to Journals » Diabetes, Metabolic Syndrome and Obesity » Volume 16
Influence of Fibrinogen/Albumin Ratio and Fibrinogen/Pre-Albumin Ratio on Cardiac Autonomic Neuropathy in Type 2 Diabetes
Authors Zhao S , Yang Z, Yu M, Xiang L, Lv Y, Tian C, Li R
Received 20 July 2023
Accepted for publication 12 October 2023
Published 18 October 2023 Volume 2023:16 Pages 3249—3259
DOI https://doi.org/10.2147/DMSO.S431551
Checked for plagiarism Yes
Review by Single anonymous peer review
Peer reviewer comments 2
Editor who approved publication: Prof. Dr. Juei-Tang Cheng
Subei Zhao, Zheng Yang, Meng Yu, Linyu Xiang, Yuhuan Lv, Chunyan Tian, Rong Li
Department of Endocrinology, the First Affiliated Hospital of Chongqing Medical University, Chongqing, 400010, People’s Republic of China
Correspondence: Rong Li, Department of Endocrinology, the First Affiliated Hospital of Chongqing Medical University, Chongqing, 400010, People’s Republic of China, Tel +86 13508385198, Email [email protected]
Purpose: Subclinical inflammation may be involved in the pathogenesis of diabetic cardiac autonomic neuropathy (DCAN). The purpose of the study is to explore the relationship between novel inflammation biomarkers fibrinogen-albumin ratio (FAR), fibrinogen-prealbumin ratio (FPR), and DCAN in type 2 diabetes mellitus (T2DM).
Patients and Methods: A total of 715 T2DM patients were enrolled in this retrospective study, divided into non-DCAN (n=565) and DCAN (n=150) groups by Ewing’s test. Serum fibrinogen, albumin, prealbumin, routine inflammatory and other biochemical markers were measured.
Results: Patients with versus without DCAN had higher FAR (10.29 ± 4.83 vs 7.22 ± 2.56 g/g, P < 0.001) and FPR (2.19 ± 1.85 vs 1.43 ± 0.93 g/mg, P < 0.001). As FAR and FPR quartiles increased, the incidence of DCAN increased (Quartile 1 vs Quartile 4: 8.4 vs 42.7%, 9.6 vs 39.2%, respectively, P < 0.001), heart rate variability parameters decreased (P < 0.001); the incidence of diabetic nephropathy, retinopathy and peripheral neuropathy tended to be higher and inflammation factors were more active (P < 0.01). FAR (OR, 95% CI: 1.16, 1.08– 1.25, P < 0.001) and FPR (OR, 95% CI: 1.22, 1.03– 1.44, P = 0.021) were independent determinants of DCAN; the risk of DCAN increased by approximately 65% and 27% with each increase in the standard deviation (SD) of FAR (OR per SD, 95% CI: 1.65, 1.29– 2.11, P < 0.001) and FPR (OR per SD, 95% CI: 1.27, 1.04– 1.56, P = 0.021).
Conclusion: FAR and FPR are independent risk factors and may influence DCAN development through inflammation.
Keywords: type 2 diabetes mellitus, diabetic cardiac autonomic neuropathy, inflammation, fibrinogen-albumin ratio, fibrinogen-prealbumin ratio
Introduction
Diabetic neuropathy is one of the most prevalent chronic complications of diabetes mellitus (DM), of which diabetic cardiac autonomic neuropathy (DCAN) is a significant subtype. The incidence of DCAN rises annually as DM advances, reaching a prevalence of up to 60% after 15 years of disease occurrence.1 Early DCAN is easy to be overlooked due to symptoms and signs lacking clinical specificity, thus resulting in a low diagnosis rate. Rest tachycardia, orthostatic hypotension and exercise intolerance may occur as the disease worsens, syncope, asymptomatic myocardial infarction or even sudden cardiac death may occur in severe cases.2,3
Previous studies have shown that inflammation is closely linked to type 2 diabetes mellitus (T2DM) and plays a crucial role in its progression.4,5 Yan et al showed that patients with T2DM were in a state of increased burden of low-grade inflammation over time and had elevated levels of systemic inflammation markers.6 Similarly, low-grade inflammation is important in the development of chronic diabetic complications, such as diabetic nephropathy,7 retinopathy,8 and neuropathy.9 Several studies have confirmed that the onset and development of many cardiovascular diseases are closely related to inflammation.10 For example, patients with coronary heart disease are in a state of increased inflammatory load.11 Taken together, chronic inflammation may be involved in the occurrence and progression of DCAN.
Fibrinogen (FIB) is a positive-phase reaction protein,12 which stimulates pro-inflammatory cells to produce inflammatory cytokines and drive inflammatory reaction.13 Albumin (ALB) and prealbumin (PALB) are negative-phase reactants and can enhance catabolism to resist inflammation reaction.14 PALB reflects short-term inflammatory alterations more accurately than ALB given its shorter half-life.15 FIB and ALB based markers are novel inflammatory predictors for multiple diseases.16,17 Considering the combination of these two indicators that vary in function in opposite directions, the ratio amplifies the signal of inflammation. The ratio tends to be more accurate in reflecting the inflammatory state because its less variable and less vulnerable to different pathophysiologic conditions. In response to various inflammatory disorders, the adoption of composite markers has increased based on the potential advantages of ratio.18–21 The present study was conducted, aiming to investigate if there is an association between increased fibrinogen-albumin ratio (FAR) or fibrinogen-prealbumin ratio (FPR) and the occurrence and severity of DCAN in patients with T2DM.
Materials and Methods
Study Subjects
Totally 715 patients who met the diagnosis of T2DM according to the American Diabetes Association (ADA) standards, aged 18–80 years, and were registered as inpatients at the Department of Endocrinology in the First Affiliated Hospital of Chongqing Medical University were randomly enrolled in this cross-sectional study. We excluded those with severe hepatic and renal impairment (serum alanine aminotransferase (ALT) or aspartate aminotransferase (AST) levels >3 times the upper limit of normal or patients with eGFR<30 mL/min/1.73 m2), acute and chronic infection, severe respiratory disease, malignant tumor, severe arrhythmias, heart failure, abnormal thyroid function, blood disease, surgery, trauma, long-term alcohol abuse, poisoning, use of drugs that affect vascular function, etc. Patients with acute complications of DM (such as diabetic ketosis and hyperglycemic hyperosmolar state) and who were pregnant or lactating were also excluded. The study was approved by the Research Ethics Committee of Chongqing Medical University and was conducted in accordance with the Declaration of Helsinki. All volunteers have signed informed consent.
Clinical Assessment
Each patient underwent a routine history and physical examination according to standard procedure, during which the following information was collected: sex, age and height, weight, blood pressure, heart rate (HR), diabetes duration, history of hypertension, and the presence of other diabetic complications, including DN, diabetic retinopathy (DR) and DPN. Individual BMI was calculated as weight (kg)/height (m2). Early morning venous blood was drawn from the antecubital vein after the patients fasted for 8 to 10h. Cobas biochemical analyzer (Cobas c701; Roche, Germany) was used to determine fasting blood glucose (FBG) levels, serum ALB, PALB, AST, ALT, glutamyl-transferase (GGT) and hs-CRP levels. High-pressure liquid chromatography was used to determine glycated hemoglobin (HbA1c) levels (Trinity Biotech, PremierHb9210, Ireland). An automatic blood cell analyzer (XN-1000i; Sysmex, Japan) was used to measure platelet count, white blood cell count (WBC), neutrophil count (NEU), lymphocyte count (LY) and monocyte count (MONO). STA-Revolution coagulation analyzer (STAGO medical company; France) was used to measure FIB level. HITACHI analyzer (HITACHI-7080; Tokyo, Japan) was used to measure serum creatinine (SCr) and uric acid (UA) levels. Enzymatic assay was used to determine fasting serum total cholesterol (TC), triglyceride (TG), HDL cholesterol and LDL cholesterol. FAR (Fibrinogen/Albumin*100 g/g), FPR (Fibrinogen/Prealbumin*100 g/mg), PLR (Platelet/Lymphocyte), NLR (Neutrophil/Lymphocyte) and LMR (Neutrophil/Monocytes) were calculated. The estimated glomerular filtration rate (eGFR) was computed using the formula in Modification of Diet in Renal Disease (MDRD II) as eGFR (mL/min/1.73m2) = 186×(SCr)−1.154×(Age)−0.203×0.742 (if female).
Examination of Diabetic Cardiac Autonomic Neuropathy
DCAN was assessed by Ewing cardiovascular reflex test to analyze heart rate responses during deep breathing and the Valsalva maneuver.22 Antihistamines, diuretics and beta-blockers should have not been taken two days prior to the test, and patients should have abstained from smoking and consuming strong tea, caffeinated beverages and alcohol the day before and on the day of the test. All patients were tested in a calm setting. The difference between the maximum and minimum heart rates while deep breathing (DB) was evaluated and grouped: DB ≥ 15 beats/min as normal (Group db1), between 10–15 beats/min as critical (Group db2), and DB ≤ 10 beats/min as abnormal (Group db3). The ratio of the longest to shortest R-R interval was used to measure the heart rate response to the Valsalva maneuver (VAL) and grouped: VAL≥1.21 as normal (Group val1), VAL between 1.10–1.21 as critical (Group val2), and VAL≤1.10 as abnormal (Group val3). DCAN diagnosis was confirmed by both conditions above being abnormal or one abnormal and one critical value, and both conditions being critical or one normal and one abnormal value was considered as pre-DCAN.
Statistical Analyses
Statistical analyses were performed using SPSS statistical software version 26.0 (SPSS, Chicago, USA), and graphs were drawn using GraphPad Prism version 7.0 (GraphPad Software, USA). The Shapiro–Wilk test was used for normality test. Normally distributed continuous variables were expressed as mean ± standard deviation. Student’s t-test was used for comparison between the two groups. Analysis of variance (ANOVA) was used for comparison among multiple groups, and the Welch test was used when the data did not conform to the homogeneity of variance. Non-normally distributed continuous variables were expressed using the interquartile range; the Mann–Whitney U-test was used for the comparison of differences between two groups, and the Kruskal–Wallis test was applied for comparison among multiple groups. Categorical variables were expressed as rates, and the χ2 test was used for comparison between groups. Univariate and multivariate analyses were performed by applying logistic regression models to estimate the odds rate (OR) and 95% confidence intervals (CI) to determine risk factors for the occurrence of DCAN. A P-value < 0.05 was considered statistically significant (two-sided).
Results
Baseline Patient Characteristics and Laboratory Results
In this study, 150 cases (20.98%) of 715 T2DM patients were combined with DCAN, and biochemical and clinical characteristics are shown in Table 1. Compared with non-DCAN patients, DCAN patients were older, had a longer duration of DM, higher levels of HbA1c, FBG, SBP, faster HR, and more than half of them had hypertension (60.7 vs 47.3%, P = 0.002), DPN (76.0 vs 36.8%, P < 0.001), DN (51.3 vs 20.5%, P < 0.001) or DR (63.3 vs 27.4%, P < 0.001). FIB was elevated, ALB and PALB were decreased in DCAN patients (P < 0.01), FAR (10.29 ± 4.83 vs 7.22 ± 2.56g/g, P < 0.001) and FPR (2.19 ± 1.85 vs 1.43 ± 0.93g/mg, P < 0.001) were significantly higher than non-DCAN patients. As for the inflammatory status, DCAN patients had higher levels of hs-CRP, NEU, PLR and NLR, and lower levels of LY and LMR (P < 0.05 or 0.01).
 |
Table 1 Comparison of Clinical Characteristics Between T2DM Patients with and without DCAN |
Patient Characteristics According to FAR and FPR Quartiles
Baseline characteristics of diabetic complications and inflammatory indexes according to FAR and FPR quartiles are shown in Table 2. The prevalence of DCAN tended to increase, while the heart rate response indexes, DB and VAL, decreased with the increasing FAR and FPR quartiles; the incidence of DPN, DN and DR tended to be higher in those with higher FAR and FPR (P < 0.001 or P = 0.001). Notably, patients in the highest quartile of FAR and FPR had the highest proportion of comorbidities, with nearly half of them with combined DCAN (42.7%, 39.2%), DN (46.6%, 38.1%) or DR (49.4%, 48.3%), and more than 60% with combined DPN (65.7%, 63.6%). In addition, patients with higher FAR and FPR had higher levels of serum inflammatory markers including hs-CRP, WBC, NEU, MONO, PLR and NLR, but lower levels of LY and LMR (all P < 0.01).
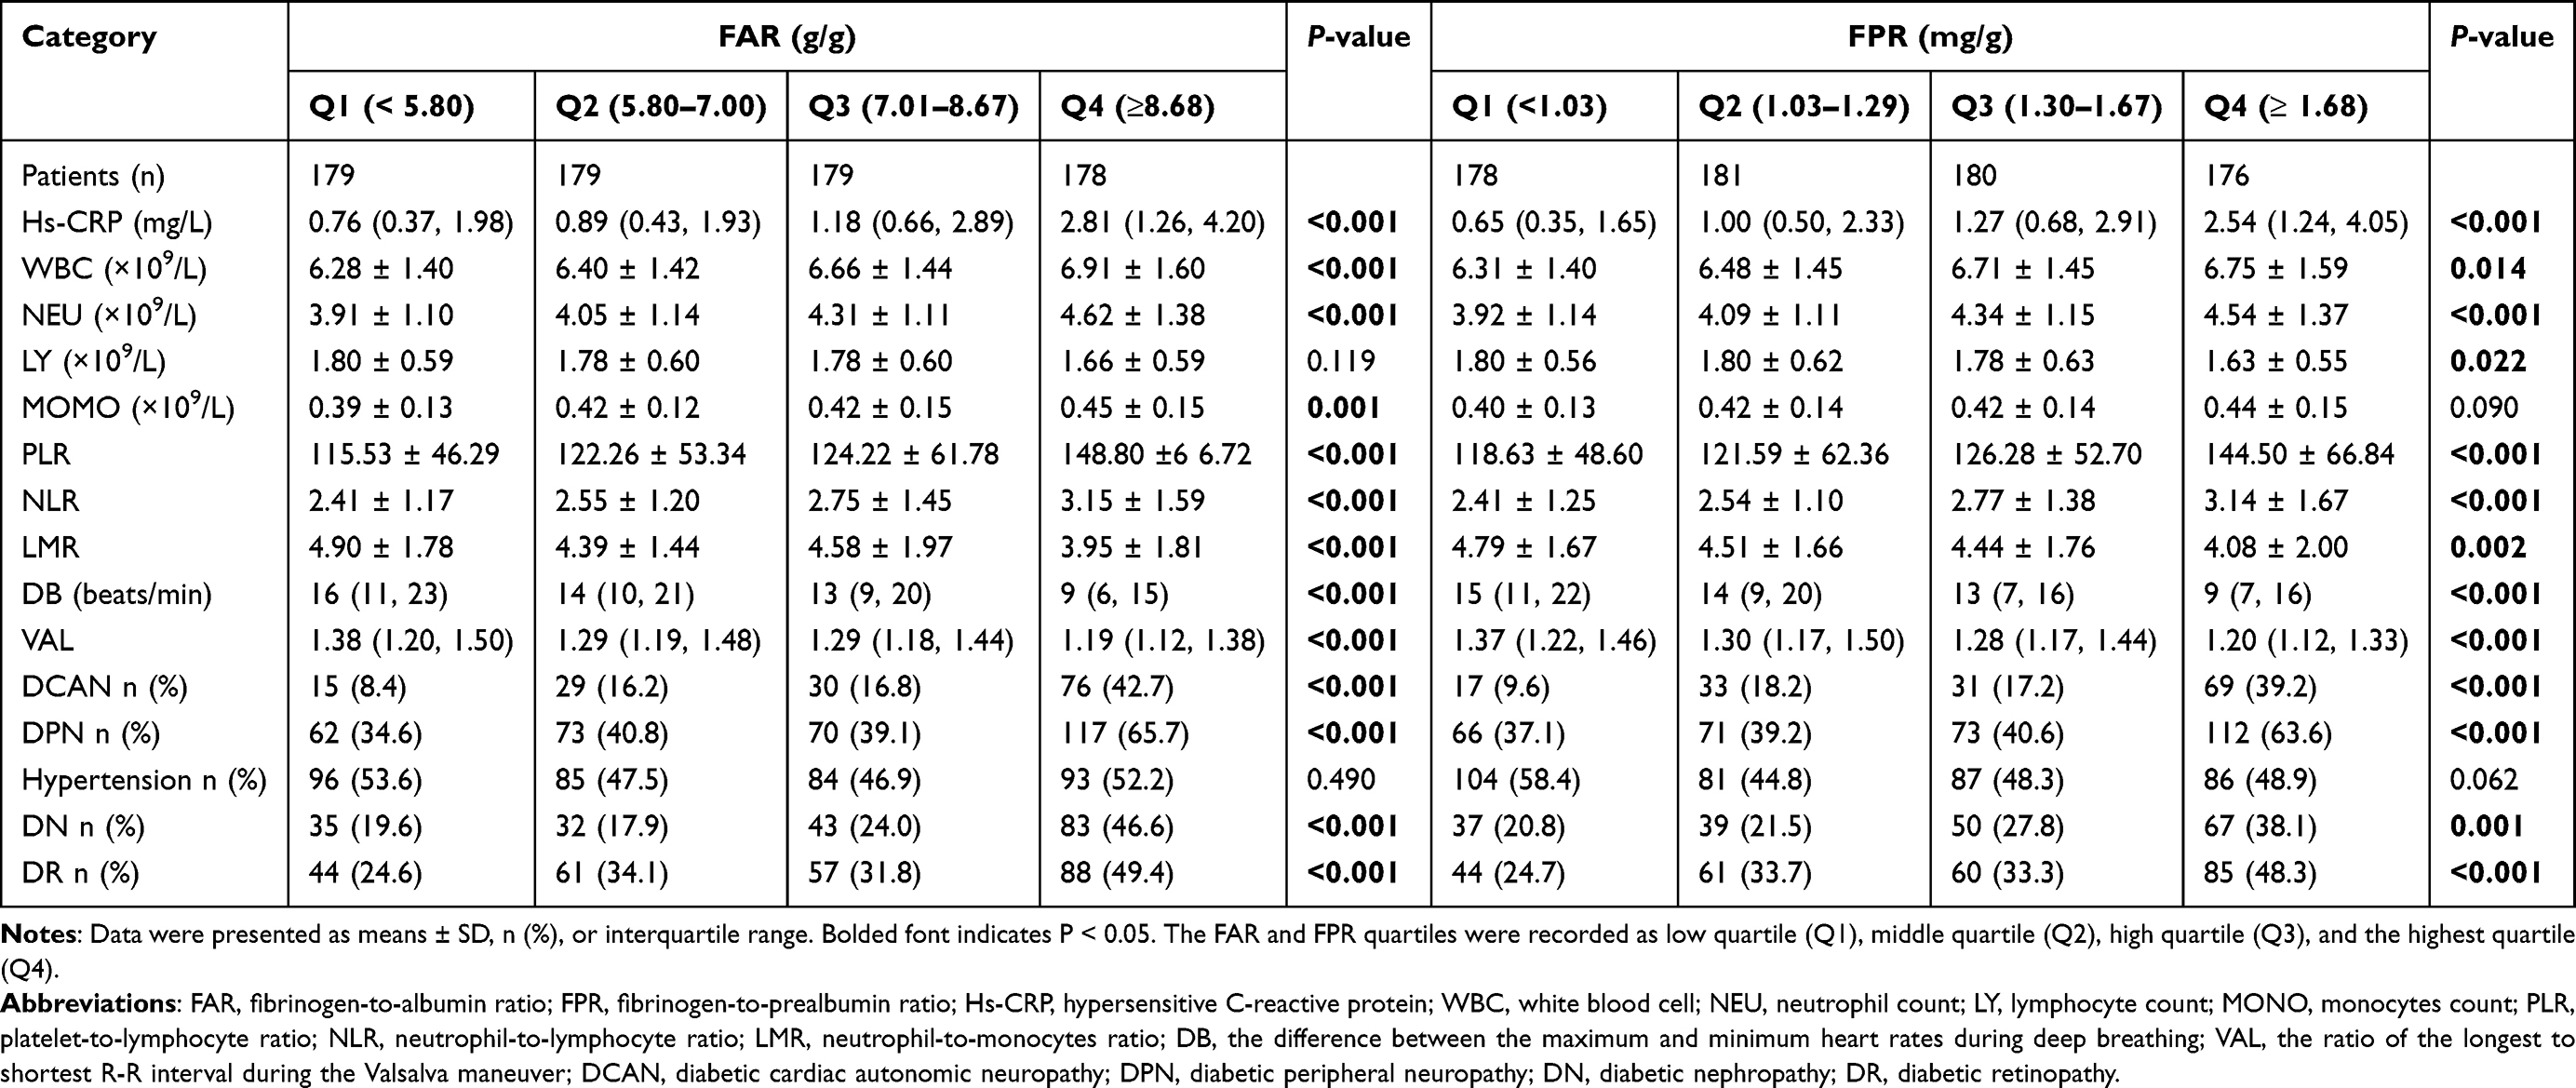 |
Table 2 Characteristics of Patients According to FAR and FPR Quartiles |
Binary Logistic Regression Analysis
The relationships between FAR, FPR and the risk of DCAN are shown in Table 3. We excluded the effect of covariates and finally included the following potentially relevant factors for multifactorial regression analysis. After adjusting for various risk factors including age, sex, BMI, duration, FBG, HbA1c, SBP, HR, ALT, AST, GGT, UA, SCr and inflammatory indicators including hs-CRP, NLR, PLR, LMR, FAR (OR:1.22; 95% CI: 1.14–1.31; P < 0.001) and FPR (OR:1.36; 95% CI:1.14–1.61; P = 0.001) were positively associated with the presence of DCAN (Table 3, model 4). After performing an additional correction for comorbidities including hypertension, DN, DR and DPN, FAR (OR:1.16; 95% CI:1.08–1.25; P < 0.001) and FPR (OR:1.22; 95% CI: 1.03–1.44; P = 0.021) were positively correlated with DCAN and remained an independent risk factor for the presence of DCAN (Table 3, model 5).
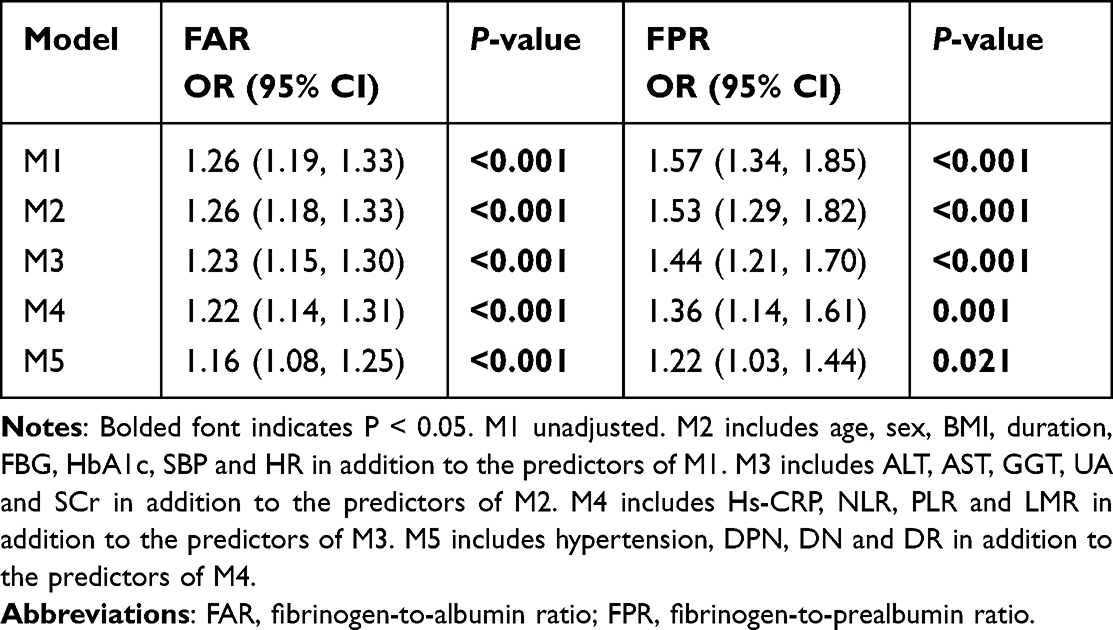 |
Table 3 Odds Ratio for Diabetic Cardiac Autonomic Neuropathy |
Binary Logistic Regression Analysis According to FAR and FRP Quartiles
The risk of DCAN according to FAR and FPR quartiles was assessed as shown in Table 4. FAR (OR per SD:1.65; 95% CI:1.29–2.11; P < 0.001) and FPR (OR per SD:1.27; 95% CI:1.04–1.56; P = 0.021) were considered as continuous variables, the prevalence of DCAN increased by approximately 65% and 27% with each increase in standard deviation after adjusting for multiple influence factors mentioned above. When grouped by FAR (OR:3.06; 95% CI:1.46–6.40; P = 0.003) and FPR (OR:2.76; 95% CI:1.32–5.77; P = 0.007) quartiles, using Quartile 1 as the control group, the risk of DCAN in Quartile 4 increased approximately 2-fold and 1.8-fold compared to Quartile 1 (Table 4, model 5).
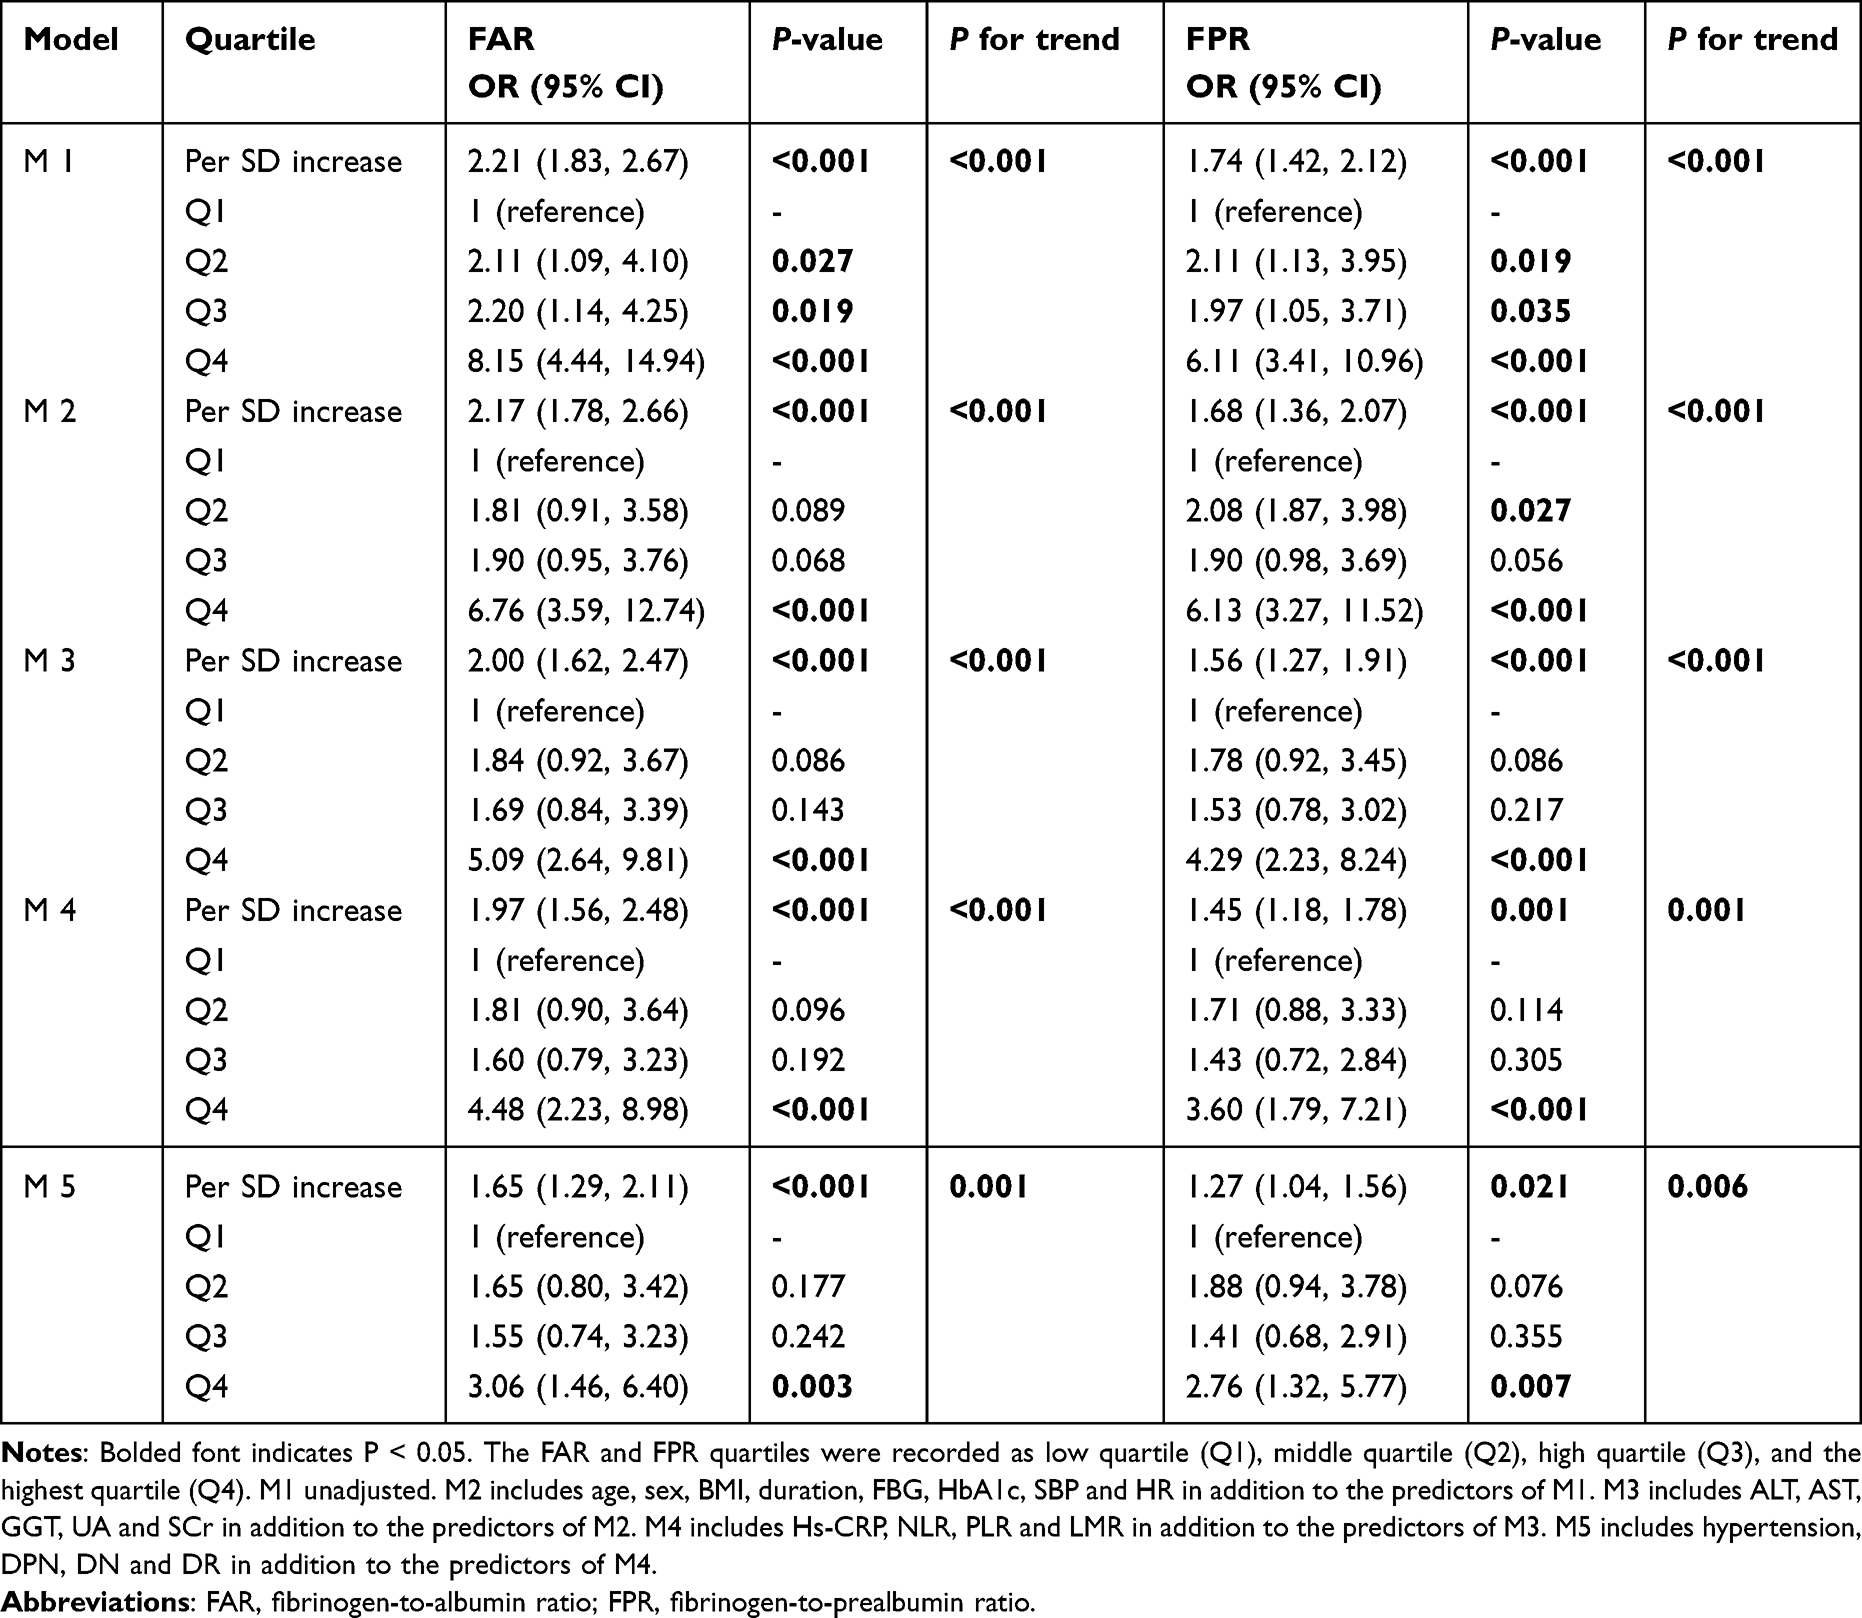 |
Table 4 Odds Ratio for DCAN According to FAR and FRP Quartiles |
Subgroup Analysis
The relationship of FAR and FPR with different subgroups of DB, VAL and DCAN is presented in Figure 1. The results showed that FAR and FPR levels were higher in patients with lower HRV. FAR and FPR levels were significantly higher in db3 compared to db1 and db2 (P < 0.001), and there was an increasing trend of FAR and FPR in db2 compared to db1 but not statistically significant (P > 0.05). Compared to val1, the levels of FAR and FPR increased in val2 (P < 0.01) and further increased in val3 (P < 0.001). The increase of FAR and FPR in val3 compared with val2 was statistically significant (P < 0.05). Similarly, FAR and FPR levels were significantly higher in patients with confirmed DCAN compared to patients with no-DCAN and subclinical DCAN (P < 0.001); however, there was no significant difference between no-DCAN and subclinical DCAN patients (P > 0.05).
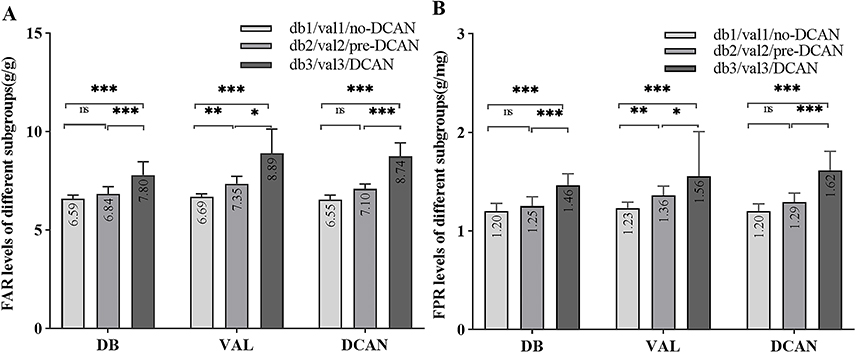 |
Figure 1 Evaluate the levels of FAR and FPR in different subgroups (median with 95% CI). Abbreviations: FAR, fibrinogen-to-albumin ratio; FPR, fibrinogen-to-prealbumin ratio. Notes: ns P > 0.05; * P < 0.05; ** P < 0.01; *** P < 0.001. FAR levels in different subgroups (A). FPR levels in different subgroups (B). DB: the difference between the maximum and minimum heart rates during deep breathing. DB ≥ 15 as normal (db1), between 10–15 as critical (db2), DB ≤ 10 as abnormal (db3). VAL: the ratio of the longest to shortest R-R interval during the Valsalva maneuver. VAL ≥ 1.21 as normal (val1), between 1.10–1.21 as crucial (val2), VAL ≤ 1.10 as abnormal (val3). DCAN: diagnosed DCAN. No-DCAN: diabetic patients without DCAN. Pre-DCAN: diabetic patients with subclinical DCAN. Non-DCAN includes No-DCAN and Pre-DCAN. |
Discussion
To our knowledge, this is the first evidence presented that FAR and FPR are closely associated with DCAN in patients with T2DM. The levels of FAR and FPR were considerably increased in patients with DCAN and independently associated with DCAN even after controlling for confounding variables. The higher FAR and FPR, the more pronounced the decrease in DB and VAL; FAR and FPR may involve in the pathogenesis of DCAN through inflammation and reflect the severity of DCAN.
In this study, males had a higher incidence of DCAN than females did (23.08 vs 17.31%). Generally, gender differences have been found in the prevalence of DCAN, with males suffering autonomic injury earlier and more severely than females.23 Notably, female participants were older than male participants (57.30±10.24 vs 56.05±9.67 years), and female participants with DCAN were older than male individuals (57.13±10.74 vs 55.52±10.02 years). We did observe that patients with DCAN were older, had a longer duration of DM and higher prevalence of other chronic complications. These observations are consistent with previous findings.24,25 Therefore, we speculate that there was no significant gender difference in the occurrence of DCAN, which may be due to the age factor exerting a great impact on DCAN.
Elevated FIB can activate the inflammatory response,12 while ALB and PALB undergo enhanced catabolism under inflammatory stimuli. Recent studies have demonstrated that high FAR is associated with an increased risk of cardiovascular disease18 and DN in T2DM patients.19,26 Another cross-sectional research revealed that T2DM patients with lower AFR and PFR had a higher incidence of DPN.20 Consistently, we found that high FIB level was a risk factor for DCAN, and elevated ALB and PALB were protective factors. The incidence of DR, DN or DPN was significantly increased in T2DM patients with higher FAR or FPR, with nearly half of patients in the highest quartile suffering from DN, DR or DCAN, and more than half with DPN. The proportion of patients with multiple microvascular complications was significantly increased in patients with higher FAR and FPR. Combined with FIB’s role in activating inflammatory responses, enhancing oxidative stress, and promoting intravascular lipid deposition and thrombosis.27 Low ALB leads to increased blood viscosity, vascular endothelial cell damage, platelet activation and aggregation, and is strongly associated with the development of cardiovascular pathologies and adverse events.28 Therefore, FAR and FPR may be important predictors of multiple microvascular complications.
FAR and FPR were more reliable than their individual computation to reflect inflammatory status in the evidence of previous research. Wang et al discovered that FAR was considerably higher in those with DN and more accurately reflected the risk of DN than FIB and ALB.19 Patients with high FAR had more severe inflammatory reactions and were at a higher risk of thrombosis.18 FAR showed more sensitivity and specificity in the detection of the onset of coronary artery lesions than FIB and ALB.18,29 Similarly, in cancer studies, FAR has been shown to be a better prognostic factor than fibrinogen and albumin alone in predicting the occurrence and progression of a variety of malignant tumors.30–32 We speculate the possible reason is that FAR and FPR combine two indicators with opposite variation directions, thus amplifying the inflammatory signal. The ratios are more stable with less fluctuation, then less susceptible to various pathophysiologic states. Therefore, FAR and FPR are valuable composite markers of chronic inflammatory diseases.
Previous studies have suggested that FIB may affect heart rate response. Cooper et al included 1153 patients from the MIDUS II cohort and discovered that patients with high FIB had lower HRV after controlling for multi-variables, but not restricted to diabetes.33 In our study, FAR and FPR were found to be elevated in patients with DCAN and remained independent risk factors even after multivariate correction. Notably, DB and VAL are objective physical examination indicators and are sensitive indicators for screening DCAN currently.34 Stratified by FAR and FPR quartiles, the incidence of DCAN was the highest in the highest quartile. Additionally, FAR and FPR were slightly elevated in patients with DB and VAL critical values and subclinical DCAN, which in patients with DB and VAL abnormal values and clinical DCAN were further elevated, indicating that FAR and FPR may be associated with the severity of DCAN.
The association between FAR, FPR and inflammation is based on the effect of FIB in upregulating pro-inflammatory cytokines and the protective anti-inflammatory property of ALB and PALB. Sui et al found that FIB was associated with excessive inflammation in vivo; the serum WBC, NEU, NLR, CRP and erythrocyte sedimentation rate (ESR) were increased, LY and MONO were decreased in patients with high FIB.35 Eckart et al found elevated CRP and increased inflammatory response in the plasma of patients with low ALB.36 According to recent studies, FAR was negatively correlated with LY and positively correlated with hs-CRP, WBC, NEU and NLR.18,19 FPR was positively correlated with NLR and PLR and negatively correlated with LMR.32 Another cross-sectional investigation discovered that those with lower AFR had higher serum CRP and ESR.37 In our study, the differences in these classic inflammatory indicators were monitored separately by FAR and FPR quartiles, we found that the levels of hs-CRP, NLR and PLR were higher and LMR was lower in the highest quartile, and they were associated with the incidence of DCAN, which supported the inflammatory effects of FAR and FPR and provided a strong basis for the role in the pathogenesis of DCAN by affecting inflammation. It is worth noting that FAR, FPR and the above indicators were included in the multivariate regression model simultaneously, FAR and FPR remained independently related to DCAN.
The mechanism underlying the association of FAR, and FPR with DCAN is unclear. There are some possible explanations for DCAN’s association with FIB, ALB and PALB. First, FIB has a pro-inflammatory effect. Cellular experiments have demonstrated that FIB can promote cytokine and chemokine production by stimulating monocytes and leukocytes,38,39 and inflammatory stimuli can cause irreversible injury to neurons and glial cells.40,41 The vagus nerve has cholinergic anti-inflammatory effects, inflammation may persist and be involved in the development and progression of DCAN if vagal dysfunction is present.41 Second, FIB is an unstable glycoprotein. FIB undergoes glycosylation with glucose, through modification and conformational changes, and eventually forms advanced glycosylation end products (AGEs). AGEs possess cytotoxic properties,42 which can promote autonomic neuronal apoptosis; preventing FIB glycosylation and conformational changes can effectively inhibit the progression of neuropathy.43 FIB is easily oxidized by hyperglycemia. Enhanced oxidative stress causes impaired vasodilator secretion by vascular endothelial cells and restricted microvascular dilation affects the nutrient transport of nerves.44,45 Third, FIB shows thrombotic susceptibility. Increased FIB concentration causes blood hypercoagulation or thrombosis, then aggravating microcirculatory disorders and a further decline in the neural blood flow.44,45 In addition, FIB is a negative regulator of axonal growth. Schachtrup et al found that FIB binding to neuronal β3 integrins induces EGFR phosphorylation and inhibits axonal growth.46 Unlike FIB, ALB and PALB have anti-inflammatory and antioxidant properties,47,48 these characteristics may confer neuroprotective effects but the precise mechanism remains unknown. PALB under a physiological state enhances axon growth and nerve regeneration.49 These mechanisms suggest a possible pathophysiological relationship between FAR, FPR, and DCAN.
There are some limitations to this study. First, the study is a survey of the present state. The observed indicators are correlated with statistical outcomes, and the cross-sectional design does not represent causal associations. Second, there may be variability in the true relationship between FAR, FPR, and DCAN since we only included a single measurement yet all biochemical indicators are subject to change over time. Hospitalized patients enrolled in this study had relatively complex conditions, and selection bias was inevitable; therefore, the results of the study may not be generalizable to the broader DM population. Despite these limitations, the single-center standardized methodology and relatively large sample size improved the study’s reliability.
Conclusions
In summary, FAR and FPR were found to be independent predictors of DCAN in T2DM for the first time. Our data support the important role of inflammation, FAR and FPR reflected DCAN’s severity and affected other diabetic microvascular complications. Therefore, clinicians need to pay additional attention to the degree of inflammation in diabetic patients, higher FAR and FPR are expected to inform early identification and clinical management of DCAN.
Institutional Review Board Statement
The study was approved by the Ethics Committee of The First Affiliated Hospital of Chongqing Medical University. Written informed consent was obtained before the data collection and analysis.
Data Sharing Statement
The datasets used and/or analyzed during the current study are available from the corresponding author on reasonable request.
Acknowledgments
Thanks to all participants for their value time and effort. We would like to thank Ronghua He for his kind help.
Funding
This research received no external funding.
Disclosure
The authors declare no conflicts of interest in this work.
References
1. Pop-Busui R, Boulton AJ, Feldman EL, et al. Diabetic neuropathy: a position statement by the American diabetes association. Diabetes Care. 2017;40(1):136–154. doi:10.2337/dc16-2042
2. Vinik AI, Casellini C, Parson HK, et al. Cardiac autonomic neuropathy in diabetes: a predictor of cardiometabolic events. Front Neurosci. 2018;12:591. doi:10.3389/fnins.2018.00591
3. Spallone V. Update on the impact, diagnosis and management of cardiovascular autonomic neuropathy in diabetes: what is defined, what is new, and what is unmet. Diabetes Metab J. 2019;43(1):3–30. doi:10.4093/dmj.2018.0259
4. Donath MY, Shoelson SE. Type 2 diabetes as an inflammatory disease. Nat Rev Immunol. 2011;11(2):98–107. doi:10.1038/nri2925
5. Kocak MZ, Aktas G, Erkus E, et al. Neuregulin-4 is associated with plasma glucose and increased risk of type 2 diabetes mellitus. Swiss Med Wkly. 2019. doi:10.4414/smw.2019.20139
6. Yan PJ, Xu Y, Wan Q, et al. Decreased plasma neuregulin 4 concentration is associated with increased high-sensitivity C-reactive protein in newly diagnosed type 2 diabetes mellitus patients: a cross-sectional study. Acta Diabetol. 2017;54(12):1091–1099. doi:10.1007/s00592-017-1044-4
7. Aktas G, Yilmaz S, Kantarci DB, et al. Is serum uric acid-to-HDL cholesterol ratio elevation associated with diabetic kidney injury? Postgrad Med. 2023;135(5):519–523. doi:10.1080/00325481.2023.2214058
8. Wang JR, Chen Z, Yang K, et al. Association between neutrophil-to-lymphocyte ratio, platelet-to-lymphocyte ratio, and diabetic retinopathy among diabetic patients without a related family history. Diabetol Metab Syndr. 2020;12:55. doi:10.1186/s13098-020-00562-y
9. Aktas G. Serum C-reactive protein to albumin ratio as a reliable marker of diabetic neuropathy in type 2 diabetes mellitus. Inter Med. 2023;2023:2023060202.
10. Rafeh R, Viveiros A, Oudit GY, et al. Targeting perivascular and epicardial adipose tissue inflammation: therapeutic opportunities for cardiovascular disease. Clin Sci. 2020;134(7):827–851. doi:10.1042/CS20190227
11. Sincer I, Gunes Y, Mansiroglu AK, et al. Association of mean platelet volume and red blood cell distribution width with coronary collateral development in stable coronary artery disease. Postepy Kardiol Interwencyjnej. 2018;14(3):263–269. doi:10.5114/aic.2018.78329
12. Hsieh JY, Smith TD, Meli VS, et al. Differential regulation of macrophage inflammatory activation by fibrin and fibrinogen. Acta Biomater. 2017;47:14–24. doi:10.1016/j.actbio.2016.09.024
13. Luyendyk JP, Schoenecker JG, Flick MJ. The multifaceted role of fibrinogen in tissue injury and inflammation. Blood. 2019;133(6):511–520. doi:10.1182/blood-2018-07-818211
14. Sheinenzon A, Shehadeh M, Michelis R, et al. Serum albumin levels and inflammation. Int J Biol Macromol. 2021;184:857–862. doi:10.1016/j.ijbiomac.2021.06.140
15. Chertow GM, Ackert K, Lew NL, et al. Prealbumin is as important as albumin in the nutritional assessment of hemodialysis patients. Kidney Int. 2000;58(6):2512–2517. doi:10.1046/j.1523-1755.2000.00435.x
16. Liu S-L, N-Q W, Shi H-W, et al. Fibrinogen is associated with glucose metabolism and cardiovascular outcomes in patients with coronary artery disease. Cardiovasc Diabetol. 2020;19(1). doi:10.1186/s12933-020-01012-9
17. Bilgin S, Kurtkulagi O, Atak Tel BM, et al. Does C-reactive protein to serum albumin ratio correlate with diabEtic nephropathy in patients with Type 2 dIabetes MEllitus? The CARE TIME study. Prim Care Diabetes. 2021;15(6):1071–1074. doi:10.1016/j.pcd.2021.08.015
18. Wang P, Yuan D, Zhang C, et al. High fibrinogen-to-albumin ratio with type 2 diabetes mellitus is associated with poor prognosis in patients undergoing percutaneous coronary intervention: 5-year findings from a large cohort. Cardiovasc Diabetol. 2022;21(1):46. doi:10.1186/s12933-022-01477-w
19. Wang K, Xu W, Zha B, et al. Fibrinogen to albumin ratio as an independent risk factor for type 2 diabetic kidney disease. Diabetes Metab Syndr Obes. 2021;14:4557–4567. doi:10.2147/DMSO.S337986
20. Zang S, Shi L, Zhao J, et al. Prealbumin to fibrinogen ratio is closely associated with diabetic peripheral neuropathy. Endocr Connect. 2020;9(8):858–863. doi:10.1530/EC-20-0316
21. Chen X, Zhao J, You Y, et al. The ratio of fibrinogen to albumin is related to the occurrence of retinopathy in type 2 diabetic patients. Diabetes Metab Syndr Obes. 2023;16:1859–1867. doi:10.2147/DMSO.S407391
22. Agashe S, Petak S. Cardiac autonomic neuropathy in diabetes mellitus. Methodist Debakey Cardiovasc J. 2018;14(4):251–256. doi:10.14797/mdcj-14-4-251
23. Aaberg ML, Burch DM, Hud ZR, et al. Gender differences in the onset of diabetic neuropathy. J Diabetes Complications. 2008;22(2):83–87. doi:10.1016/j.jdiacomp.2007.06.009
24. Jung CH, Kim BY, Kim CH, et al. Association of serum adipocytokine levels with cardiac autonomic neuropathy in type 2 diabetic patients. Cardiovasc Diabetol. 2012;11:24. doi:10.1186/1475-2840-11-24
25. Tentolouris N, Liatis S, Moyssakis I, et al. Aortic distensibility is reduced in subjects with type 2 diabetes and cardiac autonomic neuropathy. Eur J Clin Invest. 2003;33(12):1075–1083. doi:10.1111/j.1365-2362.2003.01279.x
26. Tessari P, Kiwanuka E, Barazzoni R, et al. Diabetic nephropathy is associated with increased albumin and fibrinogen production in patients with type 2 diabetes. Diabetologia. 2006;49(8):1955–1961. doi:10.1007/s00125-006-0288-2
27. Kang MG, Koo BK, Tantry US, et al. Association between thrombogenicity indices and coronary microvascular dysfunction in patients with acute myocardial infarction. JACC Basic Transl Sci. 2021;6(9–10):749–761. doi:10.1016/j.jacbts.2021.08.007
28. Chien SC, Chen CY, Lin CF, et al. Critical appraisal of the role of serum albumin in cardiovascular disease. Biomark Res. 2017;5:31. doi:10.1186/s40364-017-0111-x
29. Karahan O, Acet H, Ertas F, et al. The relationship between fibrinogen to albumin ratio and severity of coronary artery disease in patients with STEMI. Am J Emerg Med. 2016;34(6):1037–1042. doi:10.1016/j.ajem.2016.03.003
30. Zhang L, Chen QG, Li SQ, et al. Preoperative fibrinogen to prealbumin ratio as a novel predictor for clinical outcome of hepatocellular carcinoma. Future Oncol. 2019;15(1):13–22. doi:10.2217/fon-2018-0376
31. Xu WY, Zhang HH, Xiong JP, et al. Prognostic significance of the fibrinogen-to-albumin ratio in gallbladder cancer patients. World J Gastroenterol. 2018;24(29):3281–3292. doi:10.3748/wjg.v24.i29.3281
32. Hailun X, Huang S, Yuan G, et al. Prognostic significance of preoperative fibrinogen-to-prealbumin ratio in patients with stage I-III colorectal cancer undergoing surgical resection: a retrospective cohort study. Biomed Res Int. 2021;2021:1.
33. Cooper TM, McKinley PS, Seeman TE, et al. Heart rate variability predicts levels of inflammatory markers: evidence for the vagal anti-inflammatory pathway. Brain Behav Immun. 2015;49:94–100. doi:10.1016/j.bbi.2014.12.017
34. Vinik AI, Ziegler D. Diabetic cardiovascular autonomic neuropathy. Circulation. 2007;115(3):387–397. doi:10.1161/CIRCULATIONAHA.106.634949
35. Sui J, Noubouossie DF, Gandotra S, et al. Elevated plasma fibrinogen is associated with excessive inflammation and disease severity in COVID-19 Patients. Front Cell Infect Microbiol. 2021;2021:11.
36. Eckart A, Struja T, Kutz A, et al. Relationship of nutritional status, inflammation, and serum albumin levels during acute illness: a prospective study. Am J Med. 2020;133(6):713–722.e717. doi:10.1016/j.amjmed.2019.10.031
37. He Y, Tang J, Wu B, et al. Correlation between albumin to fibrinogen ratio, C-reactive protein to albumin ratio and Th17 cells in patients with rheumatoid arthritis. Clin Chim Acta. 2020;500:149–154. doi:10.1016/j.cca.2019.10.009
38. Jensen T, Kierulf P, Sandset PM, et al. Fibrinogen and fibrin induce synthesis of proinflammatory cytokines from isolated peripheral blood mononuclear cells. Thromb Haemost. 2007;97(5):822–829. doi:10.1160/TH07-01-0039
39. Flick MJ, Du X, Degen JL. Fibrin(ogen)-alpha M beta 2 interactions regulate leukocyte function and innate immunity in vivo. Exp Biol Med. 2004;229(11):1105–1110. doi:10.1177/153537020422901104
40. Pop-Busui R, Ang L, Holmes C, et al. Inflammation as a therapeutic target for diabetic neuropathies. Curr Diab Rep. 2016;16(3):29. doi:10.1007/s11892-016-0727-5
41. Vinik AI, Erbas T, Casellini CM. Diabetic cardiac autonomic neuropathy, inflammation and cardiovascular disease. J Diabetes Investig. 2013;4(1):4–18. doi:10.1111/jdi.12042
42. Mirmiranpour H, Bathaie SZ, Khaghani S, et al. Investigation of the mechanism(s) involved in decreasing increased fibrinogen activity in hyperglycemic conditions using L-lysine supplementation. Thromb Res. 2012;130(3):e13–19. doi:10.1016/j.thromres.2012.04.010
43. Cameron NE, Cotter MA, Dines K, et al. Effects of aminoguanidine on peripheral nerve function and polyol pathway metabolites in streptozotocin-diabetic rats. Diabetologia. 1992;35(10):946–950. doi:10.1007/BF00401423
44. Schaper NC, Huijberts M, Pickwell K. Neurovascular control and neurogenic inflammation in diabetes. Diabetes Metab Res Rev. 2008;24(Suppl 1):40–44. doi:10.1002/dmrr.862
45. Domingueti CP, Dusse LM, Carvalho M, et al. Diabetes mellitus: the linkage between oxidative stress, inflammation, hypercoagulability and vascular complications. J Diabetes Complications. 2016;30(4):738–745. doi:10.1016/j.jdiacomp.2015.12.018
46. Schachtrup C, Lu P, Jones LL, et al. Fibrinogen inhibits neurite outgrowth via beta 3 integrin-mediated phosphorylation of the EGF receptor. Proc Natl Acad Sci U S A. 2007;104(28):11814–11819. doi:10.1073/pnas.0704045104
47. Walley KR, McDonald TE, Wang Y, et al. Albumin resuscitation increases cardiomyocyte contractility and decreases nitric oxide synthase II expression in rat endotoxemia. Crit Care Med. 2003;31(1):187–194. doi:10.1097/00003246-200301000-00029
48. Lang JD, Figueroa M, Chumley P, et al. Albumin and hydroxyethyl starch modulate oxidative inflammatory injury to vascular endothelium. Anesthesiology. 2004;100(1):51–58. doi:10.1097/00000542-200401000-00012
49. Fleming CE, Mar FM, Franquinho F, et al. Chapter 17: transthyretin: an enhancer of nerve regeneration. Int Rev Neurobiol. 2009;87:337–346.
 © 2023 The Author(s). This work is published and licensed by Dove Medical Press Limited. The full terms of this license are available at https://www.dovepress.com/terms.php and incorporate the Creative Commons Attribution - Non Commercial (unported, v3.0) License.
By accessing the work you hereby accept the Terms. Non-commercial uses of the work are permitted without any further permission from Dove Medical Press Limited, provided the work is properly attributed. For permission for commercial use of this work, please see paragraphs 4.2 and 5 of our Terms.
© 2023 The Author(s). This work is published and licensed by Dove Medical Press Limited. The full terms of this license are available at https://www.dovepress.com/terms.php and incorporate the Creative Commons Attribution - Non Commercial (unported, v3.0) License.
By accessing the work you hereby accept the Terms. Non-commercial uses of the work are permitted without any further permission from Dove Medical Press Limited, provided the work is properly attributed. For permission for commercial use of this work, please see paragraphs 4.2 and 5 of our Terms.