
Back to Journals » International Journal of Chronic Obstructive Pulmonary Disease » Volume 21
Induced Sputum Microbial Diversity and Function Changes in Patients with Acute Exacerbations of Chronic Obstructive Pulmonary Disease by Metagenomic Sequencing: A Cross-Sectional Study
Authors Cui Y, Li Q, Liu Z, Yu Y
Received 31 January 2026
Accepted for publication 1 July 2026
Published 10 July 2026 Volume 2026:21 600218
DOI https://doi.org/10.2147/COPD.S600218
Checked for plagiarism Yes
Review by Single anonymous peer review
Peer reviewer comments 2
Editor who approved publication: Prof. Dr. Zijing Zhou
Yujuan Cui,1,* Qiong Li,2,3,* Zhen Liu,3 Yanfang Yu1
1Department of Respiratory and Critical Care Medicine, Jiading District Central Hospital Affiliated Shanghai University of Medicine & Health Sciences, Shanghai, People’s Republic of China; 2Histo Pathology Diagnostic Center, Shanghai, People’s Republic of China; 3Zhejiang Key Laboratory of Digital Technology in Medical Diagnostics, DIAN DIAGNOSTICS Group Co., Ltd., Hangzhou, Zhejiang, People’s Republic of China
*These authors contributed equally to this work
Correspondence: Yanfang Yu, Department of Respiratory and Critical Care Medicine, Jiading District Central Hospital Affiliated Shanghai University of Medicine & Health Sciences, Shanghai, People’s Republic of China, Email [email protected]
Purpose: The underlying pathogenesis of acute exacerbation of chronic obstructive pulmonary disease (AECOPD) is closely related to airway microbiota dysregulation. Currently, there is a lack of systematic elaboration based on deep metagenomic sequencing regarding the species-level and functional characteristics of the microbiota during AECOPD, as well as its correlation with clinical phenotypes of the host. This study aims to systematically analyze the taxonomic composition and functional profile changes of the microbiota in induced sputum samples from COPD patients during the stable and acute exacerbation periods using metagenomic next-generation sequencing and to explore their correlations with clinical indicators through metagenomic methods.
Patients and Methods: A total of 66 patients with COPD were recruited from the Department of Respiratory and Critical Care Medicine at Jiading District Central Hospital in Shanghai, China. Of these, 49 induced sputum samples were obtained from 47 patients (17 in the stable group; 30 in the acute exacerbation group) after the quality control with DNA extraction and deep metagenomic sequencing. The species annotation and functional analysis were conducted using bioinformatics procedures, and microbial α-diversity analysis, LEfSe analysis was performed to identify differentially expressed markers. Spearman correlation analysis was used to evaluate the correlation between microbial/functional characteristics and a series of clinical indicators.
Results: The α-diversity of the sputum microbiota in AECOPD patients was significantly lower at the species level compared to the stable stage (p < 0.01), and the community structure also underwent significant changes. Functional annotation and comparative analysis further identified 9 KEGG pathways (ko00970, ko04112, ko03420, ko03440, ko03060/ko03070, ko03410, ko04930, and ko00680) and 1 eggNOG functional category (M: Cell wall/membrane/envelope biogenesis) that differed significantly between the two groups. Among them, pathways such as methane metabolism were downregulated in the exacerbation period.
Conclusion: This study revealed significant dysregulation of the airway microbiome in AECOPD patients at species-level diversity, community structure, and functional metabolism, providing a molecular basis for the discovery of functional biomarkers and therapeutic targets in the microbiome.
Keywords: COPD exacerbation, metagenomic next-generation sequencing, induced sputum microbiome, functional characteristics
Introduction
Chronic obstructive pulmonary disease (COPD) is a chronic disease characterised by persistent airway inflammation and progressive airflow limitation. The course of COPD is punctuated by acute episodes, known as exacerbations, with worsening respiratory symptoms.1 Exacerbations accelerate lung function decline and are an important cause of respiratory failure and mortality.2,3 Current therapies for COPD exacerbations, with bronchodilators, corticosteroids, and antimicrobials, only provide moderate improvement in outcomes.4 Within one year after being discharged from the hospital, nearly 64% of COPD patients will be readmitted, and the risk of death within one year is substantial (prevalence 26.2%).5 Therefore, it is crucial to elucidate the mechanisms underlying COPD exacerbations and identify potential therapeutic targets.
Previous evidence suggests that most COPD exacerbations are due to viral and/or bacterial infections.6 However, a third of COPD exacerbations occur with an unknown precipitating cause.3 Culture-dependent studies found increased bacterial load in patients with stable COPD and identified H. influenzae, Moraxella catarrhalis, and S. pneumoniae as key microbial features of COPD exacerbations.7,8 With the development of 16S rRNA sequencing, respiratory microbiota dysbiosis has been highlighted in COPD exacerbation pathogenesis.9 Besides, the interaction between disease endotype, host inflammation, and airway microbiome alteration has been documented, offering a landscape of airway host–microbiome interactions in COPD patients.10–12 A diverse and balanced respiratory microbiota is essential for respiratory health maintenance and immune homeostasis.13 It may also protect COPD patients from exacerbations.14 While 16S rRNA sequencing has revealed the taxonomic dysbiosis of the microbiota in COPD exacerbations, it fails to elucidate the functional pathways (such as metabolic or signal cascade reactions) that mediate the host–microbe interactions. Moreover, due to the limited knowledge of the functional properties of the microbiome, the mechanism of action of the respiratory microbiome remains inadequately understood. These gaps hinder the identification of implementable therapeutic targets.
Compared with 16S sequencing, metagenomic sequencing can identify species-level and can recognize bacteria, fungi, and viruses. Based on this background, we conducted in-depth profiling of metagenomic sequencing on induced sputum samples from patients with COPD exacerbation or stable stage. We analyzed the species-level and functional characteristics of the airway microbiome, and their correlations with the host immune system. We expected to depict a more comprehensive view of COPD exacerbations and provide novel functional biomarkers for the prediction and targeted microbial interventions of COPD exacerbation.
Materials and Methods
Patients
Study Setting and Study Population
This study aimed to investigate the microbial diversity and functional changes in induced sputum of patients with COPD who visited the Department of Pulmonary and Critical Care Medicine at Jiading District Central Hospital in Shanghai from January 2022 to October 2023. A total of 66 Chinese patients with COPD were consecutively recruited.
COPD exacerbation was defined as a significant worsening of respiratory symptoms within 14 days, exceeding the normal fluctuation range during the stable period. Inpatients with at least two exacerbations in one year were classified into the FE group, while inpatients with only one exacerbation in one year were classified into the IE group. Both the FE group and the IE group constituted the exacerbation group. Outpatients with mild symptoms (cough, expectoration, and shortness of breath) were assigned to the stable group if their attending physician determined that no treatment adjustment was needed.
The study was conducted per the Declaration of Helsinki and approved by the ethics committee of Central Hospital of Jiading District, Shanghai, China (Approval No. 2022K05). Written informed consent was obtained from all participants.
COPD Diagnosis
All the enrolled patients met the diagnostic criteria for COPD (GOLD, 2023). The ratio of forced expiratory volume in one second (FEV1) to forced vital capacity (FVC) after inhaling bronchodilators was less than 70%.15 Pulmonary function was performed in accordance with the manufacturer’s instructions.
Exclusion criteria: (1) Other cardiovascular and pulmonary diseases such as acute pulmonary edema, acute pulmonary embolism, acute heart failure, or arrhythmia; (2) Chronic lung diseases such as bronchial asthma, pulmonary tuberculosis, or interstitial lung disease; (3) Complications such as tumors or autoimmune diseases. (4) Those who cannot complete this trial for other reasons.
Samples
Samples were collected when the patients came to the hospital. Fresh sputum samples were submitted for bacterial and fungal culture. Before the induction sputum collection begins, the patient should clear the nasal passages and perform deep coughing. If there is any sputum at this time, it should be expectorated and discarded. Then, rinse the mouth with normal saline. Any sputum expectorated within five minutes of nebulization should be discarded. After the nebulization time exceeds five minutes, rinse the mouth with normal saline again and instruct the patient to cough deeply and forcefully. If there is sputum at this time, it should be expectorated into a sterile container for examination. If there is no sputum or the amount of sputum is insufficient (<1g), rinse the mouth with normal saline and continue nebulization. Repeat the above process until the expectorated sputum volume is ≥1 g. After nebulization, the induced sputum was placed in a DNA-free tube, stored in a refrigerator at −80 °C, and then transferred to Novogene Co, Ltd for DNA extraction, metagenome sequencing, and bioinformatics analysis. Sixty-eight samples from the 66 patients were collected in total. Fifteen samples did not pass the DNA extraction or the pre-analysis quality control. Thus, 53 samples were included in further metagenome sequencing. Four samples were excluded due to either inadequate non-human reads (<300,000) or high background microbial content (>30%). Finally, this study included 49 samples from 47 patients for subsequent analysis.
Clinical Characteristic Measurement
For each sample, basic demographic information (age, gender, body weight, height, BMI), smoking history, and symptom scores (CAT Score, mMRC) were obtained. All clinical tests were performed in the laboratory at Jiading District Central Hospital in Shanghai. The blood sample was collected for further tests, including complete blood count (white blood cell (WBC) counts, neutrophil percentage (N%), lymphocyte percentages (L%), etc)., blood gas analysis (PaCO2, PaO2, and SPO2), blood biochemistry analysis (total protein, albumin and prealbumin), IL-6, IL-8, TNF-α, PCT, CRP, T cell ratio (CD3, CD4, CD8, and CD4/CD8) and D-dimer. Patients in the stable group underwent 6-minute walking test (6MWT) monitoring during their outpatient visits, while patients in the AECOPD group completed the 6MWT after admission, when their clinical symptoms were stable and within 48 hours before discharge.
DNA Extraction and Metagenome Sequencing
The nucleic acid was extracted using QIAamp® DNA Microbiome Kit (Cat.:51704, QIAGEN, Germany) according to the manufacture instructions and DNA elution was performed with enzyme-free water. Each batch was analyzed through Agilent 5400 Fragment Analyzer to assess background contamination associated with the DNA extraction kit and monitor DNA concentration and purity. DNA extracted from the blood sample for the negative control was also subjected to library preparation and sequencing. The genomic DNA was subjected to library construction and then sequenced on NovaSeq 6000 (Illumina, USA), generating 150 bp paired-end reads (the raw data of each sample was ≥12G).
Data Processing
Readfq (V8, https://github.com/cjfields/readfq) was used to remove reads with low quality, adapter contamination, and N bases reaching a certain proportion (default length is 10 bp). Human sequence data were identified and excluded by Bowtie2 (Version: 2.2.4) (parameters: –end-to-end, –sensitive, -I 200, -X 400).16–18 Samples with <500 Mb data were subject to re-sequencing with higher sequencing depth to achieve adequate reads. The non-human reads were assembled using MEGAHIT (v1.0.4). A total of 3,918,776 contigs >300 bp from 49 samples were generated, constituting a total contig length of 5,242,257,647bp (MeanN50 = 2,050bp, Median N50=1,720bp). Open reading frames were predicted from contigs using MetaGeneMark (Version 2.10). A non-redundant gene catalog was conducted using CD-HIT (Version: 4.5.8) (parameters: -c 0.95, -G 0, -aS 0.9, -g 1, -d 0).19,20 Clean data from each sample were aligned to the initial gene catalog by using Bowtie2 (Version: 2.2.4) to calculate the number of reads of the genes on each sample alignment. Genes with reads ≤2 in each sample are filtered out to finally determine the gene catalog (Unigenes) for subsequent analysis.
Based on the number of reads aligned and the length of the gene, the abundance of each gene in each sample is calculated by the following formula: r is the number of gene reads on alignment, and L is the length of the gene.

Taxonomic and Functional Profiling
Reads-based taxonomic profiling was performed using Kraken version 2.0.8-beta (--confidence 0.0) and Bracken (default setting) with the standard plus fungi (RefSeq complete fungal genomes/proteins) and protozoa database (RefSeq complete protozoan genomes/proteins). Low-abundance species (at least two read counts in less than 11% of the samples) and species with relative abundances in negative control >0.001 were filtered out for downstream taxonomic profiling.
DIAMOND software (V0.9.9.110, https://github.com/bbuchfink/diamond/) was used for alignment of Unigenes sequences with those of bacteria, fungi, archaea, and viruses extracted from NCBI’s NR database (Version 2018–01-02, https://www.ncbi.nlm.nih.gov/), with parameter settings: blastp, evalue≤1e-5. Unigenes that could not be mapped to any microorganism were excluded from subsequent functional profiling.17,21 DIAMOND software (v0.9.9, https://github.com/bbuchfink/diamond/) aligned Unigenes with those in the functional database, with parameter settings: blastp, -e 1e-5. Functional databases include the KEGG database (Version 2018–01-01),22,23 the eggnog database (Version 4.5), and the CAZy database (Version 201801). The KEGG pathway database organizes biological pathways into a three-level hierarchical structure. Level-1 pathways represent the broadest functional categories (eg, Metabolism), Level-2 pathways categorize these into specific sub-groups (eg, Lipid metabolism), and Level-3 pathways refer to the specific molecular pathways (eg, Fatty acid biosynthesis). From the alignment results of each sequence, the Best Blast Hit results are selected for subsequent analysis. The relative abundance at different functional levels is calculated (the relative abundance at each functional level is equal to the sum of the relative abundance of genes annotated as that functional level).
Statistical Analysis
Baseline clinical characteristics were summarized using descriptive statistics. Continuous variables were presented as mean ± standard deviation for normally distributed data or median [interquartile range] for non-normally distributed data. Categorical variables were presented as n (%).
Non-parametric tests were employed in this study because microbial abundance data are highly skewed, which violates the normality assumption required for parametric tests. Additionally, non-parametric tests are robust to outliers and extreme values that are prevalent in metagenomic sequencing data.
R was used to perform statistical analyses. Raw taxonomic abundance data were used for α-diversity calculation. Samples were randomly subsampled to the smallest library size using the phyloseq package for other microbiome analyses. Vegan package was used for taxonomic Shannon diversity calculation, Simpson diversity calculation and permutational multivariate analysis of variance (PERMANOVA). Principal coordinate analysis (PCoA) of Bray–Curtis distances was done by the ape package. LEfSe analysis (padjust<0.01, CPM normalized) was conducted by the microeco package to analyze the read count matrix of the microbiome and functional abundance table of the KEGG, eggNOG, and CAZy databases.
The enrichment analysis of significant functional categories (selected by Kruskal–Wallis test) was based on the hypergeometric distribution test. The correlation between clinical indicators and sputum microbiome/functional markers was evaluated by the Spearman rank correlation coefficient. To control the false positives caused by multiple hypothesis testing, the Benjamini–Hochberg method was applied to correct the p-values of all relevant analyses. Except for the LEfSe analysis, which adopted a more stringent threshold of a corrected padjust < 0.01, all other statistical tests were considered statistically significant when the corrected p < 0.05.
Results
Demographic Data
A total of 47 patients with COPD were recruited in the final analysis, including 17 in the stable group and 30 in the AECOPD group. The AECOPD group was further divided into the FE (n=16) and IE (n=14) subgroups Baseline characteristics are summarized in Table 1, with additional details provided in Supplementary Table S1. Compared with the stable group, patients in the AECOPD group had more severe disease, as evidenced by higher CAT and mMRC scores, lower FEV1% predicted values, and shorter 6-minute walking test. They also exhibited more pronounced systemic inflammation, with higher WBC counts, N%, CRP, and D-dimer levels, and lower L% and CD4/CD8 ratios. Nutritional status was also poorer in the AECOPD group, with lower albumin levels. Within the AECOPD group, patients in the FE subgroup had higher CAT scores, lower CD4/CD8 ratios, and higher PaCO2 levels than those in the IE subgroup. No other clinically significant differences were observed between the two subgroups.
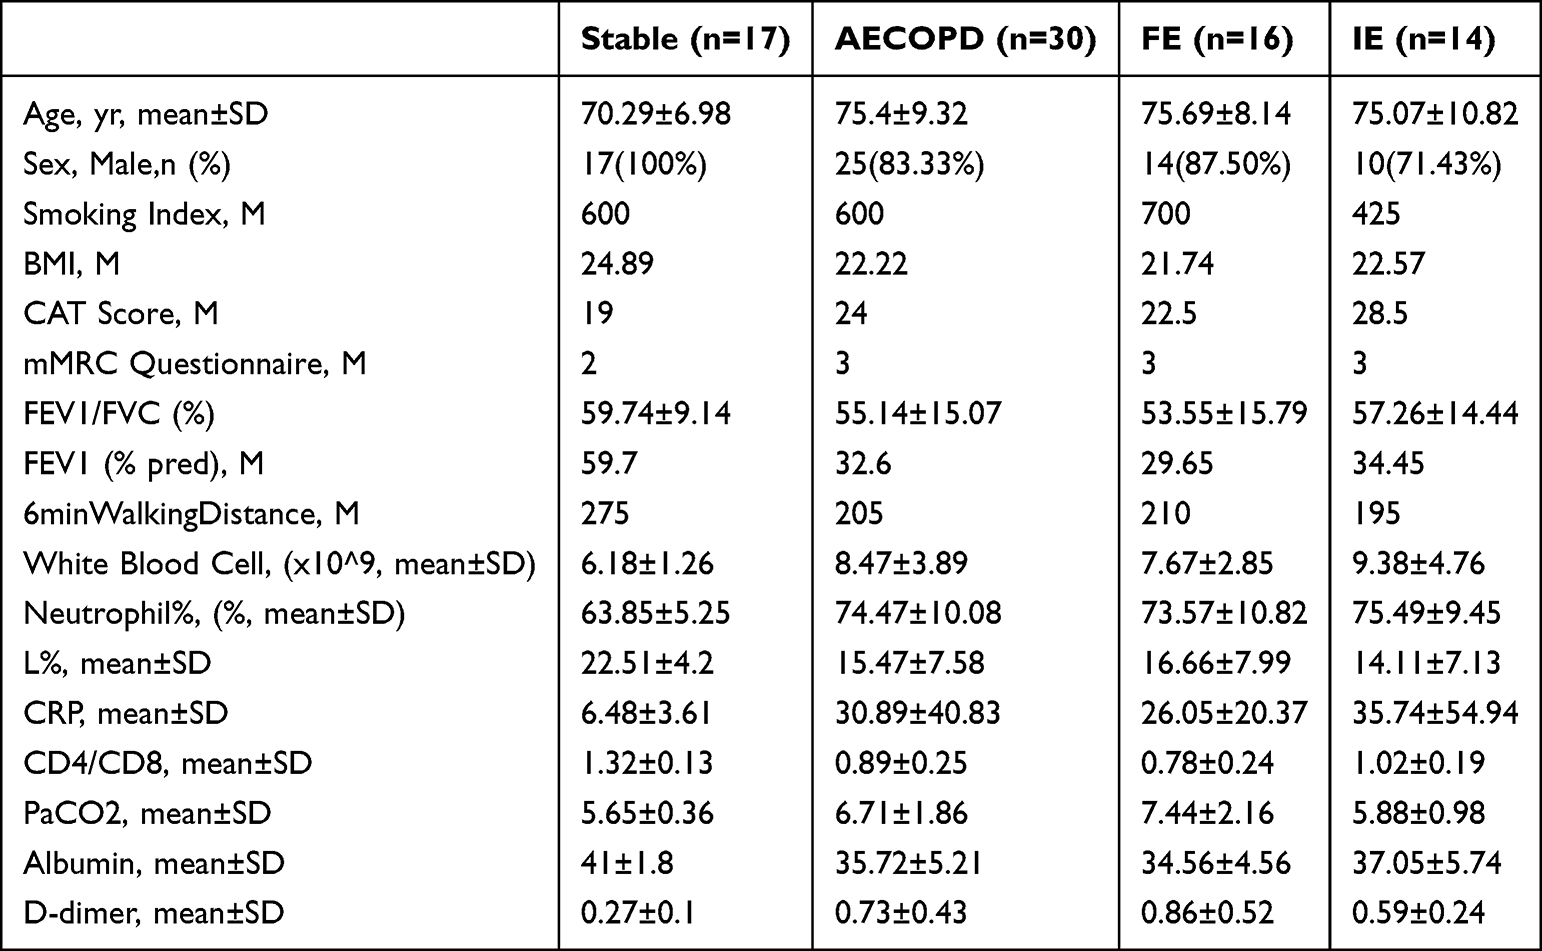 |
Table 1 Baseline Clinical Characteristics of Patients with Stable and Exacerbation-Stage COPD. Data Were Presented as Mean±SD, Median, or n (%) |
Characterization of the Sputum Microbiome in the Stable and Exacerbation Groups
After filtering out reads mapped to the Homo sapiens genome, a total of 8,342 bacterial, 386 archaeal, 126 eukaryotic and 823 viral species were identified, along with 1,864 bacterial, 141 archaeal, 68 eukaryotic and 447 viral genera across the 49 induced sputum samples. Only features presented in at least six samples with a minimum read count of two were retained for downstream composition analysis.
The relative abundances of the top 30 genera and species in the sputum from the stable group and the exacerbation group (including FE and IE subgroups) are shown in Figure 1A and B. At the genus level, Streptococcus and Rothia were dominant in both groups (stable: 25.1% and 11.9%; exacerbation: 25.2% and 13.1%), whereas Pseudomonas (0.1% VS 5.0%) and Corynebacterium (1.6% VS 4.2%) were all significantly enriched in the AECOPD group than in the stable group. Haemophilu (2.9% VS 1.1%) and Neisseria (10.5% VS 1.9%) were significantly enriched in the stable group, Figure 1A). At the species level, Pseudomonas aeruginosa (0.03% VS 4.9%) and Corynebacterium striatum (0.003% VS 3.4%) were enriched in the AECOPD group, showing significant intergroup differences. Haemophilus parainfluenzae (2.7% VS 0.9%), Neisseria sicca (3% VS 0.5%), and Neisseria mucosa (2.7% VS 0.4%) were enriched in the stable group (Figure 1B).
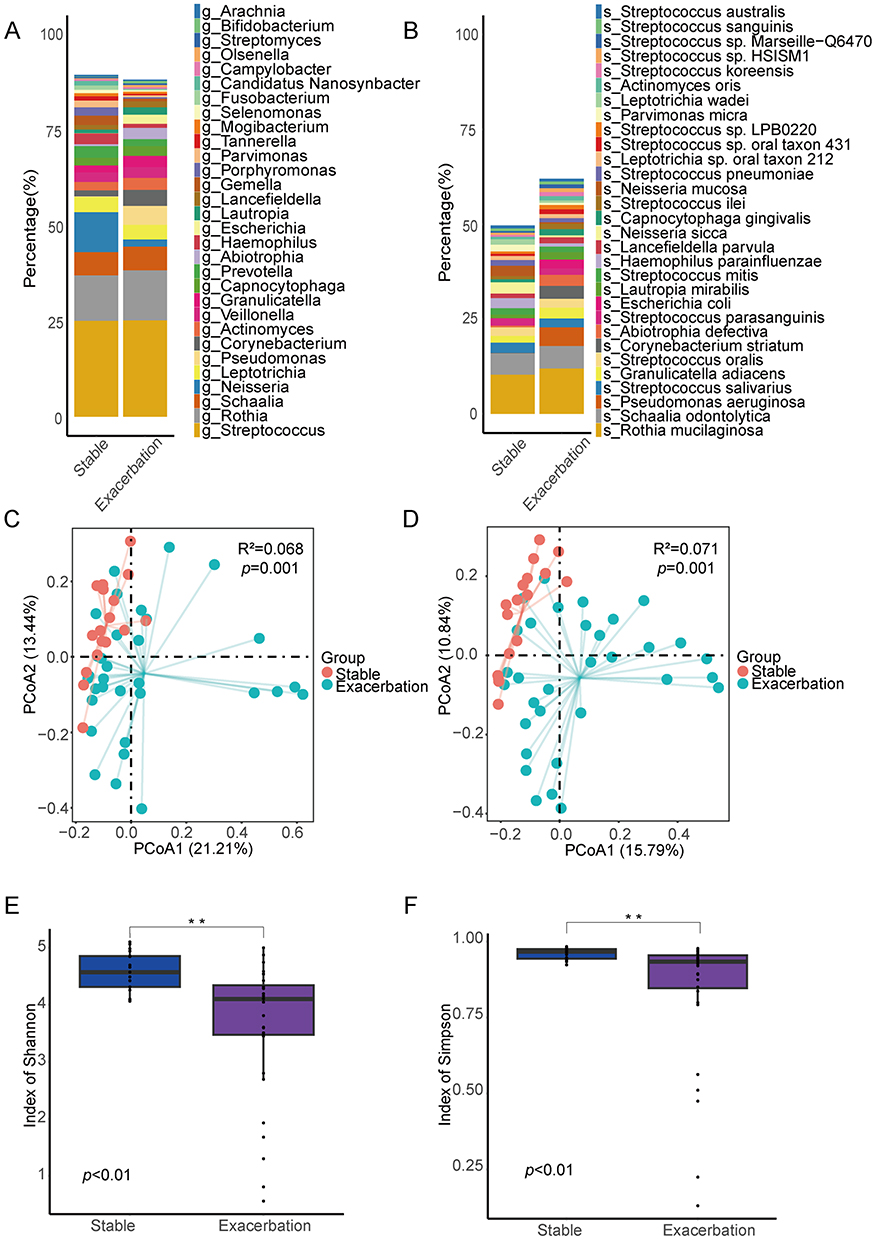 |
Figure 1 Airway microbe community structure for patients with COPD Stable and Exacerbation groups. Relative abundance of top30 dominant genera (A) and species (B). Beta diversity assessed by principal coordinates analysis (PCoA) of genera (C) and of species (D). Alpha diversity measured by Shannon index (E) and by Simpson index (F). **p < 0.01. |
PCoA revealed significant differences in the sputum microbiota at both the genus level and species level between the two groups (genus level: R2 = 0.068, p = 0.001, Figure 1C; species level: R2 = 0.071, p = 0.001, Figure 1D). Additionally, α-diversity analysis was conducted to assess the richness and evenness of the microbiota. The Simpson index and Shannon index of the stable group were significantly higher than those of the exacerbation group (p < 0.01), suggesting a higher microbial diversity in the stable group (Figure 1E and F).
Representative Microbial Markers for Stable and Exacerbation Patients
To identify differential microbial biomarkers between the stable and exacerbation groups at both the genus and species levels, we performed Linear Discriminant Analysis Effect Size (LEfSe) analysis. Features with an LDA score higher than two were defined as representative biomarkers.24 The representative genera and species in each group are shown in Figure 2.
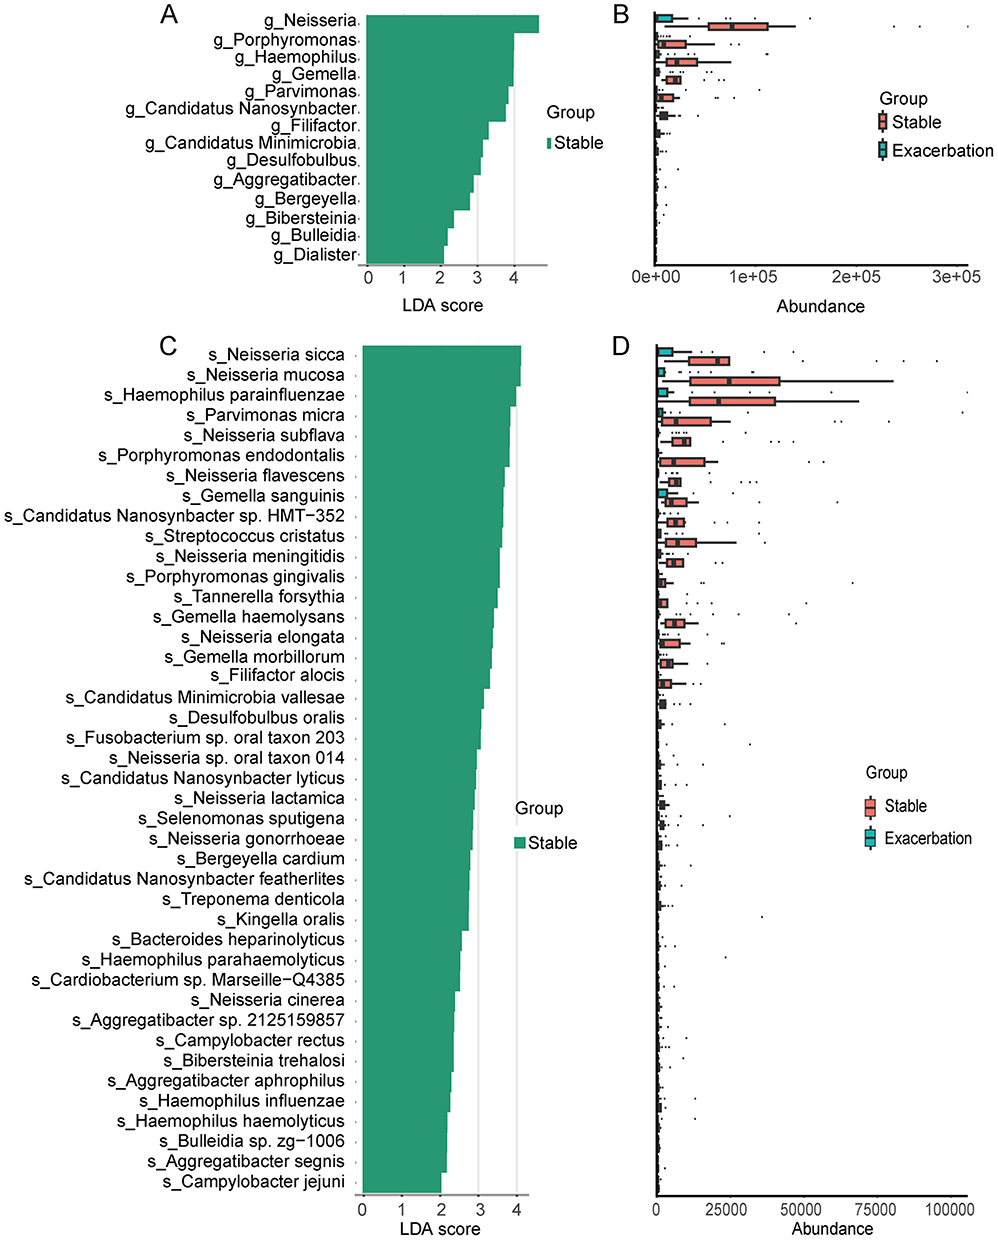 |
Figure 2 LEfSe analysis of sputum microbiota in patients with stable COPD and AECOPD. (A) LDA score distribution of significantly discriminative genera between the two groups (LDA>2). (B) Relative abundances of the genera identified as significantly different. (C) LDA score distribution of significantly discriminative species between the two groups (LDA>2). (D) Relative abundances of the significantly different species. |
In terms of genera, the abundance (CPM-normalised) of Neisseria, Porphyromonas, Haemophilus, Gemella, Parvimonas, etc, were significantly increased in the stable group (Figure 2A and B). As for species, Neisseria sicca, Neisseria mucosa, Haemophilus parainfluenzae, Parvimonas micra, Neisseria flavescens, etc, were also significantly enriched in the stable group (Figure 2C and D).
KEGG Functional Profiles of the Sputum Microbiome in the Stable and Exacerbation Groups
The KEGG orthologs (KOs) reached a plateau, indicating that this study’s sample size and sequencing depth were sufficient (Figure 3A). Among the annotated functions, metabolism accounted for the highest proportion (13.6%), followed by genetic information processing (4.80%), environmental information processing (4.17%), cellular processes (2.68%), human diseases (2.03%), and organismal systems (0.867%). The most abundant KEGG level-2 pathways included carbohydrate metabolism, amino acid metabolism, metabolism of cofactors and vitamins, membrane transport, and glycan biosynthesis and metabolism (Figure 3B).
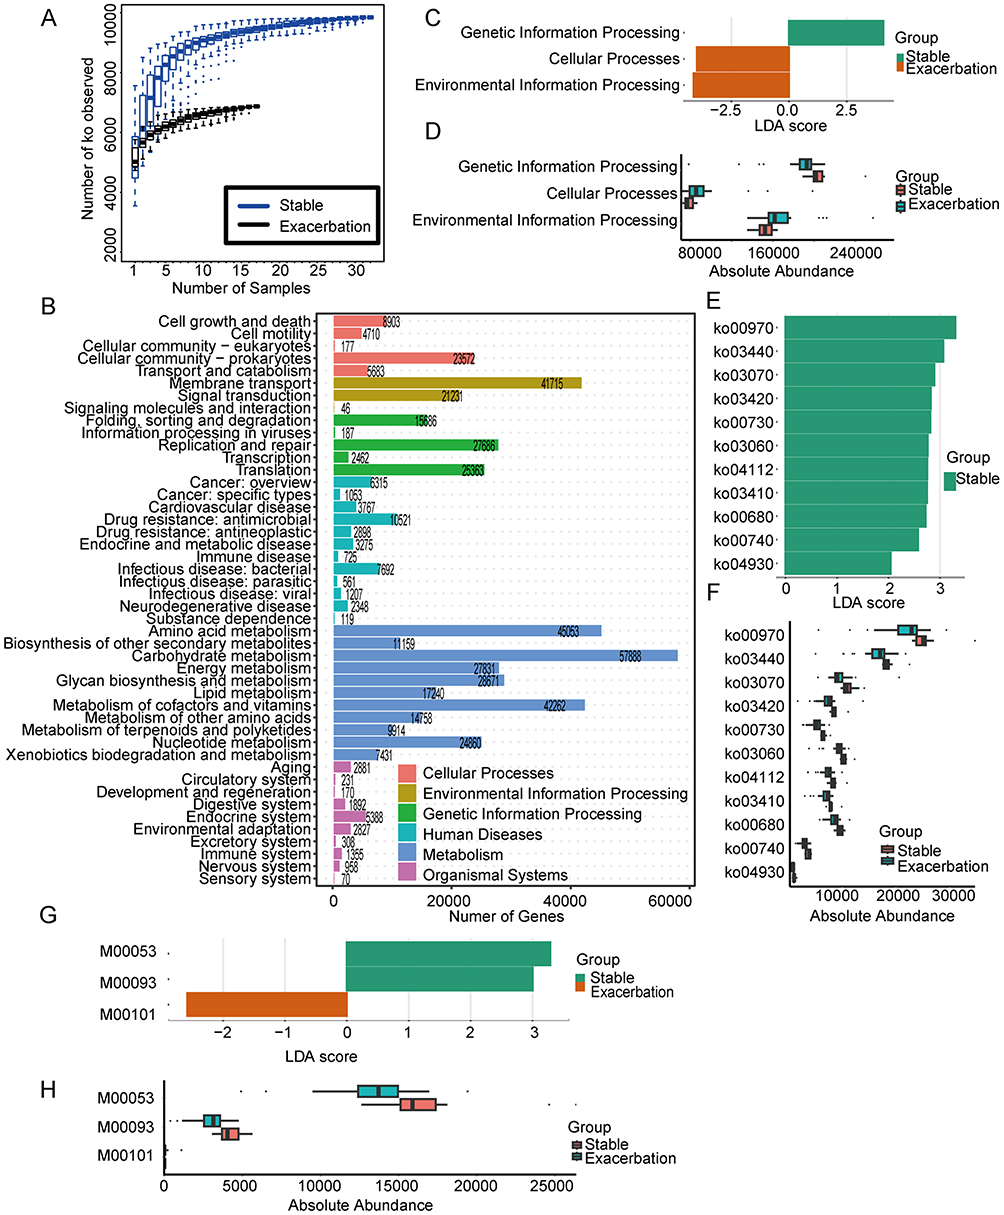 |
Figure 3 Functional characterization of the airway microbiome based on KEGG annotation. (A) Rarefaction curves of KEGG orthologs (KOs) across samples. (B) Distribution of KEGG level-1 and level-2 functional categories. LDA score distribution (LDA>2) (C) and relative abundances (D) of significantly enriched KEGG level-1 pathways. LDA score distribution (LDA>2) (E) and relative abundances (F) of significantly enriched KEGG level-3 pathways. LDA score distribution (LDA>2) (G) and relative abundances (H) of significantly enriched KEGG modules. |
Using an adjusted p-value (padj) < 0.01 and an LDA score > 2 as thresholds, differentially abundant KEGG pathways are shown in Figure 3C–F. LEfSe analysis revealed that environmental information processing, genetic information processing, and cellular processes contributed significantly to the differences between stable and exacerbation groups (Figure 3C and D). Pathways related to genetic information processing were more enriched in the stable group, whereas environmental information processing and cellular processes were more prominent in the exacerbation group. No significant differences were found at level-2 pathways.
With regard to level-3 pathways, 11 pathways were significantly enriched in the stable group, including ko00970, ko03440, ko03070, ko03420, ko00730, ko03060, ko04112, ko03410, ko00680, ko00740 and ko04930 (Figure 3E), whose CPM-normalized abundances are shown in Figure 3F. Enrichment analysis based on the hypergeometric test further identified 35 enriched level-3 pathways (Supplementary Figure S1A). Among these, a total of nine pathways, namely ko00970 (Aminoacyl-tRNA biosynthesis), ko04112 (Cell cycle – Caulobacter), ko03420 (Nucleotide excision repair), ko03440 (Homologous recombination), ko03060/ko03070 (Protein export), ko03410 (Base excision repair), ko04930 (Type II diabetes mellitus) and ko00680 (Methane metabolism) overlapped with the LEfSe analysis. In addition, KEGG modules M00053 and M00093 were selected by LEfSe analysis as functional biomarkers for the stable group, and M00101 for the exacerbation group (Figure 3G and H). Twenty-eight significantly enriched KEGG modules were chosen by enrichment analysis (Supplementary Figure S1B), among which M00053 (Deoxyribonucleotide biosynthesis, ADP/GDP/CDP/UDP ≥ dATP/dGTP/dCTP/dUTP) and M00093 (Phosphatidylethanolamine (PE) biosynthesis, PA ≥ PS ≥ PE) were also recognized as biomarkers in the LEfSe analysis.
eggNOG Functional Profiles of the Sputum Microbiome in the Stable and Exacerbation Groups
The accumulation curve of Orthologous Groups (OGs) approached a plateau, indicating that the current sample size and sequencing depth in this study were sufficient to analyze the majority of the functional profile (Figure 4A). Among the annotated functions, S: Function unknown accounted for the highest proportion (27.6%), followed by L: Replication, recombination and repair (9.73%), M: Cell wall/membrane/envelope biogenesis (8.57%), K: Transcription (6.63%) and G: Carbohydrate transport and metabolism (6.44%) (Figure 4B).
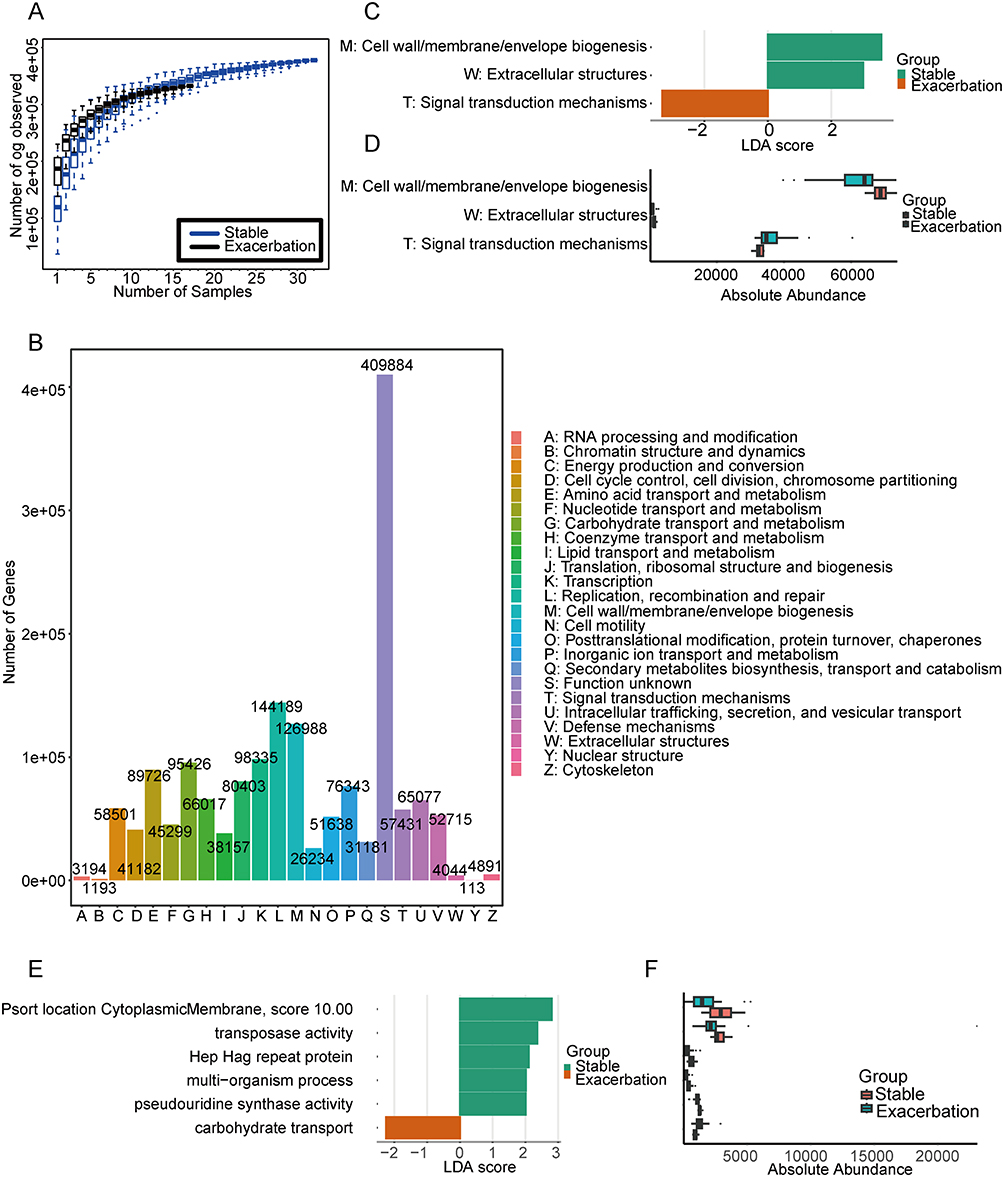 |
Figure 4 Functional characterization of the airway microbiome based on eggNOG annotation. (A) Rarefaction curves of Orthologous Groups (OGs) across samples. (B) Distribution of eggNOG level-1 functional categories. LDA scores distribution (LDA>2) (C) and relative abundances (D) of significantly enriched eggNOG level-1 pathways. LDA scores distribution (LDA>2) (E) and relative abundances (F) of significantly enriched eggNOG level-2 pathways. |
Functional features were further analyzed using LEfSe, with results shown in Figure 4C–F. Genes associated with M: Cell wall/membrane/envelope biogenesis, T: Signal transduction mechanisms and W: Extracellular structures were identified as significantly different (padj<0.01, LDA>2) (Figure 4C and D). Specifically, M: Cell wall/membrane/envelope biogenesis and W: Extracellular structures were enriched in the stable group, while T: Signal transduction mechanisms was more prominent in the exacerbation group. Enrichment analysis revealed nine eggNOG level-1 pathways with different abundance in two groups (Supplementary Figure S2), among which M: Cell wall/membrane/envelope biogenesis was consistent with the LEfSe analysis.
At the eggNOG level-2 functional profiles, characteristic functional biomarkers in the stable group included Psort location Cytoplasmic Membrane (score 10.00), Transposase activity, Hep Hag repeat protein, multi-organism process, and pseudouridine synthase activity involved in multiple biological processes. In contrast, carbohydrate transport was identified as the predominant functional biomarker in the exacerbation group (Figure 4E and F).
Correlation Between the Sputum Microbiome of COPD Patients and Clinical Indices
We further analyzed the correlations between microbial/functional biomarkers and clinical indicators (Figure 5). These clinical indicators covered multiple dimensions, including demographic characteristics (eg, age, BMI, smoking history), laboratory tests (including inflammatory markers, nutritional proteins, and immune cell profiles), pulmonary function (eg, FEV1%, FEV1/FVC, 6-min walking distance), and quality of life assessments (eg, COPD Assessment Test (CAT) and the modified Medical Research Council (mMRC) dyspnoea scale. A complete list of all indicators is provided in Figure 5.
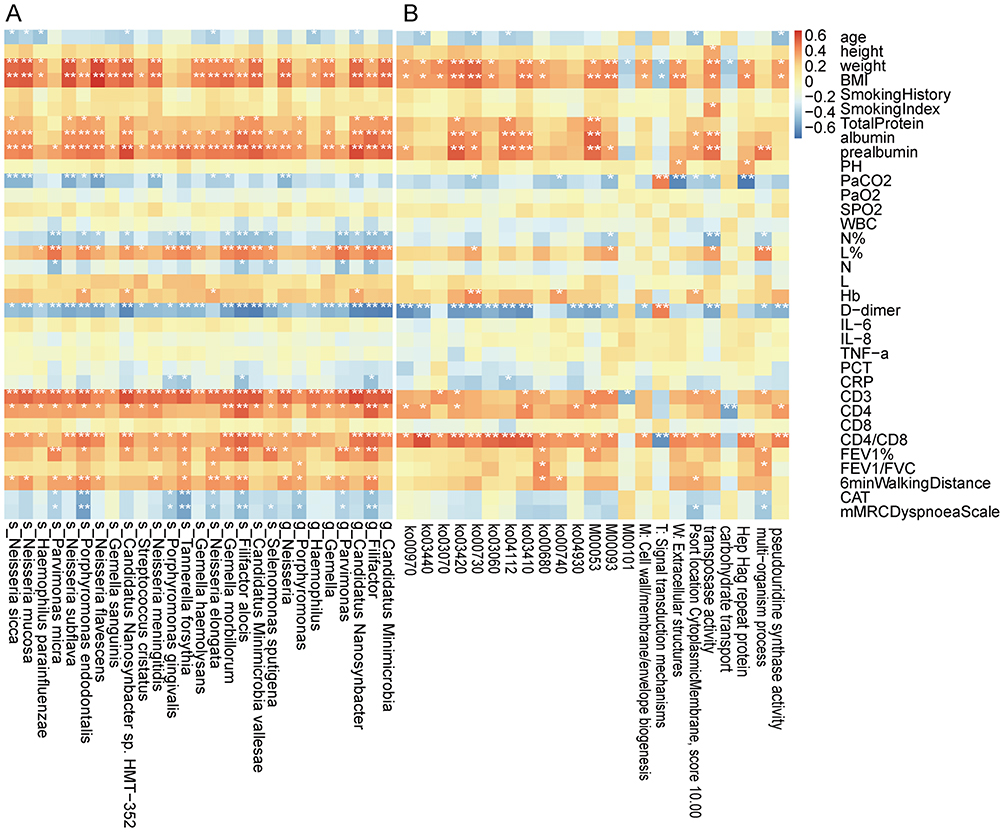 |
Figure 5 Spearman correlation analysis between sputum microbiome/functional biomarkers and clinical indices in COPD patients. (A) Correlation matrix heatmap showing the relationships between microbiome and the clinical indices. (B) Correlation matrix heatmap showing the relationships between functional biomarkers and the clinical indices. *p < 0.05, **p < 0.01. |
Spearman correlation analysis showed that age, PaCO2, N%, N, D−dimer, CRP, CAT and mMRC dyspnoea scale were negatively correlated with several microbial biomarkers (genus/species level, relative abundance proportion > 0.001) and functional biomarkers (KEGG level-3 pathways, KEGG modules, and eggNOG pathways). In contrast, weight, BMI, nutritional markers (total protein, albumin, prealbumin), L%, hemoglobin, T cell subsets (CD3, CD4, CD4/CD8), and pulmonary function (FEV1%, FEV1/FVC and 6-minute walking distance) were generally positively correlated with both types of biomarkers (Figure 5A and B).
Characterisation of the Sputum Microbiome in the IE and FE Groups
The composition and diversity of the sputum microbiota were compared between the IE group and FE group, as shown in Figure 6. At the genus level, the two groups shared a similar dominant microbial structure, primarily consisting of Streptococcus (26.1%), Rothia (11.6%), and Schaalia (6.90%) (Figure 6A). At the species level, Rothia mucilaginosa (10.8%) and Schaalia odontolytica (6.64%) were predominant in both groups (Figure 6B). PCoA revealed no significant difference in sputum microbiota between the two groups at either the genus level (R2 = 0.0221, p >0.05; Figure 6C) or the species level (R2 = 0.0228, p >0.05; Figure 6D). Furthermore, α-diversity analysis showed no significant differences in the Simpson and Shannon indices between the IE and FE groups (Figure 6E and F).
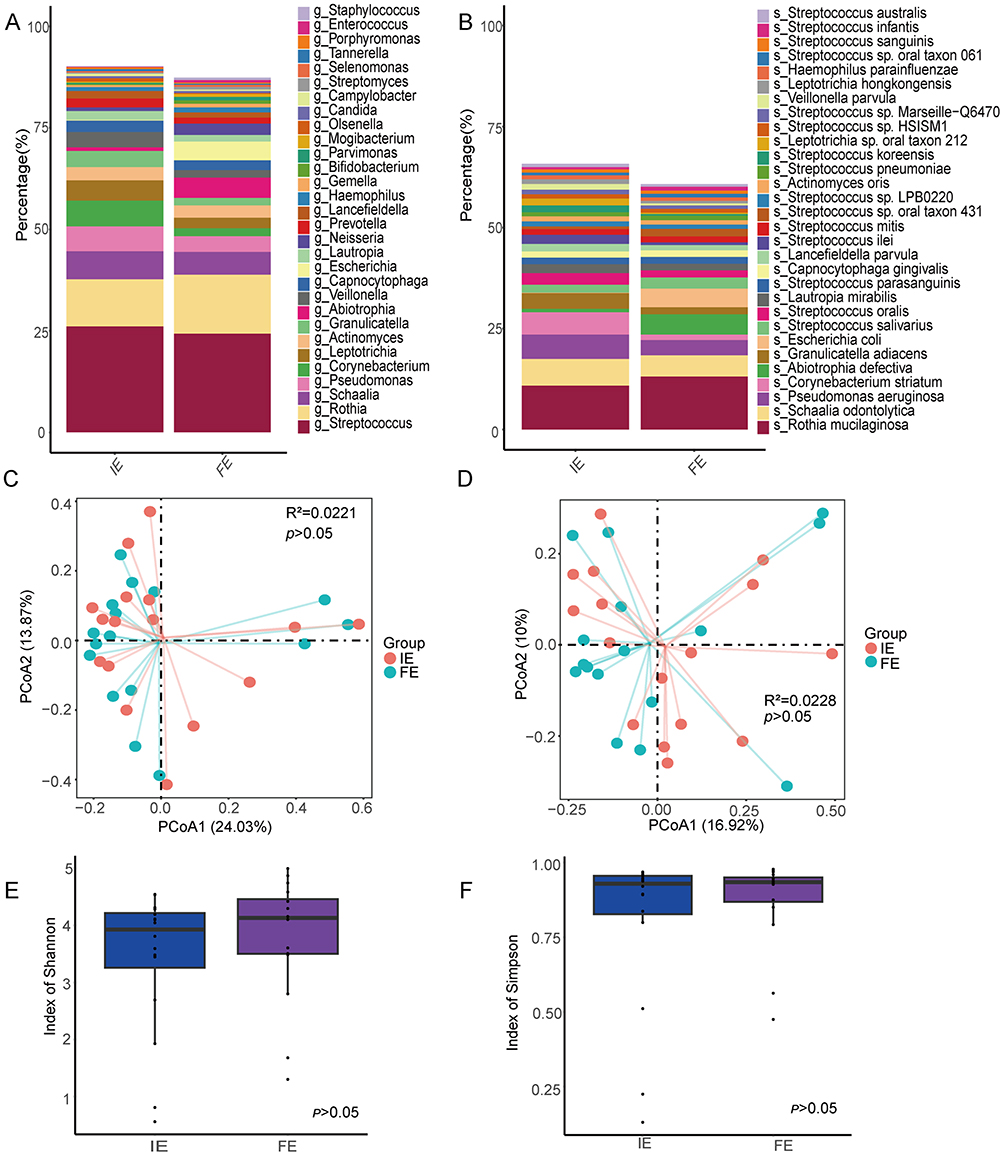 |
Figure 6 Airway microbe community structure for patients with COPD exacerbation in IE and FE groups. Relative abundance of top30 dominant genera (A) and species (B). Beta diversity assessed by principal coordinates analysis (PCoA) of genera (C) and of species (D). Alpha diversity measured by Shannon index (E) and by Simpson index (F). |
Representative Markers for the IE and FE Groups
No significant microbial markers were found in LEfSe analysis for these two groups. LEfSe also analyzed functional profiles. No significant features were found in the KEGG or eggNOG databases.
Discussion
In this study, we conducted a detailed analysis of the dysregulated characteristics of the airway microbiome in patients with chronic obstructive pulmonary disease (COPD) during the acute exacerbation phase through deep metagenomic sequencing. The results revealed a significant reduction in α-diversity at the species level during exacerbation compared with the stable group, consistent with several previous reports analyzing sputum or bronchoalveolar lavage fluid from COPD exacerbation patients.25 This supplemented the previous studies that mainly used 16S sequencing and provided higher-resolution species information through metagenomic sequencing. Notably, there are differences in conclusions regarding changes in α-diversity across studies. The COPDMAP study26 and the AERIS study27 in the UK reported comparable α-diversity between baseline and exacerbation samples. This may be due to population heterogeneity, treatment regimens, or differences in the coverage depths of functional genes by metagenomic sequencing. Emerging studies have begun to assess correlations between frequent exacerbation phenotypes and microbiome characteristics, either during exacerbation28 or during clinically stable periods, despite partly inconsistent conclusions across cohorts.29–32 Our analysis found no significant difference in α-diversity between the IE and FE groups during exacerbation. This may imply that there is a common, inflammation-related microbial ecological disturbance pattern at the onset of the exacerbation, and that subsequent antibacterial treatment factors may drive differentiation between subgroups. This hypothesis requires further longitudinal studies with a larger sample size and consistent grouping standards to verify through dynamic monitoring of the changes in microbial genomes and transcriptomes before and after the use of antibacterial drugs.
We further revealed the potential impact of microbiome dysregulation at the molecular functional level. A distinct shift in microbial composition was observed during exacerbation in COPD patients. Haemophilus parainfluenzae is a respiratory colonization flora that may cause invasive opportunistic infections when the host’s immunity is compromised or the microbiota is imbalanced.33,34 In our study, the positive correlation between its abundance and CD4/CD8 ratio suggests that changes in the composition of airway bacterial colonization might be related to alterations in the host’s immune response and the intensification of inflammatory status, thereby potentially increasing the risk of disease exacerbation. Notably, several opportunistic pathogenic bacteria, such as Pseudomonas aeruginosa, Corynebacterium striatum, and Escherichia coli, exhibited numerically higher mean abundances in the AECOPD group (Figure 1A and B). Pseudomonas aeruginosa is an opportunistic pathogen associated with increased mortality and readmission risk in COPD patients.35 A prospective study from Hong Kong involving 327 Chinese patients with COPD suggested that Pseudomonas aeruginosa may be an independent risk factor for moderate to severe COPD exacerbation.36 However, these taxa were not identified as differential biomarkers by LEfSe. This discrepancy likely reflects the pronounced intra‑group heterogeneity characteristic of AECOPD, wherein only a subset of patients harbors high pathogen loads. Future studies should therefore adopt precision‑oriented approaches.
At the functional level, LEfSe and enrichment analysis identified methane metabolism (ko00680) as significantly decreased in the AECOPD group compared with the stable control group. Methane is an organic gas molecule produced in both mammalian cells and methanogenic flora.37 It is believed to have the potential to regulate smooth muscle activity, oxidative stress, and inflammation in the gastrointestinal tract and its content is positively correlated with obesity.38,39 Methane‑rich saline (MS) effectively repaired lung ischemia‑reperfusion injury (LIRI) and suppressed oxidative stress, inflammatory cytokines, and apoptosis.40 The findings of this study are the first to suggest that methane derived from airway microbiota may act as a local gas signaling molecule, participating in maintaining the homeostasis of the respiratory system and exerting anti-inflammatory or cell-protective effects in the pulmonary micro-environment, thereby contributing to the progression of COPD. The specific mechanism may be achieved by inhibiting NLRP3 inflammasome activation or regulating mitochondrial function.41 Therefore, the “methane metabolism” pathway is not only a functional biomarker for distinguishing disease states, but also a potential molecular target worthy of in-depth exploration that connects microbial activities with the host’s pulmonary inflammatory state. Targeting methane‑associated microbial networks may therefore represent a novel strategy for restoring immune–microbiome balance in COPD.
In addition, other enriched pathways revealed by LEfSe analysis depict the stress characteristics of the pulmonary microenvironment during the exacerbation period at the molecular level. The stable period microbiota enriches basic physiological pathways such as aminoacyl-tRNA biosynthesis and protein export, suggesting that it is in an environment capable of maintaining normal metabolic activities. In contrast, during the acute exacerbation period, the microbiota shows significant activation of pathways related to DNA damage repair (such as nucleotide excision repair and homologous recombination), which is likely due to the genotoxic stress caused by the acute increase in oxidative stress in the lungs.42 These findings collectively indicate that AECOPD is not only a change in microbiota composition but also accompanied by a profound reprogramming of the overall physiological state of the microbial community, shifting from a “growth mode” to a “stress survival mode”.43 The differences in pathway annotations such as “Type 2 diabetes” may suggest that the intrinsic signal transduction and metabolic regulatory networks of the microbiota have undergone corresponding adjustments when sensing and adapting to the nutritional changes in the microenvironment caused by host inflammation.44
This study has several limitations. Firstly, its small-cross-sectional study limits causal inference. Future studies should conduct larger-sample longitudinal cohort studies to reduce sampling bias, adjust confounding factors, and explore causal relationships. Secondly, although the human DNA was removed through a bioinformatic method, its high content in sputum inevitably impacts the depth of metagenome sequencing and the sensitivity of detecting low-abundance but key functional genes. In the future, it is necessary to combine macro-transcriptomics and metabolomics to directly measure the expression activity of functional genes and their metabolites (such as short-chain fatty acids, methane) in the airways, and use in vitro co-culture models or organoids to verify the direct impact of specific microbial metabolic pathways (such as methane production) on the functions of respiratory epithelial cells and immune cells.
Conclusion
This metagenomics-based study revealed significant dysregulation of the airway microbiome in AECOPD patients across species diversity, community structure, and functional metabolism. It also identified microbial and functional markers closely related to the disease severity. Compared with the stable group, the reduction of the methane metabolism pathway during the exacerbation phase suggests that it may play a potential role in maintaining immune homeostasis. These findings provide a new perspective on the microbial mechanisms underlying acute exacerbations of COPD and offer potential biomarkers for future development of microbiome-based prediction or intervention strategies.
Ethical Approval and Consent
The study was conducted per the Declaration of Helsinki and approved by the ethics committee of Central Hospital of Jiading District, Shanghai, China (Approval No. 2022K05). Written informed consent was obtained from all participants.
Acknowledgments
Thanks to Jiading District Central Hospital Affiliated Shanghai University of Medicine & Health Sciences for all the support provided.
Funding
This research was funded by the Chronic Obstructive Pulmonary Disease (COPD) Screening, Diagnosis and Treatment, and Network-based Management-Clinical Specialty Capacity Enhancement Training Project (Hospital-level, grant number JZXLCZK-2024-06), and Jiading District Health Commission of Shanghai for a study investigating the diversity of airway microbiota in patients with frequent acute exacerbations of chronic obstructive pulmonary disease (COPD) (grant number 2021-QN-3).
Disclosure
The authors report no conflicts of interest in this work.
References
1. Vogelmeier CF, Criner GJ, Martinez FJ, et al. Global strategy for the diagnosis, management, and prevention of chronic obstructive lung disease 2017 report. GOLD executive summary. Am J Respir Crit Care Med. 2017;195(5):557–16. doi:10.1164/rccm.201701-0218PP
2. Dransfield MT, Kunisaki KM, Strand MJ, et al. Acute exacerbations and lung function loss in smokers with and without chronic obstructive pulmonary disease. Am J Respir Crit Care Med. 2017;195(3):324–330. doi:10.1164/rccm.201605-1014OC
3. MacIntyre N, Huang YC. Acute exacerbations and respiratory failure in chronic obstructive pulmonary disease. Proc Am Thorac Soc. 2008;5(4):530–535. doi:10.1513/pats.200707-088ET
4. Dobler CC, Morrow AS, Farah MH, et al. Pharmacologic and nonpharmacologic therapies in adult patients with exacerbation of COPD: a systematic review. AHRQ Comparat Effect Rev. 2019.
5. Lindenauer PK, Dharmarajan K, Qin L, Lin Z, Gershon AS, Krumholz HM. Risk trajectories of readmission and death in the first year after hospitalization for chronic obstructive pulmonary disease. Am J Respir Crit Care Med. 2018;197(8):1009–1017. doi:10.1164/rccm.201709-1852OC
6. Ball P. Epidemiology and treatment of chronic bronchitis and its exacerbations. Chest. 1995;108(2):43S–52S. doi:10.1378/chest.108.2_Supplement.43S
7. Hill AT, Campbell EJ, Hill SL, Bayley DL, Stockley RA. Association between airway bacterial load and markers of airway inflammation in patients with stable chronic bronchitis. Am J Med. 2000;109(4):288–295. doi:10.1016/s0002-9343(00)00507-6
8. Sethi S, Evans N, Grant BJ, Murphy TF. New strains of bacteria and exacerbations of chronic obstructive pulmonary disease. N Engl J Med. 2002;347(7):465–471. doi:10.1056/NEJMoa012561
9. Wu X, Wei X, Li X, Deng J, Zhang J. Diversity of fungi and bacteria in bronchoalveolar lavage fluid during development of chronic obstructive pulmonary disease. Jpn J Infect Dis. 2022;75(6):560–568. doi:10.7883/yoken.JJID.2022.153
10. Yan Z, Chen B, Yang Y, et al. Multi-omics analyses of airway host-microbe interactions in chronic obstructive pulmonary disease identify potential therapeutic interventions. Nat Microbiol. 2022;7(9):1361–1375. doi:10.1038/s41564-022-01196-8
11. Bhatt SP, Agusti A, Bafadhel M, et al. Phenotypes, etiotypes, and endotypes of exacerbations of chronic obstructive pulmonary disease. Am J Respir Crit Care Med. 2023;208(10):1026–1041. doi:10.1164/rccm.202209-1748SO
12. Xue Q, Xie Y, He Y, et al. Lung microbiome and cytokine profiles in different disease states of COPD: a cohort study. Sci Rep. 2023;13(1). doi:10.1038/s41598-023-32901-0
13. Natalini JG, Singh S, Segal LN. The dynamic lung microbiome in health and disease. Nat Rev Microbiol. 2023;21(4):222–235. doi:10.1038/s41579-022-00821-x
14. Zhu Y, Chang D. Interactions between the lung microbiome and host immunity in chronic obstructive pulmonary disease. Chronic Dis Transl Med. 2023;9:104–121.
15. Agusti A, Celli BR, Criner GJ, et al. Global initiative for chronic obstructive lung disease 2023 report: GOLD executive summary. Eur Respir J. 2023;61.
16. Karlsson FH, Fak F, Nookaew I, et al. Symptomatic atherosclerosis is associated with an altered gut metagenome. Nat Commun. 2012;3:1245. doi:10.1038/ncomms2266
17. Karlsson FH, Tremaroli V, Nookaew I, et al. Gut metagenome in European women with normal, impaired and diabetic glucose control. Nature. 2013;498(7452):99–103. doi:10.1038/nature12198
18. Scher JU, Sczesnak A, Longman RS, et al. Expansion of intestinal Prevotella copri correlates with enhanced susceptibility to arthritis. eLife. 2013;2:e01202. doi:10.7554/eLife.01202
19. Li J, Jia H, Cai X, et al. An integrated catalog of reference genes in the human gut microbiome. Nat Biotechnol. 2014;32(8):834–841. doi:10.1038/nbt.2942
20. Qin N, Yang F, Li A, et al. Alterations of the human gut microbiome in liver cirrhosis. Nature. 2014;513(7516):59–64. doi:10.1038/nature13568
21. Buchfink B, Xie C, Huson DH. Fast and sensitive protein alignment using DIAMOND. Nat Methods. 2015;12(1):59–60. doi:10.1038/nmeth.3176
22. Kanehisa M, Sato Y, Kawashima M, Furumichi M, Tanabe M. KEGG as a reference resource for gene and protein annotation. Nucleic Acids Res. 2016;44(D1):D457–462. doi:10.1093/nar/gkv1070
23. Kanehisa M, Sato Y, Morishima K. BlastKOALA and GhostKOALA: KEGG tools for functional characterization of genome and metagenome sequences. J Mol Biol. 2016;428(4):726–731. doi:10.1016/j.jmb.2015.11.006
24. Segata N, Izard J, Waldron L, et al. Metagenomic biomarker discovery and explanation. Genome Biol. 2011;12(6):R60. doi:10.1186/gb-2011-12-6-r60
25. Su L, Qiao Y, Luo J, et al. Characteristics of the sputum microbiome in COPD exacerbations and correlations between clinical indices. J Transl Med. 2022;20(1):76. doi:10.1186/s12967-022-03278-x
26. Wang Z, Singh R, Miller BE, et al. Sputum microbiome temporal variability and dysbiosis in chronic obstructive pulmonary disease exacerbations: an analysis of the COPDMAP study. Thorax. 2018;73(4):331–338. doi:10.1136/thoraxjnl-2017-210741
27. Mayhew D, Devos N, Lambert C, et al. Longitudinal profiling of the lung microbiome in the AERIS study demonstrates repeatability of bacterial and eosinophilic COPD exacerbations. Thorax. 2018;73(5):422–430. doi:10.1136/thoraxjnl-2017-210408
28. Wang J, Chai J, Sun L, Zhao J, Chang C. The sputum microbiome associated with different sub-types of AECOPD in a Chinese cohort. BMC Infect Dis. 2020;20(1). doi:10.1186/s12879-020-05313-y
29. Pragman AA, Knutson KA, Gould TJ, Isaacson RE, Reilly CS, Wendt CH. Chronic obstructive pulmonary disease upper airway microbiota alpha diversity is associated with exacerbation phenotype: a case-control observational study. Respir Res. 2019;20(1). doi:10.1186/s12931-019-1080-4
30. Yang C-Y, Li S-W, Chin C-Y, et al. Association of exacerbation phenotype with the sputum microbiome in chronic obstructive pulmonary disease patients during the clinically stable state. J Transl Med. 2021;19(1). doi:10.1186/s12967-021-02788-4
31. Li W, Wang B, Tan M, Song X, Xie S, Wang C. Analysis of sputum microbial metagenome in COPD based on exacerbation frequency and lung function: a case control study. Respir Res. 2022;23(1). doi:10.1186/s12931-022-02246-9
32. Pragman AA, Hodgson SW, Wu T, Zank A, Reilly CS, Wendt CH. Sputum microbiome α-diversity is a key feature of the COPD frequent exacerbator phenotype. ERJ Open Res. 2024;10(1):00595–02023. doi:10.1183/23120541.00595-2023
33. Olagunju A, Martinez J, Kenny D, Gideon P, Mookadam F, Unzek S. Virulent endocarditis due to Haemophilus parainfluenzae: a systematic review of the literature. World J Cardiol. 2022;14(10):546–556. doi:10.4330/wjc.v14.i10.546
34. Onafowokan OO, Mateo R, Bonatti HJR. A series of Haemophilus parainfluenzae surgical infections and review of the literature. Surg Infect. 2021;22(9):940–947. doi:10.1089/sur.2020.172
35. Martinez-Garcia MA, Rigau D, Barrecheguren M, et al. Long-Term risk of mortality associated with isolation of pseudomonas aeruginosa in COPD: a systematic review and meta-analysis. Int J Chron Obstruct Pulmon Dis. 2022;17:371–382. doi:10.2147/COPD.S346294
36. Kwok WC, Tam TCC, Chau CH, Lam FM, Ho JCM. Clinical implications of pseudomonas aeruginosa colonization in chronic obstructive pulmonary disease patients. Chronic Obstr Pulm Dis. 2025;12(2):137–145. doi:10.15326/jcopdf.2024.0582
37. Tuboly E, Szabo A, Eros G, et al. Determination of endogenous methane formation by photoacoustic spectroscopy. J Breath Res. 2013;7(4):046004. doi:10.1088/1752-7155/7/4/046004
38. Pimentel M, Kong Y, Park S. IBS subjects with methane on lactulose breath test have lower postprandial serotonin levels than subjects with hydrogen. Dig Dis Sci. 2004;49(1):84–87. doi:10.1023/b:ddas.0000011607.24171.c0
39. Mathur R, Amichai M, Chua KS, Mirocha J, Barlow GM, Pimentel M. Methane and hydrogen positivity on breath test is associated with greater body mass index and body fat. J Clin Endocrinol Metab. 2013;98(4):E698–702. doi:10.1210/jc.2012-3144
40. Wang F, Wang F, Li F, et al. Methane attenuates lung ischemia-reperfusion injury via regulating PI3K-AKT-NFkappaB signaling pathway. J Recept Signal Transduction Res. 2020;40(3):209–217. doi:10.1080/10799893.2020.1727925
41. Li Z, Wang B, Tian L, Zheng B, Zhao X, Liu R. Methane-rich saline suppresses ER-Mitochondria contact and activation of the NLRP3 inflammasome by regulating the PERK signaling pathway to ameliorate intestinal ischemia‒reperfusion injury. Inflammation. 2024;47:376–389.
42. Stefanou DT, Kouvela M, Stellas D, et al. Oxidative stress and deregulated DNA damage response network in lung cancer patients. Biomedicines. 2022;10(6):1248. doi:10.3390/biomedicines10061248
43. Wang Z, Maschera B, Lea S, et al. Airway host-microbiome interactions in chronic obstructive pulmonary disease. Respir Res. 2019;20:113. doi:10.1186/s12931-019-1085-z
44. Wang Z, Locantore N, Haldar K, et al. Inflammatory endotype-associated airway microbiome in chronic obstructive pulmonary disease clinical stability and exacerbations: a multicohort longitudinal analysis. Am J Respir Crit Care Med. 2021;203(12):1488–1502. doi:10.1164/rccm.202009-3448OC
 © 2026 The Author(s). This work is published and licensed by Dove Medical Press Limited. The
full terms of this license are available at https://www.dovepress.com/terms
and incorporate the Creative Commons Attribution
- Non Commercial (unported, 4.0) License.
By accessing the work you hereby accept the Terms. Non-commercial uses of the work are permitted
without any further permission from Dove Medical Press Limited, provided the work is properly
attributed. For permission for commercial use of this work, please see paragraphs 4.2 and 5 of our Terms.
© 2026 The Author(s). This work is published and licensed by Dove Medical Press Limited. The
full terms of this license are available at https://www.dovepress.com/terms
and incorporate the Creative Commons Attribution
- Non Commercial (unported, 4.0) License.
By accessing the work you hereby accept the Terms. Non-commercial uses of the work are permitted
without any further permission from Dove Medical Press Limited, provided the work is properly
attributed. For permission for commercial use of this work, please see paragraphs 4.2 and 5 of our Terms.