")
Back to Journals » Diabetes, Metabolic Syndrome and Obesity » Volume 16
Increased Serum Adipsin Correlates with MAFLD and Metabolic Risk Abnormalities
Authors Pan J, Li Q, Sun Y, Gu Y, Ding Y, Pang N, Zhou Y, Pei L, Gao M, Ma S, Xiao Y, Wu F, Hu D, Chen YM , Yang L
Received 5 November 2022
Accepted for publication 10 January 2023
Published 23 January 2023 Volume 2023:16 Pages 187—200
DOI https://doi.org/10.2147/DMSO.S396335
Checked for plagiarism Yes
Review by Single anonymous peer review
Peer reviewer comments 3
Editor who approved publication: Professor Gian Paolo Fadini
Jie Pan,1 Qiuyan Li,1 Yan Sun,1 Yingying Gu,1 Yijie Ding,1 Nengzhi Pang,1 Yujia Zhou,1 Lei Pei,1 Mengqi Gao,1 Sixi Ma,1 Ying Xiao,1 Feilong Wu,1 De Hu,1 Yu-Ming Chen,2 Lili Yang1
1Department of Nutrition, Guangdong Provincial Key Laboratory of Food, Nutrition and Health, School of Public Health, Sun Yat-sen University, Guangzhou, People’s Republic of China; 2Department of Epidemiology, School of Public Health, Sun Yat-sen University, Guangzhou, People’s Republic of China
Correspondence: Lili Yang, Department of Nutrition, School of Public Health, Sun Yat-sen University, No. 74, Zhongshan Road 2, Yuexiu District, Guangzhou, Guangdong, 510080, People’s Republic of China, Tel +86-20-87330625, Email [email protected]
Purpose: A panel of international experts proposed a new definition of fatty liver in 2020, namely metabolic dysfunction-associated fatty liver disease (MAFLD). As an adipokine, adipsin is closely related to metabolic-related diseases. In this study, we aimed to evaluate the relationship among MAFLD, serum adipsin, and metabolic risk abnormalities.
Methods: Our study was a cross-sectional study based on the first follow-up of the Guangzhou Nutrition and Health Study (GNHS). A total of 908 patients with hepatic steatosis were involved in our study. Detailed data of patients were collected based upon questionnaire information, physical examination, and blood biochemical test.
Results: Among the 908 patients, 789 patients were diagnosed with MAFLD. The levels of serum adipsin in the MAFLD group and non-MAFLD group were (3543.00 (3187.94– 3972.50) ng/mL) and (3095.33 (2778.71– 3354.77) ng/mL) (P < 0.001), respectively. After adjusting for potential confounders, adipsin levels were found to be associated with MAFLD. The OR was 3.46 (95% CI: 1.57– 7.64) for adipsin when comparing subjects in the highest tertile with those in the lowest tertile. With the increase in the number of metabolic risk abnormalities, both the levels of serum adipsin and the proportion of moderate to severe fatty liver increased (all p-trend < 0.001).
Conclusion: Increased serum adipsin correlates with MAFLD. Both adipsin levels as well as fatty liver severity increase with higher numbers of metabolic risk abnormalities.
Keywords: metabolic dysfunction-associated fatty liver disease, adipsin, metabolic risk abnormalities, hepatic steatosis
Introduction
Traditionally, nonalcoholic fatty liver disease (NAFLD) is defined as the presence of hepatic steatosis (≥5%) with the absence of significant alcohol consumption and the lack of other secondary causes of liver fat accumulation.1 At present, an increasing number of studies have shown that NAFLD is related to metabolism.2,3 The metabolic risk factors behind NAFLD-related pathological progressions should not be ignored. In 2020, a panel of international experts proposed a new term “metabolic dysfunction-associated fatty liver disease” (MAFLD) to replace NAFLD as the definition of fatty liver disease.4 The diagnostic criteria of MAFLD are based on the presence of both hepatic steatosis as well as one of the following three conditions, namely overweight/obesity, type 2 diabetes mellitus or metabolic dysregulation.4 A meta-analysis showed that the global prevalence of MAFLD affects 38.77% (95% CI: 32.94–44.95%) of the population.5 This significantly exceeds the previous estimation of the global prevalence of NAFLD.6–8 Additionally, MAFLD has been found to be positively associated with increased risks of all-cause mortality in the United States,9 and MAFLD increases mortality risk independent of excessive alcohol consumption.10
Adipokines are polypeptides produced by adipose tissue and can significantly influence the progression of NAFLD by regulating hepatic fat accumulation, insulin resistance and fibrosis.11,12 Adipsin was the first adipokine described which is equivalent to complement factor D and is expressed at high levels in adipocytes.13,14 It plays an important role in glucose and lipid metabolism, energy balance and maintenance of islet β-cell function.15–17 In our previous study, we found that increased circulating levels of adipsin were positively associated with the risk of NAFLD.18 As an adipokine, adipsin is closely related to metabolic-related diseases. To date, there has been no studies exploring the relationship between adipsin and MAFLD. In this study, we investigated the levels of serum adipsin in both the MAFLD group and the non-MAFLD group and compared the differences among different MAFLD subgroups. In addition, we aimed to evaluate the association between serum adipsin levels and MAFLD. Since MAFLD emphasizes the role of metabolism, we will also explore the changes in serum adipsin levels and the severity of fatty liver as the number of metabolic risk abnormalities increases.
Methods
Study Design and Participants
The Guangzhou Nutrition and Health Study (GNHS) is a community-based prospective cohort study in China focusing on evaluating the risk factors of chronic diseases. The details of GNHS can be found in a previous article.19 Participants in this cohort and the time of enrollment are shown in Figure 1. Our study was a cross-sectional study based on the first follow-up of GNHS. Among the 2510 participants who completed the follow-up, 908 patients were diagnosed with hepatic steatosis by ultrasound and were selected as the subjects of our study. The specific grouping characteristics of the research subjects are shown in Figure 2.
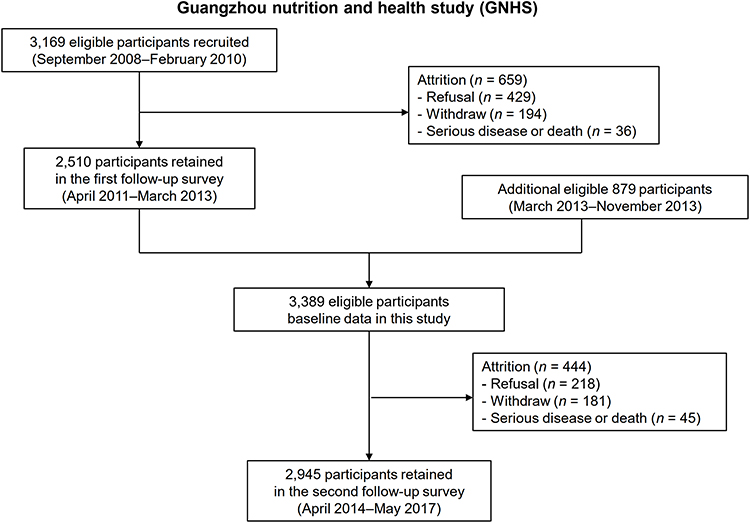 |
Figure 1 Flow chart of participants and enrollment time in Guangzhou Nutrition and Health Study. |
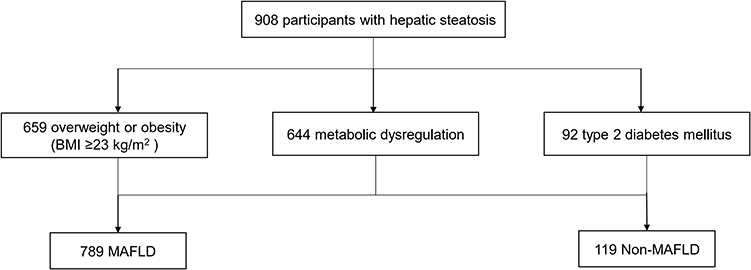 |
Figure 2 Specific grouping characteristics of the participants in this study. |
The GNHS was registered on ClinicalTrials.gov (registration number NCT03179657) and approved by the Ethics Committee of the School of Public Health at Sun Yat-sen University (approval number ZDGWYL2009-3), which meets the guidelines in the Declaration of Helsinki. Written informed consent was obtained from all participants.
Clinical and Laboratory Data Collection
Participants were interviewed face-to-face by trained investigators using standardized questionnaires covering demographic sociological characteristics, economic status, behavior, and lifestyle. Height, weight, waist circumference, hip circumference and neck circumference were measured twice and averaged. Body mass index (BMI) was calculated as weight (kg) divided by the square of height (m2). Blood pressure was measured twice and averaged on the left arm of participants using an automated sphygmomanometer (HEM 7011; OMRON Corp., Osaka, Japan). The metabolic equivalent intensity was calculated to estimate daily physical activity levels of participants using a 24-h physical activity questionnaire.20 The fat mass of the trunk region was tested using dual-energy X-ray absorptiometry scans (Discovery W; Hologic Inc., Waltham, MA, USA). All venous blood samples of participants were obtained after overnight fasting. The serum was separated into several aliquots and stored at −80°C within 2 h. The baseline biochemical measurements were determined by a Hitachi 7600–010 automated analyzer (Hitachi, Tokyo, Japan) and included fasting glucose, total cholesterol (TC), triglycerides (TG), low-density lipoprotein cholesterol (LDL-C), high-density lipoprotein cholesterol (HDL-C), aspartate aminotransferase (AST), alanine aminotransferase (ALT), albumin (Alb), uric acid (UA), and insulin. The homeostasis model assessment of insulin resistance (HOMA-IR) was defined as [fasting glucose (mmol/L) × insulin (μU/mL)]/22.5. Adipsin levels were measured by quantitative sandwich enzyme immunoassay using kits obtained from R&D Systems (DFD00, Minneapolis, MN, USA) with a Spark 10M Multimode Reader Platform (Tecan Trading AG, Männedorf, Switzerland).
Diagnosis of Hepatic Steatosis
Abdominal ultrasound was performed using a Doppler sonographer with a 3.5 MHz probe (Sonoscape SSI-5500, Shenzhen, China) by an experienced physician who was unaware of participant information. Presence of fatty liver disease and the degree of steatosis were evaluated according to the criteria used by Graif21 (ranging from absent, mild or moderate to severe), and reported in our previous article.22
Working Definitions
The diagnostic criteria of MAFLD are based on the presence of both hepatic steatosis and one of the following three conditions, namely overweight/obesity, type 2 diabetes mellitus (T2DM) or metabolic dysregulation (MD). Metabolic dysregulation is defined by the presence of at least two metabolic risk abnormalities: (1) waist circumference ≥ 90/80 cm in Asian men and women; (2) blood pressure ≥ 130/85 mmHg or specific drug treatment; (3) plasma triglycerides ≥ 1.70 mmol/L or specific drug treatment; (4) plasma HDL-cholesterol < 1.0 mmol/L for men and < 1.3 mmol/L for women or specific drug treatment; (5) prediabetes [fasting glucose levels 5.6 to 6.9 mmol/L]; (6) homeostasis model assessment of insulin resistance score ≥ 2.5; and (7) plasma high-sensitivity C-reactive protein level > 2 mg/L.4 In patients diagnosed with MAFLD, we defined the severity of MAFLD based on the degree of hepatic steatosis.
Metabolic syndrome (MetS) is diagnosed by meeting at least three of the following criteria:23 (1) waist circumference ≥ 90/80 cm in Asian men and women; (2) triglycerides ≥ 1.7 mmol/L; (3) high-density lipoprotein cholesterol < 1.0 mmol/L for men and < 1.3 mmol/L for women; (4) systolic blood pressure ≥ 130 mmHg and/or diastolic blood pressure ≥ 85 mmHg; and (5) fasting plasma glucose ≥ 5.6 mmol/L.
Hypertension is diagnosed by the following conditions: systolic blood pressure ≥ 140 mmHg or diastolic blood pressure ≥ 90 mmHg or having a history of hypertension or using antihypertensive drugs. T2DM is defined as fasting glucose ≥ 7.0 mmol/L or having a history of T2DM or taking antidiabetic medications. The diagnostic criteria for dyslipidemia are as follows: TC ≥ 6.2 mmol/L or TG ≥ 2.3 mmol/L or HDL-cholesterol < 1.0 mmol/L or LDL-cholesterol ≥ 4.1 mmol/L.24 In addition, people under lipid-lowering therapy can also be considered to have dyslipidemia.
In this study, smoking was defined as smoking at least one cigarette a day for at least six months, and alcohol drinking was defined as drinking once a week for at least six months.
Statistical Analysis
The continuous variables were expressed as means ± standard deviation or median (interquartile range) according to whether the data were normally distributed. Categorical variables are presented as frequency (percentage). Independent samples t-test, Mann–Whitney U-test and Pearson Chi-Square test were used to compare between two groups. One-way ANOVA, Kruskal–Wallis test, and Pearson Chi-Square test were used to compare among multiple groups. The trend tests were conducted by Jonckheere-Terpstra, linear contrast in one-way ANOVA and linear-by-linear association chi square test. Binary logistic regression models were used to examine the associations of serum adipsin levels with MAFLD. The lowest tertile of serum adipsin levels served as the reference group. Age, gender, education, smoking, drinking, physical activities, hypertension, dyslipidemia, TG, HDL-C, UA, HOMA-IR, and AST/ALT were adjusted in binary logistic regression models. The correlations of serum adipsin levels with other variables were tested by Spearman correlation analysis.
Data on education levels were missing for 11 participants and were filled in by the mode value. Data on trunk fat and percentage of trunk fat were missing for 5 participants and were filled in by the median value. Statistical analysis was performed using SPSS 25.0 software (SPSS Inc., Chicago, IL, USA). A p value < 0.05 (two-sided) was considered to be statistically significant.
Results
Comparison Between the MAFLD and Non-MAFLD Groups
As shown in Figure 3A, serum adipsin levels were higher in the MAFLD group (regardless of the participants were diagnosed with MAFLD based on having overweight/obesity, T2DM or MD) than in the non-MAFLD group (all P < 0.001). Serum adipsin levels in the MAFLD group (3543.00 (3187.94–3972.50) ng/mL) were higher than those in the non-MAFLD group (3095.33 (2778.71–3354.77) ng/mL) (P < 0.001). Under univariate comparisons between groups, age, BMI, WC, HC, NC, WHR, trunk fat, trunk fat percentage, SBP, DBP, TG, fasting glucose, insulin, HOMA-IR, ALT, and UA levels were found to be higher in the MAFLD group than those in the non-MAFLD group. Compared with the non-MAFLD group, the MAFLD group had higher proportion of T2DM, hypertension, dyslipidemia and MetS. In addition, MAFLD subjects had lower levels of HDL-C and AST/ALT than non-MAFLD subjects. There were no significant differences in gender, education, smoking, drinking, physical activity levels as well as levels of TC, LDL-C, AST, ALP, and albumin between the two groups (Table 1). The differences in the distribution of adipsin quartile levels between the two groups are shown in Figure 3B, with adipsin levels in Q3 and above accounting for more than 50% in the MAFLD group and less than 20% in the non-MAFLD group (P < 0.001).
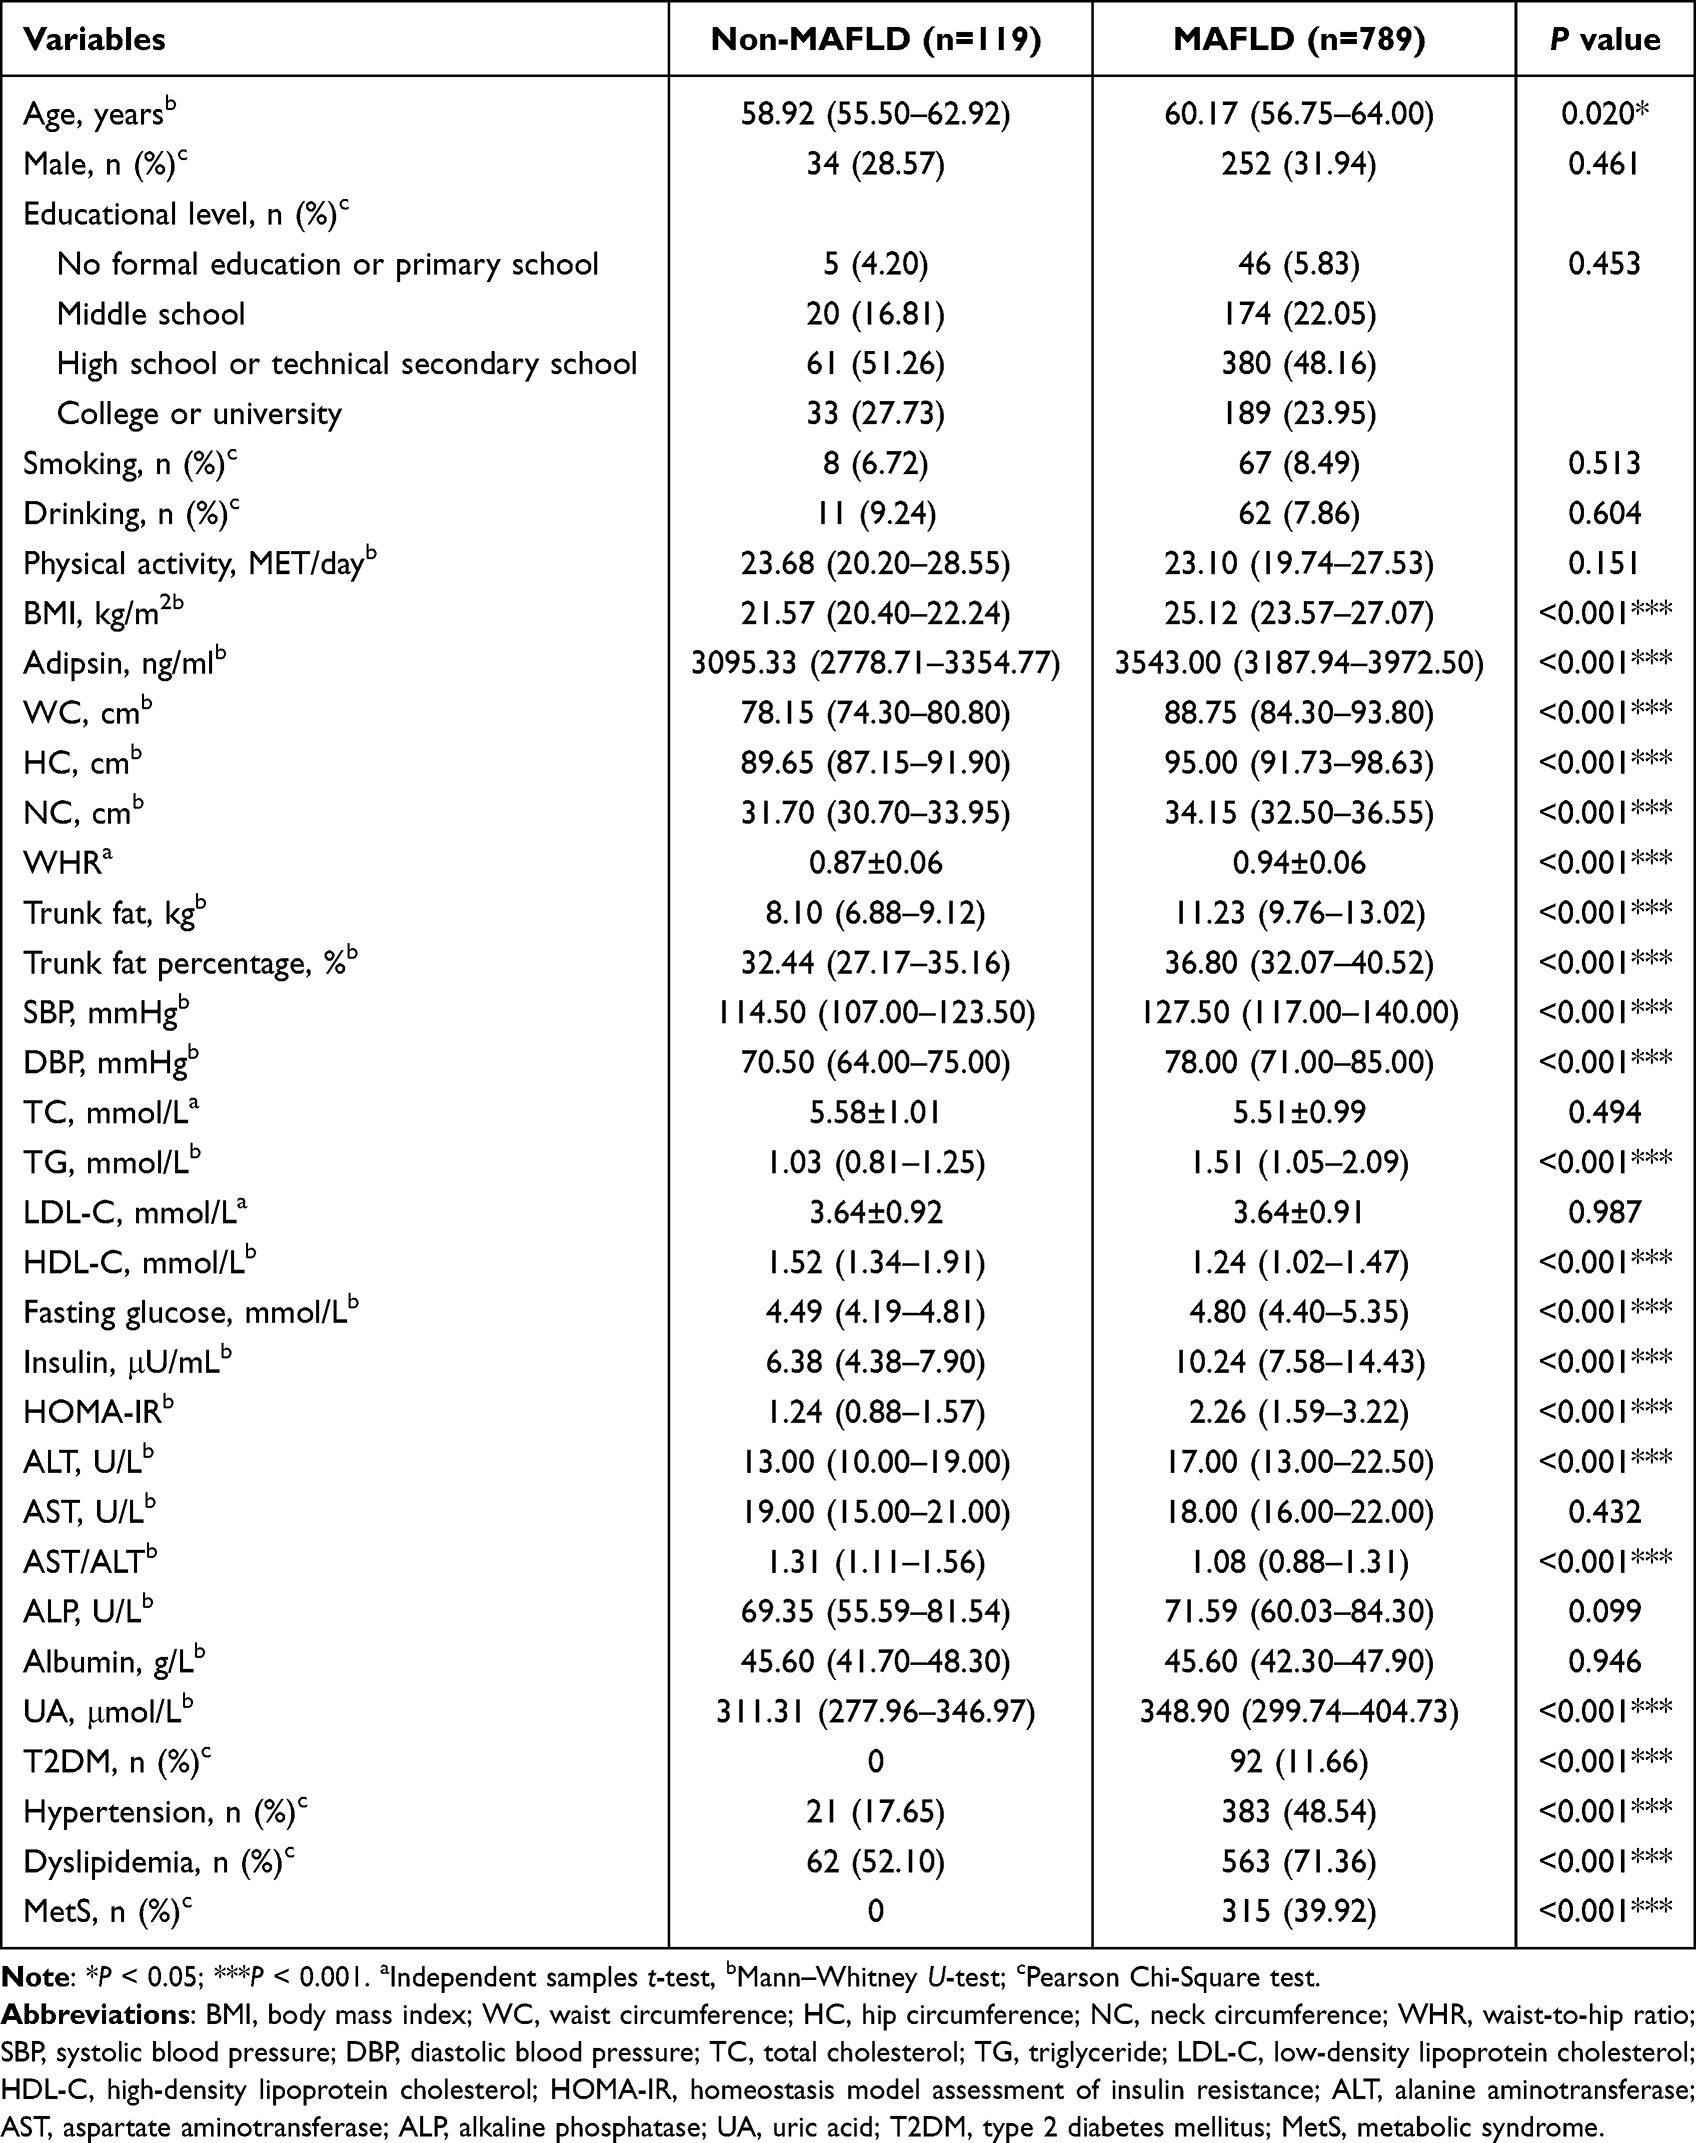 |
Table 1 Clinical Characteristics of Subjects in Non-MAFLD and MAFLD Groups |
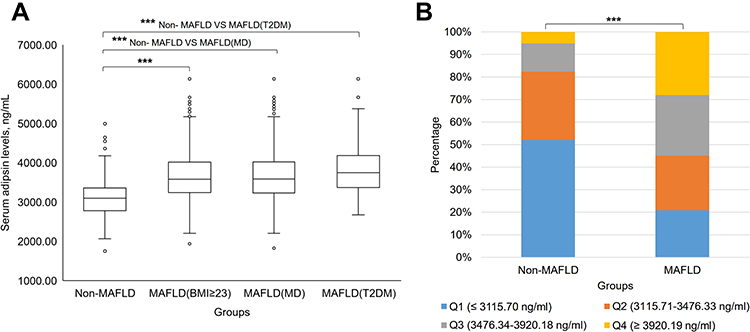 |
Figure 3 (A) Comparison of the non-MAFLD group and MAFLD groups diagnosed by different criteria. (B) Distribution of adipsin quartile levels between the MAFLD and non-MAFLD groups. ***P < 0.001. |
Association Between Serum Adipsin Levels and MAFLD
The ORs and 95% CI for the association of MAFLD with serum adipsin levels are shown in Table 2. In model 1, the OR (95% CI) of MAFLD was 10.76 (5.27–21.94; p-trend < 0.001) for adipsin in the highest tertile compared with that in the lowest tertile. After adjusting for age, gender, education, smoking, drinking, physical activity, hypertension, and dyslipidemia in model 2, we found that the OR (95% CI) of MAFLD was 7.90 (3.81–16.38; p-trend < 0.001) when comparing adipsin levels in the highest tertile with that in the lowest tertile. Based on model 2, after further adjusting TG, HDL-C, UA, HOMA-IR, and AST/ALT, we found that the OR (95% CI) of MAFLD was 3.46 (1.57–7.64; p-trend = 0.002) when comparing adipsin levels in the highest tertile with that in the lowest tertile.
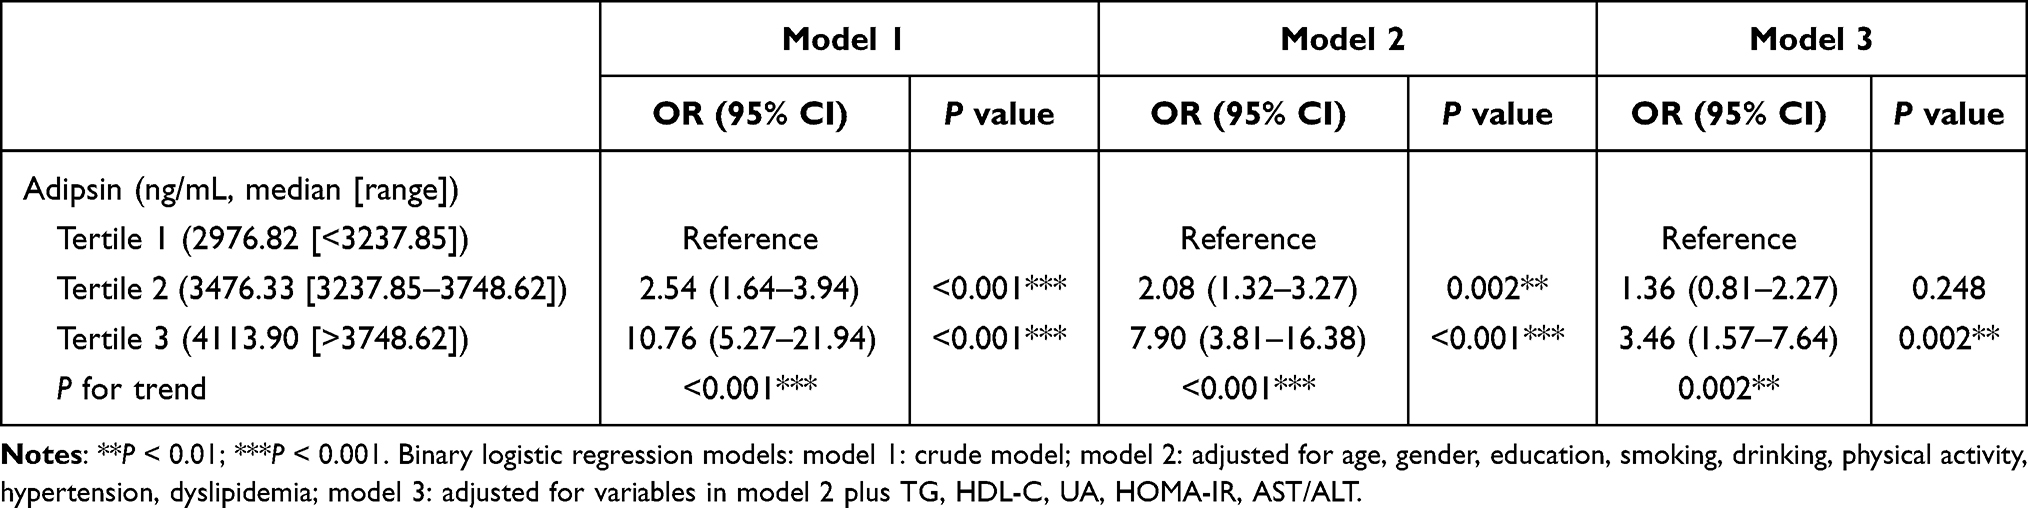 |
Table 2 Association Between Serum Adipsin Levels and MAFLD |
Relationship Among Metabolic Risk Abnormalities, Severity of Fatty Liver and Serum Adipsin Levels
As shown in Figure 4, in the MAFLD group, the group with MD had higher adipsin levels than those without MD (P < 0.05). Furthermore, we found that with the increase in the number of metabolic risk abnormalities, adipsin levels and the proportion of moderate to severe fatty liver in participants increased, all p-trend < 0.001 (Figure 5). The levels of serum adipsin in the mild-MAFLD, moderate-MAFLD and severe-MAFLD groups were (3487.93 (3141.16–3920.39) ng/mL), (3631.98 (3293.55–3972.50) ng/mL) and (4150.88 (3238.88–4524.72) ng/mL) respectively, p-trend < 0.001 (Figure 6).
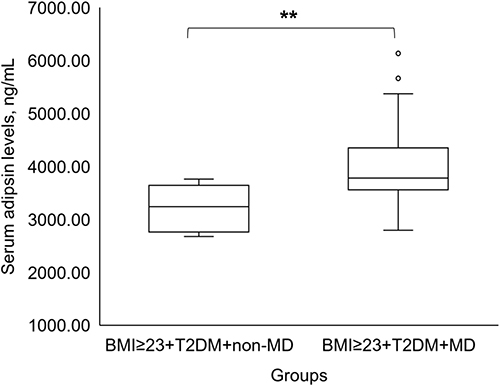 |
Figure 4 Serum adipsin levels in MAFLD patients with or without metabolic dysregulation. **P < 0.01. Abbreviation: MD, metabolic dysregulation. |
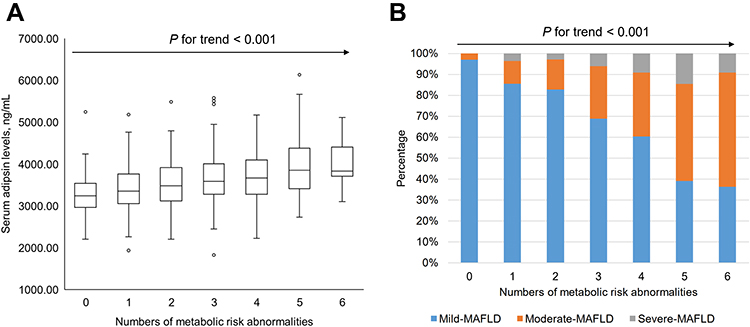 |
Figure 5 (A) Relationship between the number of metabolic risk abnormalities and serum adipsin levels. The trend test was conducted by Jonckheere-Terpstra. (B) Relationship between the number of metabolic risk abnormalities and the severity of MAFLD. The trend test was conducted by linear-by-linear association chi square test. |
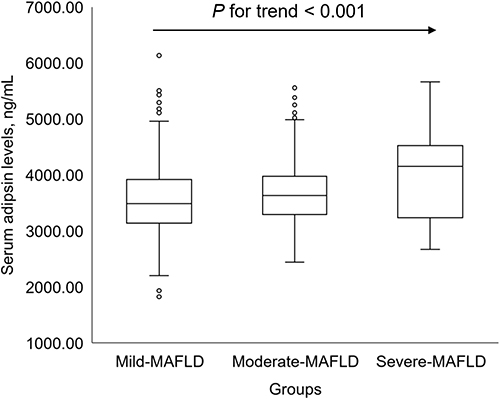 |
Figure 6 Differences in serum adipsin levels among MAFLD with different severity. The trend test was conducted by Jonckheere-Terpstra. |
Correlation of Adipsin with Other Parameters in the MAFLD and Non-MAFLD Groups
In the MAFLD group, the level of adipsin was positively correlated with BMI, WC, HC, NC, WHR, trunk fat, SBP, DBP, TG, insulin, HOMA-IR, and UA, and was inversely correlated with HDL-C, AST/ALT, and albumin. In the non-MAFLD group, adipsin was positively correlated with BMI, WC, WHR, trunk fat, insulin, and HOMA-IR, and was inversely correlated with HDL-C (Table 3).
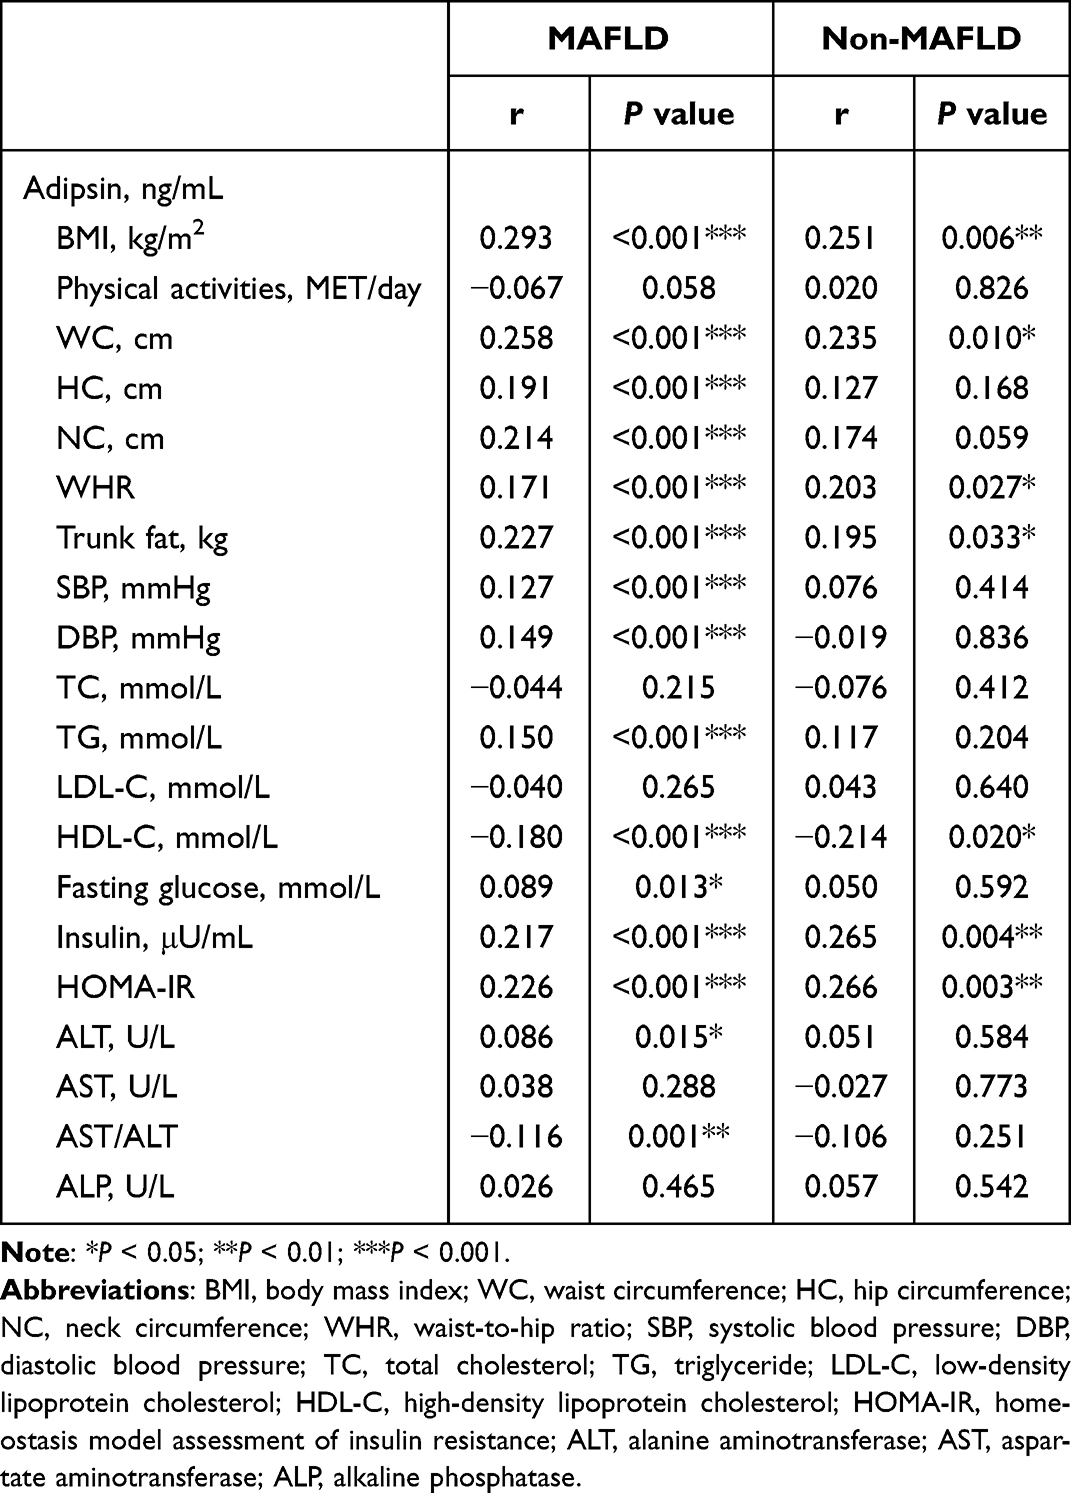 |
Table 3 Spearman Correlation of Adipsin with Some Factors in MAFLD and Non-MAFLD Groups |
Subgroup Analysis of the Clinical and Laboratory Characteristics Based on Severity of Fatty Liver in the MAFLD Group
In the subgroup analysis of clinical characteristics of patients with MAFLD based on the severity of fatty liver (Table 4), parameters including BMI, WC, HC, NC, WHR, trunk fat, trunk fat percentage, TG, HDL-C, fasting glucose, insulin, HOMA-IR, ALT, AST/ALT, and the proportion of T2DM, hypertension, dyslipidemia, and MetS were not completely consistent across groups (all P < 0.05). A further trend test found that the more severe the fatty liver, BMI, WC, HC, NC, WHR, trunk fat, trunk fat percentage, SBP, TG, fasting glucose, insulin, HOMA-IR, ALT, AST, and albumin levels were higher, as well as the proportion of T2DM, hypertension, dyslipidemia and MetS (all P trend < 0.05). There were similarities found in age, gender, education, smoking, drinking, physical activity levels as well as levels of DBP, TC, LDL-C, ALP, and UA among the three groups (all P and P trend > 0.05).
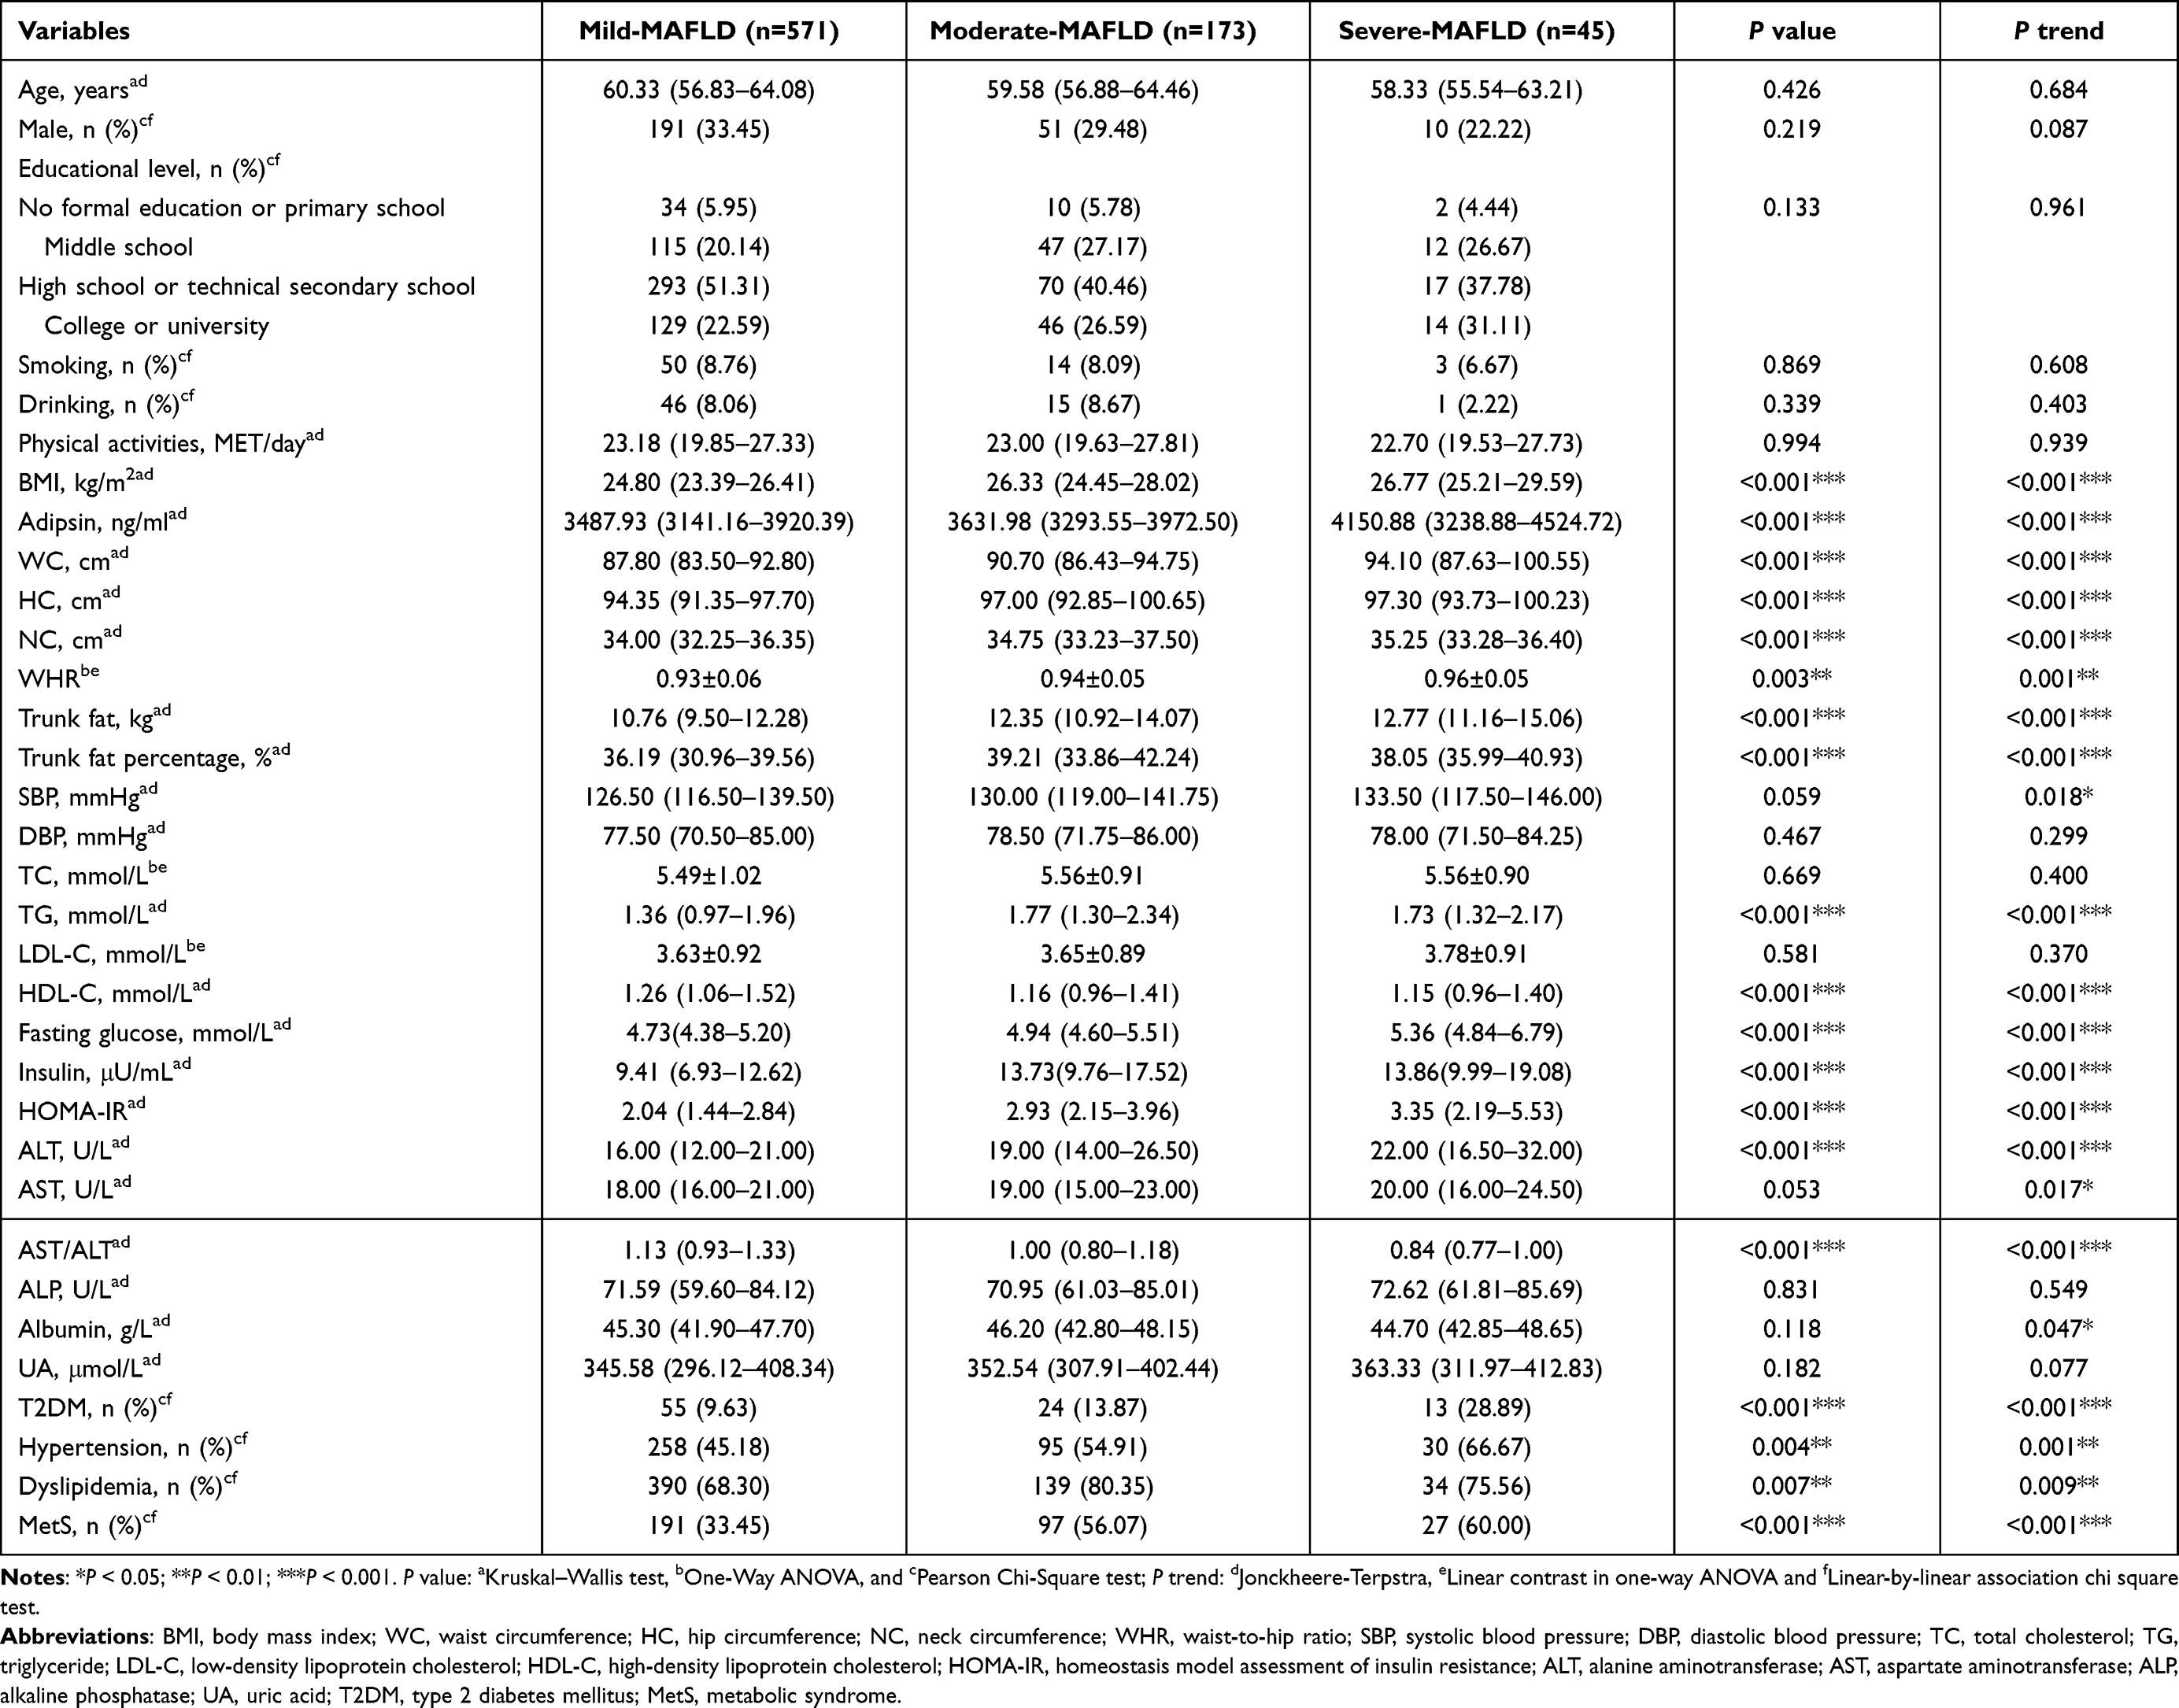 |
Table 4 Subgroup Analysis of Clinical Characteristics of Patients with MAFLD Based on Severity of Fatty Liver |
Discussion
Through cross-sectional analysis of 908 subjects, we found that the MAFLD group had higher adipsin levels than that in the non-MAFLD group. After adjusting for multiple variables, adipsin levels were associated with MAFLD. To our knowledge, we are the first to describe the relationship among the metabolic risk abnormalities, serum adipsin levels and MAFLD. We found that with the increase in the number of metabolic risk abnormalities, the levels of adipsin and the proportion of moderate to severe fatty liver increased.
Interestingly, we found no differences in LDL-C and TC levels between the MAFLD and non-MAFLD groups as well as among the MAFLD subgroups. In recent studies, no differences in TC and LDL-C levels were found between MAFLD and control groups or among different subgroups of MAFLD.25–28 Similar results have been found in NAFLD related studies. Serum TC and LDL-C concentrations did not differ between NAFLD and control groups.29 There were no significant differences in TC and LDL-C levels between mild and severe NAFLD fibrosis groups.30 There was also no statistically significant correlation between adipsin levels and LDL-C or TC levels. This result was consistent to the outcomes reported in Qiu et al18 as well as other previous studies. Nonetheless, one study reported that when there was the presence of dyslipidemia in patients with metabolic syndrome, total cholesterol and low-density lipoprotein cholesterol levels did not increase significantly in accordance.31 Thus, future long-term follow-up observations and experimental studies are necessary to confirm above phenomenon.
Another notable finding of this study is that with the increase in the number of metabolic risk abnormalities, serum adipsin levels of participants gradually increased, and the proportion of moderate to severe fatty liver in participants also increased, this suggests that serum adipsin levels may be related to metabolic complications. Although the relationships between adipsin and metabolic components have not been clearly demonstrated till now, there have been some related studies reported. Serum adipsin levels were strongly associated with visceral adipose and glucolipid metabolism.32 In addition, literature has suggested that adipsin may be a novel early biomarker of T2DM33 and that circulating adipsin levels might act as potential predictors for the presence and development of metabolic syndrome.34 A cross-sectional study suggested that higher concentrations of adipokines, including adipsin, are related to higher waist circumference in cardiometabolic disorder patients.35 In postmenopausal women, metabolic syndrome was mainly associated with abdominal obesity and dyslipidemia, and also found to be associated with higher levels of insulin and adipsin.36 Serum adipsin levels have been reported to be correlated with serum lipids, insulin resistance and waist obesity.37 However, it has also been reported that serum adipsin had no association with insulin resistance in obese children.38 A positive correlation between adipsin and HOMA-IR was observed in our study. We found that the more severe the MAFLD in patients, the higher the adipsin levels. This suggests that serum adipsin levels can be used as a potential biomarker for predicting the severity of fatty liver disease in patients with MAFLD among the Chinese population. Nonetheless, each of the metabolic risk factor listed in the new definition that are used to identify metabolic dysregulation has a different phenotype. Therefore, the mechanisms of the relationships between adipsin and specific metabolic risk factors are needed to be explored in-depth in the future.
In the literature, contradictory outcomes have been found between animals and humans with respect to the relationship of adipsin and the metabolic conditions, for example, lower adipsin levels have been found to be associated with overweight/obesity in animals,39 while increased adipsin levels were in population studies of metabolic diseases, especially in obese patients.36,40 Azizi et al41 found that no changes in serum adipsin levels after an 8-week aerobic exercise training intervention in obese women with type 2 diabetes. Another interventional study reported that obese patients had adipsin levels comparable to controls before and after diet intervention.42 Additionally, patients with T2DM had significantly higher serum adipsin concentrations than those with normal blood glucose.43 Zhou et al44 reported that serum adipsin levels were lower in patients with T2DM and impaired glucose tolerance. The levels of adipsin were selectively decreased in T2DM patients with β cell failure.15 Systemic levels of adipsin may be initially high because of a compensatory mechanism in the early stages of metabolic syndrome and diabetes, but then decline with adipose dysfunction.15 As such, future longitudinal studies of adipsin levels at various stages from prediabetes to advanced diabetes are warranted, including population studies and molecular mechanisms. The lack of adipsin expression in the adipose tissue of obese mice could be due to the absence of a positive regulatory factor or due to the presence of an inhibitory factor.45 Differences in adipsin levels among human studies may be attributed to race, study design, measurement methods, and other potential confounders. In summary, adipsin levels have been found to be low in animal models of metabolic-related diseases, whereas in population studies of metabolic-related diseases, contradictory outcomes have been reported in which both increased and decreased adipsin levels among patients have been found.
The heterogeneity of NAFLD in terms of its major metabolic drivers is an important barrier to the discovery of effective therapies of the disease. Using “positive” characteristics to diagnose MAFLD can better stratify the risks of patients, which in turn helps to take targeted prevention and treatment measures to improve clinical outcomes. Above diagnostic criteria of MAFLD may have advantages over NAFLD diagnostic conditions. For instance, a study using the NHANES III database showed that the MAFLD diagnostic criteria were more effective than NAFLD diagnostic criteria for identifying patients with fatty liver disease at high risk of disease progression.46 The MAFLD definition specifically incorporates recognized cardiovascular risk factors, so the future clinical impact of MAFLD on cardiovascular disease should also be concerned.47
To date, the high prevalence of MAFLD worldwide has attracted increasing attention, and various metabolic risk factors all have a non-negligible impact on MAFLD. At the same time, precision medicine has always been advocated, and risk stratification of diseases and targeted prevention and treatment measures are also necessary. This study sought to analyze the relationship among adipsin, MAFLD and specific metabolic risk factors in a future prospective study design, which could provide more robust evidence for the inconsistent findings of adipsin and metabolic-related diseases among different populations as well as between humans and animals.
Nevertheless, there were several limitations in our study. First, this was a cross-sectional study that cannot make causal inferences, but it can still provide clues for subsequent analytical or experimental studies. Second, hepatic steatosis and its severity were diagnosed by ultrasonography, which is less sensitive than liver biopsy. Third, due to the lack of data on plasma high-sensitivity C-reactive protein levels, their effect on MAFLD could not be investigated. Finally, the controls in this study were patients with simple hepatic steatosis, instead of healthy patients.
Conclusion
Our study found that participants in the MAFLD groups (regardless of the participants were diagnosed with MAFLD based on having overweight/obesity, T2DM or MD) had higher levels of adipsin than ones in the non-MAFLD group and that serum adipsin levels were positively associated with MAFLD. On top of that, in the MAFLD group, as the number of metabolic risk abnormalities increased, the levels of serum adipsin and the proportion of moderate to severe fatty liver disease were increased.
Data Sharing Statement
The datasets generated during and/or analyzed during the current study are available from the corresponding author on reasonable request.
Ethics Approval and Informed Consent
The GNHS was registered on ClinicalTrials.gov (registration number NCT03179657) and approved by the Ethics Committee of the School of Public Health at Sun Yat-sen University (approval number ZDGWYL2009-3), which meets the guidelines in the Declaration of Helsinki. Written informed consent was obtained from all participants.
Acknowledgments
We are grateful to all the participants for their participation.
Funding
This work was supported by the State Key Program of the National Natural Science Foundation of China (Grant No. 81730090) and the National Natural Science Foundation of China (81872613).
Disclosure
The authors declare that there are no conflicts of interest in this work.
References
1. Chalasani N, Younossi Z, Lavine JE, et al. The diagnosis and management of nonalcoholic fatty liver disease: practice guidance from the American Association for the Study of Liver Diseases. Hepatology. 2018;67:328–357. doi:10.1002/hep.29367
2. Zhou F, Zhou J, Wang W, et al. Unexpected rapid increase in the burden of NAFLD in China from 2008 to 2018: a systematic review and meta-analysis. Hepatology. 2019;70:1119–1133. doi:10.1002/hep.30702
3. Fazel Y, Koenig AB, Sayiner M, Goodman ZD, Younossi ZM. Epidemiology and natural history of non-alcoholic fatty liver disease. Metabolism. 2016;65:1017–1025. doi:10.1016/j.metabol.2016.01.012
4. Eslam M, Newsome PN, Sarin SK, et al. A new definition for metabolic dysfunction-associated fatty liver disease: an international expert consensus statement. J Hepatol. 2020;73:202–209. doi:10.1016/j.jhep.2020.03.039
5. Chan KE, Koh TJL, Tang ASP, et al. Global prevalence and clinical characteristics of metabolic associated fatty liver disease. A meta-analysis and systematic review of 10,739,607 individuals. J Clin Endocrinol Metab. 2022;107:2691–2700. doi:10.1210/clinem/dgac321
6. Sanyal AJ. Past, present and future perspectives in nonalcoholic fatty liver disease. Nat Rev Gastroenterol Hepatol. 2019;16:377–386. doi:10.1038/s41575-019-0144-8
7. Lim GEH, Tang A, Ng CH, et al. An observational data meta-analysis on the differences in prevalence and risk factors between MAFLD vs NAFLD. Clin Gastroenterol Hepatol. 2021;S1542-3565:1276.
8. Le MH, Yeo YH, Li X, et al. 2019 global NAFLD prevalence: a systematic review and meta-analysis. Clin Gastroenterol Hepatol. 2021;S1542-3565:01280–01285.
9. Kim D, Konyn P, Sandhu KK, et al. Metabolic dysfunction-associated fatty liver disease is associated with increased all-cause mortality in the United States. J Hepatol. 2021;75:1284–1291. doi:10.1016/j.jhep.2021.07.035
10. van Kleef LA, de Knegt RJ, Brouwer WP. Metabolic dysfunction-associated fatty liver disease and excessive alcohol consumption are both independent risk factors for mortality. Hepatology. 2022. doi:10.1002/hep.32642
11. Adolph TE, Grander C, Grabherr F, Tilg H. Adipokines and non-alcoholic fatty liver disease: multiple interactions. Int J Mol Sci. 2017;18:1649. doi:10.3390/ijms18081649
12. Polyzos SA, Kountouras J, Mantzoros CS. Adipokines in nonalcoholic fatty liver disease. Metabolism. 2016;65:1062–1079. doi:10.1016/j.metabol.2015.11.006
13. White RT, Damm D, Hancock N, et al. Human adipsin is identical to complement factor D and is expressed at high levels in adipose tissue. J Biol Chem. 1992;267:9210–9213. doi:10.1016/S0021-9258(19)50409-4
14. Cook KS, Min HY, Johnson D, et al. Adipsin: a circulating serine protease homolog secreted by adipose tissue and sciatic nerve. Science. 1987;237:402–405. doi:10.1126/science.3299705
15. Lo JC, Ljubicic S, Leibiger B, et al. Adipsin is an adipokine that improves β cell function in diabetes. Cell. 2014;158:41–53. doi:10.1016/j.cell.2014.06.005
16. Baldo A, Sniderman AD, St-Luce S, et al. The adipsin-acylation stimulating protein system and regulation of intracellular triglyceride synthesis. J Clin Invest. 1993;92:1543–1547. doi:10.1172/JCI116733
17. Cianflone K, Roncari DAK, Maslowska M, et al. Adipsin / Acylation Stimulating Protein System in Human Adipocytes: regulation of Triacylglycerol Synthesis. Biochemistry. 1994;33:9489–9495. doi:10.1021/bi00198a014
18. Qiu Y, Wang SF, Yu C, et al. Association of circulating adipsin, visfatin, and adiponectin with nonalcoholic fatty liver disease in adults: a case-control study. Ann Nutr Metab. 2019;74:44–52. doi:10.1159/000495215
19. Gu Y, Luo J, Chen Q, et al. Inverse association of serum adipsin with the remission of nonalcoholic fatty-liver disease: a 3-year community-based cohort study. Ann Nutr Metab. 2022;78:21–32. doi:10.1159/000520368
20. Ainsworth BE, Haskell WL, Herrmann SD, et al. 2011 compendium of physical activities: a second update of codes and MET values. Med Sci Sports Exerc. 2011;43:1575–1581. doi:10.1249/MSS.0b013e31821ece12
21. Graif M, Yanuka M, Baraz M, et al. Quantitative estimation of attenuation in ultrasound video images: correlation with histology in diffuse liver disease. Invest Radiol. 2000;35(5):319–324. doi:10.1097/00004424-200005000-00006
22. Chen YM, Liu Y, Zhou RF, et al. Associations of gut-flora-dependent metabolite trimethylamine-N-oxide, betaine and choline with non-alcoholic fatty liver disease in adults. Sci Rep. 2016;6:19076. doi:10.1038/srep19076
23. Punthakee Z, Goldenberg R, Katz P; Diabetes Canada Clinical Practice Guidelines Expert Committee. Definition, classification and diagnosis of diabetes, prediabetes and metabolic syndrome. Can J Diabetes. 2018;42(Suppl 1):S10–S15. doi:10.1016/j.jcjd.2017.10.003
24. Zhu JR, Gao RL, Zhao SP, et al. 2016 Chinese guidelines for the management of dyslipidemia in adults. J Geriatr Cardiol. 2018;15:1–29.
25. Jia J, Liu R, Wei W, et al. Monocyte to high-density lipoprotein cholesterol ratio at the nexus of type 2 diabetes mellitus patients with metabolic-associated fatty liver disease. Front Physiol. 2021;12:762242. doi:10.3389/fphys.2021.762242
26. Li N, Xie G, Zhou B, et al. Serum adropin as a potential biomarker for predicting the development of type 2 diabetes mellitus in individuals with metabolic dysfunction-associated fatty liver disease. Front Physiol. 2021;12:696163. doi:10.3389/fphys.2021.696163
27. Zhu C, Ma H, Huang D, et al. J-shaped relationship between serum prolactin and metabolic-associated fatty liver disease in female patients with type 2 diabetes. Front Endocrinol. 2022;13:815995. doi:10.3389/fendo.2022.815995
28. Huh JH, Kim KJ, Kim SU, Cha BS, Lee BW. Obesity is an important determinant of severity in newly defined metabolic dysfunction-associated fatty liver disease. Hepatobiliary Pancreat Dis Int. 2022;21:241–247. doi:10.1016/j.hbpd.2022.03.009
29. Simonen P, Kotronen A, Hallikainen M, et al. Cholesterol synthesis is increased and absorption decreased in non-alcoholic fatty liver disease independent of obesity. J Hepatol. 2011;54:153–159. doi:10.1016/j.jhep.2010.05.037
30. Rana R, Shearer AM, Fletcher EK, et al. PAR2 controls cholesterol homeostasis and lipid metabolism in nonalcoholic fatty liver disease. Mol Metab. 2019;29:99–113. doi:10.1016/j.molmet.2019.08.019
31. Torres Do Rego A, Perez de Isla L, Saltijeral Cerezo A, et al. Cholesterol control according to the presence of metabolic syndrome in coronary and diabetic patients. Relationship with non-alcoholic fatty liver disease. Eur J Intern Med. 2014;25:438–443. doi:10.1016/j.ejim.2014.03.014
32. Wang Y, Zheng X, Xie X, et al. Body fat distribution and circulating adipsin are related to metabolic risks in adult patients with newly diagnosed growth hormone deficiency and improve after treatment. Biomed Pharmacother. 2020;132:110875. doi:10.1016/j.biopha.2020.110875
33. Tafere GG, Wondafrash DZ, Zewdie KA, Assefa BT, Ayza MA. Plasma adipsin as a biomarker and its implication in type 2 diabetes mellitus. Diabetes Metab Syndr Obes. 2020;13:1855–1861. doi:10.2147/DMSO.S253967
34. Guo D, Liu J, Zhang P, et al. Adiposity measurements and metabolic syndrome are linked through circulating neuregulin 4 and adipsin levels in obese adults. Front Physiol. 2021;12:667330. doi:10.3389/fphys.2021.667330
35. Schrover IM, van der Graaf Y, Spiering W, Visseren FL. The relation between body fat distribution, plasma concentrations of adipokines and the metabolic syndrome in patients with clinically manifest vascular disease. Eur J Prev Cardiol. 2018;25:1548–1557. doi:10.1177/2047487318790722
36. Chedraui P, Pérez-López FR, Escobar GS, et al. Circulating leptin, resistin, adiponectin, visfatin, adipsin and ghrelin levels and insulin resistance in postmenopausal women with and without the metabolic syndrome. Maturitas. 2014;79:86–90. doi:10.1016/j.maturitas.2014.06.008
37. Wang Y, Zheng X, Xie X, et al. Correlation of increased serum adipsin with increased cardiovascular risks in adult patients with growth hormone deficiency. Endocr Pract. 2019;25:446–453. doi:10.4158/EP-2018-0541
38. El Sehmawy AA, Diab FEA, Hassan DA, et al. Utility of adipokines and IL-10 in association with anthropometry in prediction of insulin resistance in obese children. Diabetes Metab Syndr Obes. 2022;15:3231–3241. doi:10.2147/DMSO.S377072
39. Flier JS, Cook KS, Usher P, Spiegelman BM. Severely impaired adipsin expression in genetic and acquired obesity. Science. 1987;237(4813):405–408. doi:10.1126/science.3299706
40. Derosa G, Fogari E, D’Angelo A, et al. Adipocytokine levels in obese and non-obese subjects: an observational study. Inflammation. 2013;36:914–920. doi:10.1007/s10753-013-9620-4
41. Azizi M, Tadibi V, Behpour N. The effect of aerobic exercise training on β-cell function and circulating levels of adipsin in community of obese women with type 2 diabetes mellitus. Int J Diabetes Dev Ctries. 2016;37:298–304. doi:10.1007/s13410-016-0504-7
42. Pomeroy C, Mitchell J, Eckert E, et al. Effect of body weight and caloric restriction on serum complement proteins, including Factor D/adipsin: studies in anorexia nervosa and obesity. Clin Exp Immunol. 1997;108(3):507–515. doi:10.1046/j.1365-2249.1997.3921287.x
43. Milek M, Moulla Y, Kern M, et al. Adipsin serum concentrations and adipose tissue expression in people with obesity and type 2 diabetes. Int J Mol Sci. 2022;23:2222. doi:10.3390/ijms23042222
44. Zhou Q, Ge Q, Ding Y, et al. Relationship between serum adipsin and the first phase of glucose-stimulated insulin secretion in individuals with different glucose tolerance. J Diabetes Investig. 2018;9:1128–1134. doi:10.1111/jdi.12819
45. Platt KA, Claffey KP, Wilkison WO, Spiegelman BM, Ross SR. Independent regulation of adipose tissue-specificity and obesity response of the adipsin promoter in transgenic mice. J Biol Chem. 1994;269:28558–28562. doi:10.1016/S0021-9258(19)61941-1
46. Lin S, Huang J, Wang M, et al. Comparison of MAFLD and NAFLD diagnostic criteria in real world. Liver Int. 2020;40:2082–2089. doi:10.1111/liv.14548
47. Zhou XD, Cai J, Targher G, et al. Metabolic dysfunction-associated fatty liver disease and implications for cardiovascular risk and disease prevention. Cardiovasc Diabetol. 2022;21:270. doi:10.1186/s12933-022-01697-0
 © 2023 The Author(s). This work is published and licensed by Dove Medical Press Limited. The full terms of this license are available at https://www.dovepress.com/terms.php and incorporate the Creative Commons Attribution - Non Commercial (unported, v3.0) License.
By accessing the work you hereby accept the Terms. Non-commercial uses of the work are permitted without any further permission from Dove Medical Press Limited, provided the work is properly attributed. For permission for commercial use of this work, please see paragraphs 4.2 and 5 of our Terms.
© 2023 The Author(s). This work is published and licensed by Dove Medical Press Limited. The full terms of this license are available at https://www.dovepress.com/terms.php and incorporate the Creative Commons Attribution - Non Commercial (unported, v3.0) License.
By accessing the work you hereby accept the Terms. Non-commercial uses of the work are permitted without any further permission from Dove Medical Press Limited, provided the work is properly attributed. For permission for commercial use of this work, please see paragraphs 4.2 and 5 of our Terms.