")
Back to Journals » Diabetes, Metabolic Syndrome and Obesity » Volume 16
Incidence of Metabolic Syndrome and Its Risk Factors in Elderly with Nonalcoholic Fatty Liver Disease
Authors Lin FA , Hwang LC , Tsou MT , Huang WH
Received 14 June 2023
Accepted for publication 12 September 2023
Published 15 September 2023 Volume 2023:16 Pages 2835—2842
DOI https://doi.org/10.2147/DMSO.S425651
Checked for plagiarism Yes
Review by Single anonymous peer review
Peer reviewer comments 2
Editor who approved publication: Prof. Dr. Juei-Tang Cheng
Fang-An Lin,1 Lee-Ching Hwang,1,2 Meng-Ting Tsou,1,3 Wei-Hsin Huang1,2
1Department of Family Medicine, Mackay Memorial Hospital, Taipei, Taiwan; 2Department of Medicine, Mackay Medical College, Taipei, Taiwan; 3Mackay Junior College of Medicine, Nursing and Management, Taipei, Taiwan
Correspondence: Wei-Hsin Huang, Department of Family Medicine, Mackay Memorial Hospital, No. 92, Sec. 2, Zhongshan N. Road, Taipei City, 10449, Taiwan, Tel +886-2-2543-3535, Fax +886-2-2543-3642, Email [email protected]
Purpose: This study aimed to determine the incidence of metabolic syndrome (MetS) and its predictors in older patients with nonalcoholic fatty liver disease.
Patients and Methods: This retrospective cohort study analyzed repeated health surveillance data collected between 2009 and 2018 at Mackay Memorial Hospital, Taiwan. MetS was defined based on the modified National Cholesterol Education Program Adult Treatment Panel III (Taiwan revision). Participants were diagnosed with fatty liver disease using abdominal ultrasonography. The exclusion criteria included age < 65 years, having viral hepatitis, frequent alcohol consumption, and pre-existing MetS. Logistic regression analysis was conducted, adjusting for sex and age.
Results: We enrolled 758 older participants; 457 (60.3%) with preexisting metabolic syndrome were excluded. We studied the remaining 301 participants (39.7%), with a mean age of 71.3 ± 5.4 years. The cumulative incidence of MetS was 43.5% after a mean follow-up period of 4.2 years; moreover, it was higher in women as well as in participants with diabetes and hypertriglyceridemia. After adjusting for age and sex, we identified the following risk factors for MetS: baseline high fasting plasma glucose levels (adjusted odds ratio [aOR] =1.75; 95% confidence interval [CI] 1.03– 2.95), baseline hypertriglyceridemia (aOR = 2.26; 95% CI 1.15– 4.47), and baseline large waist circumference (aOR =1.71; 95% CI 1.01– 2.89). Furthermore, increased waist circumference and fasting plasma glucose levels at follow-up were significant risk factors.
Conclusion: There is a high incidence of MetS among older individuals with nonalcoholic fatty liver disease; further, women and individuals with diabetes or hypertriglyceridemia are at risk of developing MetS. Moreover, waist circumference and fasting plasma glucose levels were positively associated with the risk of MetS.
Keywords: Incidence, metabolic syndrome, fatty liver disease, NAFLD, elderly
Introduction
Metabolic syndrome (MetS) is defined as the presence of at least 3 of these components: elevated waist circumference (WC), elevated triglycerides (TG), reduced high-density lipoprotein cholesterol (HDL-C), high blood pressure, and elevated fasting plasma glucose (FPG). Across various definitions, the prevalence of MetS ranges from 12.5% to 31.4%, including subgroup analyses based on geographic location and the income level of countries.1 According to the National Health Survey conducted by the Health Promotion Administration from 2017–2020, the prevalence of MetS in Taiwan was 24.8%, which was relatively higher among individuals aged ≥ 65 years. However, the incidence of MetS among adults remains unclear. A 5-year Vietnamese prospective study reported that the cumulative MetS incidence among people aged 40–64 years was 23.4%.2 Using different definition criteria, the incidence of MetS in Zahedan, Iran, was reportedly 17.21–27.18% in 2021.3 Additionally, a 5-year Korean prospective cohort reported that the cumulative incidence of MetS was 13.9% in men and 20.8% in women.4 In Taiwan, the incidence of MetS in older adults is more than thrice higher than that in young adults.5
MetS is also referred to as insulin resistance syndrome. Aging is associated with the development of insulin resistance, increased consumption of high-calorie and low-fiber foods, reduced physical activity, and increased visceral adipose tissue, which all contribute to the relatively high prevalence of MetS in older adults.6,7 It has become clear that hyperglycemia, excess free fatty acids, and elevated TG levels lead to oxidative stress and inflammation in cardiac tissue, increasing the risk of cardiovascular disease.8 MetS has been associated with an increased risk of several chronic diseases, including coronary heart disease, type 2 diabetes mellitus (T2DM), stroke, chronic kidney disease, osteoarthritis, and several cancer types.9,10 It is a highly prevalent non-communicable disease and has become a major public health concern.11
Metabolic-associated fatty liver disease (MAFLD) is inclusively defined as the coexistence of fatty liver disease with either overweight or obesity and/or T2DM, or the presence of at least 2 out of 7 metabolic risk abnormalities in lean or normal-weight individuals.12 MAFLD is more prevalent in patients with major cardiovascular risk factors, including T2DM, obesity, and hypertension (HTN).13 Insulin resistance may be the key link between MAFLD and cardiovascular disease.14 Non-alcoholic fatty liver disease (NAFLD) and MAFLD overlap significantly, making them approximately equivalent clinically and epidemiologically.12 Aging may be associated with a high prevalence and an increased risk of progression of NAFLD.15 Given the increasingly aging society, there have been increased concerns regarding the risk of MetS among older people with NAFLD. However, the incidence of MetS in older adults remains unclear; further, there remains no consensus regarding the most appropriate indicator of MetS in older adults. Therefore, this study aimed to determine the incidence of MetS and its predictors in older patients with NAFLD.
Materials and Methods
Population and Study Design
This retrospective cohort study used repeated health surveillance data collected between 2009 and 2018. We collected the following background information: demographic characteristics, medical history, smoking history, blood pressure, body mass index (BMI), WC, blood biochemistry, and abdominal ultrasound, from a geriatric (≥ 65 years old) health check-up database in the health examination center of a medical center. All participants were instructed to observe an 8-hour fasting period before venous blood collection. Blood biochemical tests included FPG using a hexokinase method, total cholesterol (TC), low-density lipoprotein cholesterol (LDL-C), HDL-C, and TG. These analyses were conducted using a biochemical auto-analyzer (Hitachi 7170 automatic analyzer). An experienced gastroenterologist blinded to the purpose of the study performed abdominal ultrasonography using an HD-15 ultrasound system (Philips Medical Systems, Cleveland, OH) to assess the presence and extent of fatty liver disease. We included participants diagnosed with fatty liver disease using abdominal ultrasonography at baseline who underwent follow-up health examinations. Individuals with a history of hepatitis C virus infection (or anti-HCV positivity), hepatitis B virus infection (or HBsAg positivity), regular alcohol consumption, or pre-existing MetS were excluded.
This is a non-interventional, observational and retrospective study with minimal risk for the participants. All the data was collected in the context of clinical care and were anonymized. The study protocol was evaluated and approved by the institutional research board, Human Research Ethics Committee of Mackay Memorial Hospital (project research number 18MMHIS137), which confirmed alignment with the Declaration of Helsinki. Since patient data was delinked, there was a waiver indicated by the institutional research board. All patient identifiers have been removed or anonymized to prevent any possibility of reidentification. Our commitment to patient data confidentiality extends beyond this report.
Diagnostic Criteria
According to the Bureau of Health Promotion in Taiwan, individuals who meet at least three of the following criteria were considered to have MetS, as defined by the modified National Cholesterol Education Program Adult Treatment Panel III (Taiwan Revision): 1) abdominal obesity: large WC (WC ≥ 90 cm for men and ≥ 80 cm for women); 2) hypertriglyceridemia (≥150 mg/dL); 3) low HDL-C levels (< 40 mg/dL for men and < 50 mg/dL for women); 4) high blood pressure (systolic blood pressure [SBP] ≥ 130 mmHg, diastolic blood pressure [DBP] ≥ 85 mmHg, or history of HTN, according to self-report or medical records); and 5) high FPG levels (≥100 mg/ dL) or history of T2DM (according to self-report or medical records).
NAFLD was diagnosed based on ultrasonography findings using the following criteria: 1) increased echogenicity of the hepatic parenchyma compared with that of the renal parenchyma, 2) decreased border definition of the intrahepatic vessels, and 3) decreased penetration of the ultrasound signal and diaphragm visibility.
The Taiwan Ministry of Health and Welfare defines a BMI of 24.0–26.9 and ≥ 27.0 as overweight and obese, respectively.16
Statistical Analysis
Statistical analyses were performed using SAS software, version 9.3. Continuous variables are expressed as means and standard deviations. Categorical variables are expressed as frequencies and percentages. Paired t-test and McNemar’s test were used to compare baseline and follow-up characteristics. Logistic regression analysis was performed to identify risk factors for the incidence of MetS, with adjustment for sex and age. The odds ratios (ORs) and 95% confidence intervals (CIs) were presented, with statistical significance set at P < 0.05. The logistic regression models yielded more significant results for the categorical variables of the MetS components as well as changes in the values of continuous variables during the follow-up period.
Results
We recruited 758 older participants, with 457 (60.3%) having preexisting metabolic syndrome. We studied the eligible 301 participants (39.7%), including 100 (33.2%) men and 201 (66.8%) women, with a mean age of 71.3 ± 5.4 years. Table 1 lists the demographic and laboratory data. T2DM and HTN were present in 5.7% and 38.9% of the participants, respectively; moreover, >64% of the participants were overweight or obese. At follow-up, there was an increase in the prevalence of T2DM and HTN as well as a decrease in weight and TC and LDL-C levels. Additionally, there were significant adverse changes in the WC, FPG levels, HDL-C levels, and SBP at follow-up.
 |
Table 1 Anthropometric, Clinical, and Laboratory Data of the Included Participants |
Tables 2–4 present the relationships among the variables, changes at follow-up, and MetS components in individuals with and without MetS development. After a mean follow-up duration of 4.2 years, the incidence of MetS was 43.5% (n = 131). As shown in Table 2, there was a relatively higher incidence of MetS in women (p=0.035) and participants with diabetes (p=0.001). The incidence of MetS was positively correlated with baseline FPG levels (p = 0.006; Table 2) and hypertriglyceridemia (p = 0.024; Table 4). At follow-up, the incidence of MetS was positively correlated with the change in WC (p=0.01; Table 3) and FPG levels (p=0.001; Table 3), as well as negatively correlated with the change in HDL-C levels (p=0.027; Table 3). As shown in Table 2, there was a trend of a positive correlation between weight and MetS incidence, with 37.0%, 43.9%, and 54.0% of participants with normal weight, overweight, and obesity presenting MetS, respectively. As shown in Table 3, participants who developed MetS had significantly larger WC, higher FPG levels, lower HDL-C levels, and a borderline significantly higher BMI change than those without MetS at baseline.
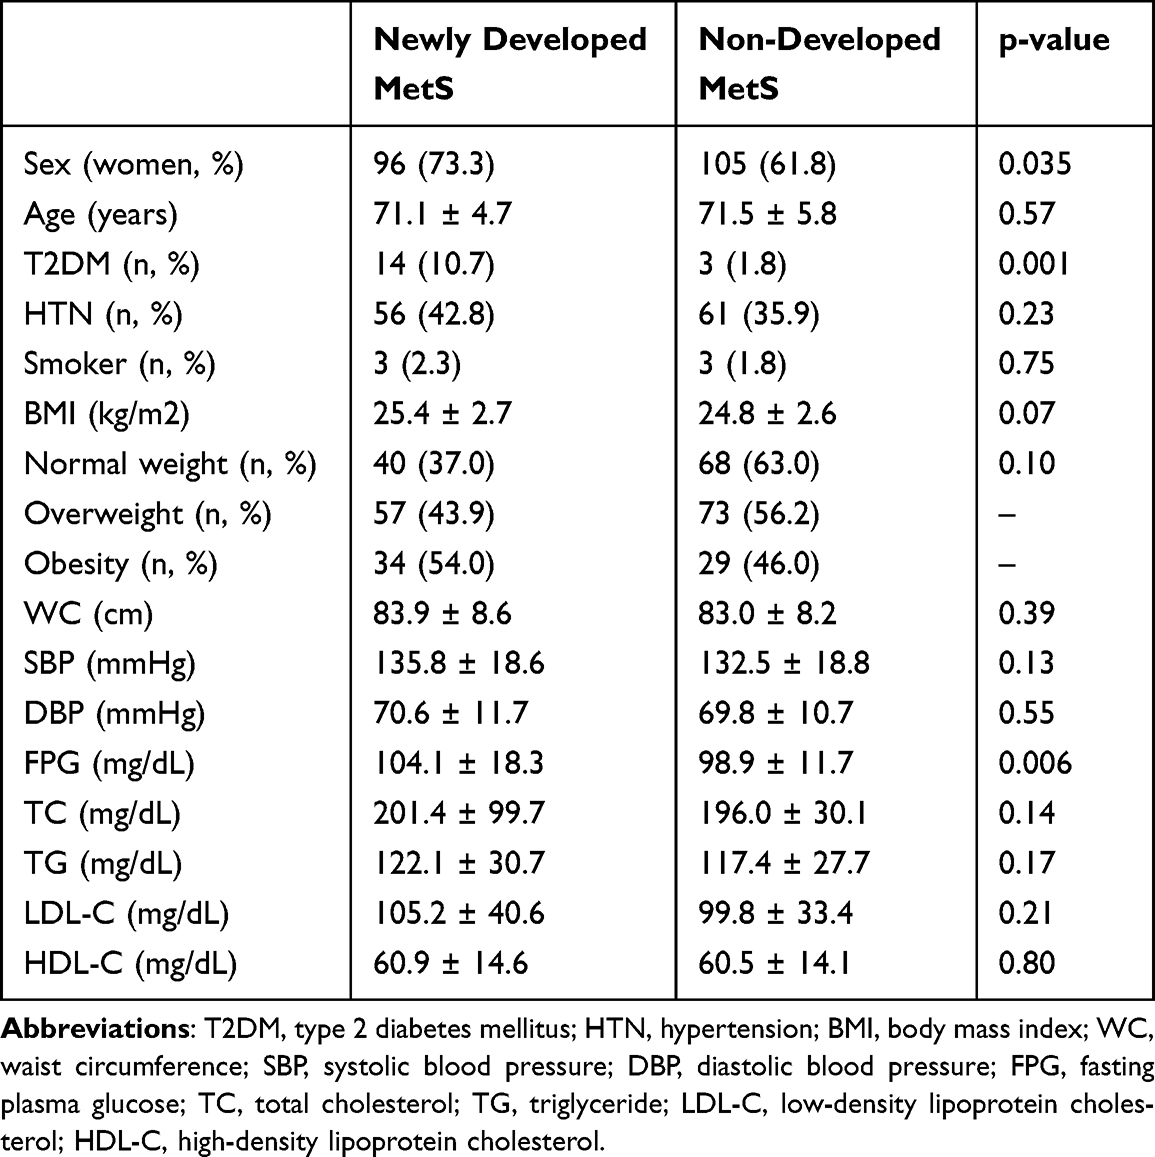 |
Table 2 Baseline Variables Related to the Incidence of MetS |
 |
Table 3 Change in Certain Variables and the Incidence of MetS |
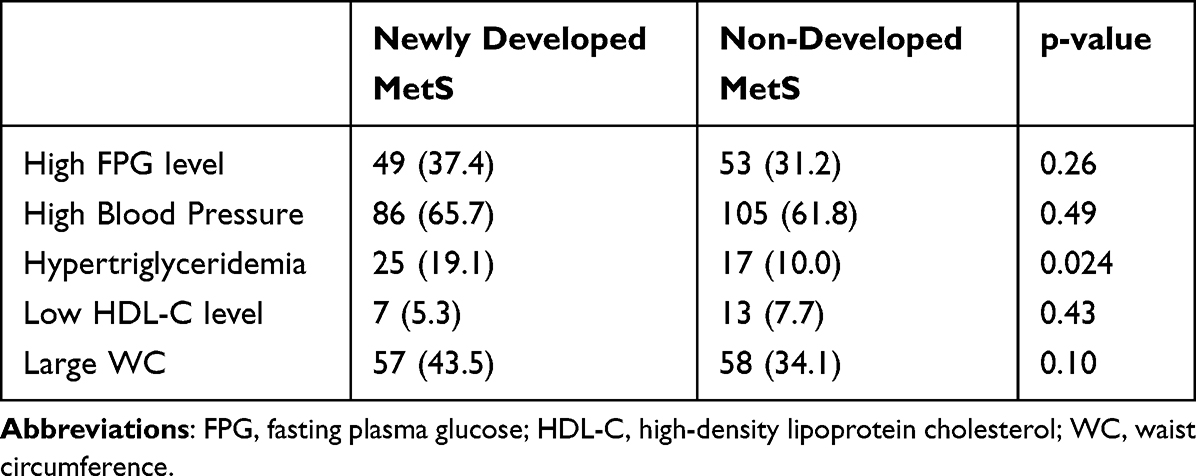 |
Table 4 MetS Components at Baseline and MetS Incidence by Number of Cases (%) |
Table 5 presents the age- and sex-adjusted ORs for MetS components at baseline as well as changes in MetS components associated with MetS onset during follow-up. After adjusting for age and sex, there were significantly higher ORs for MetS incidence among individuals with hypertriglyceridemia (adjusted OR, aOR =2.26; 95% CI 1.15–4.47) and high FPG levels (aOR =1.75; 95% CI 1.03–2.95) at baseline, as well as those with a greater change in FPG levels (aOR =1.05; 95% CI 1.02–1.08) at follow-up. Additionally, WC at baseline (aOR =1.71; 95% CI 1.01–2.89) and a greater change at follow-up (aOR =1.09; 95% CI 1.02–1.11) showed a significant positive correlation with the OR for MetS incidence. There were no significant differences in baseline blood pressure or its changes at follow-up, baseline HDL-C levels or, its changes at follow-up, or changes in TG levels at follow-up.
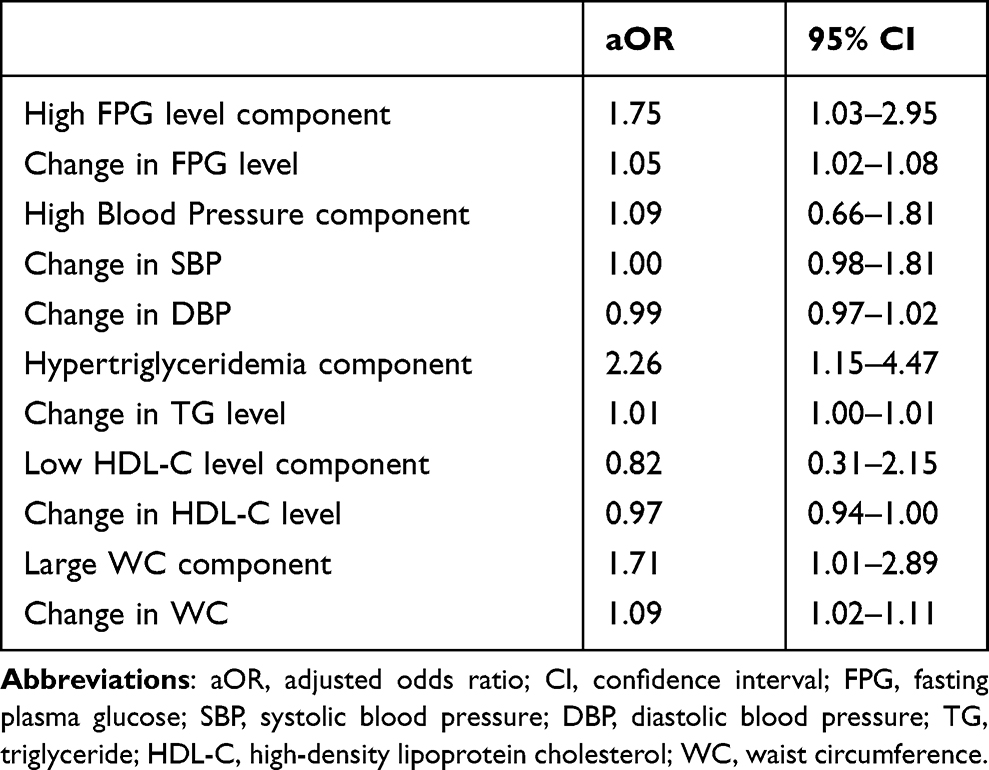 |
Table 5 Age- and Sex-Adjusted Odds Ratios for MetS Incidence |
Discussion
Our findings indicated an increased prevalence of T2DM among older adults with NAFLD as well as significant adverse changes in weight, WC, and cholesterol profiles during the follow-up period, which is consistent with previous reports.17,18 In our study, the incidence of MetS among older adults with NAFLD was 43.5%, which is consistent with a previous Taiwanese report.5 Furthermore, our findings demonstrated that the incidence of MetS in older adults with NAFLD is over two times higher than previously reported values among middle-aged adults (19.73–23.4%).2,3 In our study, there was a relatively high incidence of MetS among women and patients with diabetes. Additionally, we observed a significantly increased likelihood of developing MetS in individuals with high FPG levels at baseline or follow-up, large WC at baseline or follow-up, and the presence of hypertriglyceridemia at baseline.
Overweightness and obesity are common among older adults; further, they are often associated with metabolic and physiological disorders, including HTN and dyslipidemia.19 This can be attributed to an increase in sedentary lifestyle behaviors, functional impairment, and decreased physical activity among older adults.9,20 More than two-thirds of individuals with obesity present NAFLD.21 NAFLD is a common but benign finding with a prevalence of 46.2% among octogenarians.22 NAFLD is closely associated with MetS, which is demonstrated by the fact that ≈90% of patients with NAFLD have more than one MetS component and ≈33% of these patients have three or more of these MetS components.21 At a younger age, NAFLD may be more frequently observed in men than in women.23 Contrastingly, the relatively high incidence of NAFLD in women may be delayed by approximately a decade, which could be attributed to postmenopausal estrogenic alterations.15,22,24 Accordingly, the ratio of men to women in our study was 1:2; moreover, we adjusted for sex as a covariate in the logistic regression analysis. Compared with men, women have a lower energy expenditure and a higher incidence of MetS.2–4,25,26 This is consistent with our findings, which showed a significantly higher incidence of MetS in women than in men.
There is an aging-related increase in abdominal fat and fat deposition in the muscles, liver, and bone marrow.17,27 Abnormal fat accumulation in both muscles and ectopic sites, including the liver, is crucially involved in the etiology of insulin resistance.21 This is consistent with our findings of a relatively high incidence of MetS in patients with diabetes. Moreover, individuals with MetS have a five-fold higher risk of developing T2DM.28 The redistribution of body fat from subcutaneous tissue to visceral adipose tissue in older individuals has adverse metabolic effects, including hyperinsulinemia, hypertriglyceridemia, and low HDL-C levels, which are characteristic features of insulin resistance.17 Most studies have suggested that low HDL-C levels have a more significant effect on patients who develop MetS.25,28,29 Our findings suggest that the incidence of MetS is positively correlated with adverse alterations in HDL-C and FPG levels at follow-up, as well as high baseline FPG levels. Notably, hypertriglyceridemia, rather than low HDL-C levels, was the only clinically significant indicator among the five standard components of MetS. This is consistent with previous reports of a significant correlation between the prevalence and severity of NAFLD and hypertriglyceridemia.30
A previous study indicated that large WC and hypertriglyceridemia were the MetS components with the highest contribution to the positive correlation between all-day energy intake and MetS development in older adults.31 WC is among the most reliable anthropometric predictors of MetS in older adults.2,25–27 In a multiethnic population, central obesity is a reliable predictor of incident MetS and may even precede the development of insulin resistance.29 A previous study on an urban southern European population reported that central obesity was associated with an increased incidence of MetS.32 Additionally, compared with White individuals, Asian individuals exhibit a higher percentage of body fat, especially abdominal visceral fat, even with the same BMI.33 An 8-year Iranian cohort study reported that the highest incidence rate of MetS was observed for large WC, followed by high blood pressure, high FPG levels, hypertriglyceridemia, and low HDL-C levels.3 Consistent with these previous findings, our findings indicated that a high WC at baseline and follow-up was significantly associated with an increased likelihood of MetS development.
This study has several limitations. First, NAFLD was diagnosed based on abdominal ultrasound rather than liver biopsy or histological examination, which are considered the gold standards for NAFLD diagnosis. Moreover, this approach has rarely been used in epidemiological studies. Nonetheless, abdominal ultrasound is a well-established tool that is widely utilized as a screening modality, with an acceptable sensitivity of 89% and a specificity of 93% for detecting fatty liver disease.18 Moreover, a noninvasive diagnostic approach seems to be more appropriate for this age group.34 Second, we did not adjust for other risk factors and covariates, such as education, living conditions, physical activity, and dietary determinants.18 Third, the mean follow-up duration was relatively short (4.2 years). Future long-term studies are warranted to validate our findings. Finally, this was a single-center small-scale study. Therefore, large-scale multicenter studies are necessary to obtain more rigorous and statistically significant outcomes.
Conclusion
The incidence of MetS is high among older adults with NAFLD; moreover, MetS development is positively correlated with WC and FPG levels. Given the increasingly aging population, there is a need for surveillance, which includes regular measurements of WC, blood glucose, and lipid levels to prevent MetS progression.
Funding
The authors disclosed no receipt of any financial support for the study or authorship of this article.
Disclosure
The authors report no conflicts of interest in this work.
References
1. Noubiap JJ, Richie Nansseu JR, Lontchi-Yimagou E, et al. Geographic distribution of metabolic syndrome and its components in the general adult population: a meta-analysis of global data from 28 million individuals. Diabetes Res Clin Pract. 2022;188:109924. doi:10.1016/j.diabres.2022.109924
2. Thuyen TQ, Duong DH, Nga BTT, et al. Incidence and prediction nomogram for metabolic syndrome in a middle-aged Vietnamese population: a 5-year follow-up study. Endocr. 2022;75(1):108–118. doi:10.1007/s12020-021-02836-5
3. Farmanfarma K, Ansari-Moghaddam A, Kaykhaei M, Mohammadi M, Adineh H, Aliabd H. Incidence of and factors associated with metabolic syndrome, south-east Islamic Republic of Iran. East Mediterr Health J. 2021;27(11):1084–1091. doi:10.26719/emhj.21.051
4. Hwang JH, Kam S, Shin JY, et al. Incidence of metabolic syndrome and relative importance of five components as a predictor of metabolic syndrome: 5-year follow-up study in Korea. J Korean Med Sci. 2013;28(12):1768–1773. doi:10.3346/jkms.2013.28.12.1768
5. Yang FY, Wahlqvist ML, Lee MS. Body mass index (BMI) as a major factor in the incidence of the metabolic syndrome and its constituents in unaffected Taiwanese from 1998 to 2002. Asia Pac J Clin Nutr. 2008;17(2):339–351.
6. Park YW, Zhu S, Palaniappan L, Heshka S, Carnethon MR, Heymsfield SB. The metabolic syndrome: prevalence and associated risk factor findings in the US population from the Third National Health and Nutrition Examination Survey, 1988–1994. Arch Intern Med. 2003;163(4):427–436. doi:10.1001/archinte.163.4.427
7. Ryan AS. Insulin resistance with aging: effects of diet and exercise. Sports Med. 2000;30(5):327–346. doi:10.2165/00007256-200030050-00002
8. Gutiérrez-Cuevas J, Sandoval-Rodriguez A, Meza-Rios A, et al. Molecular mechanisms of obesity-linked cardiac dysfunction: an up-date on current knowledge. Cells. 2021;10(3):629. doi:10.3390/cells10030629
9. Moore JX, Chaudhary N, Akinyemiju T. Metabolic syndrome prevalence by race/ethnicity and sex in the United States, National Health and Nutrition Examination Survey, 1988–2012. Prev Chronic Dis. 2017;14:E24. doi:10.5888/pcd14.160287
10. Esposito K, Chiodini P, Colao A, Lenzi A, Giugliano D. Metabolic syndrome and risk of cancer: a systematic review and meta-analysis. Diabetes Care. 2012;35(11):2402–2411. doi:10.2337/dc12-0336
11. Ge H, Yang Z, Li X, et al. The prevalence and associated factors of metabolic syndrome in Chinese aging population. Sci Rep. 2020;10(1):20034. doi:10.1038/s41598-020-77184-x
12. García-Compeán D, Jiménez-Rodríguez AR. NAFLD VS MAFLD. The evidence-based debate has come. Time to change? Ann Hepatol. 2022;27(6):100765. doi:10.1016/j.aohep.2022.100765
13. Alkagiet S, Papagiannis A, Tziomalos K. Associations between nonalcoholic fatty liver disease and ischemic stroke. World J Hepatol. 2018;10(7):474–478. doi:10.4254/wjh.v10.i7.474
14. Gutiérrez-Cuevas J, Santos A, Armendariz-Borunda J. Pathophysiological molecular mechanisms of obesity: a link between MAFLD and NASH with cardiovascular diseases. Int J Mol Sci. 2021;22(21):11629. doi:10.3390/ijms222111629
15. Golabi P, Paik J, Reddy R, Bugianesi E, Trimble G, Younossi ZM. Prevalence and long-term outcomes of non-alcoholic fatty liver disease among elderly individuals from the United States. BMC Gastroenterol. 2019;19(1):56. doi:10.1186/s12876-019-0972-6
16. Health Promotion Administration, Ministry of Health and Welfare. Taiwan’s Obesity Prevention and Management Strategy.
17. Gan L, Chitturi S, Farrell GC. Mechanisms and implications of age-related changes in the liver: nonalcoholic fatty liver disease in the elderly. Curr Gerontol Geriatr Res. 2011;2011:831536. doi:10.1155/2011/831536
18. Wang Z, Xu M, Peng J, et al. Prevalence and associated metabolic factors of fatty liver disease in the elderly. Exp Gerontol. 2013;48(8):705–709. doi:10.1016/j.exger.2013.05.059
19. Ortiz-Rodríguez MA, Yáñez-Velasco L, Carnevale A, et al. Prevalence of metabolic syndrome among elderly Mexicans. Arch Gerontol Geriatr. 2017;73:288–293. doi:10.1016/j.archger.2017.09.001
20. Saklayen MG. The global epidemic of the metabolic syndrome. Curr Hypertens Rep. 2018;20(2):12. doi:10.1007/s11906-018-0812-z
21. Almeda-Valdés P, Cuevas-Ramos D, Aguilar-Salinas CA. Metabolic syndrome and non-alcoholic fatty liver disease. Ann Hepatol. 2009;8:18–24. doi:10.1016/S1665-2681(19)31822-8
22. Kagansky N, Levy S, Keter D, et al. Non-alcoholic fatty liver disease--a common and benign finding in octogenarian patients. Liver Int. 2004;24(6):588–594. doi:10.1111/j.1478-3231.2004.0969.x
23. Fan JG, Zhu J, Li XJ, et al. Prevalence of and risk factors for fatty liver in a general population of Shanghai, China. J Hepatol. 2005;43(3):508–514. doi:10.1016/j.jhep.2005.02.042
24. Bertolotti M, Lonardo A, Mussi C, et al. Nonalcoholic fatty liver disease and aging: epidemiology to management. World J Gastroenterol. 2014;20(39):14185–14204. doi:10.3748/wjg.v20.i39.14185
25. Bakhshayeshkaram M, Heydari ST, Honarvar B, et al. Incidence of metabolic syndrome and determinants of its progression in Southern Iran: a 5-year longitudinal follow-up study. J Res Med Sci. 2020;25(1):103. doi:10.4103/jrms.JRMS_884_19
26. James M, Varghese TP, Sharma R, Chand S. Association between metabolic syndrome and diabetes mellitus according to international diabetic federation and national cholesterol education program adult treatment panel III criteria: a cross-sectional study. J Diabetes Metab Disord. 2020;19(1):437–443. doi:10.1007/s40200-020-00523-2
27. Kuk JL, Saunders TJ, Davidson LE, Ross R. Age-related changes in total and regional fat distribution. Ageing Res Rev. 2009;8(4):339–348. doi:10.1016/j.arr.2009.06.001
28. Jayant SS, Gupta R, Rastogi A, et al. Incidence and predictors of metabolic syndrome in Asian-Indians: a 10-year population-based prospective cohort study. Int J Diabetes Dev Ctries. 2023. doi:10.1007/s13410-023-01169-5
29. Palaniappan L, Carnethon MR, Wang Y, et al. Predictors of the incident metabolic syndrome in adults: the Insulin Resistance Atherosclerosis Study. Diabetes Care. 2004;27(3):788–793. doi:10.2337/diacare.27.3.788
30. Hsiao PJ, Kuo KK, Shin SJ, et al. Significant correlations between severe fatty liver and risk factors for metabolic syndrome. J Gastroenterol Hepatol. 2007;22(12):2118–2123. doi:10.1111/j.1440-1746.2006.04698.x
31. Hermenegildo-López Y, Donat-Vargas C, Sandoval-Insausti H, et al. A higher intake of energy at dinner is associated with incident metabolic syndrome: a prospective cohort study in older adults. Nutrients. 2021;13(9):3035. doi:10.3390/nu13093035
32. Santos AC, Severo M, Barros H. Incidence and risk factors for the metabolic syndrome in an urban South European population. Prev Med. 2010;50(3):99–105. doi:10.1016/j.ypmed.2009.11.011
33. He Y, Jiang B, Wang J, et al. Prevalence of the metabolic syndrome and its relation to cardiovascular disease in an elderly Chinese population. JACC. 2006;47(8):1588–1594. doi:10.1016/j.jacc.2005.11.074
34. Machado MV, Cortez-Pinto H. Non-invasive diagnosis of non-alcoholic fatty liver disease. A critical appraisal. Hepatol. 2013;58(5):1007–1019. doi:10.1016/j.jhep.2012.11.021
 © 2023 The Author(s). This work is published and licensed by Dove Medical Press Limited. The full terms of this license are available at https://www.dovepress.com/terms.php and incorporate the Creative Commons Attribution - Non Commercial (unported, v3.0) License.
By accessing the work you hereby accept the Terms. Non-commercial uses of the work are permitted without any further permission from Dove Medical Press Limited, provided the work is properly attributed. For permission for commercial use of this work, please see paragraphs 4.2 and 5 of our Terms.
© 2023 The Author(s). This work is published and licensed by Dove Medical Press Limited. The full terms of this license are available at https://www.dovepress.com/terms.php and incorporate the Creative Commons Attribution - Non Commercial (unported, v3.0) License.
By accessing the work you hereby accept the Terms. Non-commercial uses of the work are permitted without any further permission from Dove Medical Press Limited, provided the work is properly attributed. For permission for commercial use of this work, please see paragraphs 4.2 and 5 of our Terms.