Back to Journals » Clinical Epidemiology » Volume 14
Incidence, Mortality and Survival in Young People with Co-Occurring Mental Disorders and Substance Use: A Retrospective Linked Routine Data Study in Wales
Authors Rees S ![]() , Watkins A, Keauffling J, John A
, Watkins A, Keauffling J, John A
Received 17 June 2021
Accepted for publication 8 October 2021
Published 13 January 2022 Volume 2022:14 Pages 21—38
DOI https://doi.org/10.2147/CLEP.S325235
Checked for plagiarism Yes
Review by Single anonymous peer review
Peer reviewer comments 2
Editor who approved publication: Professor Lars Pedersen
Sarah Rees,1 Alan Watkins,1 Janet Keauffling,2 Ann John1
1Population Data Science, Swansea University Medical School, Swansea, SA2 8PP, UK; 2Abertawe Medical Partnership, Swansea, SA1 1NE, UK
Correspondence: Sarah Rees Email [email protected]
Introduction: Mental disorder (MD) and substance use (SUD) are associated with poorer than average health and greater mortality. We analysed routine primary care (WLGP) and inpatient admission (PEDW) data to estimate incidence of co-occurring (CC) MD and SUD, and to estimate all-cause mortality and survival with CC, in children and young people in Wales, UK.
Methods: A retrospective population-based electronic cohort study using data from the Secure Anonymised Information Linkage (SAIL) Databank. Participants were 958,603 individuals aged 11– 25 between 2008 and 2017. We estimated first ever incidence of CC, plotted Kaplan–Meier survival curves and carried out Cox regression to estimate hazard ratios (HR) for risk of death by condition group (CC; MD or SUD only; NC).
Results: Higher incidence of CC in WLGP and PEDW was associated with male sex, older age and greater deprivation. Male to female IRRs (95% CI) were 1.18 (1.12– 1.24) in WLGP and 1.17 (1.10– 1.24) in PEDW, oldest to youngest IRRs were 24.80 (21.20– 29.40) in WLGP and 4.50 (4.08– 4.98) in PEDW and most to least deprived IRRs were 3.28 (3.00– 3.58) in WLGP and 2.59 (2.36– 2.84) in PEDW. Incidence in WLGP significantly decreased between 2008 and 2017 (IRR = 0.88, 95% CI 0.78– 0.99); the greatest reduction occurred in the most deprived quintile (IRR 0.67, 95% CI 0.54– 0.82). Incidence of hospital admissions remained stable (IRR = 0.95, 95% CI 0.84– 1.08). Risk of death was significantly higher for CC compared with NC (HR = 8.7, 95% CI 7.5– 10.0).
Conclusion: Male sex, older age and greater deprivation were associated with higher CC incidence, although the gap between WIMD quintiles has decreased. CC was associated with greater risk of death. Mental health and substance misuse services should be provided in ways that remove barriers, and are acceptable and accessible to all, particularly those at greatest risk, or who are less likely to engage.
Keywords: routine data linkage, mental disorder, substance use, co-occurring conditions, dual diagnosis, mental health of young people
Introduction
Mental disorders (MD) and use of substances such as illegal drugs or alcohol (SUD) together account for 7.4% of the global burden of disease and are the leading causes of years lived with disability (YLD).1 They frequently co-occur;2 among users of community mental health team (CMHT) and drug and alcohol services in four UK cities in 2001–2002, 44% of CMHT service users reported SUD, with 75% of drug service users and 85% of alcohol service users reporting one or more MD.3 In the UK during the 2000s, MD and SUD were found to be strongly associated with poorer than average health and greater risk of premature death.4 During the 1990s, prevalence of CC recorded in routine primary care data in England and Wales significantly increased.5 A study of birth cohorts from the UK (births in 1946) and New Zealand (births in 1972–73) and survey data from the USA in the late 1990s and early 2000s suggested that at least half of adult mental disorders began in adolescence, with anxiety disorders typically presenting earlier than substance use disorders and psychotic disorders.6 There may be long-term consequences for children and young people with these diagnoses, increasing the likelihood of poorer social, physical and mental health outcomes during the course of their lives.7 A range of individuals and services are involved in the provision of care for children and young people with MD or SUD in Wales, including parents and carers, schools, primary care, specialist child and adolescent mental health services (CAMHS) and children’s social care.8
Studies from the late 1990s onwards have identified a complex epidemiological picture for MD and SUD in young people in the UK. In people under the age of 20 in England and Wales, incidence of anxiety and depression diagnosis is declining, but incidence of associated symptoms, and the prescription of antidepressants and anxiolytics, is increasing.9–12 Survey data show an increase in emotional disorders in young people up to the age of 19 in England, particularly older female adolescents.10 Between 2001 and 2016, the proportion of 8–24 year olds in England reporting that they drink alcohol has fallen,13 contacts with primary care relating to alcohol dependency in people under 25 in the UK have declined since 2005,14 abstinence in young people aged 16–24 in England increased between 2005 and 2015,15 and alcohol-related emergency admissions for 10 to 18 year olds in Wales decreased between 2006 and 2011.16 However following declining rates of reported drug use by young people in England between 2001 and 2014, rates since 2014 are increasing for both 11–15 year olds17 and 16–24 year olds18 and poisoning events associated with alcohol and opioids (including prescribed opioids) increased between 1998 and 2014, particularly among females in the UK using opioids.19 People aged 10–19 years old in England between 1997 and 2012 were at significantly increased risk of death or further emergency admission in the 10 year period following a drug or alcohol-related hospital admission20 and SUD was a significant risk factor for progression to suicidal behaviour in young people under 22 in the UK who self-harm or express suicidal thoughts.21
The authors are not aware of any recent studies using routine health data in the UK to examine trends and outcomes for children and young people with CC, and the National Institute for Health and Care Excellence (NICE), the body responsible for producing clinical guidelines covering the NHS in England, Wales and Northern Ireland, has identified a need for research in this area.22 The aims of this study were: 1) to use routine health data from primary care, inpatient admissions and death registrations to estimate first recorded incidence of CC in children and young people aged 11–25 in Wales, UK; 2) to estimate all-cause mortality rate and 10 year survival with CC in this population; and 3) to compare survival and mortality for individuals with codes for either CC, a record of either MD or SUD or no relevant codes recorded.
Methods
Design
A retrospective population-based electronic cohort study was conducted using linked routine primary care, hospital inpatient admissions and mortality data.
Data Source
The data source for this study was Secure Anonymised Information Linkage (SAIL) Databank, a secure repository established and managed by Swansea University Medical School, Wales. It houses anonymised health and related datasets describing the Welsh population, which can be linked for research purposes.23,24 Datasets (Table 1) were prepared within the Adolescent Mental Health Data Platform.25 We used data for the period 2008–2017 inclusive; data were available for the full study period from all datasets.
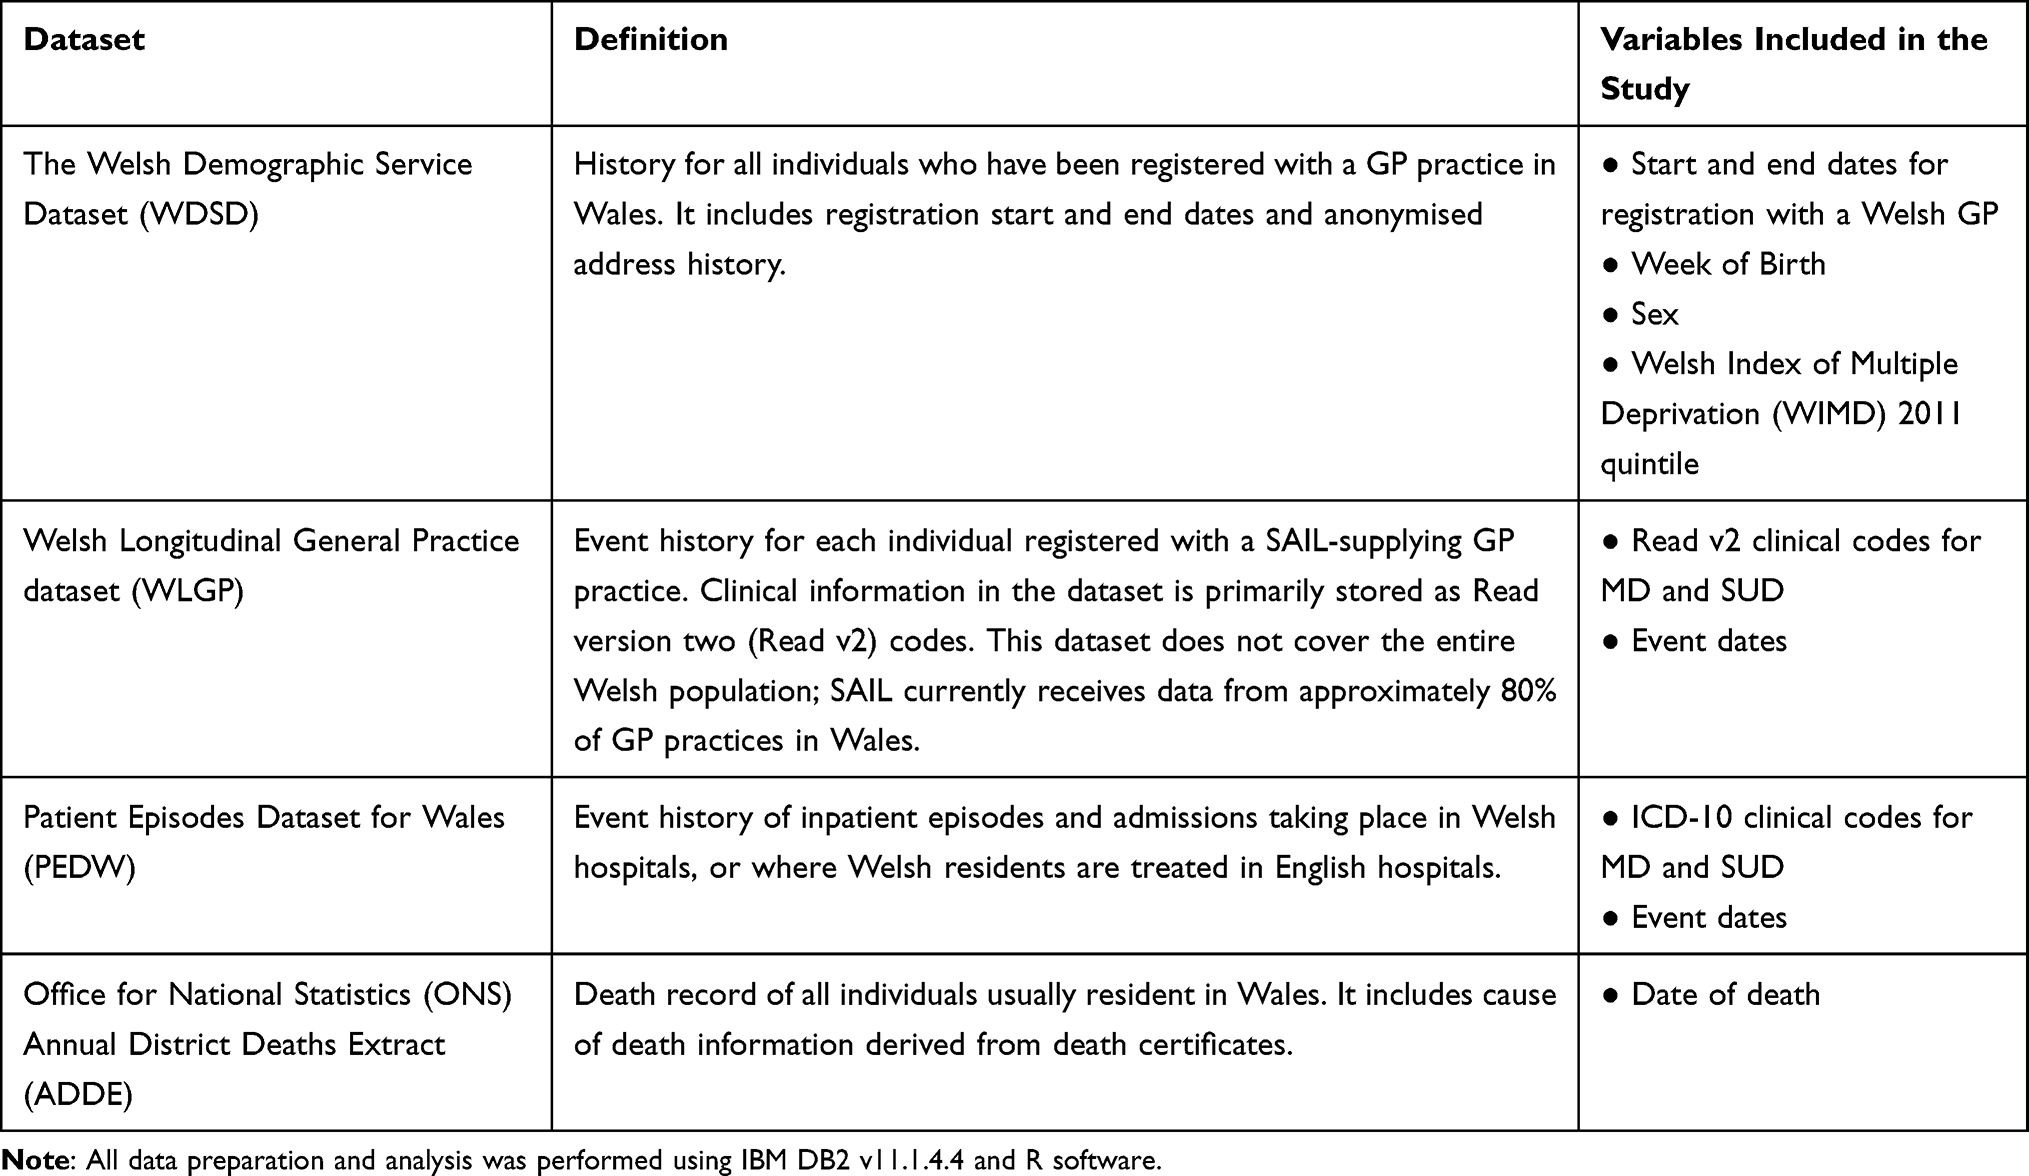 |
Table 1 Summary of Data Sources |
Measures
Clinical Coding for Case Definitions
Read V2 Codes: Substance Use and Co-Occurring Conditions
With clinical input and based on published literature14,26,27 we compiled a list of SUD-related Read v2 codes, including diagnoses, symptoms, observations, medications, behaviours (eg “injecting drug user”), referrals and contacts with other services. We included codes for alcohol and illegal drugs but excluded tobacco, in keeping with similar studies.5,28 We included codes designating MD due to substance use, which were classified as CC without requiring the presence of a second MD or SUD code (for example Read v2 codes in section Eu%, designating “Mental and behavioural disorders due to psychoactive substance use”): this included codes for mental and behavioural disorders due to acute intoxication, as there is an association between contact with services for acute intoxication and subsequent suicide risk.29
We included only those prescriptions relevant to treatment for substance use, and excluded those used primarily for pain management. We included disulfiram, naltrexone, lofexidine, acamprosate and methadone, as almost all recipients had a history of SUD. For buprenorphine we included only those Read v2 codes where 10% or fewer recipients had no history of SUD. We excluded alcohol Read v2 codes requiring an associated value of units relating to consumption volumes, because we could not be confident that on their own these codes denoted SUD.
International Classification of Diseases (ICD-10) Codes: Substance Use and Co-Occurring Conditions
ICD-10 codes30 were initially identified by cross-mapping with SUD Read v2 codes. We then searched the literature to identify any additional codes:26,27,31–33 these were cross-mapped and added to the Read v2 code list, to ensure consistency. As with Read v2 codes, ICD-10 codes designating MD due to substance use were classified as CC.
Read V2 and ICD-10 Codes: Mental Disorders
MD codes were sourced from the Adolescent Mental Health Data Platform (ADP) Concept Library.25 We included codes for depression, anxiety, severe mental illness (SMI; schizophrenia, schizotypal and delusional disorders, bipolar disorder, other mood-related disorders and other severe mental illness),9,12,34,35 eating disorders,36 Attention Deficit Hyperactivity Disorder (ADHD),37 Autistic Spectrum Disorder (ASD),37 conduct disorders37 and developmental disorders.38 Codes included both diagnoses of conditions and associated symptoms, but did not include prescription of medication associated with these conditions.
All code lists can be found in Additional File A1.
Factors and Covariates
We obtained data on factors and covariates for age, sex, and Welsh Index of Multiple Deprivation (WIMD) 2011 quintile, an area-based measure of relative deprivation in Wales.39 We divided age into four groups; 11–14, 15–17, 18–21 and 22–25 years of age (collapsed into two groups; 11–17 and 18–25, where numbers were too low to report). Age was defined at the end of each reporting year for incidence and at the start of the study window for mortality and survival. Individuals with null or contradictory indicators for sex were excluded. WIMD 2011 was derived from the 2001 census Local Super Output Area (LSOA) in which individuals were registered at the end of each year (or next nearest available record, where a record at registration end had no WIMD) for incidence, and at the start of follow-up period (or nearest available record) for mortality and survival. We did not carry out any additional imputation for missing values.
Analysis Methods: Incidence
Individuals Included
Using WDSD as the primary population, we identified individuals having their 11th – 25th birthdays between 1st January 2008 and 31st December 2017.9,12 We included only periods during which individuals were registered with a SAIL supplying GP practice. For analysis of WLGP data, we excluded the first six months of each GP registration period, to minimise the designation of prevalent cases as new incident cases due to re-recording of patient history when individuals move between GP practices.9,12 We did not apply this exclusion to the inpatient data, as there is no retrospective coding in inpatients. The data collection start date was therefore the latest of; SAIL GP registration start date (plus six months for WLGP data); first day of 11th birthday year or 1st Jan 2008. The data collection end date was the earliest of SAIL GP registration end date; last day of 25th birthday year, date of death or 31st December 2017. An individual could contribute more than one period of data; for example, where they had moved between SAIL and non-SAIL GP practices or migrated out of Wales and subsequently returned. The denominator for incidence was person years at risk (PYAR), to reflect individuals present in the data for only part of a year.5,9,12
MD and SUD Indicators
Incident cases were identified separately in primary care data (WLGP) and inpatient data (PEDW) using Read v2 and ICD-10 code lists. We excluded codes designating a history of a particular condition, as they do not distinguish between ongoing and historical conditions.
Incidence Measures
First recorded incidence was defined as the date of the first occurrence in the patient history of a CC code, or in the absence of such a code, the latter of the first MD or the first SUD code (the first of which could appear at any time in the patient history). An incident event was recorded only once for each individual, regardless of how many periods of data they contributed to the study population.
We plotted annual first recorded incidence rates to describe trends over time. Poisson regression, with an offset allowing for comparison of rates, was initially undertaken to model counts of CC incidence by year, sex, age band and WIMD quintile. The degree of over-dispersion was estimated using the Quasi-Poisson method40 and as the data were found to be over-dispersed, we ran the final analysis using Negative Binomial regression. Rates were reported as annual incidence per 1000 PYAR and incidence rate ratios (IRR) adjusted for sex, age and WIMD quintile, with 95% Confidence Intervals (CI).
Analysis Methods: Mortality
We extracted from the incidence cohort a subset of individuals born between 1983 and 1997 and registered with a SAIL-supplying GP practice on 1st January 2008. We followed these individuals for 10 years, from 1st January 2008 to 31st December 2017. Therefore, the oldest age cohort, (those born in 1983), was followed up from the year of their 25th birthday to year of their 34th birthday and the youngest age cohort (those born in 1997) was followed up from the year of their 11th birthday to the year of their 20th birthday. In this cohort each individual provided only one period of data; the start date of follow-up was 1st January 2008 and the end date was the earliest of death, 31st December 2017 or last date of registration with a SAIL-supplying GP practice (date of loss to follow-up).
We searched the patient record to identify the first occurrence of MD, SUD and CC codes, at any time between birth and end of follow-up, including codes designating a history of a particular condition. Using the ONS Annual District Deaths Extract (ADDE) we identified individuals who had died during the study window. We compared the proportion of deaths among those with a history of CC, either SUD or MD, and neither SUD or MD (NC). We calculated observed unadjusted mortality rates per 1000 PYAR for each condition group, by age, sex and WIMD quintile.
We included individuals with no prior history of SUD, who died following a single episode involving use of a substance, in either the SUD or CC groups (depending on the codes in their history). We carried out a sensitivity analysis examining the impact of designating these individuals as NC.
Analysis Methods: Survival
Using the subset of individuals present in SAIL on 1st January 2008, we estimated survival from start of follow up time (1st January 2008); the outcome variable was death. The exposure variable was condition group (NC; MD only; SUD only; CC). We right censored follow up time to the earliest of data collection end date or end of follow up. We plotted Kaplan–Meier survival curves, with significance of difference assessed by log rank tests. We performed Cox regression to derive hazard ratios (HR) comparing risk of all-cause death for individuals with CC in their history with those with SUD or MD only and those with NC, adjusted for sex, WIMD quintile and age band at start of follow-up. We tested the proportional hazards assumption by plotting Schoenfeld residuals. We then repeated the analysis with condition group as a time-dependent variable (as first event in each condition group could occur at any time), WIMD quintile as a two-level group (60% least deprived; 40% most deprived) and age at start of follow-up as a continuous instead of a categorical variable.41
We adopted an Alpha level of 0.05 for all statistical analyses.
Results
Study Populations
Figure 1 shows a flow diagram of the study cohorts. The WLGP incidence cohort consisted of 923,941 individuals contributing 4,391,444 PYAR and the PEDW incidence cohort consisted of 958,603 individuals contributing 4,545,876 PYAR. The mortality cohort consisted of 465,242 individuals, contributing 3,746,991 PYAR (mean = 8.1 years, SD = 3.1 years), of whom 1416 died during the 10-year follow-up period.
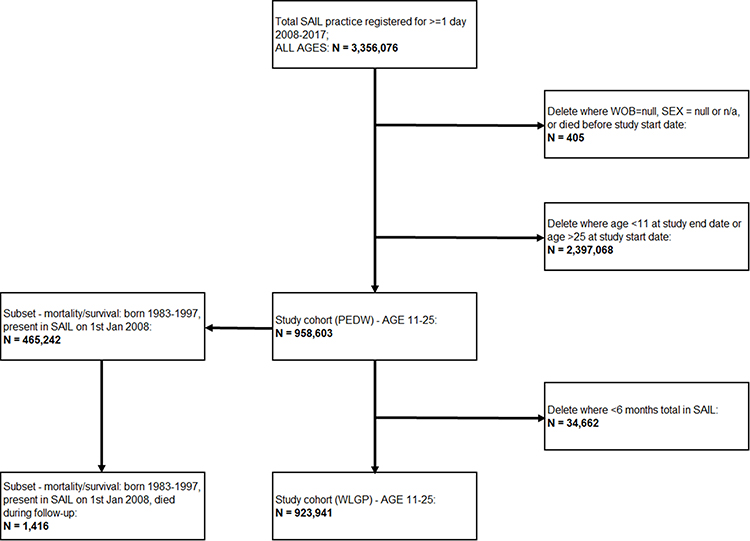 |
Figure 1 Flow diagram of study cohorts. |
Table 2 summarises the proportion of the incidence cohorts with codes for SUD only, MD only or CC at any time in their history up to 2017. In the WLGP cohort, 75.4% were NC, 21.8% were MD only, 0.8% were SUD only and 2.0% were CC. About 70.4% of individuals with SUD also had a code for MD and 8.4% of individuals with MD also had a code for SUD. In the PEDW cohort, 94.8% were NC, 2.9% were MD only, 0.5% were SUD only and 1.9% were CC. About 79.7% of individuals with SUD also had a code for MD and 38.8% of individuals with MD also had a code for SUD.
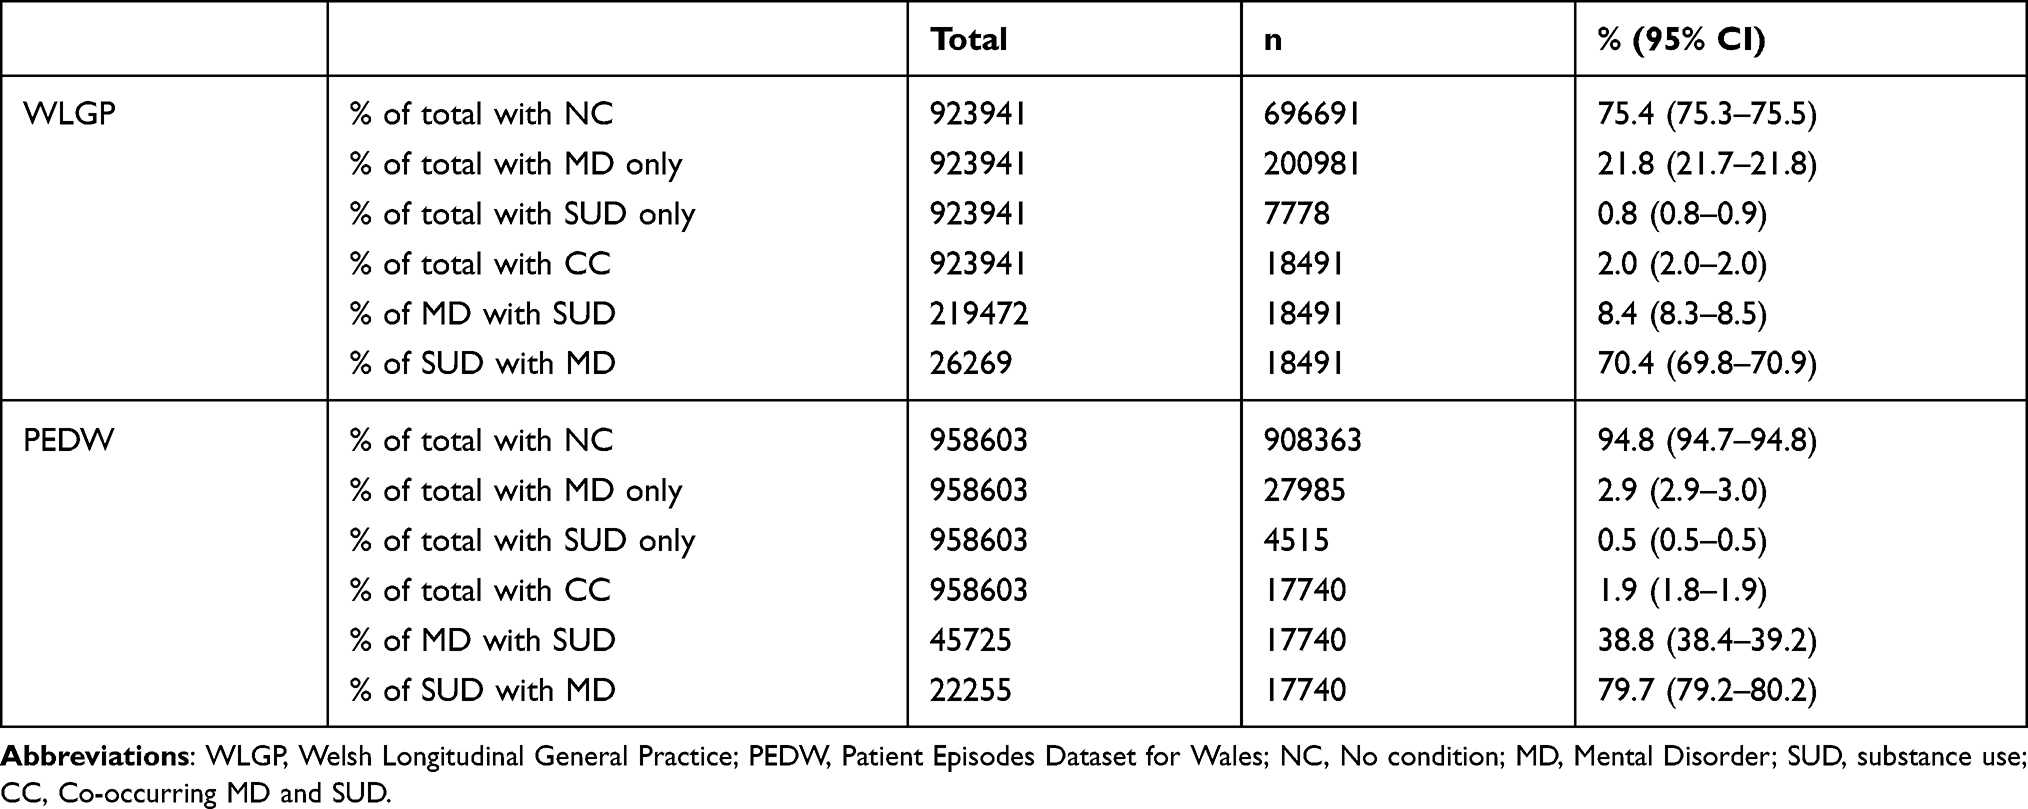 |
Table 2 WLGP and PEDW Cohorts by Condition Group |
Table 3 summarises the condition groups (based on events at any time up to 2017) of the 923,941 individuals present in both the WLGP and PEDW incidence cohorts, by sex and across both settings (primary care and hospital admission). Overall, a greater proportion of females than males had a record of MD in either setting (26.0%, 95% CI 25.9–26.2 compared with 17.0%, 95% CI 16.9–17.1), whereas more males than females had a record for SUD or CC (1.0%, 95% CI 1.0–1.1 compared with 0.6%, 95% CI 0.6–0.6 for SUD and 3.9%, 95% CI 3.9–4.0 compared with 3.1%, 95% CI 3.0–3.1 for CC). A higher proportion of males than females had no record of a condition in either setting (78.0%, 95% CI 77.9–78.1 compared with 70.3%, 95% CI 70.2–70.4).
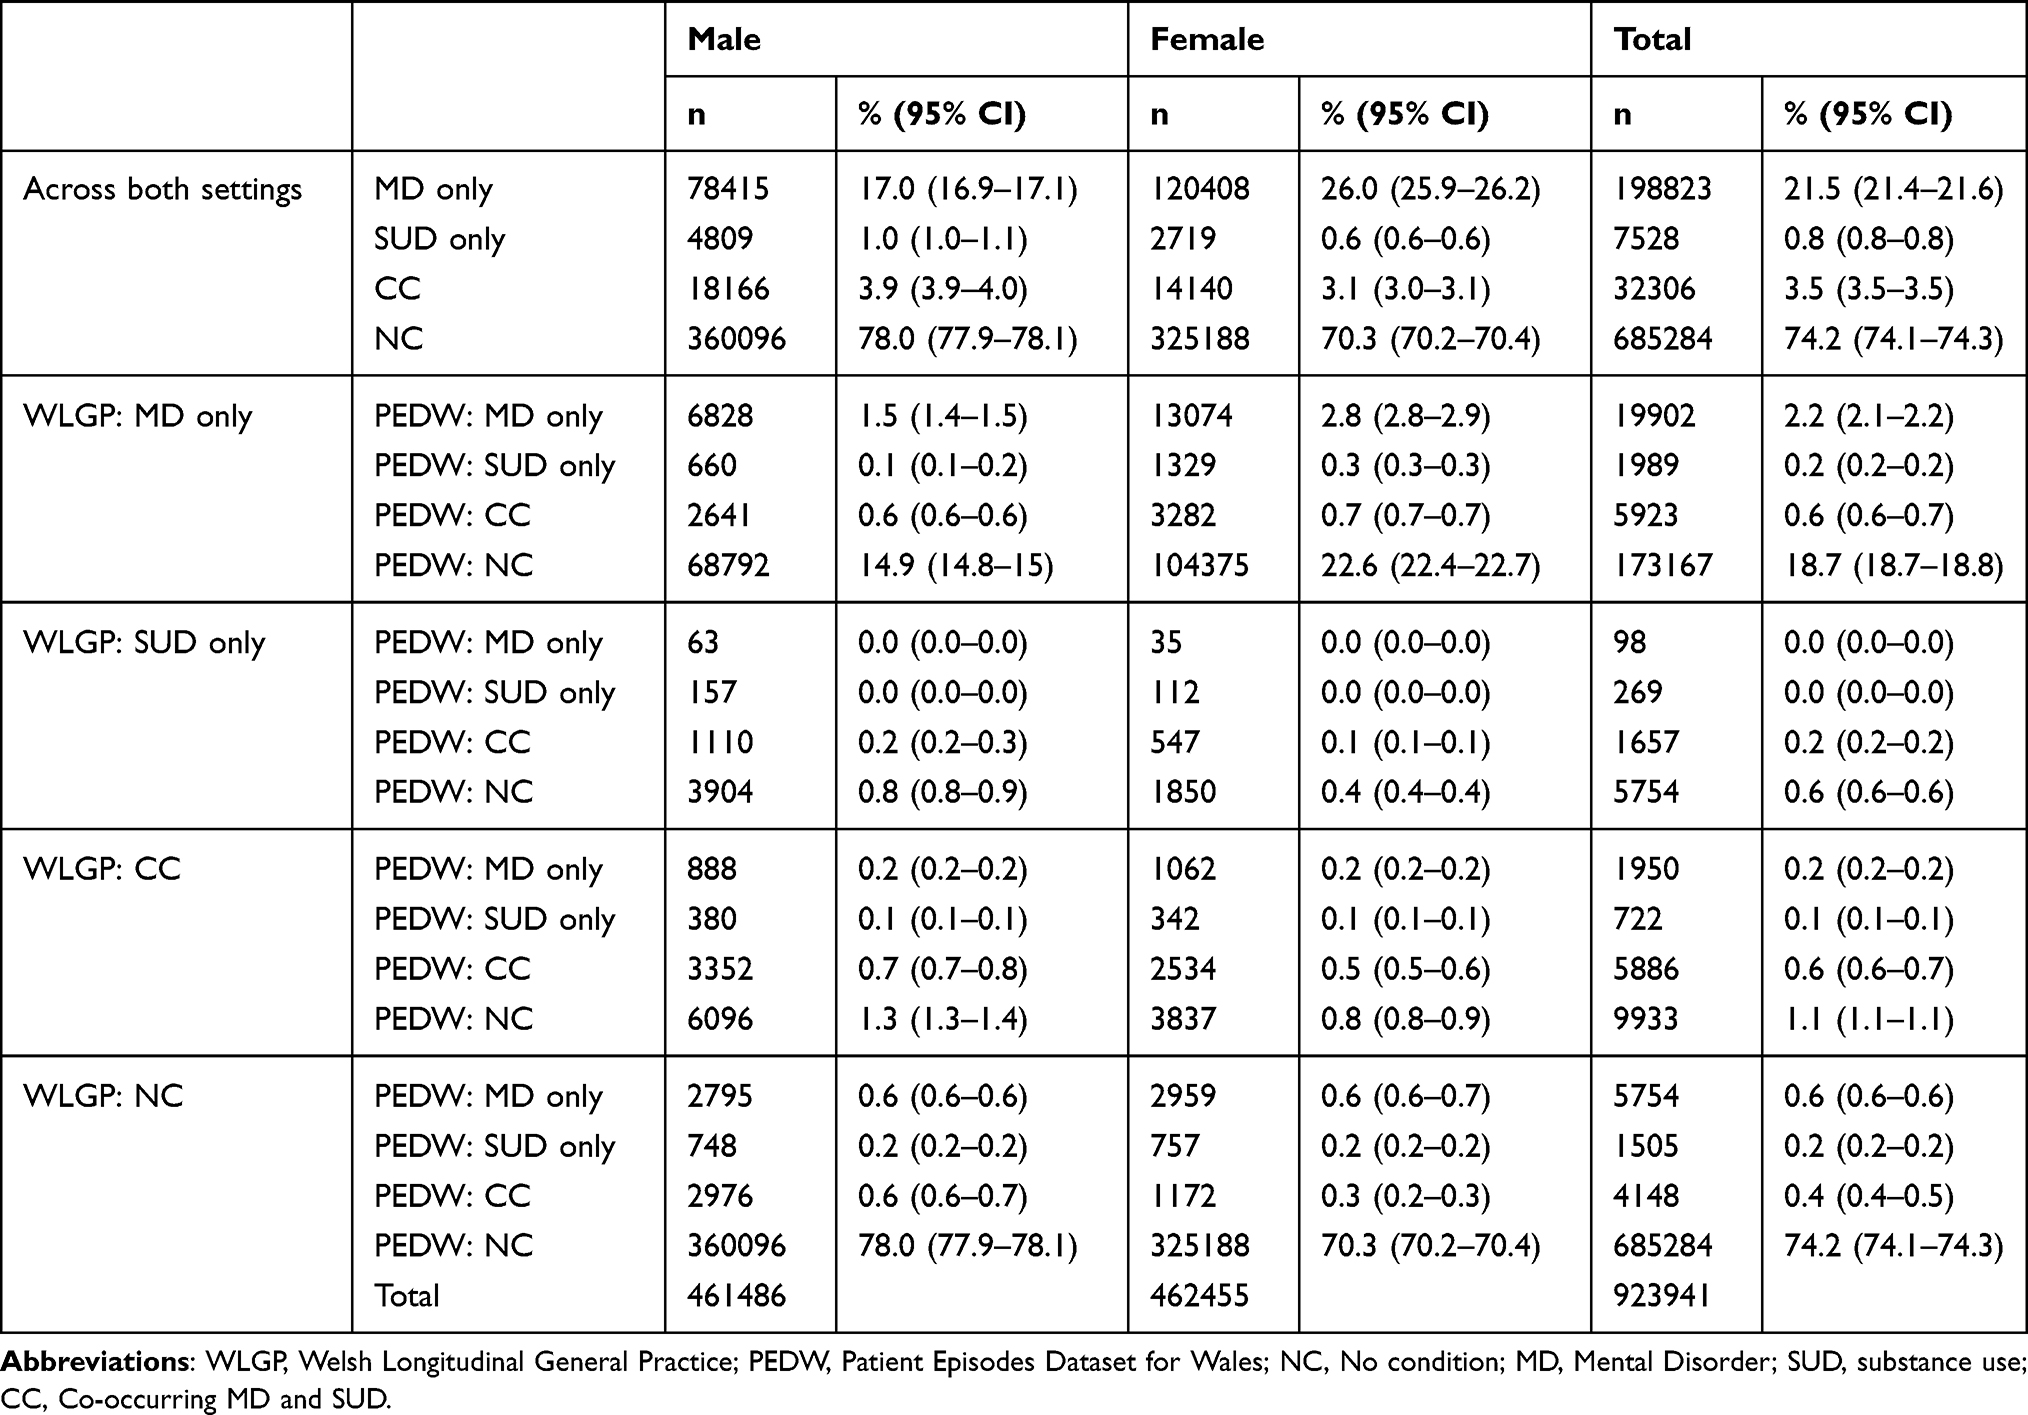 |
Table 3 Comparison of WLGP and PEDW by Condition Group |
A greater proportion of females than males had only a primary care record with an MD (22.6%, 95% CI 22.4–22.7 compared with 14.9%, 95% CI 14.9–15.0). In the WLGP SUD only and CC groups, the proportion of males with no PEDW record was greater than that for females; 0.8% (95% CI 0.8–0.9) compared with 0.4% (95% CI 0.4–0.4) for SUD only and 1.3% (95% CI 1.3–1.4) compared with 0.8% (95% CI 0.8–0.9) for the CC group. Across both sexes, 86.2% of the WLGP MD only group (173,167 out of 200,891), 74.0% of the WLGP SUD only group (5754 out of 7778) and 53.7% of the WLGP CC group (9933 out of 18,491) had not had a relevant PEDW admission. Of the 696,691 individuals in the WLGP NC group, 5754 (0.8%) were MD only in PEDW, 1505 (0.2%) were SUD only in PEDW and 4148 (0.6%) were CC in PEDW.
Of the 1416 individuals in the mortality cohort who died during follow-up, 1020 (72.0%) were male and 396 (28.0%) were female. Six hundred and seven (42.9%) were NC, 417 (29.4%) were MD only, 60 (4.2%) were SUD only and 332 (23.4%) were CC (0.2% of the NC group, 0.3% of MD only, 0.9% of SUD only and 1.2% of CC). Of the 165,835 individuals with MD and/or SUD, 809 (0.5%) died during follow-up.
Incidence
Figures 2 and 3 summarise trends in CC incidence rate per 1000 PYAR between 2008 and 2017 by sex, age and WIMD quintile, presented separately for WLGP and PEDW. Table 4 summarises the incidence of CC by sex, age, WIMD and year, including IRRs adjusted for sex, age and WIMD quintile, derived from Negative Binomial regression.
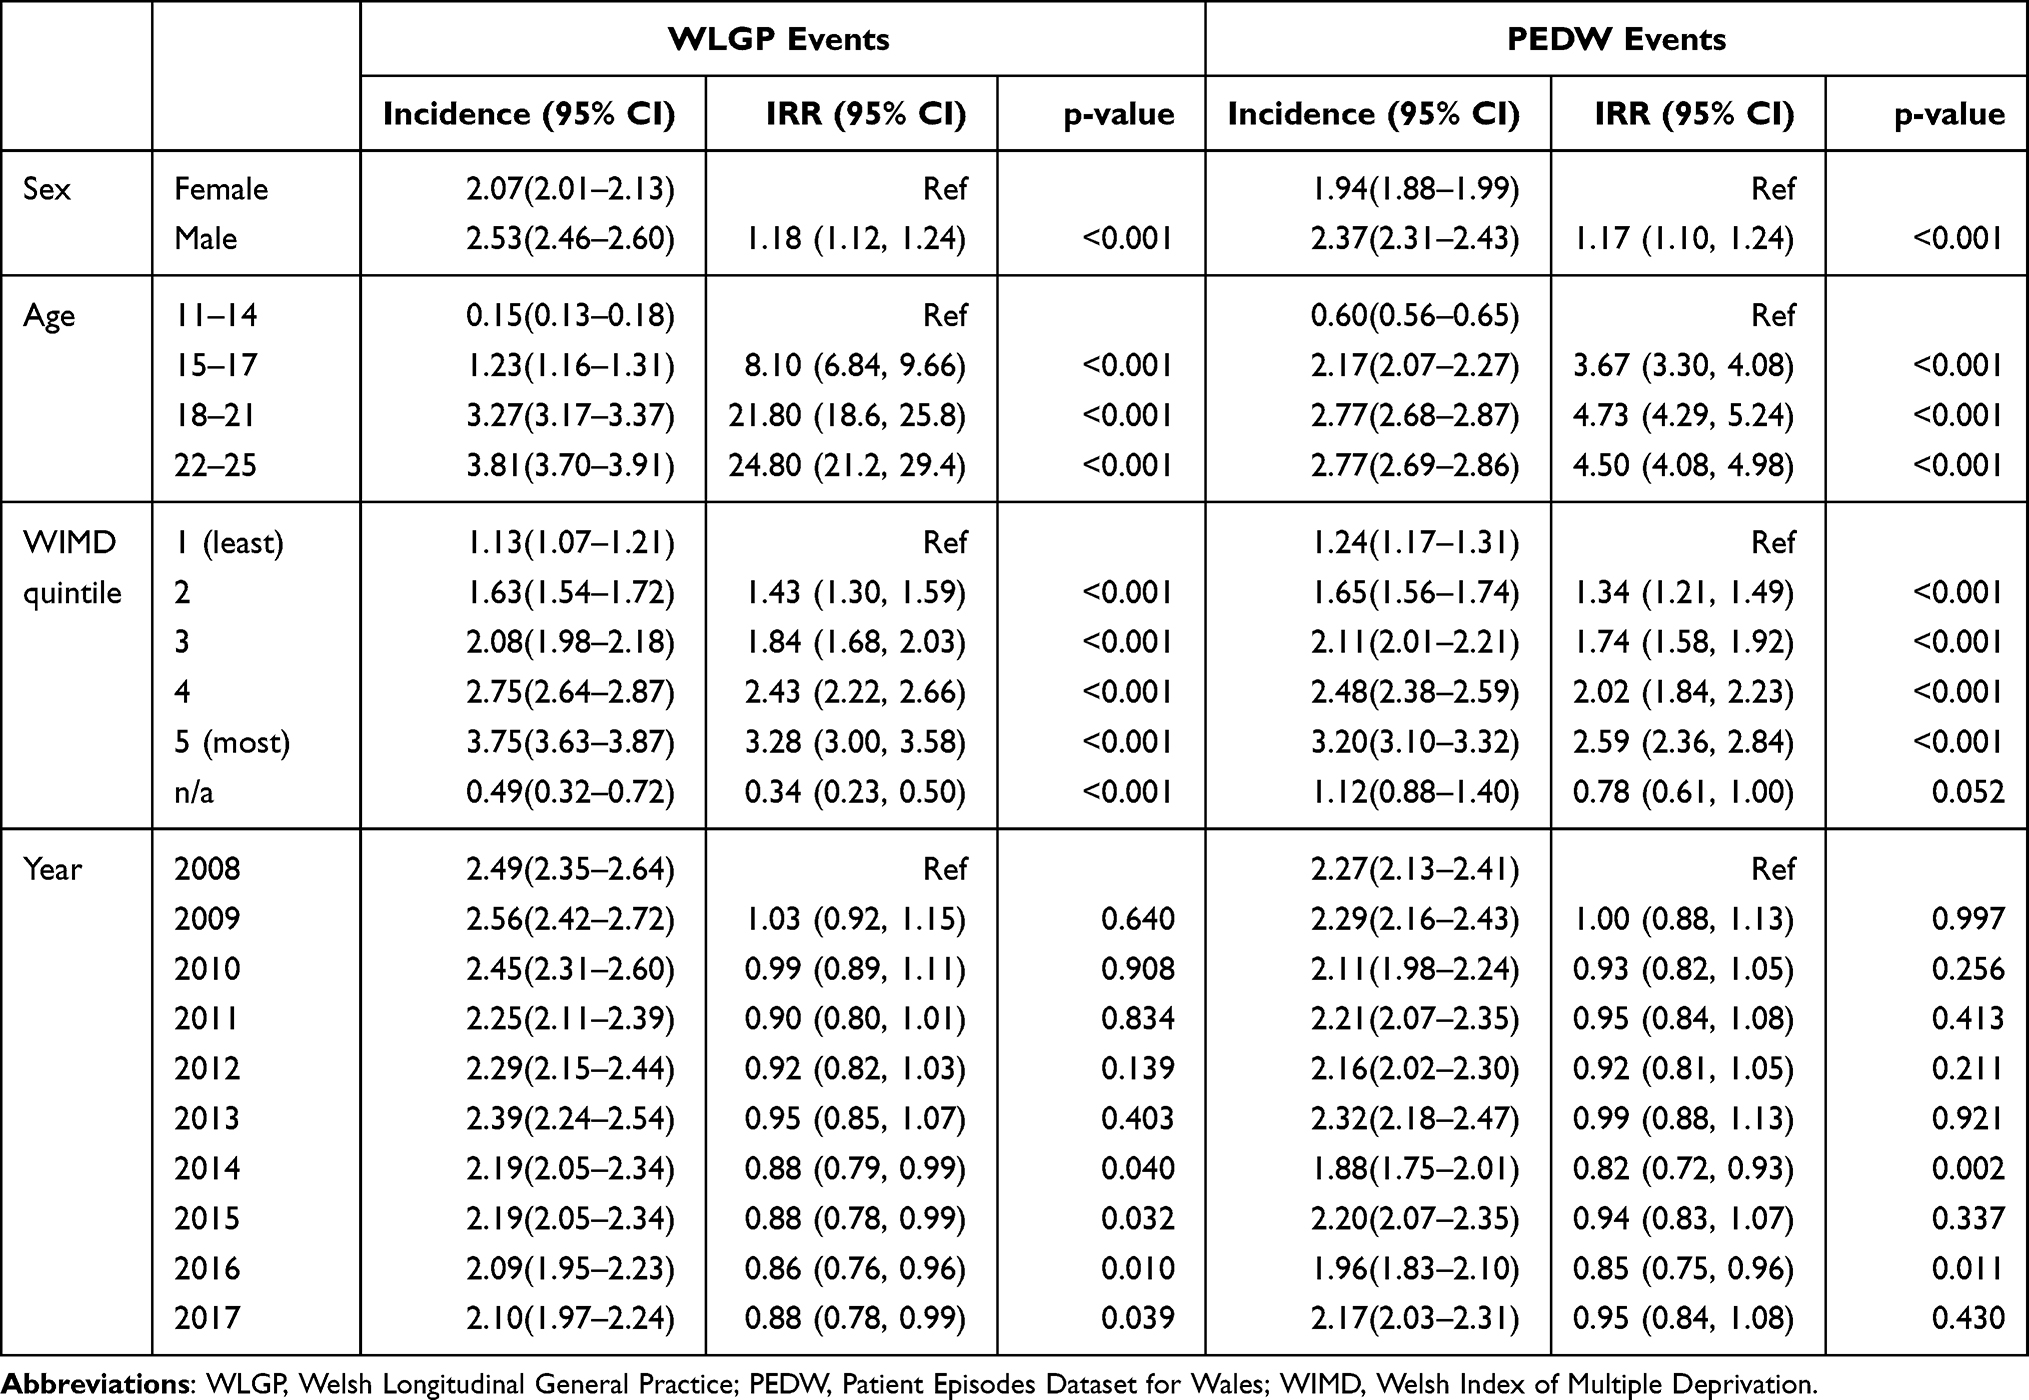 |
Table 4 Incidence of CC and IRR by Sex, Age Band, WIMD and Year |
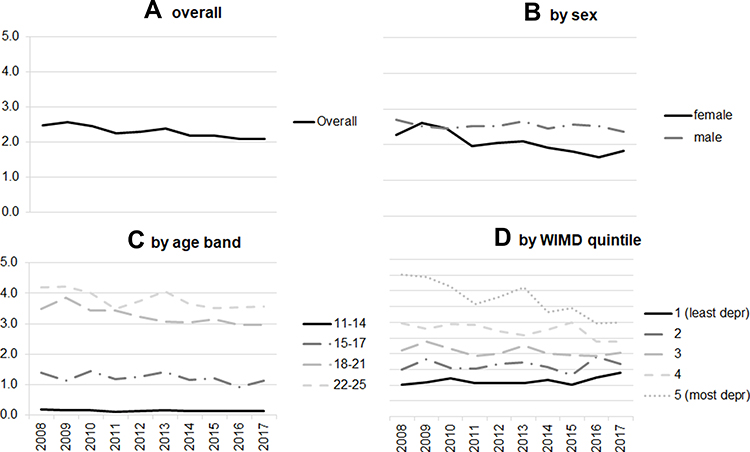 |
Figure 2 Incidence of CC by year (WLGP). |
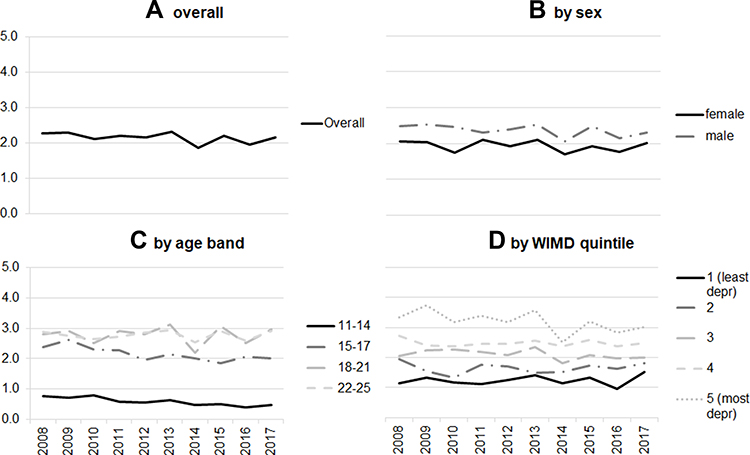 |
Figure 3 Incidence of CC by year (PEDW). |
Overall incidence in WLGP significantly reduced over the period (2.49, 95% CI 2.35–2.64 in 2008 and 2.10, 95% CI 1.97–2.24 in 2017, IRR = 0.88, 95% CI 0.78–0.99). Incidence in PEDW was stable (2.27, 95% CI 2.13–2.41 in 2008 and 2.17, 95% CI 2.03–2.31 in 2017, IRR = 0.95, 95% CI 0.84–1.08).
Incidence for males (WLGP = 2.53, 95% CI 2.46–2.60; PEDW = 2.37, 95% CI 2.31–2.43) was significantly higher than for females (WLGP = 2.07, 95% CI 2.01–2.13; PEDW = 1.94, 95% CI 1.88–1.99), IRR = 1.18 (95% CI 1.12–1.24) for WLGP and IRR = 1.17 (95% CI 1.10–1.24) for PEDW. Incidence among females in WLGP (but not PEDW) declined whereas for males it remained stable; incidence from WLGP for females in 2008 was 2.27 (95% CI 2.08–2.48) and in 2017 was 1.82 (95% CI 1.64–2.01, IRR = 0.82, 95% CI 0.71–0.94).
Higher incidence was significantly related to increasing age: incidence in WLGP increased from 0.15 (95% CI 0.13–0.18) for 11–14 year olds to 3.81 (95% CI 3.70–3.91) for 22–25 year olds (IRR = 24.80, 95% CI 21.20–29.40); and in PEDW from 0.60 (95% CI 0.56–0.65) for 11–14 year olds to 2.77 (95% CI 2.69–2.86) for 22–25 year olds (IRR = 4.50, 95% CI 4.08–4.98). The association between higher incidence and increasing age was stronger for primary care than for hospital admissions, with rates in WLGP lower than in PEDW in the youngest age band but higher in the oldest; this was evident in greater IRRs in WLGP between age bands.
Higher incidence was associated with greater deprivation; the lowest incidence rates were among the least deprived quintile (WLGP = 1.13, 95% CI 1.07–1.21; PEDW = 1.24, 95% CI 1.17–1.31;) with the highest among the most deprived quintile (WLGP = 3.75, 95% CI 3.63–3.87; PEDW = 3.20, 95% CI 3.10–3.32), IRR (WLGP) = 3.28 (95% CI 3.00–3.58) and IRR (PEDW) = 2.59, 95% CI 2.36–2.84, with rates declining in the intermediate quintiles as deprivation reduced. Between 2008 and 2017, the gap between most and least deprived quintiles reduced considerably in WLGP, with a significant reduction in the most deprived quintile and a significant increase in the least deprived quintile. In 2008, incidence was 4.52 (95% CI 4.12–4.94) in the most deprived quintile and 1.02 (95% CI 0.82–1.24) in the least deprived quintile; by 2017 incidence was 3.00 (95% CI 2.67–3.37) in the most deprived quintile and 1.39 (95% CI 1.14–1.66) in the least deprived quintile (IRR for change in most deprived quintile; 0.67, 95% CI 0.54–0.82; IRR for change in least deprived quintile; 1.38, 95% CI 1.01–1.89). This was not observed in PEDW. An interaction between WIMD quintile and year was significant for the most deprived quintile in 2014, (IRR = 0.64, 95% CI 0.44–0.93), 2016 (IRR = 0.52, 95% CI 0.36–0.76) and 2017 (IRR = 0.48, 95% CI 0.34–0.70), and for the second-most deprived quintile in 2016 (IRR = 0.63, 95% CI 0.43–0.93) and 2017 (IRR = 0.57, 95% CI 0.39–0.84), but not significant for any other year and quintile combination. Results for regression including interaction terms are shown in Additional File A2.
Mortality
Figure 4 summarises observed unadjusted mortality rates for each condition group per 1000 PYAR, by sex, age at start of follow-up and WIMD quintile. The highest rate was for individuals with CC (1.38, 95% CI 1.24–1.54), followed by those with SUD only (1.11, 95% CI 0.85–1.43); these rates were not significantly different but both were significantly higher than rates for MD only (0.36, 95% CI 0.33–0.40) and for NC (0.26, 95% CI 0.24–0.29); unadjusted rate ratios (RR) and 95% CIs were CC to MD; 3.84 (3.82–3.85), CC to NC; 5.21 (5.19–5.25), SUD to MD; 3.10 (3.07–3.12), SUD to NC; 4.21 (4.17–4.24). Rates were significantly higher for males than females for all condition groups except SUD only, and were significantly higher for those aged 18–25 at start of follow-up than those aged 11–17, for all condition groups except SUD only. Rates for the most deprived WIMD quintile were higher than any of the other quintiles, but other than in the NC group (most deprived = 0.33, 95% CI 0.28–0.39, least deprived = 0.20, 95% CI 0.16–0.24, RR 1.66, 95% CI 1.65–1.68) there were no significant differences by deprivation other than between the most deprived quintile (1.62, 95% CI 1.36–1.91) and the second least deprived quintile (0.93, 95% CI 0.62–1.35) in the CC group (RR 1.73, 95% CI 1.71–1.76).
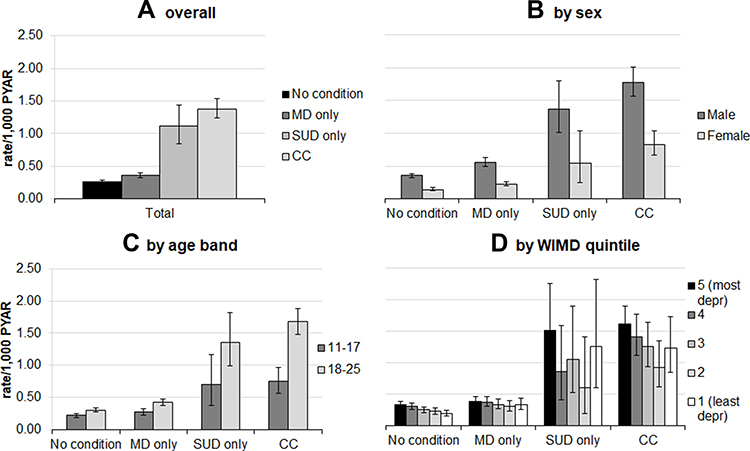 |
Figure 4 Observed unadjusted mortality rate/1000 PYAR for deaths (all cause) – overall, by sex, age at start of follow-up and WIMD quintile. |
Of 392 deaths among the SUD only and CC groups, we identified six who died in hospital with no records for SUD until their final admission. Reclassifying these as NC in the analysis made no significant difference. We included MD and SUD events occurring at any age from birth to end of follow-up; average age at first recorded event in either data source was 19.6 years of age (SD 5.9) for MD and 20.0 years of age (SD 4.7) for SUD.
Survival
Figures 5–11 show plots of Kaplan–Meier survival curves with p-values derived from Log Rank tests, by condition group, sex, age band at start of follow-up and WIMD quintile. Due to risk of statistical disclosure arising from small counts, the curves for SUD only were excluded from Figures 6–11. To further prevent statistical disclosure, age at start of follow-up and WIMD quintile were collapsed to two levels (11–17 and 18–25; least deprived 60or quintiles 1–3 and most deprived 40%, or quintiles 4 and 5).
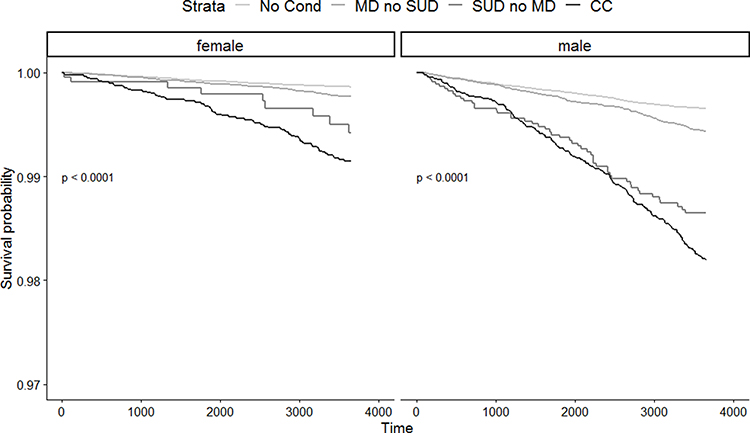 |
Figure 5 Kaplan Meier survival curve - by sex, stratified by condition group. |
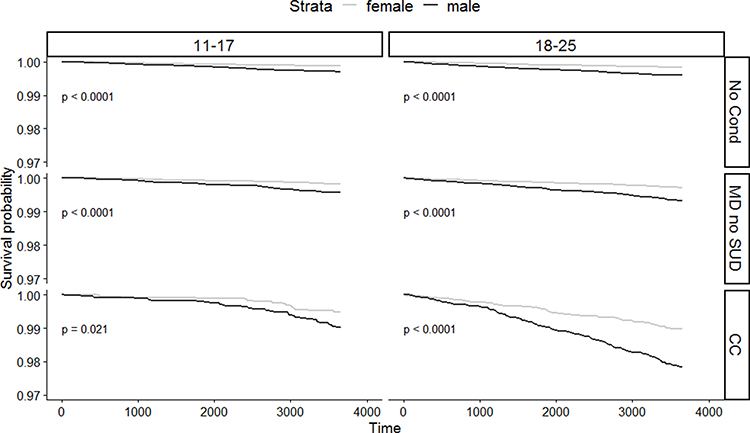 |
Figure 6 Kaplan Meier survival curve - by age at start of follow-up and condition group, stratified by sex. |
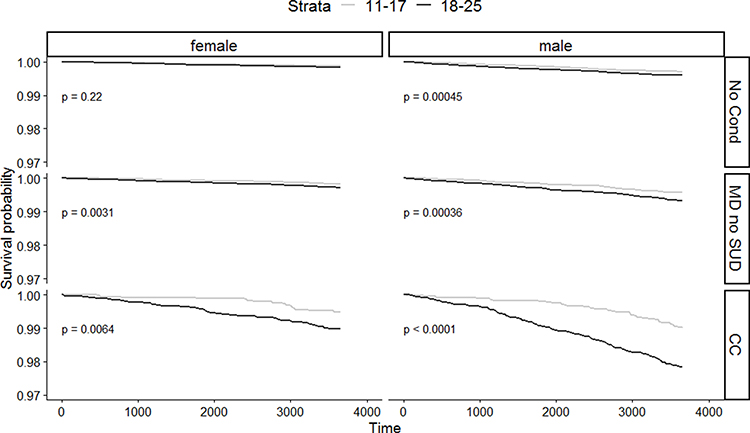 |
Figure 7 Kaplan Meier survival curve - by sex and condition group, stratified by age at start of follow-up. |
 |
Figure 8 Kaplan Meier survival curve - by sex and age at start of follow-up, stratified by condition group. |
 |
Figure 9 Kaplan Meier survival curve - by WIMD group and condition group, stratified by sex. |
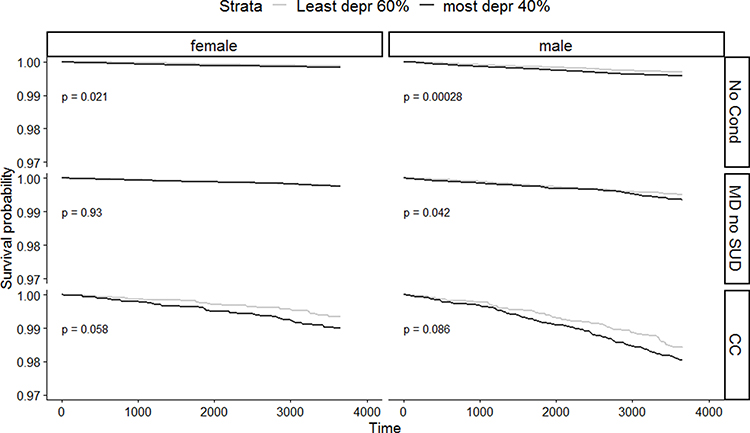 |
Figure 10 Kaplan Meier survival curve - by sex and condition group, stratified by WIMD group. |
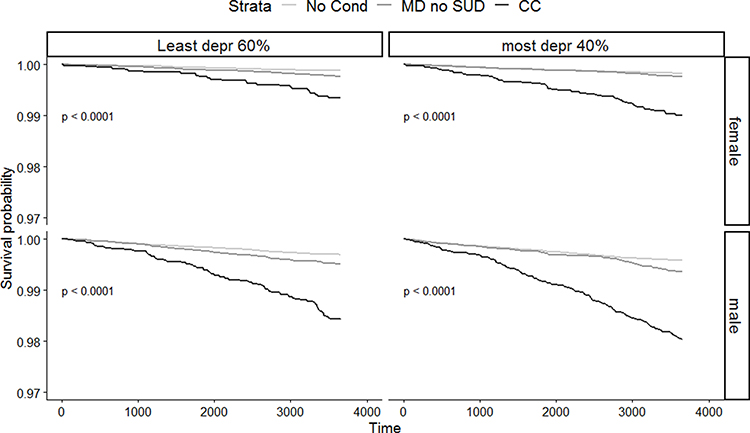 |
Figure 11 Kaplan Meier survival curve - by WIMD group and sex, stratified by condition group. |
Survival was significantly different for individuals with CC, NC or MD only, for both males and females (p<0.0001, Figure 5). Figures 6–11 show that survival for males was significantly lower than for females in all condition groups and in both age bands at p<0.0001, and for 11–17 year olds with CC at p<0.05. The group who were 18–25 at start of follow-up had significantly lower survival for all conditions (all significant at p<0.01) except females with NC where there was no significant difference by age. Results by WIMD group were mixed; survival for both males and females with NC was significantly lower for the more deprived group (females = p<0.05; males = p<0.001). Differences in survival between the least and most deprived females with MD only and CC, and between the least and most deprived males with CC were not significant; differences between the least and most deprived males with MD only were significant at p<0.05.
Figure 12 summarises the results of a Cox regression with death from all cause as the outcome. Results showed that compared to the NC group, the risk of death during the study window was significantly higher for individuals with MD only (HR = 2.7, 95% CI 2.4–3.1), with SUD only (HR = 4.5, 95% CI 3.4–5.9) and with CC (HR = 8.7, 95% CI 7.5–10.0).
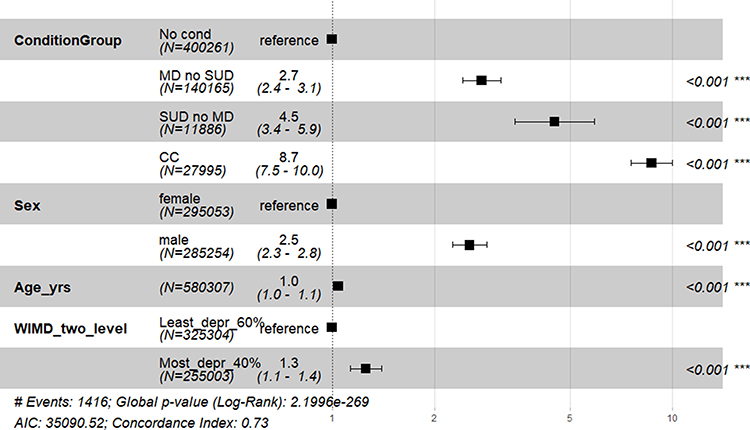 |
Figure 12 Forest plot showing hazard ratios derived from Cox regression - by condition group, sex, age band at start of follow-up and WIMD group. Abbreviations: COND_GROUP_SEQ_TD, Condition group (time-dependent variable); SEX_CHAR, sex, AGE_YRS - age at start of follow up; WIMD_TWO_LEVEL, WIMD quintile group (least deprived 60%, or quintiles 1–3 and most deprived 40%, or quintiles 4 and 5); MD, Mental Disorder; SUD, substance use; CC, Co-occurring MD and SUD. Note: ***Significant at p<0.001. |
Discussion
Main Findings in the Context of Previous Studies
In keeping with previous studies we found a high degree of overlap between cases of MD and SUD,1–3 particularly for SUD in secondary care where almost 80% with SUD also had an MD, as shown in Table 2. The overlap for MD, particularly in primary care, was lower, with around 8% of those with MD also having a record of an SUD; this may reflect the large proportion of patients with MD who are managed in primary care without ever being admitted to hospital.
Incidence of CC in young people aged 11–25 between 2008 and 2017 was stable in secondary care and decreased in primary care, particularly for females and among 11–17 year olds. Similar trends have been identified in studies using routine data to separately estimate incidence or prevalence of MD9,11,12,34 and SUD.14,16 The gap in primary care incidence rates between the most and least deprived quintiles has narrowed, due to a reduction in the most deprived quintile and a smaller but significant increase in the least deprived quintile. An interaction between WIMD quintile and year (visible in Figure 2, panel D) was non-significant for most terms until 2014, but with some significant results for the most deprived quintiles in the most recent years, suggesting a significantly greater reduction in incidence among the most deprived. However, there remains a strong positive association between greater incidence and greater deprivation, as well as male sex and older age, as shown in Figure 2, Figure 3 and Table 4.
Observed unadjusted mortality was significantly higher among individuals with a diagnosis of CC, and to a lesser extent among those with a diagnosis of SUD or MD only, than among individuals with NC, as shown in Figure 4. Survival was significantly lower for individuals with CC, particularly for males and those in the older age band at start of follow-up, as shown in Figures 6–11. Compared to the NC group, the hazard ratio for death was 8.7 times greater in the CC group, 4.5 times greater in the SUD only group and 2.7 times greater in the MD only group, as shown in Figure 12. Alcohol and drug use have been shown to commonly precede suicide.42 Our findings are consistent with previous studies suggesting individuals with a history of alcohol use disorder are at significantly increased risk of death,29 even in the absence of a co-occurring MD.43 They may also suggest that there is undiagnosed or unrecorded MD among individuals with SUD-related service contacts. MD (particularly with comorbid SUD) is associated with all-cause mortality rates significantly higher than those for the general population: as well as the inherent risk of death directly attributable to substance use, there may be greater medical morbidity, which is not always well recognised by service providers.44 There is a well-established association between deprivation, male sex and increased risk of death.45 Higher mortality but lower contact with services among males may indicate greater unmet need in this group, although no association can be assumed without further analysis.
Strengths and Limitations
This was a large-scale population study using linked routine health data comprising the records of nearly one million participants in Wales, providing a sufficiently large number of outcomes (CC cases and deaths) to support our estimations. We used the ONS ADDE to ascertain date of death, which is a near-complete record and is considered the gold standard for death records.46 Although the SAIL Databank dataset holds records for 80% of GP practices in Wales, the data in SAIL is broadly representative of the Welsh population in terms of sex, age and deprivation. Routine data may vary in quality between sources, and this may affect dataset linkage; to mitigate this we used only those records where there was sufficient level of confidence in matching quality.24
Alcohol use disorders, particularly hazardous and harmful drinking (as opposed to dependent drinking) are under-recorded by GPs, particularly for men and younger people.47 This is also likely to be the case for illegal drug use.48,49 Rates of recording may vary over time or between GP practices, due to experience, training, practice protocols and government policies.50 The exclusion of codes relating to consumption levels may also mean that some individuals with problematic but non-dependent alcohol consumption are not detected. Estimated rates of SUD derived from routine primary care data should therefore be considered as a minimum. The analysis should be interpreted as examining coding behaviour as much as clinical indicators.36
The identification of cases within this study is limited by the availability of full patient history in the WLGP and PEDW datasets. We did not include individuals attending Emergency Departments; inclusion of this dataset would very likely increase the incidence of CC as it would include individuals not admitted to hospital and those who are reluctant to seek help from their GP. Incident cases are defined as the first recorded occurrence of a code, but we cannot be certain that these events genuinely represent the onset of a condition.51 The rates presented are therefore a measure of contacts with services.52
We estimated mortality and survival for death from all causes, and did not consider specific causes. SUD and MD are (both individually and in combination) associated with an increased risk of death from specific causes such as suicide, as well as deaths from natural causes.20,26,29,35,42–44 Future studies should examine the relationship between CC and specific causes of death, and in particular the relationship between CC and death by suicide.
We did not include personality disorders (PD) in our definition of MD, although PD commonly co-occurs with SUD;53 this is because SUD is considered a diagnostic criterion for borderline personality disorder.54 We grouped together use of alcohol and drugs, and did not consider the impact of specific substances, the severity of usage or the impact of using specific combinations of substances. We have included SUD codes indicating varying degrees of severity; for example we included as CC all episodes with codes for mental or behavioural disorders due to psychoactive substance use, which includes episodes of acute intoxication “resulting in disturbances in level of consciousness, cognition, perception, affect or behaviour”.30 We will be undertaking further studies to examine the role of (and interaction between) specific substances such as alcohol and cocaine. These studies will also consider the relationship between CC, mortality and specific types of mental disorder. As incidence of different types of mental disorder varies by age,10 we will consider the relationship between type of disorder, age at diagnosis and outcome.
Policy, Research and Practice Implications
Individuals who have had contact with primary care or inpatient services related to CC (as well as those with SUD or MD only) in their patient history are at significantly increased risk of death; these contacts may offer an opportunity to identify particularly vulnerable individuals in need of specialist intervention.
CC incidence rates for younger age bands were lower in primary care than in hospital admissions, which was unexpected, given that GP practices should receive and record notification of any inpatient admissions and that primary care may be the first place individuals turn to for help with SUD.50 This finding supports existing evidence of under-recording of SUD in primary care (but in this instance may relate to the recording of SUD, MD or both). There are well documented sensitivities about discussing and recording SUD in primary care50 which may be amplified for younger patients. Survival and mortality rates were significantly poorer for individuals with CC, but were also significantly worse for individuals with SUD only, suggesting that SUD (with or without co-occurring MD) is a key risk factor, particularly for males. Alternatively this may be due to undiagnosed MD among substance users. Mental health and substance misuse service providers should work in partnership to ensure that substance use does not create barriers preventing access to mental health support.55 Health, education and social care services in contact with young people should ensure they are discussing substance use and offering advice, support and onward referral to specialist services where required.56 Accessible and acceptable services need to be available to those who are at greater risk, or who are less likely to engage, such as young men and those living in the most deprived areas, and use co-produced approaches that are designed to meet their needs.57 However a “glass ceiling” effect may limit the value of studies identifying risk factors for low prevalence events, and it has been recommended that prediction rules should not be used in isolation.58 A contextual safeguarding approach59 may help to identify specific locations where at-risk young people are likely to be, allowing early intervention and prevention to be delivered by youth service hubs and detached youth workers, providing an opportunity to reach young people who would otherwise not engage with services. Further studies should also consider whether the reduction in incidence in the most deprived WIMD quintile is due to genuine decreases in MD and SUD, or is a consequence of increasing difficulty with accessing services.
This study did not consider subcategories of death; we included deaths from all causes, as previous studies have indicated that MD and SUD increases the risk of natural as well as unnatural deaths. However it is likely that risks of natural and unnatural death (particularly suicide) are not equal, and are affected by the presence or absence of CC. This may also be the case for risk of non-lethal self-harm among individuals with CC, which was not considered in this study. Risk may vary according to the type and combination of substance used, particularly whether both alcohol and drugs are used. Future studies should examine the relationship between CC and different causes of death, including suicide, and should also consider the impact of and relationship between specific substances, such as cocaine and alcohol (where coding is sufficiently granular).
Conclusion
CC is associated with significantly greater mortality in children and young people. Incidence of CC in children and young people in Wales between 2008 and 2017 decreased in primary care and remained stable in secondary care, with significantly higher incidence associated with male sex, increasing age and greater deprivation. In primary care, the gap in incidence between the most and least deprived quintiles has reduced; rates remain highest in areas with greatest deprivation, but as well as a significant decrease in the most deprived quintile, rates significantly increased in the least deprived quintile. Mortality was significantly higher among individuals with a diagnosis of CC, and to a lesser extent among those with a diagnosis of SUD or MD only, compared with individuals with NC. The higher mortality rate for individuals with SUD (with or without mental disorder) may indicate substance use as a key risk factor, or alternatively may be indicative of undiagnosed or unrecorded mental disorder in substance using individuals. All services coming into contact with children and young people, including primary care, education, youth services and CAMHS, should be adequately resourced to provide advice, support or referral to appropriate services where there are concerns about mental health or substance use.
Abbreviations
ADDE, Annual District Deaths Extract; ADHD, Attention Deficit Hyperactivity Disorder; ADP, Adolescent Mental Health Data Platform; ASD, Autistic Spectrum Disorder; CAMHS, Child and Adolescent Mental Health Services; CC, co-occurring conditions; CMHT, Community Mental Health Team; ICD-10, International Classification of Diseases, Tenth Revision; IRR, Incidence rate ratio; LSOA, Local Super-Output Area; MD, mental disorder; NC, Neither condition (no MD or SUD); NICE, National Institute for Health and Care Excellence; PEDW, Patient Episode Dataset for Wales; PYAR, person years at risk; SAIL Databank, Secure Anonymised Information Linkage Databank; SMI, severe mental illness (schizophrenia, schizotypal and delusional disorders, bipolar disorder, other mood-related disorders and other severe mental illness); SUD, substance use; WDSD, Welsh Demographic Service Dataset; WIMD, Welsh Index of Multiple Deprivation; WLGP, Welsh Longitudinal GP Dataset.
Data Sharing Statement
This study utilises data hosted by the SAIL Databank, Swansea University Medical School. These data are not publicly available, but can be accessed for research purposes subject to approval by the SAIL Databank Information Governance Review Panel (IGRP). Further information about the SAIL Databank application process is available at https://saildatabank.com/application-process/.
Ethical Approval and Consent to Participate
The study was approved by the SAIL Databank Information Governance Review Panel (IGRP), an independent body comprising representatives from a range of organisations including the British Medical Association (BMA) Cymru, Welsh Government, Public Health Wales, National Research Ethics Service, Digital Health and Care Wales (DHCW), Swansea Bay University Local Health Board and members of the public. As the study utilised only anonymised data, informed consent was not required. The study was approved under IGRP number 0667.
Acknowledgments
ADP and the author(s) would like to acknowledge the data providers who supplied the datasets enabling this research study. The views expressed are entirely those of the authors and should not be assumed to be the same as those of ADP or MQ Mental Health Research Charity. This study makes use of anonymised data held in the Secure Anonymised Information Linkage (SAIL) Databank (project number 0667). We would like to acknowledge all the data providers who make anonymised data available for research. This work uses data provided by patients and collected by the NHS as part of their care and support.
Author Contributions
Study conception: AJ, JK and SR. Study design: SR, AJ, AW and JK. Clinical guidance including creation of code lists: AJ and JK. Data preparation: SR. Statistical analysis: SR, AJ and AW. Original draft written by SR and AJ. Draft and final manuscript edited and reviewed by all authors. All authors contributed to data analysis, drafting or revising the article, gave final approval of the version to be published, agreed to the submitted journal, and agree to be accountable for all aspects of the work.
Funding
This work was funded by the Adolescent Mental Health Data Platform (ADP). The ADP is funded by MQ Mental Health Research Charity (Grant Reference MQBF/3 ADP). This project was funded by MRC Pathfinder (MC_PC_17211).
Disclosure
Mrs Sarah Rees report grants from MQ Mental Health Research charity, grants from MRC, during the conduct of the study; Professor Ann John report grants from MQ, during the conduct of the study; grants from Welsh Government, grants from MRC, outside the submitted work. The authors declare that they have no other competing interests in this work.
References
1. Whiteford HA, Degenhardt L, Rehm J, et al. Global burden of disease attributable to mental and substance use disorders: findings from the Global Burden of Disease Study 2010. Lancet. 2013;382(9904):1575–1586. doi:10.1016/S0140-6736(13)61611-6
2. Lai HMX, Cleary M, Sitharthan T, Hunt GE. Prevalence of comorbid substance use, anxiety and mood disorders in epidemiological surveys, 1990–2014: a systematic review and meta-analysis. Drug Alcohol Depend. 2015;154:1–13. doi:10.1016/j.drugalcdep.2015.05.031
3. Weaver T, Madden P, Charles V, et al. Comorbidity of substance misuse and mental illness in community mental health and substance misuse services. Br J Psychiatry. 2003;183:
4. Chang C, Hayes R, Broadbent M, et al. All-cause mortality among people with serious mental illness (SMI), substance use disorders, and depressive disorders in southeast London: a cohort study. BMC Psychiatry. 2010;10. doi:10.1186/1471-244X-10-77
5. Frisher M, Collins J, Millson D, Crome I, Croft P. Prevalence of comorbid psychiatric illness and substance misuse in primary care in England and Wales. J Epidemiol Commun Health. 2004;58(12):1036–1041. doi:10.1136/jech.2003.017384
6. Jones PB. Adult mental health disorders and their age at onset. Br J Psychiatry. 2013;202(s54):s5–s10. doi:10.1192/BJP.BP.112.119164
7. Hickie IB, Scott EM, Cross SP, et al. Right care, first time: a highly personalised and measurement-based care model to manage youth mental health. Med J Austr. 2019;4(9):2–211. DOI:10.5694/mja2.50383
8. National Assembly for Wales. Mind over matter A report on the step change needed in emotional and mental health support for children and young people in Wales; 2018. Available from: www.assembly.wales/SeneddCYPE.
9. John A, Marchant AL, McGregor J, et al. Recent trends in the incidence of anxiety and prescription of anxiolytics and hypnotics in children and young people: an e-cohort study. J Affect Disord. 2015;183:134–141. doi:10.1016/j.jad.2015.05.002
10. NHS. Mental health of children and young people in England, 2017: trends and characteristics; 2018. Available from: https://digital.nhs.uk/data-and-information/publications/statistical/mental-health-of-children-and-young-people-in-england/2017/2017.
11. Wijlaars LP, Nazareth I, Petersen I. Trends in depression and antidepressant prescribing in children and adolescents: a cohort study in The Health Improvement Network (THIN). PLoS One. 2012;7(3):e33181. doi:10.1371/journal.pone.0033181
12. John A, Marchant AL, Fone DL, et al. Recent trends in primary-care antidepressant prescribing to children and young people: an e-cohort study. Psychol Med. 2016;46(16):3315–3327. doi:10.1017/S0033291716002099
13. Oldham M, Holmes J, Whitaker V, Fairbrother H, Curtis P. Youth drinking in decline. Sheffield: University of Sheffield; 2018. https://www.sheffield.ac.uk/polopoly_fs/1.806889!/file/Oldham_Holmes_Youth_drinking_in_decline_FINAL.pdf. Accessed September 28, 2021.
14. Thompson A, Wright AK, Ashcroft DM, van Staa TP, Pirmohamed M. Epidemiology of alcohol dependence in UK primary care: results from a large observational study using the Clinical Practice Research Datalink. PLoS One. 2017;12(3):e0174818. doi:10.1371/journal.pone.0174818
15. Ng Fat L, Shelton N, Cable N. Investigating the growing trend of non-drinking among young people; analysis of repeated cross-sectional surveys in England 2005–2015. BMC Public Health. 2018;18:1. doi:10.1186/s12889-018-5995-3
16. Trefan L, Gartner A, Alcock A, et al. Epidemiology of alcohol-related emergency hospital admissions in children and adolescents: an e-cohort analysis in Wales in 2006–2011. PLoS One. 2019;14(6):e0217598. doi:10.1371/journal.pone.0217598
17. NHS Digital. Smoking, drinking and drug use among young people in England 2018; 2019. Available from: https://digital.nhs.uk/data-and-information/publications/statistical/smoking-drinking-and-drug-use-among-young-people-in-england/2018.
18. Home Office. Drug misuse: findings from the 2018 to 2019 CSEW. Available from: https://www.gov.uk/government/organisations/home-office/series/drug-misuse-declared.
19. Tyrrell EG, Kendrick D, Sayal K, Orton E. Poisoning substances taken by young people: a population-based cohort study. Br J Gen Pract. 2018;68(675):e703–e710. doi:10.3399/bjgp18X698897
20. Herbert A, Gilbert R, González-Izquierdo A, Pitman A, Li L. 10-y risks of death and emergency re-admission in adolescents hospitalised with violent, drug- or alcohol-related, or self-inflicted injury: a population-based cohort study. PLOS Med. 2015;12(12):e1001931. doi:10.1371/journal.pmed.1001931
21. Mars B, Heron J, Klonsky ED, et al. Predictors of future suicide attempt among adolescents with suicidal thoughts or non-suicidal self-harm: a population-based birth cohort study. Lancet Psychiatr. 2019;6(4):327–337. doi:10.1016/S2215-0366(19)30030-6
22. NICE. Coexisting severe mental illness and substance misuse: community health and social care services. NICE; 2016. Available from: https://www.nice.org.uk/guidance/ng58.
23. Ford DV, Jones KH, Verplancke JP, et al. The SAIL databank: building a national architecture for e-health research and evaluation. BMC Health Serv Res. 2009;9. doi:10.1186/1472-6963-9-157
24. Lyons RA, Jones KH, John G, et al. The SAIL databank: linking multiple health and social care datasets. BMC Med Inform Decis Mak. 2009;9:1. doi:10.1186/1472-6947-9-3
25. The platform - adolescent mental health data platform. Available from: https://adolescentmentalhealth.uk/Platform.
26. DelPozo-Banos M, John A, Petkov N, et al. Using neural networks with routine health records to identify suicide risk: feasibility study. JMIR Ment Health. 2018;5(2):e10144. doi:10.2196/MENTAL.10144
27. Syed S, Gilbert R, Wolpert M. Parental alcohol misuse and the impact on children: a rapid evidence review of service presentations and interventions. London; 2018. Available from: https://www.ucl.ac.uk/children-policy-research/sites/children-policy-research/files/parental-alcohol-misuse-and-impact-on-children.pdf.
28. Frisher M. Substance misuse and psychiatric illness: prospective observational study using the general practice research database. J Epidemiol Commun Health. 2005;59(10):847–850. doi:10.1136/jech.2004.030833
29. Bowden B, John A, Trefan L, Morgan J, Farewell D, Fone D. Risk of suicide following an alcohol-related emergency hospital admission: an electronic cohort study of 2.8 million people. PLoS One. 2018;13(4):e0194772. doi:10.1371/journal.pone.0194772
30. World Health Organization. The international classification of diseases ICD-10. ICD 10 2016. 2016. Available from: http://apps.who.int/classifications/icd10/browse/2016/en.
31. Walsh E, Jones R, Cox S. Data mining Wales: the annual profile for substance misuse 2017–18. Available from: http://www.wales.nhs.uk/sitesplus/documents/888/FINALAnnualProfileforSubstanceMisuse2017-18.pdf.
32. NHS National Services Scotland. Alcohol-related hospital statistics Scotland 2017/18; 2019. Available from: https://www.isdscotland.org/Health-Topics/Drugs-and-Alcohol-Misuse/Publications/2018-11-20/2018-11-20-ARHS-Report.pdf.
33. NHS National Services Scotland. Drug-related hospital statistics Scotland 2017/18; 2019. Available from: https://www.isdscotland.org/Health-Topics/Drugs-and-Alcohol-Misuse/Publications/2019-05-28/2019-05-28-DRHS-Report.pdf.
34. John A, McGregor J, Fone D, et al. Case-finding for common mental disorders of anxiety and depression in primary care: an external validation of routinely collected data. BMC Med Inform Decis Mak. 2016;16(1):35. doi:10.1186/s12911-016-0274-7
35. John A, McGregor J, Jones I, et al. Premature mortality among people with severe mental illness — new evidence from linked primary care data. Schizophr Res. 2018;199:154–162. doi:10.1016/J.SCHRES.2018.04.009
36. Wood S, Marchant A, Allsopp M, et al. Epidemiology of eating disorders in primary care in children and young people: a clinical practice research datalink study in England. BMJ Open. 2019;9:8. doi:10.1136/bmjopen-2018-026691
37. NCEPOD - mental healthcare in young people and young adults; 2019. Available from: https://www.ncepod.org.uk/2019ypmh.html.
38. Brophy S, Kennedy J, Fernandez-Gutierrez F, et al. Characteristics of children prescribed antipsychotics: analysis of routinely collected data. J Child Adolesc Psychopharmacol. 2018;28(3):180–191. doi:10.1089/cap.2017.0003
39. Welsh Government: Knowledge and Analytical Services Directorate. Briefing note Welsh Index of Multiple Deprivation (WIMD) 2014. 2014.
40. Ver Hoef JM, Boveng PL. Quasi-poisson vs negative binomial regression: how should we model overdispersed count data? Ecology. 2007;88(11):2766–2772. doi:10.1890/07-0043.1
41. Zhang Z, Reinikainen J, Adeleke KA, Pieterse ME, Groothuis-Oudshoorn CGM. Time-varying covariates and coefficients in Cox regression models. Ann Transl Med. 2018;6(7):121. doi:10.21037/atm.2018.02.12
42. University of Manchester. National confidential inquiry into suicide and safety in mental health; 2019. Available from: https://www.hqip.org.uk/national-programmes.
43. Flensborg-Madsen T, Knop J, Mortensen EL, Becker U, Sher L, Grønbaek M. Alcohol use disorders increase the risk of completed suicide–irrespective of other psychiatric disorders. A longitudinal cohort study. Psychiatry Res. 2009;167(1–2):123–130. doi:10.1016/j.psychres.2008.01.008
44. Aagaard J, Buus N, Wernlund AG, Foldager L, Merinder L. Clinically useful predictors for premature mortality among psychiatric patients visiting a psychiatric emergency room. Int J Soc Psychiatry. 2016;62(5):462–470. doi:10.1177/0020764016642490
45. Public Health England. A review of recent trends in mortality in England. London; 2018. Available from: https://assets.publishing.service.gov.uk/government/uploads/system/uploads/attachment_data/file/827518/Recent_trends_in_mortality_in_England.pdf.
46. Gallagher AM, Dedman D, Padmanabhan S, Leufkens HGM, de Vries F. The accuracy of date of death recording in the Clinical Practice Research Datalink GOLD database in England compared with the Office for National Statistics death registrations. Pharmacoepidemiol Drug Saf. 2019;28(5):563–569. doi:10.1002/pds.4747
47. Cheeta S, Drummond C, Oyefeso A, et al. Low identification of alcohol use disorders in general practice in England. Addiction. 2008;103(5):766–773. doi:10.1111/j.1360-0443.2008.02198.x
48. Davies HR, Nazareth I, Petersen I. Trends of people using drugs and opioid substitute treatment recorded in England and Wales general practice (1994–2012). PLoS One. 2015;10(4):e0122626. doi:10.1371/journal.pone.0122626
49. Frisher M, Martino O, Crome I, Croft P. Trends in drug misuse recorded in primary care in the UK from 1998 to 2005. J Public Health (Oxf). 2009;31(1):69–73. doi:10.1093/pubmed/fdn081
50. Davies-Kershaw H, Petersen I, Nazareth I, Stevenson F. Factors influencing recording of drug misuse in primary care: a qualitative study of GPs in England. Br J Gen Pract. 2018;68(669):e234–e244. doi:10.3399/bjgp18X695309
51. Carr MJ, Ashcroft DM, Kontopantelis E, et al. The epidemiology of self-harm in a UK-wide primary care patient cohort, 2001–2013. BMC Psychiatry. 2016;16. doi:10.1186/s12888-016-0753-5
52. Marchant A, Turner S, Balbuena L, et al. Self-harm presentation across healthcare settings by sex in young people: an e-cohort study using routinely collected linked healthcare data in Wales, UK What is already known? Arch Dis Child. 2019;1–8. doi:10.1136/archdischild-2019-317248
53. Korsgaard HO, Torgersen S, Wentzel-Larsen T, Ulberg R. Substance abuse and personality disorder comorbidity in adolescent outpatients: are girls more severely ill than boys? Child Adolesc Psychiatry Ment Health. 2016;10(1):8. doi:10.1186/s13034-016-0096-5
54. Biskin RS, Paris J. Diagnosing borderline personality disorder. CMAJ. 2012;184(16):1789–1794. doi:10.1503/cmaj.090618
55. Christie E. Better care for people with co-occurring mental health and alcohol/drug use conditions A guide for commissioners and service providers; 2017:8. Available from: https://assets.publishing.service.gov.uk/government/uploads/system/uploads/attachment_data/file/625809/Co-occurring_mental_health_and_alcohol_drug_use_conditions.pdf.
56. Misuse of illicit drugs and medicines: applying all our health - GOV.UK. Available from: https://www.gov.uk/government/publications/misuse-of-illicit-drugs-and-medicines-applying-all-our-health/misuse-of-illicit-drugs-and-medicines-applying-all-our-health.
57. Sagar-Ouriaghli I, Godfrey E, Bridge L, Meade L, Brown JSL. Improving mental health service utilization among men: a systematic review and synthesis of behavior change techniques within interventions targeting help-seeking. Am J Mens Health. 2019;13(3). doi:10.1177/1557988319857009
58. Fanshawe TR, Fazel S. The ‘double whammy’ of low prevalence in clinical risk prediction. BMJ Evid Based Med. 2021;
59. Firmin C. Contextual Safeguarding and Child Protection: Rewriting the Rules. United Kingdom: Taylor & Francis; 2020.
 © 2022 The Author(s). This work is published by Dove Medical Press Limited, and licensed under a
Creative Commons Attribution License.
The full terms of the License are available at http://creativecommons.org/licenses/by/4.0/.
The license permits unrestricted use, distribution, and reproduction in any medium, provided the
original author and source are credited.
© 2022 The Author(s). This work is published by Dove Medical Press Limited, and licensed under a
Creative Commons Attribution License.
The full terms of the License are available at http://creativecommons.org/licenses/by/4.0/.
The license permits unrestricted use, distribution, and reproduction in any medium, provided the
original author and source are credited.