")
Back to Journals » International Journal of Nanomedicine » Volume 10 » Issue 1
In vitro study of novel gadolinium-loaded liposomes guided by GBI-10 aptamer for promising tumor targeting and tumor diagnosis by magnetic resonance imaging
Authors Gu M, Li K, Zhang L, Wang H, Liu L, Zheng Z, Han N, Yang Z, Fan T
Received 11 March 2015
Accepted for publication 3 June 2015
Published 17 August 2015 Volume 2015:10(1) Pages 5187—5204
DOI https://doi.org/10.2147/IJN.S84351
Checked for plagiarism Yes
Review by Single anonymous peer review
Peer reviewer comments 5
Editor who approved publication: Professor Lei Yang
Meng-Jie Gu,1,* Kun-Feng Li,1,* Lan-Xin Zhang,1 Huan Wang,1 Li-Si Liu,2 Zhuo-Zhao Zheng,2 Nan-Yin Han,1 Zhen-Jun Yang,1 Tian-Yuan Fan1
1State Key Laboratory of Natural and Biomimetic Drugs, School of Pharmaceutical Sciences, Peking University, 2Department of Radiology, Peking University Third Hospital, Beijing, People’s Republic of China
*These authors contributed equally to this work
Abstract: Novel gadolinium-loaded liposomes guided by GBI-10 aptamer were developed and evaluated in vitro to enhance magnetic resonance imaging (MRI) diagnosis of tumor. Nontargeted gadolinium-loaded liposomes were achieved by incorporating amphipathic material, Gd (III) [N,N-bis-stearylamidomethyl-N'-amidomethyl] diethylenetriamine tetraacetic acid, into the liposome membrane using lipid film hydration method. GBI-10, as the targeting ligand, was then conjugated onto the liposome surface to get GBI-10-targeted gadolinium-loaded liposomes (GTLs). Both nontargeted gadolinium-loaded liposomes and GTLs displayed good dispersion stability, optimal size, and zeta potential for tumor targeting, as well as favorable imaging properties with enhanced relaxivity compared with a commercial MRI contrast agent (CA), gadopentetate dimeglumine. The use of GBI-10 aptamer in this liposomal system was intended to result in increased accumulation of gadolinium at the periphery of C6 glioma cells, where the targeting extracellular matrix protein tenascin-C is overexpressed. Increased cellular binding of GTLs to C6 cells was confirmed by confocal microscopy, flow cytometry, and MRI, demonstrating the promise of this novel delivery system as a carrier of MRI contrast agent for the diagnosis of tumor. These studies provide a new strategy furthering the development of nanomedicine for both diagnosis and therapy of tumor.
Keywords: magnetic resonance imaging, gadolinium, liposomes, tenascin-C, GBI-10 aptamer, tumor targeting
Introduction
Nowadays, magnetic resonance imaging (MRI) has drawn much attention in tumor diagnosis. MRI is an imaging modality that provides high spatial resolution while avoiding the use of ionizing radiation. The low risk to patients makes it an appropriate and increasingly popular tool for clinical diagnosis.1 Because of the relatively low sensitivity of MRI for tumor diagnosis, contrast agents (CAs) are used to improve the quality of MR images, thereby improving the diagnostic accuracy. These agents consist of molecules incorporating a paramagnetic metal ion. Gadolinium (Gd) is the most frequently used CAs for MRI. Due to the enhancement of longitudinal (1/T1) or transverse (1/T2) relaxation rates of the surrounding bulk water protons by the coordinated metal ion under an applied magnetic field, the contrast between normal tissues and pathological tissues can be significantly improved. Gd-incorporated CAs increase both 1/T1 and 1/T2 but are generally used in T1-weighted imaging, where their 1/T1 effect is greater in tissue than their 1/T2 enhancement.2 Several Gd conjugates, such as gadopentetate dimeglumine (Gd·DTPA, Magnevist®), gadoterate meglumine (Dotarem®), gadoteridol (ProHance®), and gadodiamide (Omniscan®), have already been approved by the US Food and Drug Administration (FDA) for clinical diagnosis. However, these small molecular weight Gd chelates are extracellular CAs without tissue specificity and are rapidly cleared from circulation. Therefore, it is of vital importance to develop novel MRI CAs with prolonged circulation time, as well as with improved tissue specificity.
A major challenge in nanomedicine designed for cancer diagnosis is the delivery of CAs with desirable specificity and efficiency. Using peptides and antibodies (Abs) as targeting ligands against different cell-surface receptors is one of the most common approaches to achieve this goal.3,4 Recently, nucleic acid-based aptamers have made an important impact on biomedical application, especially as new targeting ligands in the aspect of targeting cancers.5–8 Aptamers are single-stranded oligonucleotides (ssDNA or ssRNA) obtained by an in vitro process called systematic evolution of ligands by exponential enrichment (SELEX).4,9 As cell-specific targeting ligands, many aptamers identified by SELEX have nearly identical binding affinity and specificity to those of peptides or Abs.5–7 In comparison to Abs, aptamers possess several obvious advantages. They are generally considered nonimmunogenic and biocompatible, much more stable to heat, pH, and organic solvents, easier to prepare and scale up, and with smaller molecular weight (8–15 kDa).3,8 The ssDNA or ssRNA can fold into well-defined 3D-structures and bind to their target with high affinity (μM–pM range) and specificity.10 Furthermore, aptamers can be chemically modified to enhance their stability and affinity with targets.
There are many studies on aptamers due to their potential as targeting ligands for novel drug delivery systems.3,4,10–13 In 2004, FDA-approved Macugen (pegaptanib) as an antiangiogenic therapeutic agent for neovascular (wet) age-related macular degeneration. In addition, a variety of other aptamers, such as AS1411, are currently under clinical trials. The GBI-10 aptamer used in this study is a type of ssDNA specific for tenascin-C (TN-C),14 an extracellular matrix protein that is overexpressed on the surface of various tumor cells, such as glioma cells and some breast cancer cells, as well as tumor neovasculature.15,16 In contrast with previously reported RNA aptamers, DNA aptamers have shown reduced susceptibility to biodegradation, which makes them more favorable for clinical applications.3,4 In order to develop a convenient and sensitive diagnostic assay for cancer by detecting TN-C protein, we evaluated GBI-10 aptamer as a targeted drug delivery system in this study.
Several studies regarding aptamer-targeted delivery systems handled in vitro at 4°C have shown high binding affinity toward their target molecules;17–20 however, they have shown lower binding affinity at physiological temperature (37°C).14,21,22 GBI-10 is among the aptamers with promising results selected by SELEX in vitro at 4°C.14 Daniels et al14 reported that GBI-10 had high binding affinity (Kd =150 nM) toward TN-C at 4°C while low binding affinity at 37°C (the Kd was at least tenfold weaker). Despite promising in vitro studies, few studies of DNA aptamer nanomedicine constructs have shown successful efficacy in vivo.3 Thus, in this initial study, experiments were conducted at 4°C to prove the initial targeting possibility of the GBI-10 targeted MRI CA to TN-C in tumor cells.
There have been several studies regarding lipid-based nanoparticles, including liposomes, as carriers of MRI CAs. When introducing macromolecular carriers, signal enhancement to MRI is improved by shortening the T1 relaxation time of water protons.2,23–25 Liposomes are by now one of the most successful nanomedicines, which have been applied to deliver a wide variety of chemical molecules, genes, CAs, and even nanoparticles.26 Compared with other delivery systems (such as nanoparticles, micelles, and carbon nanotubes), liposomes show superior biocompatibility, biodegradability, relatively low toxicity, and improved control over size and surface functionality.3,27 Many liposomal formulations have been approved by FDA for a number of clinical therapies in different fields.28 Previous efforts on liposomal drug delivery have focused on developing long-circulating liposomes that target tumor tissues through a passive targeting mechanism, the enhanced permeation and retention (EPR) effect.27 However, targeting of the entire EPR-based cancer is still undesirable. Some studies have shown that by anchoring ligands in liposome bilayers, the affinity and specificity of liposomal systems to specific targets could be enhanced.24,25,29 Among the target-specific ligands, aptamers have appeared as promising candidates.3,4,30
Therefore, GBI-10-targeted gadolinium-loaded liposomes (GTLs) were designed and prepared as a MRI CA for the diagnosis of tumor for the first time in this original study. Liposomes containing an amphiphilic paramagnetic material, Gd (III) [N, N-bis-stearylamidomethyl-N′-amidomethyl] diethylenetriamine tetraacetic acid (Gd·DTPA·BSA), possess enhanced relaxivity for water protons. To further test our hypothesis that GTLs can recognize the TN-C on the target tumor cell surface, C6 cells (rat glioma cell line, overexpression of TN-C) and NIH 3T3 cells (mouse embryonic fibroblasts cell line, no expression of TN-C) were chosen as the models for tumor cells and normal cells, respectively.17,31–33
Materials and methods
Materials
1,2-Distearoyl-sn-glycero-3-phosphocholine (DSPC) and 1,2-distearoyl-sn-glycero-3-phosphoethanolamine-N-[methoxy(polyethylene glycol)-2000] (DSPE-mPEG2000) were purchased from Avanti Polar Lipids Inc. (Alabaster, AL, USA). 1,2-Distearoyl-sn-glycero-3-phosphoethanolamine-N-[carboxy(polyethyleneglycol)-2000] (ammonium salt) (DSPE-PEG2000-COOH) was provided by Laysan Bio Inc. (Arab, AL, USA). Cholesterol, coumarin-6, 1-ethyl-3-(3-dimethyl aminopropyl)-carbodiimide (EDC), N-hydroxysuccinimide (NHS), and GdCl3·6H2O were obtained from Sigma-Aldrich (St Louis, MO, USA). Stearylamine was obtained from Alfa Aesar (Tianjin, People’s Republic of China). Diethylenetriamine pentaacetic acid (DTPA) was purchased from J&K Scientific Ltd. (Beijing, People’s Republic of China). HEPES was purchased from Biosharp Biotechnology Co., Ltd. (Hefei, People’s Republic of China). Hoechst 33342 and 1,1′-dioctadecyl-3,3,3′,3′-tetramethylindocarbocyanine perchlorate (DiI) were supplied by Beyotime Institute of Biotechnology (Haimeng, People’s Republic of China). Paraformaldehyde was obtained from Macgene Biotech Co., Ltd. (Beijing, People’s Republic of China). Gadopentetate dimeglumine (Magnevist®, Gd·DTPA) was supplied by Beijing Beilu Pharmaceutical Co., Ltd. (Beijing, People’s Republic of China). The sequence of GBI-10 aptamer used in this study was 5′-CCCAGAGGGAAGACTTTAGGTTCGGTTCACGTCC-3′. All the other solvents and reagents were of analytical grade and were used as received without further purification otherwise noted.
Synthesis of Gd·DTPA·BSA
Gd·DTPA·BSA was prepared using the method outlined by Kimpe et al.34 Briefly, DTPA, acetic anhydride, and pyridine were mixed to react at a reflux for 4 hours. The resulting DTPA bis-anhydride (DTPA·BA) was filtered and dried under vacuum overnight. Afterward, stearylamine in chloroform solution was added to the solution of DTPA·BA previously dissolved in DMF and stirred at 40°C for 2 hours. The white precipitate formed was collected by filtration, dried under vacuum overnight, and purified by dissolving in water and boiling chloroform successively to get rid of any excess DTPA, DTPA·BA, and stearylamine. At last, a water solution of GdCl3·6H2O was added dropwise to that of the purified DTPA·BSA. The reaction was stirred at 90°C for 3 hours.
Synthesis of amino-modified GBI-10 aptamer
The oligonucleotides were synthesized on ABI 394 automated RNA/DNA synthesizer (Thermo Fisher Scientific, Waltham, MA, USA), and the scale of synthesis was set at a 1 μmol based on method of solid-phase phosphoramiditechemistry, according to the previously described method.35 The scheme of amino-modified GBI-10 aptamer synthesis was illustrated in Figure 1. Briefly, a solution of 1-amino-6-hexanol in dichloromethane was slowly added to CF3COOEt. The reaction mixture was stirred for 8 hours at room temperature. Purification was achieved by flash chromatography over silica gel to afford 6-(trifluoroacetamido)-1-hexanol. Then, 6-(trifluoroacetamido)-1-hexanol and 1H-tetrazole were dissolved in anhydrous acetonitrile (CH3CN). The solution was cooled on an ice bath, and 2-cyanoethoxy-N′, N′, N, N-tetraisopropyl-phosphoramidite was added under dry nitrogen. After stirring at room temperature for 2 hours, the solution was purified by flash chromatography over silica gel to afford spacer amino phosphoramidite. Spacer amino phosphoramidite dissolved in methylene chloride was directly coupled onto the sequence by the synthesizer. The complete aptamer lipid sequences were then deprotected in concentrated ammoniahydroxide:methylamine equals 1:1 (AMA) solution at 60°C for 90 minutes. The products were purified by C18 reversed-phase high-performance liquid chromatography (XBridge TM OST C18, 2.5 μm, 10 mm ×50 mm) using a linear gradient of 5%→20% eluent A (95%→80% eluent B) in 35 minutes (Supplementary materials). Solution of 0.1 M Et3N-H2CO3 (pH =7.7) was used as eluent B, and CH3CN was used as eluent A. The oligonucleotide solutions were desalted by Sephadex G25 column.
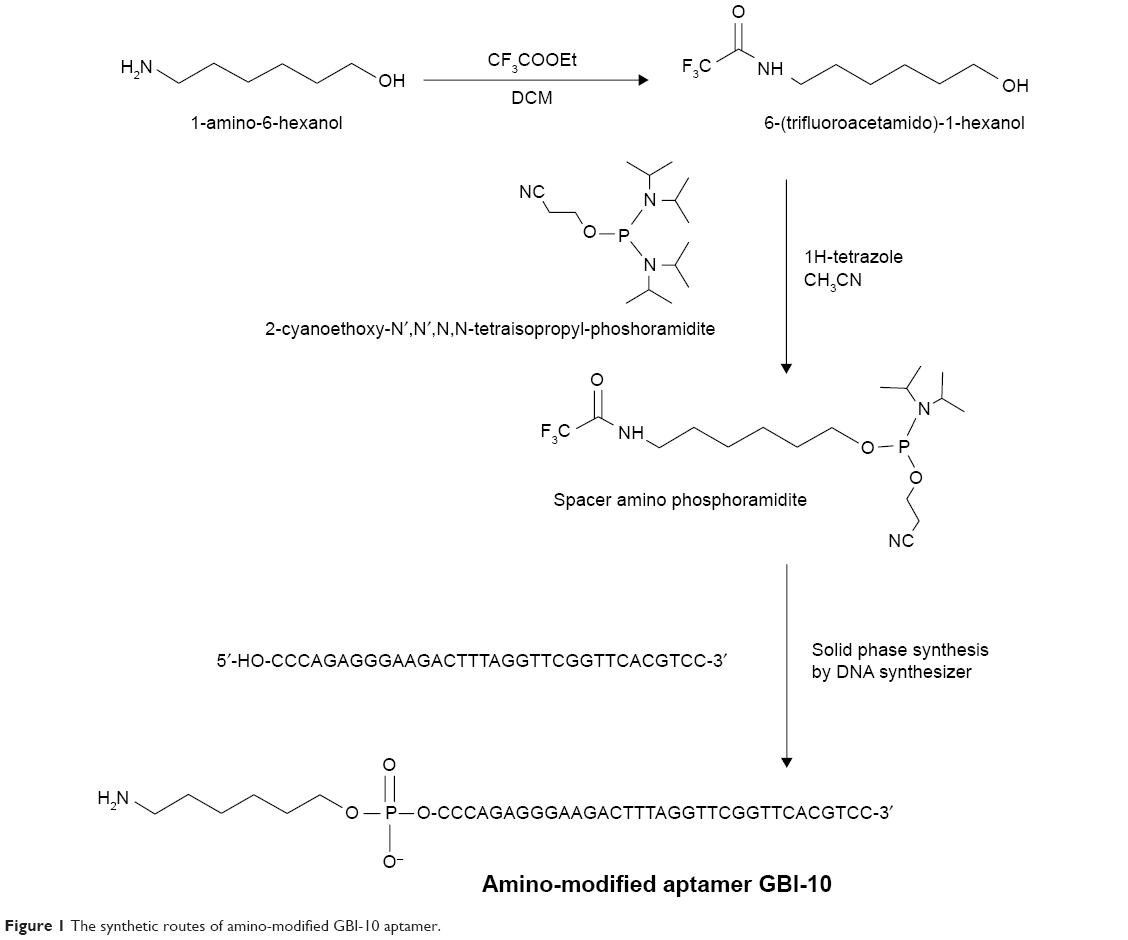 | Figure 1 The synthetic routes of amino-modified GBI-10 aptamer. |
Preparation of nontargeted gadolinium-loaded liposomes
The nontargeted gadolinium-loaded liposomes (NTLs) containing Gd·DTPA·BSA, DSPC, cholesterol, and DSPE-mPEG2000 at a molar ratio of 0.75:1.10:1:0.15 were produced by lipid film hydration and extrusion method.23,36,37 In short, the lipids were dissolved in a mixture of methanol and chloroform at a ratio of 1:1 (v/v). In some experiments, 0.1 mole percent of coumarin-6 was added to lipids as a fluorescent marker. The organic solvents were evaporated, and a lipid film was formed. Then, the resulting thin film was hydrated by vortexing in a HEPES-buffered saline solution (pH 7.4, containing 25 mM HEPES, 150 mM NaCl, 5 mM KCl, 1 mM MgCl2, and 1 mM CaCl2) and sonicated for 5 minutes with a sonifier cell disrupter. The liposome suspensions were obtained and extruded 20 times through a 100 nm nuclepore membrane (Whatman, Kent, UK) using a mini-extruder set (Avanti Polar Lipids Inc.). The above procedures were all handled at 55°C.
Preparation of GTLs
The pretargeted liposomes (PTLs) were first prepared as same as NTLs, except with molar ratio of Gd·DTPA·BSA, DSPC, cholesterol, DSPE-mPEG2000, and DSPE-PEG2000-COOH at 0.75:1.10:1:0.075:0.075. Then, the PTLs were incubated with 400 mM of EDC and 100 mM of NHS at room temperature for 15 minutes to get NHS-activated PTLs, which were then linked to 5′-NH2 modified GBI-10 aptamers (at a lipid-to-aptamer weight ratio of 50:1). That is, NH2-GBI-10 aptamers were covalently conjugated to the distal end of DSPE-PEG2000-COOH lipid by amide bond and modified the surface of PTLs as targeting ligand to form GTLs.18,38 Afterward, GTLs were washed, resuspended in HEPES-buffered saline solution, and used for the following experiment immediately.
Particle size and zeta potential of NTLs and GTLs
The particle size and zeta potential of NTLs and GTLs were determined with dynamic light scattering method. Measurements were performed with a photon correlation spectroscopy at a wavelength of 633 nm and scattering angle of 90° using a Malvern Zetasizer Nano ZS (Malvern Instruments, Malvern, UK) at 25°C. All measurements were performed in triplicates.
Inductively coupled plasma mass spectrometry analysis
Inductively coupled plasma mass spectrometry (ICP-MS) was used to measure the concentration of Gd in NTLs, GTLs, and Gd·DTPA.39–42 Each sample was digested with 0.5 mL of concentrated nitric acid using Microwave Digestion System (Ultra WAVE, Milestone, Milan, Italy). Afterward, 125 μL of solution was pipetted from each digested sample and diluted to a total volume of 5 mL with deionized water, followed by ICP-MS analysis (DRC-II; PerkinElmer Inc., Waltham, MA, USA) in argon gas mode. The analysis was repeated three times, and the mean value was reported.
In vitro MRI relaxivity measurements and phantom study
The in vitro MRI relaxivity measurements for NTLs and GTLs were performed at a 3 T MR scanner (Magnetom TrioTim; Siemens, Munich, Germany) equipped with a human head coil. A small molecule CA, Gd·DTPA, was used as control throughout this study.
The longitudinal relaxation time T1 (s) of NTLs, GTLs, and Gd·DTPA in aqueous solution at gradient concentration of Gd was measured by inversion-recovery pulse sequence with a single slice thickness of 4.0 mm, field of view of 230×230 mm, flip angle of 180°, matrix size of 256×256, and number of average of 1. The inversion times (TI) were 25 ms, 50 ms, 100 ms, 200 ms, 400 ms, 800 ms, 1,600 ms, and 2,500 ms with the repetition time of 8,000 ms and the echo time of 9.1 ms. The longitudinal relaxivity r1 (in unit of mM−1s−1) was determined from the slope of the linear fitting of the reciprocal of the T1 relaxation time versus the accurate Gd concentration (mM) measured by ICP-MS,23,36 which was described earlier in detail. All investigations were performed in triplicates.
After relaxivity measurements, T1-weighted MR images were also obtained to evaluate the imaging capability of NTLs, GTLs, and Gd·DTPA with water as blank control using the following gradient echo pulse sequence: repetition time of 200 ms, echo time of 2.65 ms, slice thickness of 5.0 mm, field of view of 230×230 mm, flip angle of 70°, matrix size of 314×448, and number of average of 2.
Cell culture
The rat glioma cell line (C6) and the mouse embryonic fibroblasts cell line (NIH 3T3) were obtained from the Institute of Basic Medical Sciences (Chinese Academy of Medical Sciences, Beijing, People’s Republic of China) and cultivated under the recommended conditions. Briefly, the C6 cells were maintained in Ham’s F10 Medium (Macgene Biotech Co., Ltd., Beijing, People’s Republic of China) supplemented with 15% (v/v) horse serum (Thermo Fisher Scientific, Waltham, MA, USA), 2.5% (v/v) fetal bovine serum (FBS, Thermo Fisher Scientific), 100 U/mL penicillin, and 100 μg/mL streptomycin. The NIH 3T3 cells were cultured in Dulbecco’s Modified Eagle’s Medium (Macgene Biotech Co., Ltd., Beijing, People’s Republic of China) supplemented with 10% (v/v) fetal bovine serum, 100 U/mL penicillin, and 100 μg/mL streptomycin. Cells were seeded into plates precoated with 0.02% (w/v) gelatin in a 5% CO2-humidified chamber at 37°C, with a medium change at the first 24 hours and every 48 hours thereafter until the cells reached approximately 80%–90% confluence. The cells were then trypsinized and transferred into a gelatin-coated culture flask with culture medium for the follow-up study.
Confocal laser scanning microscopy
Confocal fluorescence microscopy was applied to investigate the binding of NTLs and GTLs to C6 cells (TN-C(+)) and NIH 3T3 cells (TN-C(−)) and the localization of NTLs and GTLs in the cells, respectively.11 Cells were seeded into glass bottom dishes with 35 mm diameters and cultured for 24 hours at 37°C under an atmosphere with 5% of CO2. Then, the medium was discarded, and the cells were washed once with cold phosphate buffer saline (PBS). After that, the diluted coumarin-6-labeled (excitation at 466 nm and emission at 504 nm) NTLs and GTLs were separately added to the dishes with a final coumarin-6 concentration of 100 ng/mL, and the cells were incubated at 4°C for 1 hour. The cells were washed with cold PBS for three times thereafter and fixed with 4% of paraformaldehyde PBS solution at 4°C for 15 minutes, followed by cell nuclei staining with Hoechst 33342 (excitation at 352 nm and emission at 461 nm) at 4°C for 20 minutes, then cold PBS was used to rinse those cells for three times. Finally, the samples were observed with a confocal microscope (TCS SP8; Leica Microsystems, Wetzlar, Germany).
To better understand the binding of GTLs to the membrane of C6 cells, we applied DiI (excitation at 549 nm and emission at 565 nm) to stain the cell membranes. In brief, C6 cells were seeded into glass bottom dishes with medium culture in a 37°C incubator under an atmosphere of 5% CO2 24 hours before the experiment, as described earlier. On the next experimental day, medium from cells was removed, and the cells were then washed with cold PBS once. Thereafter, 500 μL of DiI solution (4 μg/mL in Ham’s F10 medium without serum) was added to each dish, followed by incubation at 4°C for 1.5 hours. After that, the cells were washed with cold Ham’s F10 medium twice and with cold PBS once. After the cell membrane staining procedure, the binding assay of GTLs and NTLs to C6 cells was performed at different incubation times (0.5 hours, 1 hour, and 2 hours) at 4°C. The final coumarin-6 concentration of GTLs and NTLs incubated with cells was 100 ng/mL. Finally, the medium was discarded, and after washing two to three times with cold PBS, the cells were examined by confocal laser scanning microscopy, as described earlier.
Flow cytometry analysis
A flow cytometer (FACS Calibur; Becton Dickinson, Franklin, NJ, USA) was used to investigate the targeting capability of GTLs quantitatively.3 C6 cells (TN-C(+)) and NIH 3T3 cells (TN-C(−)) were separately seeded into 12-well culture plates and incubated at 37°C under 5% CO2 for 24 hours. Then, the culture medium was discarded, washed once with cold PBS, and the coumarin-6-labeled NTLs, GTLs, and coumarin-6 diluted with serum-free medium were, respectively, added to a final coumarin-6 concentration of 50 ng/mL in each group. For the control group, cells were incubated with serum-free culture medium. Afterward, the cells were placed at 4°C for 1 hour followed by washing with cold PBS for three times. The cells were harvested by trypsinization, centrifuged, washed twice with cold PBS, and then resuspended with 400 μL of PBS for flow cytometry analysis. The samples were measured using the excitation wavelength of 467 nm, and the fluorescence was detected at 502 nm. FL1-H was chosen as the detection channel. Finally, the raw data were evaluated by FCS Express V3 (De Novo Software, Thornhill, ON, Canada).
MR imaging of cell pellets
The target specificity of GTLs for C6 was also detected by MRI scanner.23,43 C6 cells (TN-C(+)) and NIH 3T3 cells (TN-C(−)) were separately seeded into 75 cm2 culture flasks and maintained at 37°C under 5% CO2 for 48 hours. Then, they were incubated, respectively, with culture medium (control), NTLs, GTLs, and Gd·DTPA in serum-free medium at 4°C for 2 hours. The total lipid concentration of NTLs or GTLs was 2 mM, and the Gd concentration of NTLs, GTLs, or Gd·DTPA was 0.50 mM to the final. After incubation, the cells were washed at 4°C with serum-free culture medium twice and PBS once. The cells were then harvested by trypsinization, collected in tubes, washed twice with cold PBS, and resuspended in 4% of paraformaldehyde PBS solution to a final volume of ~100 μL. Loosely packed cell pellets were obtained by settling in 500 μL eppendorf cups at 4°C overnight.
Subsequently, the samples and control were used for MR imaging, which was performed at the same MR scanner described earlier equipped with a human head coil at room temperature. For quantification of T1 values of the cell pellets, an inversion-recovery pulse sequence was used with the same parameters as mentioned in the former section and was performed with three independent experiments. Furthermore, to obtain the T1-weighted images of the cell pellets, a gradient echo pulse sequence was applied both in the coronal and axial planes, with the same parameters as mentioned in the in vitro MRI relaxivity measurements and phantom study section.
Statistical analysis
All experimental data were described as the mean ± standard deviation. Student’s t-test and one-way analysis of variance were used to analyze the results. P-values <0.05 were considered statistically significant, while <0.01 were considered highly significant.
Results
Synthesis and characterization of liposomal materials and formulations
The identification of Gd·DTPA·BSA were confirmed by high resolution mass spectrometry (HRMS) (data shown in Supplementary materials). The oligonucleotide compositions were confirmed by matrix-assisted laser desorption/ionization time of flight mass spectrometry (MALDI-TOF-MS) (data shown in Supplementary materials). The schematic illustration of preparing GTLs by the EDC/NHS conjugation reaction is depicted in Figure S1. The physicochemical characteristics of the resulting liposome formulations are shown in Table 1 and Figure S2. Both NTLs and GTLs had average diameters at ~120 nm with a narrow particle size distribution index (<0.30), implying their good dispersion stability, which may be an optimal size for tumor targeting by the EPR effect.44 GTLs showed a larger size than NTLs (P<0.05) owing to loading NH2-GBI-10 aptamers onto the surface of PTLs. Furthermore, NTLs exhibited a nearly neutral potential, whereas GTLs had a more negative charge (P<0.05). The decreasing zeta potential of GTLs further indicated that negatively charged NH2-GBI-10 was successfully attached onto the outer surface of PTLs.45
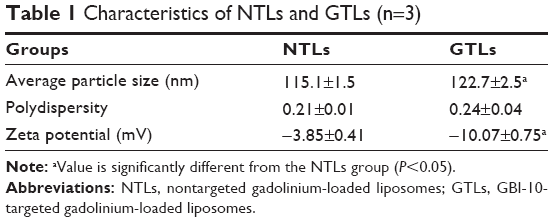 | Table 1 Characteristics of NTLs and GTLs (n=3) |
In vitro relaxometry studies
The longitudinal relaxivity r1 of the liposome suspensions was determined and compared with the r1 of Gd·DTPA solution that is in clinical use. The T1 relaxation rate (R1 =1/T1, s−1) was plotted versus Gd concentration (mM) to determine the r1 (mM−1s−1) of each formulation as shown in Figure 2A. The accurate concentration of Gd in each sample was confirmed by ICP-MS (data not shown). For NTLs and GTLs, the r1 values were 4.7±0.3 mM−1s−1 and 4.5±0.2 mM−1s−1, respectively, both significantly higher (P<0.05) than that of Gd·DTPA solution (Table 2). The increased r1 values suggest that Gd-loaded liposomal systems of NTLs and GTLs could act as an ideal T1 CA.
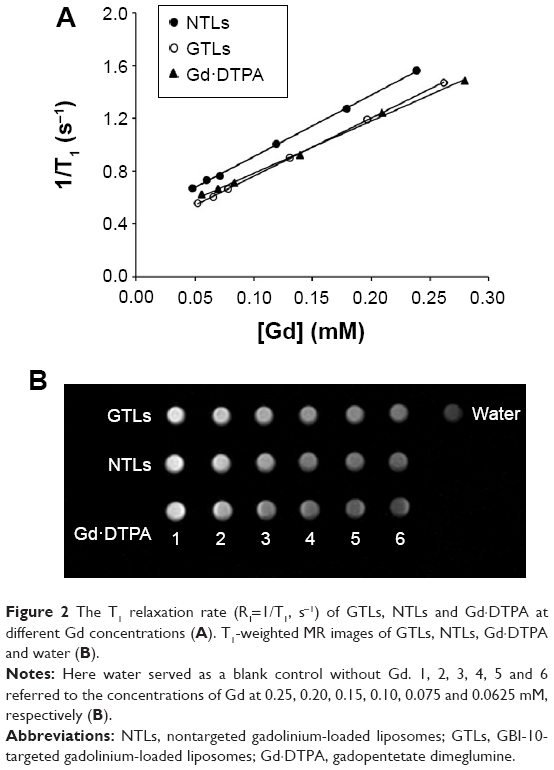 | Figure 2 The T1 relaxation rate (R1=1/T1, s−1) of GTLs, NTLs and Gd·DTPA at different Gd concentrations (A). T1-weighted MR images of GTLs, NTLs, Gd·DTPA and water (B). |
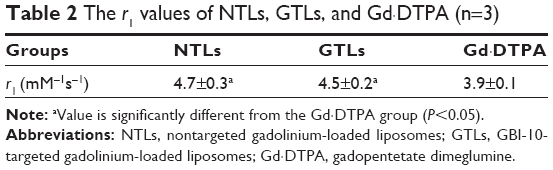 | Table 2 The r1 values of NTLs, GTLs, and Gd·DTPA (n=3) |
To further evaluate the imaging capability, the T1-weighted MR images of NTLs, GTLs, and Gd·DTPA at gradient concentration of Gd were obtained. Water was used as a blank control. Compared with water, NTLs, GTLs, and Gd·DTPA all showed signal enhancement (Figure 2B), demonstrating the Gd-loaded liposomes to be MR detectable. The increases in Gd concentration accelerated longitudinal relaxation to shorten the T1 relaxation time, resulting in an increased signal intensity with bright contrast. That is to say, the intensity of the signal is concentration dependent. To summarize, both NTLs and GTLs possessed enhanced relaxivity for water protons resulting in an increase of signal intensity on T1-weighted MR images, as well as higher r1 values. This might be due to easier proton exchange between the bulk water and the Gd in NTLs and GTLs.25,46
Confocal microscopy and flow cytometry analysis studies
The results of confocal microscopy shown in Figure 3 depict the localization of GTLs and NTLs, as well as their interaction with cells. Blue represents the cell nuclei dyed with Hoechst 33342, and green represents the coumarin-6-labeled liposomes under the exciting light of certain wavelengths. In Figure 3A, blue nuclei surrounded by strong green fluorescence points were observed for C6 cells, and the quantity of the green points of GTLs group was much greater than that of NTLs group, indicating that GTLs could be guided by GBI-10 aptamers to the surface of target C6 cells (TN-C(+)). However, for normal cells, NIH 3T3 (Figure 3B), the green fluorescence observed in both GTLs and NTLs groups was very weak due to the negative expression of TN-C.
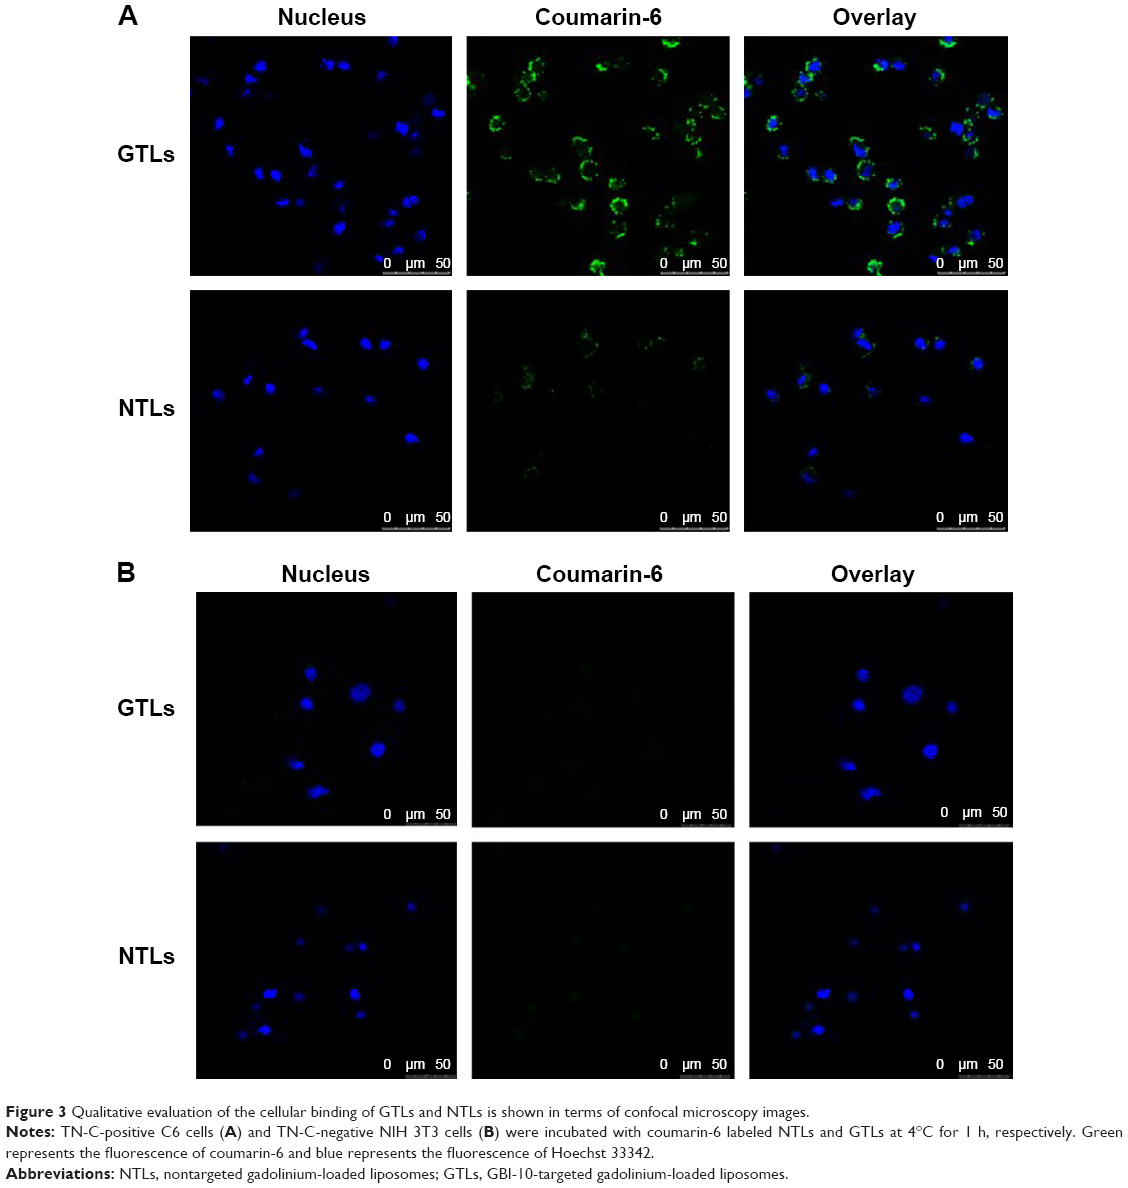 | Figure 3 Qualitative evaluation of the cellular binding of GTLs and NTLs is shown in terms of confocal microscopy images. |
More detailed information can be found in Figure 4, where the confocal pictures were taken at higher magnifications. For each sample visualized through fluorescence microscopy, the corresponding image was also obtained in visible light. The results showed that GTLs and NTLs bound to cell membranes rather than being internalized by the cells. It seems that with longer incubation time, larger amounts of GTLs were able to bind to the membranes of C6 cells. Nevertheless, no internalization of liposomes was observed even under the longest incubation time (2 hours). Meanwhile, necrocytosis might occur (Figure 4, NTLs, 2 hours) due to exposure under low temperature for too long time (1.5 hours of cell membranes staining and 2 hours of incubation with liposomes).
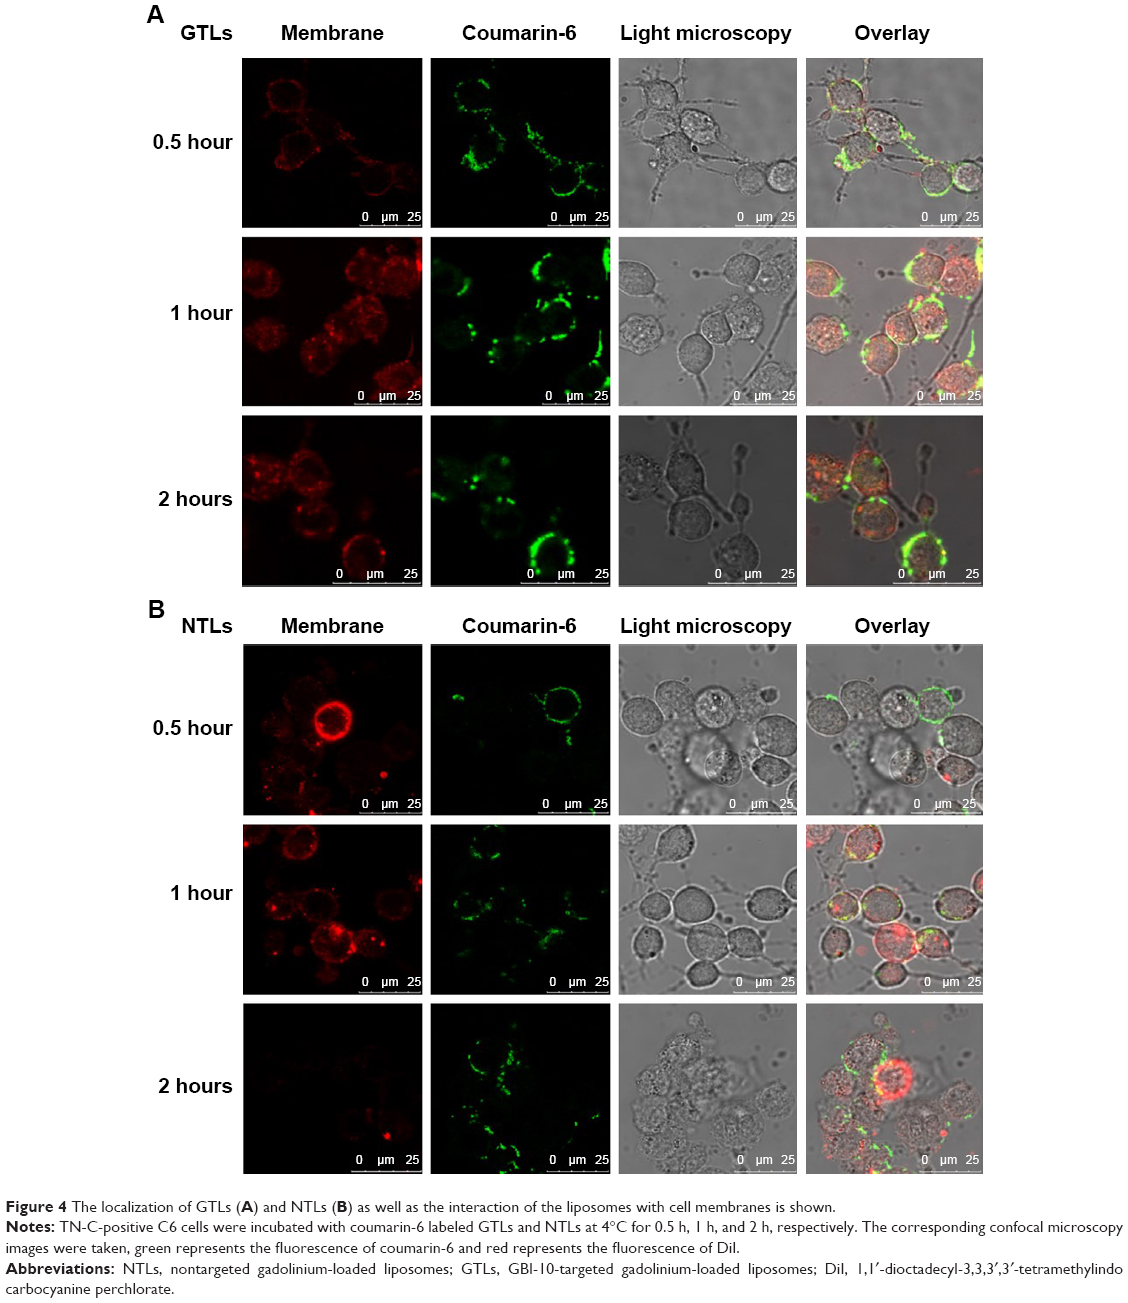 | Figure 4 The localization of GTLs (A) and NTLs (B) as well as the interaction of the liposomes with cell membranes is shown. |
The cellular binding assay of coumarin-6-labeled liposomes was also analyzed by flow cytometry, which can quantify the intensity of coumarin-6 representing the amounts of liposomes. The results are depicted in Figure 5. In this study, free coumarin-6 was taken as positive control because its highly lipophilic nature could lead to a greater cellular accumulation.37 Apparent distinction between GTLs group and NTLs group could be found in this assay for C6 cells (Figure 5A and C). The cellular binding of GTLs was ~2.01-fold higher than that of NTLs (Figure 5C, P<0.01), which further proved that GTLs could effectively target the C6 cells through TN-C receptor. There was no significant difference of the cellular binding between GTLs and NTLs groups for NIH 3T3 cells (Figure 5B and C), which was in accordance with the results of confocal microscopy.
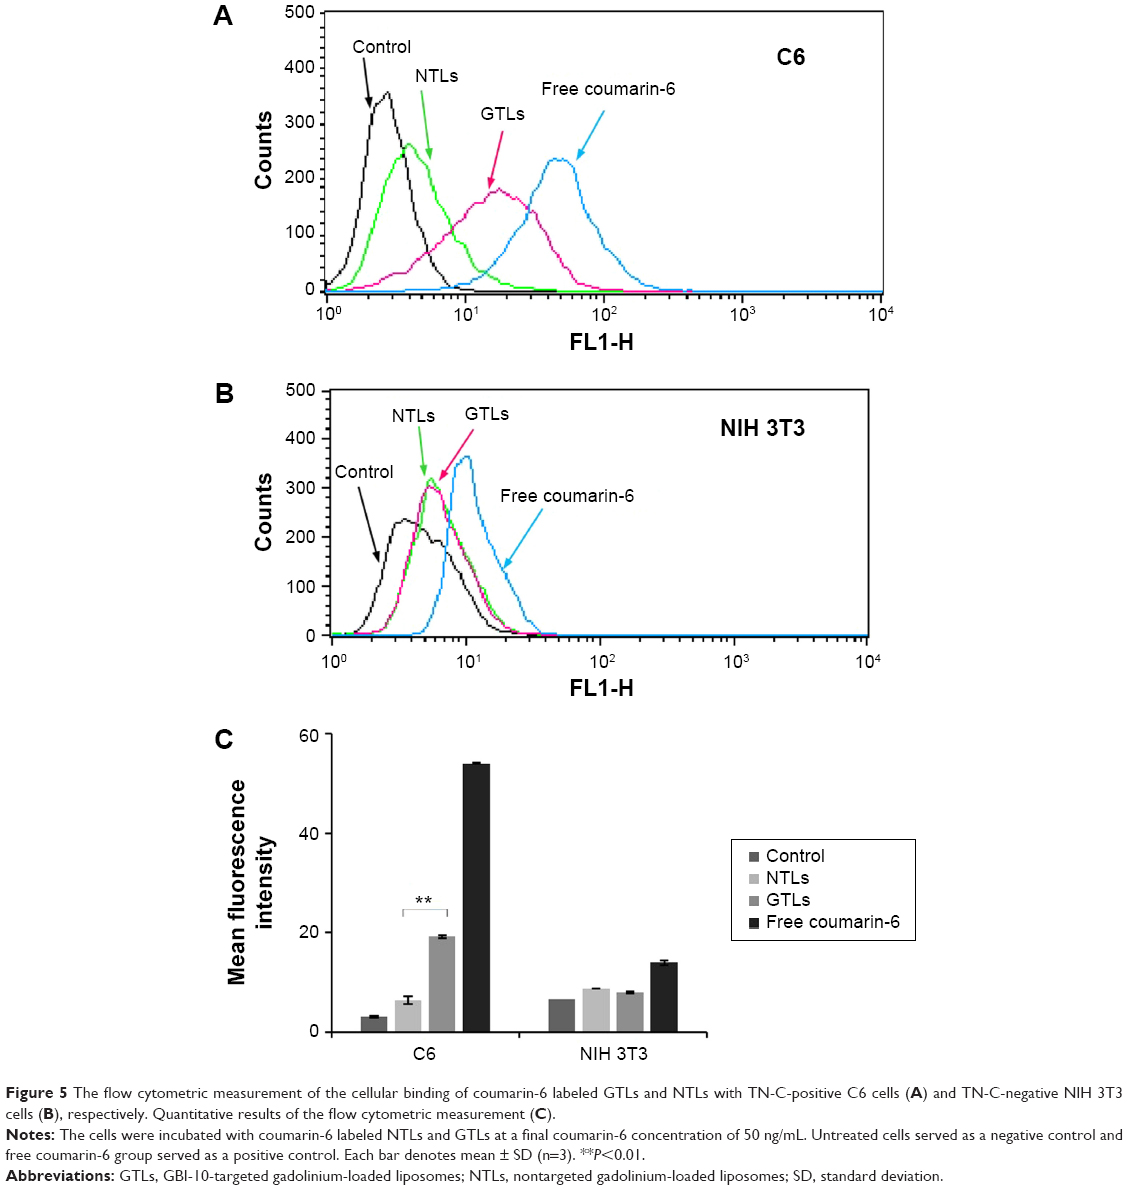 | Figure 5 The flow cytometric measurement of the cellular binding of coumarin-6 labeled GTLs and NTLs with TN-C-positive C6 cells (A) and TN-C-negative NIH 3T3 cells (B), respectively. Quantitative results of the flow cytometric measurement (C). |
MR imaging of cell pellets
The results of cell labeling are also described in terms of T1-weighted images and resulting T1 values (Figure 6 and Table 3). C6 cells and NIH 3T3 cells were incubated with 1) GTLs, 2) NTLs, 3) Gd·DTPA, and 4) serum-free culture medium (blank control) at 4°C for 2 hours, respectively. It is clear that C6 cells incubated with GTLs had much higher signal intensity than that treated with NTLs (Figure 6A and B). This was probably due to TN-C-mediated binding by the TN-C-positive C6 cells. The MR signal of C6 cells incubated with GTLs was also brighter than that incubated with Gd·DTPA. This may be caused by the hydrophilicity of Gd·DTPA, which makes the molecules neither able to enter cells by diffusion nor bind to the cell surface.25 Thus, Gd·DTPA was removed during the washing procedure of the cells, resulting in a relatively low MR signal. The results of axial scan of T1-weighted images of cell pellets were in accordance with that of coronal scan. In contrast, the TN-C-negative NIH 3T3 cells incubated with GTLs had almost the same signal intensity as that treated with NTLs (Figure 6C and D).
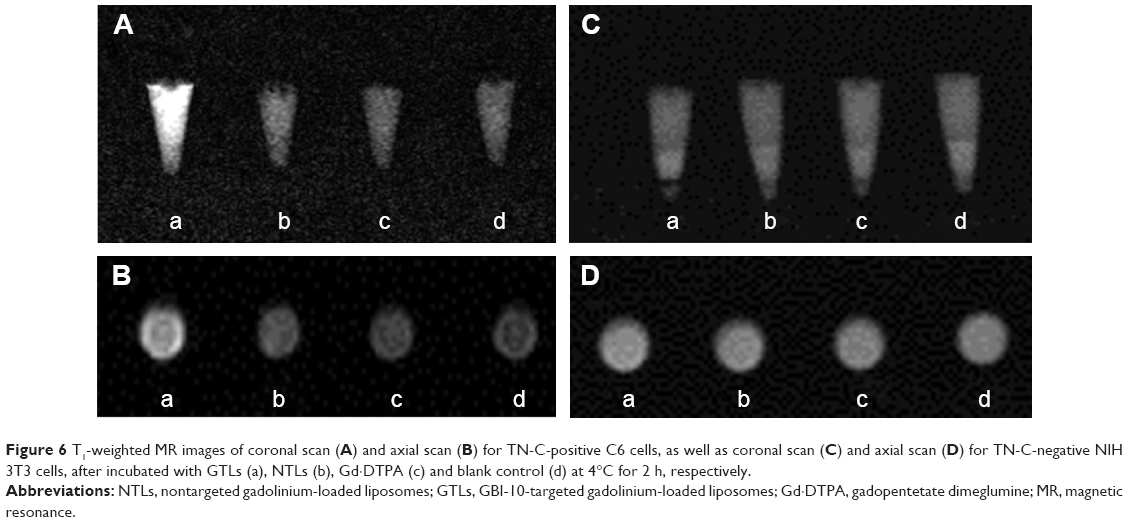 | Figure 6 T1-weighted MR images of coronal scan (A) and axial scan (B) for TN-C-positive C6 cells, as well as coronal scan (C) and axial scan (D) for TN-C-negative NIH 3T3 cells, after incubated with GTLs (a), NTLs (b), Gd·DTPA (c) and blank control (d) at 4°C for 2 h, respectively. |
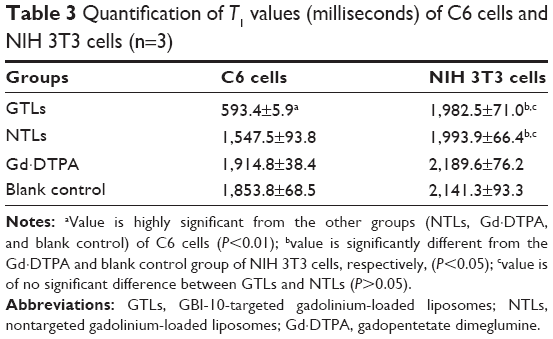 | Table 3 Quantification of T1 values (milliseconds) of C6 cells and NIH 3T3 cells (n=3) |
Furthermore, for C6 cells, the T1 value of the cell pellets incubated with GTLs (593.4 ms ±5.9 ms) was significantly lower (P<0.01) than the other groups, as listed in Table 3. In contrast, the T1 of the cell pellets incubated with NTLs, Gd·DTPA, and blank control all had comparable values. However, owing to no expression of TN-C in NIH 3T3 cells, the T1 value of the cell pellets incubated with GTLs was not significantly different from the NTLs groups (P>0.05). These results are conformant with the results of the confocal microscopy and flow cytometry analysis studies, further confirming the TN-C-dependent cellular binding of GTLs in TN-C-positive C6 cells.
Discussion
In this initial work, novel GBI-10 aptamer-modified paramagnetic liposomes targeting TN-C (a dominant extracellular matrix protein that is overexpressed in various tumor cells and tumor neovasculature) with high specificity and excellent efficiency were prepared and characterized. Briefly, conventional Gd-loaded liposomes were prepared by lipid film hydration and extrusion, the most commonly used method in producing liposomes.47 Based on the excellent properties of aptamers, which can be chemically synthesized and modified for molecular conjugation, the 5′ end of GBI-10 aptamers was modified with an amino group. Then, 5′-NH2 modified GBI-10 aptamers were covalently conjugated to the distal end of DSPE-PEG-COOH2000 lipid by EDC/NHS reaction according to some published reports.18,36,38,48 Owing to relatively high conjugation efficiency, EDC/NHS method is among the most widely used and most mature conjugation reaction between amino and carboxyl.18,36,38,48 The conjugation efficiency between NH2-GBI-10 and PTLs was 91.6%±0.4%. This was determined by collecting unconjugated oligonucleotides after ultrafiltration of the products and measuring the concentration using NanoDrop 2000 UV-Vis Spectrophotometer (NanoDrop Technologies, Wilmington, DE, USA).19,49 The favorable physicochemical characters of NTLs and GTLs made these two liposomal delivery systems promising candidates for further investigation of their tumor-targeting capacity in vitro.
Liposomes have been used as carriers of MRI CAs for noninvasive imaging in several reports by improving Gd-based CAs’ efficiency of shortening the T1 relaxation time of water.2,23–25,36 Two types of liposomal MRI CAs have been described most frequently in the literature.50,51 The first is entrapping typical paramagnetic agents, such as Gd·DTPA, in the inner hydrophilic core of liposomes. However, it cannot be ignored that encapsulation may reduce the relaxivity of the paramagnetic agent because of the limited access to exchange with water by the CAs in these liposomal systems.25 To overcome the drawbacks of the first type of liposomal CAs, we used the second type, which provides greater access to proton exchange with water compared with the liposomes of the first type.23,25,36 An amphiphilic paramagnetic material, Gd·DTPA·BSA, was synthesized and then incorporated into the lipid bilayer as an integral part of the liposomal surface. Since the Gd·DTPA·BSA-containing liposomes are used in contrast-enhanced T1-weighted MRI, it is critical to determine the efficiency with which the paramagnetic liposomes shorten the T1 relaxation time of water. This efficiency was conveniently expressed as the molar relaxivity, r1, in unit mM−1s−1, which was determined from the dependence of the measured T1 relaxation rate on the Gd concentration. Mulder et al23 prepared a pegylated paramagnetic and fluorescent immunoliposomes using the second type of liposomal MRI CA, incorporating Gd·DTPA·BSA into the lipid bilayer. The r1 value was 5.2 mM−1s−1 measured at 7.0 T at room temperature, higher than that of free of Gd·DTPA (4.5 mM−1s−1). Analogously, Kamaly et al2 designed a bimodal Gd-liposomes by introducing the paramagnetic lipid Gd·DOTA·DSA into the liposomal system, with the r1 value of 4.10 mM−1s−1±0.34 mM−1s−1 measured at 4.7 T, compared with the free Gd·DOTA with 3.8 mM−1s−1. The r1 values of NTLs and GTLs prepared in our study were higher than that of Gd·DTPA (Figure 2A, Table 2), which is in accordance with prior results in the literature. The results further confirmed the feasibility of increasing the relaxivity of MRI CAs by the second method described earlier.
In vitro studies showed high targeting efficiency of GTLs toward C6 cells with overexpressed TN-C (in this study, we used NTLs as a control). Confocal laser scanning microscopy is a qualitative method of evaluating the specific interaction between liposomes and cells. The results demonstrated that GBI-10 aptamer has the ability to target TN-C in C6 cells. In other words, GTLs can be guided to the membrane of tumor cells (as well as tumor neovasculature, where TN-C is overexpressed) when applied in vivo, leading to the differentiation of tumor cells with the normal cells. In addition, it is clear that green fluorescence cannot be observed inside the cells (Figures 3A and 4) showing that GTLs and NTLs actually bound with cell membranes rather than internalized by C6 cells. The latter result is because liposomes can only be combined by the acceptor ligand on the surface of the cells at 4°C instead of being internalized into cells. Physiological temperature (37°C) is required for cellular uptake/internalization, perhaps because internalization of liposomes is energy dependent.47 In addition, for normal NIH 3T3 cells, there was no specific binding of liposomes to cells due to the lack of TN-C. So, almost no green fluorescence was observed in Figure 3B. The incubation time at 4°C in this study was considered to be controlled within 3.5 hours (1.5 hours of staining procedure and 2 hours of incubation with liposomes) to ensure the activity of cells under low temperature. Quantitative results of the flow cytometry measurement (Figure 5) further demonstrated the TN-C specific interaction between liposomes and cells.
Promisingly, the results of MR imaging of cell pellets (Figure 6 and Table 3) further confirmed that GTLs were retained on the cell surface via TN-C binding and therefore enhanced the T1 signal intensity.25 These data showed that the level of association of GTLs is sufficient to be detected by MRI, demonstrating the cell-labeling efficiency of the novel Gd-loaded liposomes in vitro.2 While these in vitro results are satisfactory, it is important to demonstrate the efficacy of the approach in vivo for future clinical applications. For this purpose, chemical modification aiming GBI-10 will be carried out in our next work to improve the stability and affinity with TN-C at 37°C.
In this initial targeting study, rat glioma cell line C6 cells and mouse embryonic fibroblasts cell line NIH 3T3 cells were chosen as tumor and normal model cells, respectively. It was considered a limitation that the cell lines were from different species. More reasonable cell models should use the same cell line, that is to say, knocking down the expression of TN-C in C6 cells or overexpressing TN-C in NIH 3T3 cells might provide more convincing evidence.52,53
In summary, we have shown the novel Gd-loaded liposomes guided by GBI-10 aptamer can be used as highly sensitive and selective targeted CAs in vitro. Many initial studies using aptamers as delivery systems have produced exciting results as well.3,4,10–13,17–20 However, to realize the full potential of aptamer-targeted delivery systems, it is necessary to test for aptamers that are specific for clinically relevant cancer markers and demonstrate the effectiveness of the systems in vivo. Enormous progress has been made in the field in a very short period of time. Applications of these aptamer-nanomaterial based systems in clinical applications will be realized in the near future.54,55
Conclusion
In conclusion, we have demonstrated the preparation of GTLs as a targeted delivery system with both fluorophore labeling and MRI contrast on carrier. Confocal laser scanning microscopy, flow cytometry, as well as MRI results showed TN-C-specific binding of GTLs in TN-C-positive but not in TN-C-negative cells. Furthermore, by simply replacing the aptamers used in this study with other kinds of aptamers, the design can be applied to a variety of target cells with high efficiency and specificity, since DNA aptamer conjugation chemistry would be the same. Additionally, more reliable and straightforward approaches need to be developed in order to confirm the successful conjugation between the aptamers and liposomes. Although the exact mechanism for this process remains to be elucidated by further studies, the results strongly support that GTLs will be a promising targeted delivery system for diagnosis of tumor by MRI. However, before its application in vivo, the current liposomal system will require improvement for stability and affinity with TN-C at 37°C, possibly by isonucleoside modifications of GBI-10.56 Thus, while limitations must be considered, we expect that these explorations can also provide a new strategy for the development of nanomedicine for both diagnosis and therapy of tumor.
Acknowledgment
The authors gratefully acknowledge the financial support from the Natural Science Foundation of Beijing, People’s Republic of China (Grant No 7122101), and the Ministry of Science and Technology of China (Grant No 2012CB720604). The authors thank Dr Shirley Wang of Harvard University for her kind help in preparing the manuscript.
Disclosure
The authors report no conflicts of interest in this work.
References
Martins MB, Corvo ML, Marcelino P, Marinho HS, Feio G, Carvalho A. New long circulating magnetoliposomes as contrast agents for detection of ischemia-reperfusion injuries by MRI. Nanomedicine. 2014;10(1):207–214. | ||
Kamaly N, Kalber T, Ahmad A, et al. Bimodal paramagnetic and fluorescent liposomes for cellular and tumor magnetic resonance imaging. Bioconjug Chem. 2008;19(1):118–129. | ||
Xing H, Tang L, Yang X, et al. Selective delivery of an anticancer drug with aptamer-functionalized liposomes to breast cancer cells in vitro and in vivo. J Mater Chem B. 2013;1(39):5288–5297. | ||
Cao Z, Tong R, Mishra A, et al. Reversible cell-specific drug delivery with aptamer-functionalized liposomes. Angew Chem Int Ed. 2009;48(35):6494–6498. | ||
Zhao W, Ali MM, Brook MA, Li YF. Rolling circle amplification: applications in nanotechnology and biodetection with functional nucleic acids. Angew Chem Int Ed. 2008;47(34):6330–6337. | ||
Li D, Song S, Fan C. Target-responsive structural switching for nucleic acid-based sensors. Acc Chem Res. 2010;43(5):631–641. | ||
Oh SS, Plakos K, Lou X, Xiao Y, Soh HT. In vitro selection of structure-switching, self-reporting aptamers. Proc Natl Acad Sci U S A. 2010;107(32):14053–14058. | ||
Ray P, White RR. Aptamers for targeted drug delivery. Pharmaceuticals. 2010;3(6):1761–1778. | ||
Tuerk C, Gold L. Systematic evolution of ligands by exponential enrichment: RNA ligands to bacteriophage T4 DNA polymerase. Science. 1990;249(4968):505–510. | ||
Ara MN, Matsuda T, Hyodo M, et al. An aptamer ligand based liposomal nanocarrier system that targets tumor endothelial cells. Biomaterials. 2014;35(25):7110–7120. | ||
Li X, Yu Y, Ji Q, Qiu L. Targeted delivery of anticancer drugs by aptamer AS1411 mediated Pluronic F127/cyclodextrin-linked polymer composite micelles. Nanomedicine. 2014;11(1):175–184. | ||
Rangnekar A, Zhang AM, Li SS, et al. Increased anticoagulant activity of thrombin-binding DNA aptamers by nanoscale organization on DNA nanostructures. Nanomedicine. 2012;8(5):673–681. | ||
Sundaram P, Wower J, Byrne ME. A nanoscale drug delivery carrier using nucleic acid aptamers for extended release of therapeutic. Nanomedicine. 2012;8(7):1143–1151. | ||
Daniels DA, Chen H, Hicke BJ, Swiderek KM, Gold L. A tenascin-C aptamer identified by tumor cell SELEX: systematic evolution of ligands by exponential enrichment. Proc Natl Acad Sci U S A. 2003;100(26):15416–15421. | ||
Hicke BJ, Stephens AW, Gould T, et al. Tumor targeting by an aptamer. J Nucl Med. 2006;47(4):668–678. | ||
Alessi P, Ebbinghaus C, Neri D. Molecular targeting of angiogenesis. Biochim Biophys Acta. 2004;1654(1):39–49. | ||
Chen XC, Deng YL, Lin Y, et al. Quantum dot-labeled aptamer nanoprobes specifically targeting glioma cells. Nanotechnology. 2008;19(23):235105. | ||
Kang H, O’Donoghue MB, Liu H, Tan W. A liposome-based nanostructure for aptamer directed delivery. Chem Commun (Camb). 2010;46(2):249–251. | ||
Ko HY, Choi KJ, Lee CH, Kim S. A multimodal nanoparticle-based cancer imaging probe simultaneously targeting nucleolin, integrin αvβ3 and tenascin-C proteins. Biomaterials. 2011;32(4):1130–1138. | ||
Kang WJ, Chae JR, Cho YL, Lee JD, Kim S. Multiplex imaging of single tumor cells using quantum-dot-conjugated aptamers. Small. 2009;5(22):2519–2522. | ||
Li Y, Qiao H, Yan W, et al. Molecular recognition force spectroscopy study of the dynamic interaction between aptamer GBI-10 and extracellular matrix protein tenascin-C on human glioblastoma cell. J Mol Recognit. 2013;26(1):46–50. | ||
Shangguan D, Cao Z, Meng L, et al. Cell-specific aptamer probes for membrane protein elucidation in cancer cells. J Proteome Res. 2008;7(5):2133–2139. | ||
Mulder WJ, Strijkers GJ, Griffioen AW, et al. A liposomal system for contrast-enhanced magnetic resonance imaging of molecular targets. Bioconjug Chem. 2004;15(4):799–806. | ||
Kamaly N, Kalber T, Thanou M, Bell JD, Miller AD. Folate receptor targeted bimodal liposomes for tumor magnetic resonance imaging. Bioconjug Chem. 2009;20(4):648–655. | ||
Ding N, Lu Y, Lee RJ, et al. Folate receptor-targeted fluorescent paramagnetic bimodal liposomes for tumor imaging. Int J Nanomedicine. 2011;6:2513–2520. | ||
Kaneda Y. Virosomes: evolution of the liposome as a targeted drug delivery system. Adv Drug Deliv Rev. 2000;43(2–3):197–205. | ||
Maeda H, Wu J, Sawa T, Matsumura Y, Hori K. Tumor vascular permeability and the EPR effect in macromolecular therapeutics: a review. J Control Release. 2000;65(1–2):271–284. | ||
Wagner A, Platzgummer M, Kreismayr G, et al. GMP production of liposomes-a new industrial approach. J Liposome Res. 2006;16(3):311–319. | ||
Wang Z, Yu Y, Dai W, et al. A specific peptide ligand-modified lipid nanoparticle carrier for the inhibition of tumor metastasis growth. Biomaterials. 2013;34(3):756–764. | ||
Willis MC, Collins BD, Zhang T, et al. Liposome-anchored vascular endothelial growth factor aptamers. Bioconjug Chem. 1998;9(5):573–582. | ||
Alvarez-Dolado M, González-Sancho JM, Bernal J, Muñoz A. Developmental expression of tenascin-C is altered by hypothyroidism in the rat brain. Neuroscience. 1998;84(1):309–322. | ||
Scholze A, Götz B, Faissner A. Glial cell interactions with tenascin-C: adhesion and repulsion to different tenascin-C domains is cell type related. Int J Dev Neurosci. 1996;14(3):315–329. | ||
Ekblom M, Fässler R, Tomasini-Johansson B, Nilsson K, Ekblom P. Downregulation of tenascin expression by glucocorticoids in bone marrow stromal cells and in fibroblasts. J Cell Biol. 1993;123(4):1037–1045. | ||
Kimpe K, Parac-Vogt TN, Laurent S, et al. Potential MRI contrast agents based on micellar incorporation of amphiphilic bis(alkylamide) derivatives of [(Gd-DTPA)(H2O)]2−. Eur J Inorg Chem. 2003;2003(16):3021–3027. | ||
Wu Y, Sefah K, Liu H, Wang R, Tan W. DNA aptamer-micelle as an efficient detection/delivery vehicle toward cancer cells. Proc Natl Acad Sci U S A. 2010;107(1):5–10. | ||
Kok MB, Hak S, Mulder WJ, van der Schaft DW, Strijkers GJ, Nicolay K. Cellular compartmentalization of internalized paramagnetic liposomes strongly influences both T1 and T2 relaxivity. Magn Reson Med. 2009;61(5):1022–1032. | ||
Luo LM, Huang Y, Zhao BX, et al. Anti-tumor and anti-angiogenic effect of metronomic cyclic NGR-modified liposomes containing paclitaxel. Biomaterials. 2013;34(4):1102–1114. | ||
Wei M, Xu Y, Zou Q, et al. Hepatocellular carcinoma targeting effect of PEGylated liposomes modified with lactoferrin. Eur J Pharm Sci. 2012;46(3):131–141. | ||
Chen KJ, Wolahan SM, Wang H, et al. A small MRI contrast agent library of gadolinium(III)-encapsulated supramolecular nanoparticles for improved relaxivity and sensitivity. Biomaterials. 2011;32(8):2160–2165. | ||
Mi P, Kokuryo D, Cabral H, et al. Hydrothermally synthesized PEGylated calcium phosphate nanoparticles incorporating Gd-DTPA for contrast enhanced MRI diagnosis of solid tumors. J Control Release. 2014;174:63–71. | ||
Sato T, Ito K, Tamada T, et al. Tissue gadolinium deposition in renally impaired rats exposed to different gadolinium-based MRI contrast agents: evaluation with inductively coupled plasma mass spectrometry (ICP-MS). Magn Reson Imaging. 2013;31(8):1412–1417. | ||
Yang CT, Chandrasekharan P, He T, et al. An intravascular MRI contrast agent based on Gd(DO3A-Lys) for tumor angiography. Biomaterials. 2014;35(1):327–336. | ||
van Tilborg GA, Mulder WJ, van der Schaft DW, et al. Improved magnetic resonance molecular imaging of tumor angiogenesis by avidin-induced clearance of nonbound bimodal liposomes. Neoplasia. 2008;10(12):1459–1469. | ||
Gullotti E, Yeo Y. Extracellularly activated nanocarriers: a new paradigm of tumor targeted drug delivery. Mol Pharm. 2009;6(4):1041–1051. | ||
Song CK, Jung SH, Kim DD, Jeong KS, Shin BC, Seong H. Disaccharide modified liposomes and their in vitro intracellular uptake. Int J Pharm. 2009;380(1–2):161–169. | ||
Xiao N, Gu W, Wang H, Deng Y, Shi X, Ye L. T1-T2 dual-modal MRI of brain gliomas using PEGylated Gd-doped iron oxide nanoparticles. J Colloid Interface Sci. 2014;417:159–165. | ||
Kamps JA, Scherphof GL. Liposomes in biosystem. In: Torchilin VP, Weissig V, editors. Liposomes: A Practical Approach. 2nd ed. Beijing: Chemical Industry Press; 2007:211–212. | ||
Guo J, Gao X, Su L, et al. Aptamer-functionalized PEG-PLGA nanoparticles for enhanced anti-glioma drug delivery. Biomaterials. 2011;32(31):8010–8020. | ||
Li L, Hou J, Liu X, et al. Nucleolin-targeting liposomes guided by aptamer AS1411 for the delivery of siRNA for the treatment of malignant melanomas. Biomaterials. 2014;35(12):3840–3850. | ||
Mulder WJ, Strijkers GJ, van Tilborg GA, Griffioen AW, Nicolay K. Lipid-based nanoparticles for contrast-enhanced MRI and molecular imaging. NMR Biomed. 2006;19(1):142–164. | ||
Kamaly N, Miller AD. Paramagnetic liposome nanoparticles for cellular and tumour imaging. Int J Mol Sci. 2010;11(4):1759–1776. | ||
Liu X, Shi H, Liu B, Li J, Liu Y, Yu B. miR-330-3p controls cell proliferation by targeting early growth response 2 in non-small-cell lung cancer. Acta Biochim Biophys Sin (Shanghai). 2015;47(6):431–440. | ||
Hoa NT, Ge L, Erickson KL, et al. Fascin-1 knock-down of human glioma cells reduces their microvilli/filopodia while improving their susceptibility to lymphocyte-mediated cytotoxicity. Am J Transl Res. 2015;7(2):271–284. | ||
Lee JH, Yigit MV, Mazumdar D, Lu Y. Molecular diagnostic and drug delivery agents based on aptamer-nanomaterial conjugates. Adv Drug Deliv Rev. 2010;62(6):592–605. | ||
Li X, Zhao Q, Qiu L. Smart ligand: aptamer-mediated targeted delivery of chemotherapeutic drugs and siRNA for cancer therapy. J Control Release. 2013;171(2):152–162. | ||
Cai B, Yang X, Sun L, et al. Stability and bioactivity of thrombin binding aptamers modified with D-/L-isothymidine in the loop regions. Org Biomol Chem. 2014;12(44):8866–8876. |
Supplementary materials
Our research design was based on the schematic illustrations shown Figures S1–S3.
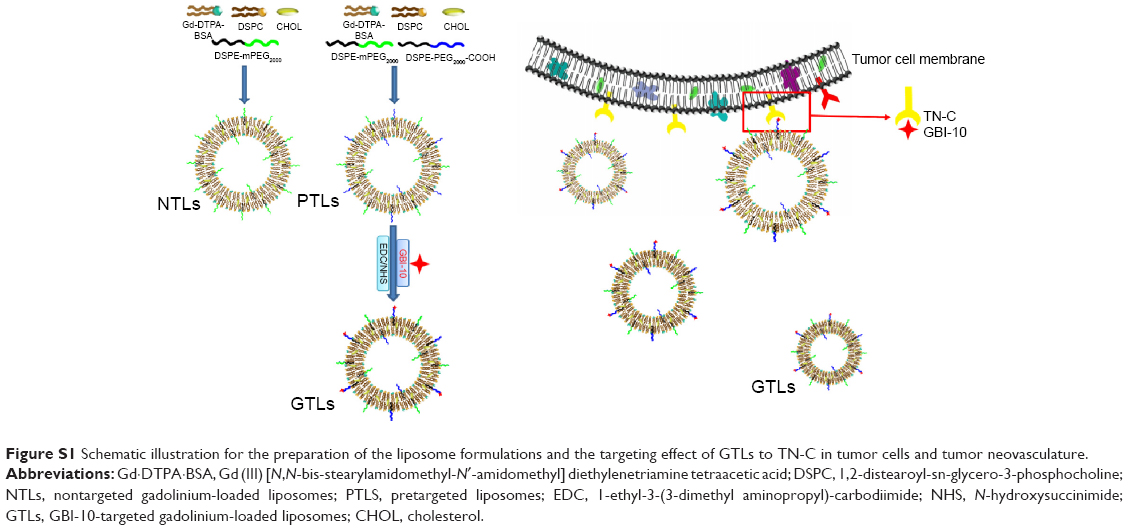 | Figure S1 Schematic illustration for the preparation of the liposome formulations and the targeting effect of GTLs to TN-C in tumor cells and tumor neovasculature. |
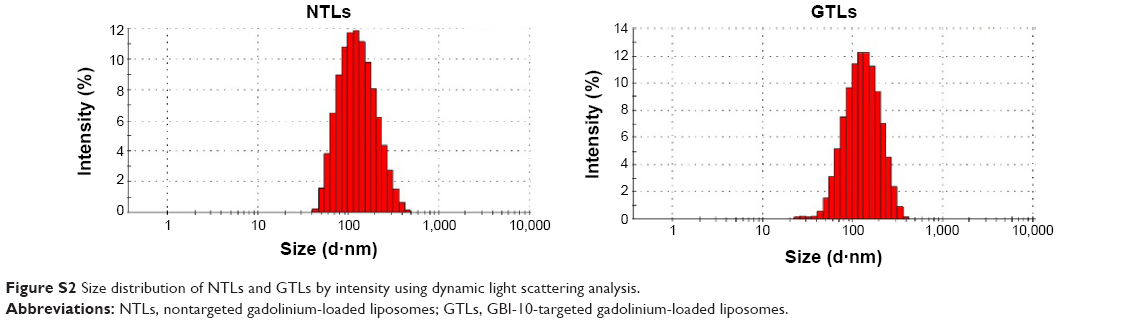 | Figure S2 Size distribution of NTLs and GTLs by intensity using dynamic light scattering analysis. |
 | Figure S3 Photography of cell pellets used in the MR imaging assay. |
Synthesis of DTPA·BA
DTPA (2 g, 5 mmol), acetic anhydride (6 mL, 63.5 mmol), and pyridine (10 mL, 124.2 mmol) were placed in a 100 mL flask equipped with a condenser and a magnetic stirrer. The reaction was carried out at reflux for 4 hours. The resulting anhydride was filtered and washed thoroughly with acetic anhydride, CH3CH2OH, and dry diethyl ether. After drying under vacuum, the solid turned to cream-colored powder, 1.64 g. (Figure S4, compound DTPA·BA, yield: 90%).
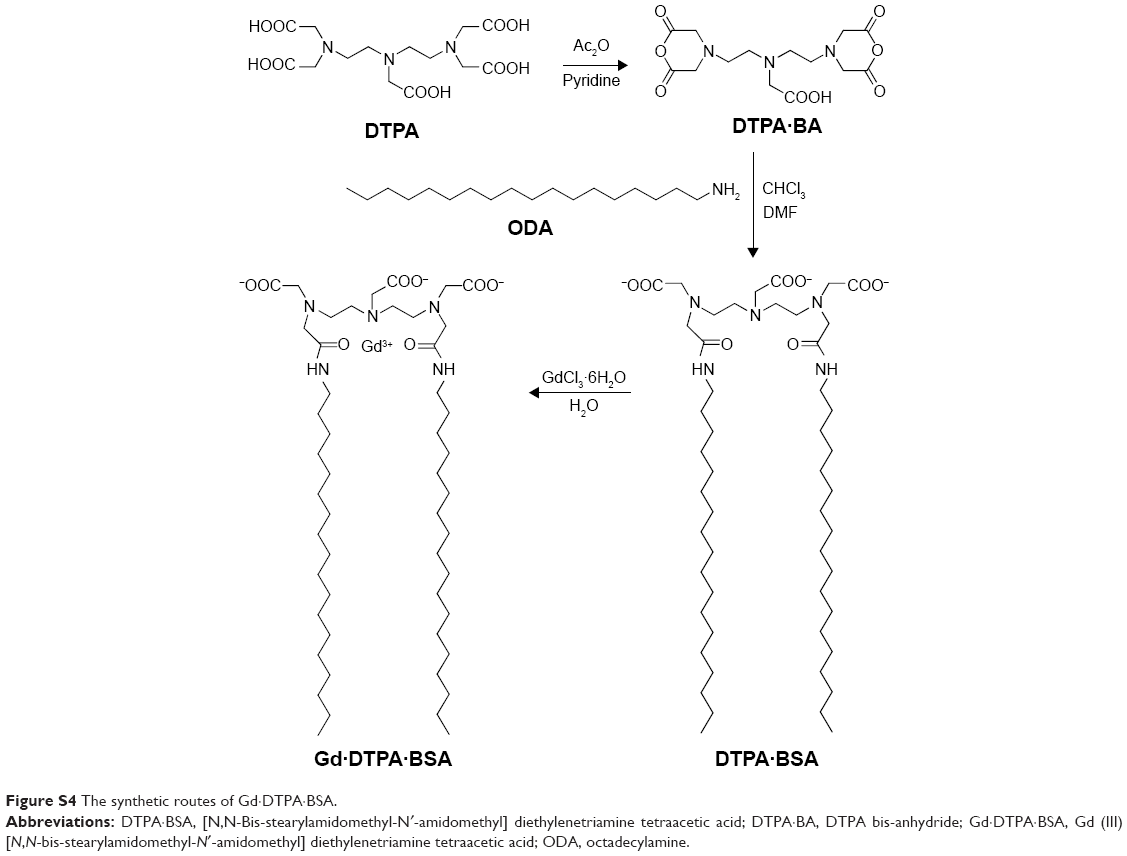 | Figure S4 The synthetic routes of Gd·DTPA·BSA. |
1H NMR (400 MHz, DMSO-d6): δ (ppm) 12.15 (s, COOH), 3.7 (s, 8H, 2× –CH2COOCOCH2–); 3.30 (s, 2H, –NCH2COOH); 2.74 (t, J=6.65 Hz, 4H, 2× HOOCCH2NCH2CH2–); 2.58 (t, J= 6.65 Hz, 4H, 2× HOOCCH2NCH2CH2–). 13C NMR (101 MHz, DMSO-d6): δ (ppm) 172.95 (COOH); 166.27 (–COOCO–); 55.05 (NCH2COOH); 53.08 (–CH2COOCOCH2–); 52.18 (HOOCCH2NCH2CH2–); 51.19 (HOOCCH2NCH2CH2–).
Synthesis of DTPA·BSA
A solution of octadecylamine (1.5 g, 5.57 mmol) dissolved in chloroform (300 mL) was added to a solution of DTPA BA (1 g, 0.560 mmol) previously dissolved in DMF (100 mL). The reaction was stirred at 40°C for 2 hours. The white precipitate formed was collected by filtration and washed with acetone and dried under vacuum overnight. The white solid was stirred in water at 80°C for 3 hours to dissolve any excess DTPA. The insoluble residue was filtered and dried under vacuum overnight. The white solid was then washed with boiling chloroform and stirred in chloroform for 2 hours and then filtered and dried 1 g. (Figure S4, compound DTPA·BSA, 40% yield).
1H NMR (400 MHz, CF3-COOD at δ=11.50 ppm): δ (ppm) 4.38~3.90 (m, 14H, 3× HOOCCH2N–, 2× –NH2CONH–, 2× NCH2CH2N); 3.60 (s, 4H, 2× NCH2CH2N); 3.24~3.22 (d, 4H, J=8.0, 2× NHCH2); 1.46 (s, 4H, 2× NHCH2CH2); 1.18 (s, 60H, 30× CH2 alkyl chain); 0.73~0.75 (d, 6H, J=8.0, 2× CH2CH3). 13C NMR (101 MHz, CF3-COOD at δ: 160.4~161.70 and 109.35~117.80 ppm): δ (ppm) 168.44 (CH2COOH); 164.04 (NCH2CONHCH2CH2); 56.4 (HOOCCH2–); 55.0 (NCH2 CONH–); 53.1 (NCH2CH2NCH2CO– OH)CH2CH2N); 42.5 (NCH2CH2N(CH2COOH)CH2CH2N); 40.44 (NHCH2CH2–); 30.84 (–CH2CH2 CH3); 28.56 (chain CH2’s); 25.63 (NHCH2CH2CH2); 21.39 (–CH2CH3); 11.74 (CH3). HRMS (MALDI+) calculated for C50H94N5O8 m/z 895.7119, found 896.6882 (M+H)+.
Synthesis of Gd·DTPA·BSA
A solution of GdCl3·6H2O (241 mg, 0.65 mmol) dissolved in water (5 mL) was added dropwise to a solution of DTPA·BSA (100 mg, 0.11 mmol) previously dissolved in water (100 mL). The reaction was stirred at 90°C for 3 hours (pH dropped to 3.5). The water was freeze-dried to yield a white powder 105 mg. (Figure S4, compound Gd·DTPA·BSA, 89% yield).
HRMS (MALDI+) calculated for C50H94GdN5O8 m/z 1,050.6343, found 1,073.5421 (M+Na)+, 1,089.5105 (M+K)+.
Synthesis of 6-(trifluoroacetamido)-1-hexanol
A solution of 1-amino-6-hexanol (2 g, 17.0 mmol) in 1-amino-6-hexanol in dichloromethane (50 mL) was slowly added to CF3COOEt (4.2 mL, 34.9 mmol). The reaction mixture was stirred for 8 hours at room temperature. Purification was achieved by flash chromatography over silica gel using a mixture of CH2Cl2-MeOH (30:1) as eluent to afford a white powder 3.2 g. (Figure 1, compound 6-(trifluoroacetamido)-1-hexanol, 88% yield).
1H NMR (400 MHz, DMSO-d6): δ (ppm) 9.36 (s, 1H, CONH); 4.33~4.30 (t, 1H, J=4, –CH2OH); 3.38~3.33 (m, 2H, –CH2OH); 3.18~3.13 (m, 2H, CONHCH2–); 1.50~1.23 (m, 8H, –NHCH2CH2 CH2CH2CH2CH2OH). 13C NMR (101 MHz, DMSO-d6): δ (ppm) 156.7 (–CONH–); 117.89 (–CF3); 61.06 (–CH2OH); 39.34 (–CONHCH2–); 32.84 (–CH2CH2OH); 28.72 (–CONHCH2CH2–); 26.52 (–CONHCH2– CH2CH2–); 25.55 (–CH2CH2CH2OH). HRMS (ESI−) calcd for C8H14F3NO2 m/z 213.0977, found 212.0902 (M-H)−.
Synthesis of spacer amino phosphoramidite
6-(trifluoroacetamido)-1-hexanol (300 mg, 1.41 mmol) and 1H-tetrazole (296 mg, 4.23 mmol) was dissolved in anhydrous CH2Cl2 (25 mL). The solution was cooled on an ice bath, and 2-cyanoethoxy-N′, N′, N, N-tetraisopropyl-phosphoramidite (1.42 mL, 4.23 mmol) was added under dry nitrogen. After stirring at room temperature for 2 hours, the solution was washed with 5% NaHCO3 and brine, dried over Na2SO4, and concentrated by vacuum. Purification was achieved by flash chromatography over silica gel using a mixture of CH2Cl2-EtOAc (10:1) as eluent to afford a colorless oil 500 mg. (Figure 1, compound spacer amino phosphoramidite, 86% yield).
1H NMR (400 MHz, DMSO-d6): δ (ppm) 9.37 (s, 1H, –CONH–); 3.75~3.51 (m, 6H, 2× –POCH2–, 2× –CH(CH3)2); 3.19~3.14 (m, 2H, –NHCH2–); 2.77~2.74 (t, 2H, J=4, CNCH2–); 1.56~1.26 (m, 8H, –NHCH2(CH2)4–); 1.18~1.12 (m, 12H, 2× –CH(CH3)2); 13C NMR (101 MHz, DMSO-d6): δ (ppm) 156.78 (CONH–); 120.49 (NCCH2–); 120.33 (CF3–); 62.79 (POCH2CH2–); 45.44 (POCH2CH2CN); 40.61 (–CH(CH3)2); 30.22 (–CONHCH2–); 28.57 (–POCH2CH2–); 26.13 (–NHCH2CH2–); 25.12 (–NHCH2CH2– CH2–); 23.66 (–NHCH2CH2CH2CH2–); 22.49 (–CH(CH3)2); 11.35 (NCCH2–). 31P NMR (162 MHz, DMSO-d6): δ (ppm) 146.33.
Synthesis of amino-modified GBI-10 aptamer
Amino-modified GBI-10 aptamer (Figure 1) was synthesized on ABI 394 automated RNA/DNA synthesizer (Thermo Fisher Scientific, Waltham, MA, USA). The products were purified by C18 reverse high-performance liquid chromatography (XBridgeTM OST C18, 2.5 μm, 10 mm ×50 mm) using a linear gradient of 5%→20% eluent A in 35 minutes (Figure S5). Solutions of 0.1 M Et3N-H2CO3 in water, pH =7.7, were used as eluent B, and CH3CN was used as eluent A. The oligonucleotide solutions were desalted by Sephadex G25 column. The oligonucleotide compositions were confirmed by matrix-assisted laser desorption/ionization time of flight mass spectrometry (MALDI-TOF-MS) (Figure S6).
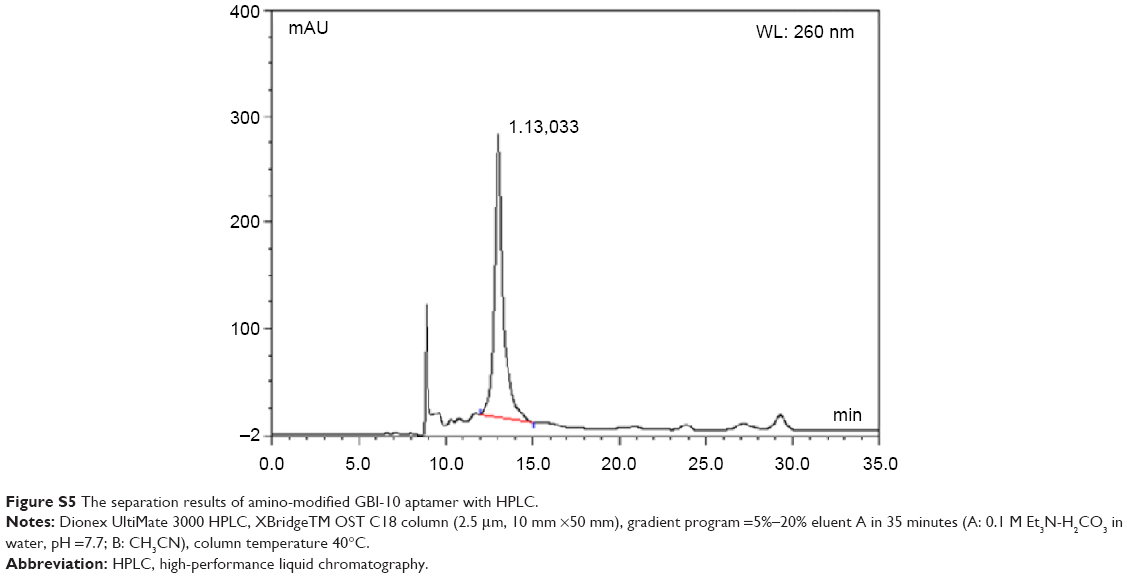 | Figure S5 The separation results of amino-modified GBI-10 aptamer with HPLC. |
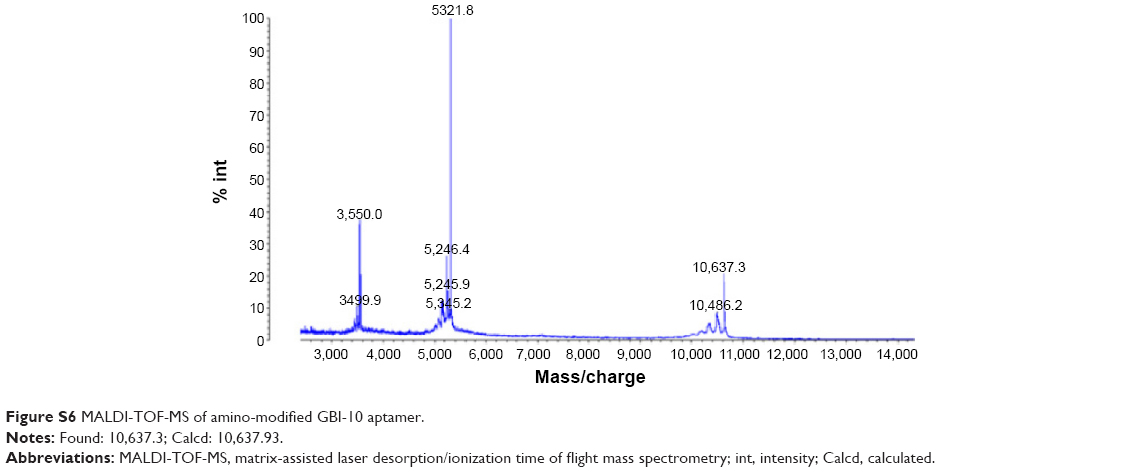 | Figure S6 MALDI-TOF-MS of amino-modified GBI-10 aptamer. |
 © 2015 The Author(s). This work is published and licensed by Dove Medical Press Limited. The
full terms of this license are available at https://www.dovepress.com/terms.php
and incorporate the Creative Commons Attribution
- Non Commercial (unported, v3.0) License.
By accessing the work you hereby accept the Terms. Non-commercial uses of the work are permitted
without any further permission from Dove Medical Press Limited, provided the work is properly
attributed. For permission for commercial use of this work, please see paragraphs 4.2 and 5 of our Terms.
© 2015 The Author(s). This work is published and licensed by Dove Medical Press Limited. The
full terms of this license are available at https://www.dovepress.com/terms.php
and incorporate the Creative Commons Attribution
- Non Commercial (unported, v3.0) License.
By accessing the work you hereby accept the Terms. Non-commercial uses of the work are permitted
without any further permission from Dove Medical Press Limited, provided the work is properly
attributed. For permission for commercial use of this work, please see paragraphs 4.2 and 5 of our Terms.