Back to Journals » International Journal of Nanomedicine » Volume 17
In vitro Development of Controlled-Release Nanoniosomes for Improved Delivery and Anticancer Activity of Letrozole for Breast Cancer Treatment
Authors Ahmadi S, Seraj M, Chiani M ![]() , Hosseini S
, Hosseini S ![]() , Bazzazan S, Akbarzadeh I, Saffar S, Mostafavi E
, Bazzazan S, Akbarzadeh I, Saffar S, Mostafavi E ![]()
Received 8 August 2022
Accepted for publication 21 November 2022
Published 11 December 2022 Volume 2022:17 Pages 6233—6255
DOI https://doi.org/10.2147/IJN.S384085
Checked for plagiarism Yes
Review by Single anonymous peer review
Peer reviewer comments 2
Editor who approved publication: Professor Lei Yang
Saeedeh Ahmadi,1 Mahmoud Seraj,2 Mohsen Chiani,1 Seyedayin Hosseini,3 Saba Bazzazan,4 Iman Akbarzadeh,1 Samaneh Saffar,4 Ebrahim Mostafavi5,6
1Department of Nano Biotechnology, New Technology Research Group, Pasteur Institute of Iran, Tehran, Iran; 2Integrative Research Laboratory, Islamic Azad University of Medical Sciences, Tehran, Iran; 3School of Medicine, Sh Beheshti University of Medical Sciences, Tehran, Iran; 4Core Facility Lab, Pasteur Institute of Iran, Tehran, Iran; 5Stanford Cardiovascular Institute, Stanford University School of Medicine, Stanford, CA, 94305, USA; 6Department of Medicine, Stanford University School of Medicine, Stanford, CA, 94305, USA
Correspondence: Ebrahim Mostafavi, Email [email protected], [email protected]; Mohsen Chiani, Email [email protected]
Introduction: Breast cancer is among the most prevalent mortal cancers in women worldwide. In the present study, an optimum formulation of letrozole, letrozole-loaded niosome, and empty niosome was developed, and the anticancer effect was assessed in in vitro MCF-7, MCF10A and MDA-MB-231 breast cancer cell lines.
Materials and Methods: Various niosomal formulations of letrozole were fabricated through thin-film hydration method and characterized in terms of size, polydispersity index (PDI), morphology, entrapment efficiency (EE%), release kinetics, and stability. Optimized niosomal formulation of letrozole was achieved by response surface methodology (RSM). Antiproliferative activity and the mechanism were assessed by MTT assay, quantitative real-time PCR, and flow cytometry. Furthermore, cellular uptake of optimum formulation was evaluated by confocal electron microscopy.
Results: The formulated letrozole had a spherical shape and showed a slow-release profile of the drug after 72 h. The size, PDI, and eEE% of nanoparticles showed higher stability at 4°C compared with 25°C. The drug release from niosomes was in accordance with Korsmeyer–Peppa’s kinetic model. Confocal microscopy revealed the localization of drug-loaded niosomes in the cancer cells. MTT assay revealed that all samples exhibited dose-dependent cytotoxicity against breast cancer cells. The IC50 of mixed formulation of letrozole with letrozole-loaded niosome (L + L3) is the lowest value among all prepared formulations. L+L3 influenced the gene expression in the tested breast cancer cell lines by down-regulating the expression of Bcl 2 gene while up-regulating the expression of p53 and Bax genes. The flow cytometry results revealed that L + L3 enhanced the apoptosis rate in both MCF-7 and MDA-MB-231 cell lines compared with the letrozole (L), letrozole-loaded niosome (L3), and control sample.
Conclusion: Results indicated that niosomes could be a promising drug carrier for the delivery of letrozole to breast cancer cells.
Keywords: breast cancer, niosome, letrozole, drug delivery system, anticancer
Graphical Abstract:

Introduction
Over the past decade a surge of breast cancer incidence was observed among the female population.1,2 Most breast cancers are hormone-dependent and estrogen is a mediator hormone in progression and metastasis of tumor cells.3,4 Letrozole, as an oral non-steroidal aromatase, decreases estrogen levels by binding to heme ion of cytochrome P-450 that converts testosterone into small amounts of estrogen in postmenopausal women; it does not stop estrogen production in the ovaries. By declining the amount of estrogen, the growth of hormone-receptor-positive breast cancer cells decreased.5–7 However, clinical application of letrozole is limited owing to poor solubility and drug resistance, different systemic side effects such as headache, breast tenderness, short half-life, bone fractures, arthralgia, hypercholesterolemia, and carcinogenic failure.8 Accordingly, the recommended dose of letrozole is 2.5 mg/day for postmenopausal women with advanced breast cancer previously treated with antiestrogens.9,10 Development of targeted drug delivery systems (DDSs) has received extensive attention.12,13,14,15 The combination of medicine and nanotechnology has modified multifunctional nanocarriers that can be loaded with different drugs.15–18 Nanoparticle-based DDSs, such as liposomes, nanotubes,19–21 metallic nanoparticles,22,23 metal-organic frameworks,24,25 mesoporous silica nanoparticles,26 are promising carriers for targeted delivery due to their high surface area to mass ratio and high interaction which lead them to carry drug molecules efficiently rather than free drug molecules in solution. Moreover, these particles transfer their loaded active drug into cancer cells by selectively using tumors’ peculiar stimuli.11,27 Functional nanoparticles and photosensitizers have been encapsulated to maintain their appropriate concentration in the tumor section.28 Chitosan/polyaniline/laponite hydrogels showed a high biocompatibility and the cell viability which provide a new reference for the tumor therapy and tissue regeneration.29 Polydopamine decorated mesoporous silica nanoparticles showed a significant heat to kill colorectal cancer cells.30
Niosomes as nonionic surfactants have been widely studied due to their advantages including biodegradability, biocompatibility, low immunogenicity, long shelf life, high stability, and allow drug delivery to the target site at a controlled release rate.31–33 Aqueous solubility and oral bioavailability of niosomal Candesartan cilexetil, a commercially marketed compound with low bioavailability (15%), was significantly enhanced.34 In a study, PEGylated niosomal vincristine showed potent in vitro toxicity in B-cell lymphoma cancer cells.35 Anticancer analysis of PEGylated niosomal formulation of artemisinin against MCF-7 cell lines showed a substitutional cytotoxicity effect for niosomal artemisinin compared with the free drug solution.36 Furthermore, Melittin-loaded niosome revealed a significant higher apoptosis rate and inhibited cell migration, invasion in cancer cell lines compared with the free melittin samples.37
In this paper, attempts are made to indicate the efficacy of niosomal letrozole on breast tumor cells. The letrozole-loaded niosome formulations were optimized and physicochemically characterized in terms of mean particle size, zeta potential, drug entrapment efficacy, in vitro drug release, and stability. Furthermore, the cytotoxic effects of letrozole-loaded niosomes against MCF7-7, MDA-MB-231, and MCF10A healthy cell lines as control were evaluated by MTT assay. Real-time PCR, flow cytometry, and cell cycle analysis were used to determine the expression rate of apoptosis-related genes (p53, Bcl2, and Bax). Moreover, cellular uptake of optimum Letrozole-loaded niosome to cancer cells was investigated by confocal electron microscopy.
Materials and Methods
Materials
Letrozole was kindly donated by Tofigh Daru (Tehran, Iran). Sorbitan monolaurate (Span20, Cat# S6635), Sorbitan monostearate (Span60, Cat# S7710), Sorbitan monooleate (Span80, Cat# S6760), Cholesterol (CHOL, Cat# C8667), dicetylphosphate (DCP, Cat# 850042P), Sodium dodecyl sulfate (SDS, Cat# L3771) and dialysis membrane (MWCO 12kDa, Cat# D6191), Nile red and Coumarin 6 were obtained from Sigma Aldrich (USA). Dimethyl sulfoxide (DMSO, Cat# 109678), chloroform (Cat# 107024), Amicon (Ultra-15-Membrane, MWCO 30kDa, Cat# C82301) were purchased from Merck (Germany). Trypsin-EDTA (Cat# 15400054), Trypan blue (Cat# 15250061), RPMI-1640 culture medium, DMEM (Dulbecco’s Modified Eagle culture medium, Cat# 11965092), phosphate-buffered saline (PBS, Cat# 10010049), fetal bovine serum (FBS, Cat# 16000044), MTT (3-(4,5-Dimethylthiazol-2-yl)-2,5-Diphenyltetrazolium Bromide) (Cat# M6494) and penicillin/streptomycin (PS, Cat# 10378016) 100 X were purchased from Gibco (USA). The MDA-MB-231, MCF-7, and MCF10A cell lines were obtained from Pasteur Cell Bank (Iran). The Annexin V-FITC flow cytometric kit was obtained from Affymetrix Biosciences (USA). RNA extraction and cDNA synthesis kits were purchased from Transgene Biotech, China (Cat#. ER101-01 and AE301-02).
Preparation of Letrozole-Loaded Niosomes
Letrozole-loaded niosomes were formulated by the thin-film hydration method.15,38 The lipid:drug mixture was prepared in different molar ratios of 10:1 and 20:1. Surfactant (either Span20, 60 or 80): CHOL:DCP (as a negative charge inducing agent) ratio was kept 2:1:0.05 in all batches. The mixture was dissolved in 10 mL chloroform. The organic phase was evaporated under reduced pressure using a rotary evaporator (Heidolph, Germany) at 60°C for 30 min. The dried film was hydrated in 10 mL of PBS for 30 min at 60°C and rotation at 120 rpm. Finally, the solution was sonicated for 5 min by Hielscher up to 50 Ultrasonic processor, Germany. Different niosomal formulations of letrozole are presented in Table 1.
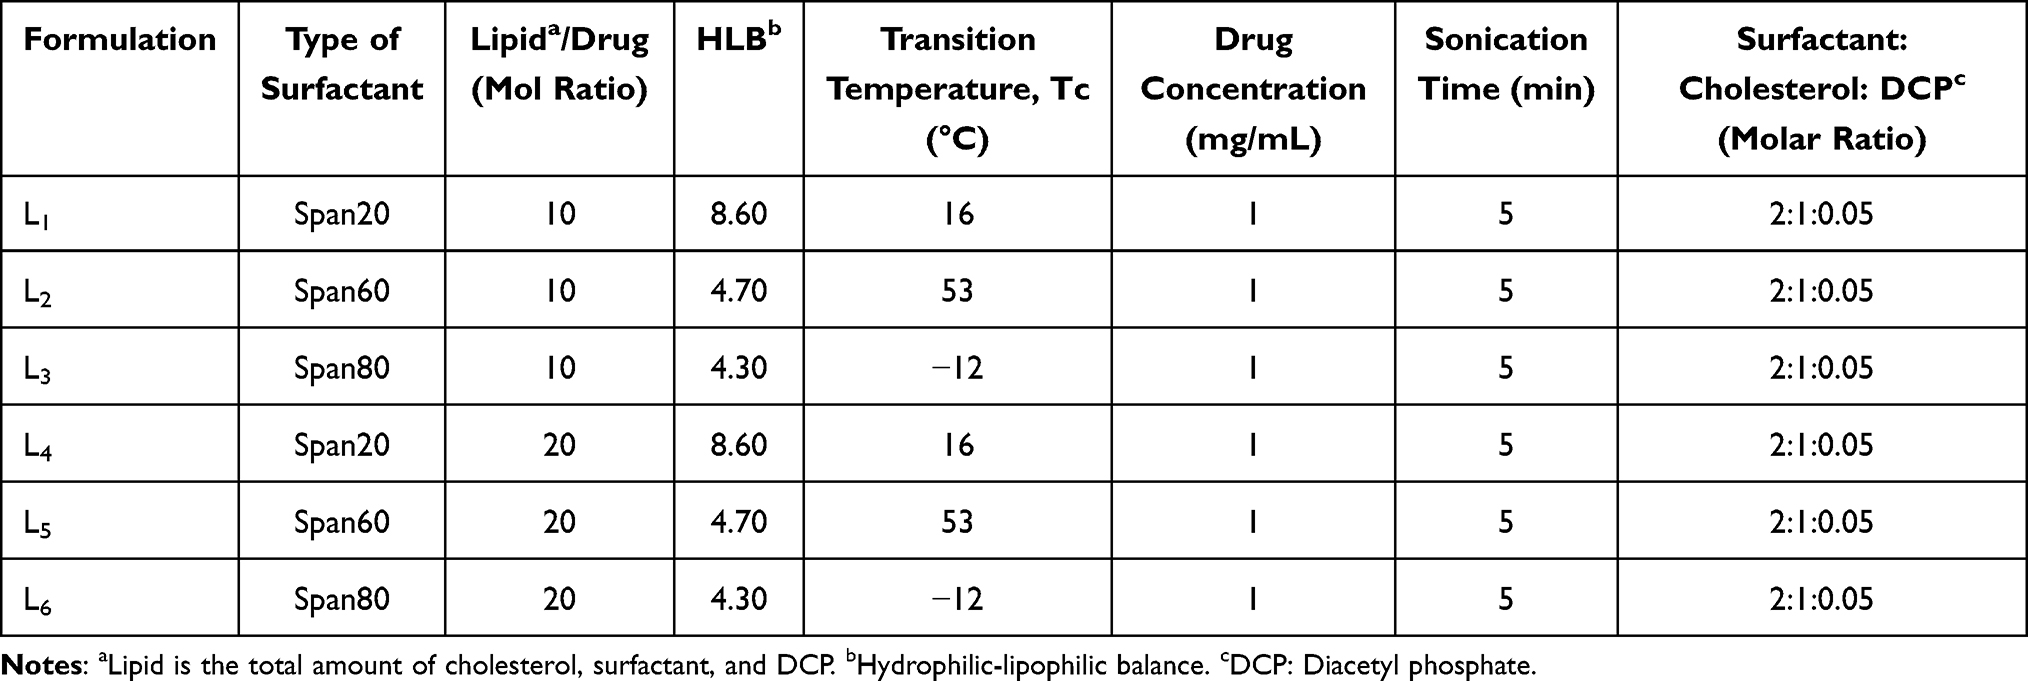 |
Table 1 Different Niosomal Formulations for Encapsulation of Letrozole (L1-L6) |
Characterization
The mean particle size, PDI and zeta potential of the niosomes were determined by the Zeta-sizer instrument at a wavelength of 25°C and 633 nm (Nano ZS3600, Malvern Instruments Ltd, UK) which was based on dynamic light scattering. The surface morphology of the optimized formulation was visualized by SEM (scanning electron microscopy), TEM (transmission electron microscopy), and AFM (atomic force microscopy). For SEM, the letrozole loaded niosomes suspension was diluted with deionized water and a drop of that was placed on a silicon wafer and dried completely overnight in a desiccator. Then a thin gold layer was sputtered on the samples, and they were studied under a field emission scanning electron microscope (NOVA NANOSEM 450 FEI, USA). TEM analysis was performed by placing a drop of letrozole loaded niosomes on carbon-coated-300-mesh copper grids, the excess sample was removed after 2 min by a filter paper. Samples were eluted by distilled water and stained by 2% Uranyl acetate. Final analysis was performed at 80 kV on a field emission TEM (TENAI G2 F20, USA). AFM samples were prepared by placing 5 μL of diluted niosomes on 1 cm2 glass slides and left to dry at room temperature. Prepared samples were visualized with a Nanowizard II atomic force microscope (JPK Instruments, Berlin, Germany) with a low-stress silicon nitride cantilevers (AppNano, USA) using AC mode at 66k Hz scan.37,39
Fourier-Transform Infrared Spectroscopy (FTIR)
To study the interaction between different ingredients, we performed FTIR (Fourier transform infrared spectroscopy) by enjoying Spectrum Two, PerkinElmer, USA, and KBr disc method. Samples were scanned over the range of 4000 to 400 cm−1. Infrared spectroscopic studies were done for letrozole, Span80, cholesterol, DCP, letrozole loaded niosomes and empty niosome. Sample scanning was carefully conducted by using the PerkinElmer Spectrum software (Model 1600, Massachusetts, USA).
Differential Scanning Calorimetry (DSC) Measurements
Pure letrozole, letrozole-loaded niosomes, and empty niosome samples were also analyzed by differential scanning calorimetric method (TA, Q600, USA). To do this, 3 mg of each sample was sealed thematically in aluminum pans (scan range temperature was from 20 to 300°C with 5°C/min scan rate). The study was operated under nitrogen as the purge gas.
Powder X-Ray Diffractometry (XRD) Analysis
X-ray diffraction (XRD) studies was performed by X’ Pert Pro MPD, Panalytical, the Netherlands. In this regard, letrozole, letrozole-loaded niosomes and empty niosome were taken into plane glasses. Small-angle XRD was acquired using an X-ray super-speed diffractometer with a Ni filter and Cu radiation (λ = 0.542 nm), tube voltage 25–45 kV and tube current 100–200 mA, and scanned from 2° to 80°, 2θ.
Entrapment Efficiency (EE %)
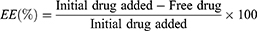
Entrapment efficiency was calculated by measuring concentration of non-entrapped letrozole. In this regard, the free drug was separated from niosomal dispersion by Ultracel-30K Millipore filters with a molecular weight cut-off (MWCO) of 30,000 Da. The inner chamber of the cell was filled by 500 μL of formulation and the assembly was centrifuged for 20 min at 4000×g in 4°C by cooling centrifuge (Eppendorf® 580R centrifuge, Germany). The amount of free drug in the outer chamber of the device was determined by UV-visible spectrophotometry at 240 nm (JASCO, V-530, Japan). The encapsulation efficiency (EE) and loading efficiency (LE) was calculated by the following equations.
In vitro Release Study and Kinetic Model
The in vitro release of drugs from letrozole-loaded niosomes was studied using the dialysis diffusion method (molecular weight 12 KDa). In this regard, 2 mL of the niosomal suspension were placed into a dialysis bag, sealed, and immersed into 50 mL of PBS-SDS (pH 6.8, 37°C) as release or receiver medium and placed on a magnetic stirrer at 300 rpm. Samples were taken from the buffer compartment at predetermined time intervals and replaced by fresh PBS-SDS. The optical density of each batch was determined by UV spectrophotometer at wavelength of 240 nm and the amount of released drug was estimated by standard curve equation. The cumulative release was then plotted against the time. The kinetic of release was analyzed by the Higuchi, Korsmeyer–Peppas, zero-order and first-order models. To illustrate, the Higuchi model is cumulative % drug release vs square root of time, the Korsmeyer–Peppa model is log cumulative % drug release vs log time, zero-order model is cumulative % drug release vs time and the first-order model is cumulative % drug remaining vs time. In order to calculate the linear curve, the correlation coefficient (r) values obtained by regression of the plots derived from the aforementioned models were used. The Higuchi model describes the drug release by diffusion. Korsmeyer–Peppa model describes and analyzes the drug release from a polymeric nanoparticle dosage form such as hydrogel, or when release follows several kinetic mechanisms or combination of the diffusion Fickian transport and non-Fickian transport. The zero-order model is dependent on drug dissolution, which describes the system where the drug release rate is independent of the concentration. The first-order rate equation describes the drug release where the rate of drug release is dependent on its concentration.
Stability Studies
The stability of optimized letrozole-loaded niosomes was studied for 60 days at two different temperatures (25 ± 2°C and 4 ± 2°C). At specific time intervals (14, 30 and 60 days) the particle size (Z-average), PDI and EE% of the dispersions were measured and the results compared with fresh samples.
Cytotoxicity Assay
MCF-7, MDA-MB-231 and MCF10A cells were cultured separately at a density of 1×10⁴ cells per well in 96-well tissue culture plates and incubated at 37 °C in 5% CO2 incubator for 24 hours. Different concentrations (0–200μg/mL) of empty niosome (L3B), free letrozole (L), letrozole-loaded niosomes (L3) and letrozole mixed by letrozole-loaded niosome (L+L3; 1:2 v/v) were added to 96 well plates in eight replicates and incubated at 37 °C in a 5% CO2 incubator for 48 and 72 hours. After incubation, cells were treated by 100 µL of MTT (0.5 mg/mL in PBS) and incubated for 4 hours in a 5% CO2 incubator at 37°C. Then 100 µL of DMSO was added to each well after removing the medium.40 Formazan formation was quantified using a microplate reader (Biotek, USA). Finally, the cell viability for each treatment was calculated by the following equation:
Eq. 2 Cell viability (%) = (A treatment−A blank) / (A control−A blank) × 100
Apoptotic Gene Expression Analysis
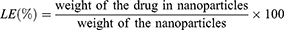
MCF-7, and MDA-MB-231 cells were treated with L3B, L, L3, and L + L3 at IC50 concentrations for 72 h. The RNA extraction kit (Transgene Biotech) was used for isolation of RNA content of the treated cells. The cDNAs were obtained using the cDNA synthesis kit (Takara, Japan). The expression rate of BCL2, Bax, and p53 were assessed using real-time PCR. The beta actin (ß-actin) expression level was used as an internal control. The real-time PCR primers are listed in Table 2. The real-time PCR program was as follows: 95°C 10 min, 95°C 15 s (35 cycles), and 72° C 1 min. The total volume of the amplification reaction was 20 µL using SYBR® Green Master Mix (Bio-Rad, USA) and the products were run on 2% agarose gel. Data were evaluated by the icycler iQ real-time detection system, and the fold changes were calculated based on the threshold cycle (Ct) value.
 |
Table 2 Primers and Their Sequences Used in the Real Time PCR38 |
Confocal Laser Scanning Microscopy
Confocal laser scanning microscopy was used to evaluate cellular uptake of letrozole-loaded niosome. Accordingly, 1×10⁵ of MDA-MB-231 cells were seeded for 24 h in plates containing RPMI-1640 medium that was supplemented with 10% FBS. Then 500 μL of Nile red was used as a model hydrophobic molecule and loaded into the niosome. Extra stain and niosomes were removed by dialysis method (MWCO 12 kDa). The Nile red-loaded niosomes (50 μg/mL) were added to the cell cultures and incubated for 3 h. The cancer cells were washed three times with PBS, fixed with 4% paraformaldehyde (PFA), stained with coumarin-6 (green fluorescence) for 15 min and examined with a confocal laser scanning microscope (TCS SP5, Leica Microsystems, Wetzlar, Germany).
Flow Cytometry
MCF-7 and MDA-MB-231 cells were seeded in a cell culture plate at a density of 5×10⁵ cell/well and incubated overnight at 37°C in 5% CO2 to attach completely. Then, the cells were separately treated with L3B, L, L3 and L+L3 at IC50 concentrations for 72 h. After washing twice with cold sterile PBS (pH 7.4), 5×10⁵ cells/well in 6-well plate were suspended in 1X binding buffer provided by the kit (Transgene Biotech ER101-01). According to manufacturer’s instructions, certain amounts of propidium iodide (red fluorescence) and annexin V-FITC (green fluorescence) were added to the cells and incubated for 10 min at room temperature. In the final step, the cell suspensions were moved to a flow cytometric tube and subjected to flow cytometry analysis (FACSCalibur, BD Biosciences, Singapore).
Cell Cycle Analysis
Propidium iodide (PI) staining was used to evaluate cell proliferation. In this regard, DNA content is used to detect the cell cycle stage, so the binding of PI to DNA is proportional to the DNA content. Cells were seeded in complete medium in 6-well plates at a density of 1×10⁶ cells/well. After an overnight incubation and three times washing with PBS, cells were treated with L3B, L, L3, L+L3 for 72 h in complete medium. After that, cells were collected and fixed with 70% cold ethanol overnight at 4°C and stained with 500 μL of PI solution (containing RNase) in the dark for 20 min at room temperature and then analyzed by flow cytometry. Experiments were repeated three times.
Results
Letrozole-Loaded Niosome Formulations
Table 3 represents the impact of the type of surfactant and the molar ratio of lipid to drug on the structure and physicochemical properties of the prepared niosome. Results indicated that the niosomal formulations with different lipid/drug molar ratio and various surfactant types had varied size and PDI. Among the different employed surfactants, the Span 80 with both lipids to drug molar ratio (10 and 20) formulation had optimal characterization parameters. However, among formulations with Span 20 and 60 those which were prepared based on 10 molar ratios of lipid to drug had smaller size and higher EE in contrast with formulation which was prepared based on 20 molar ratios of lipid to drug. Consequently, formulations obtained from span 20, span 60 and span 80 in a lipid-to-drug molar ratio of 10 were selected for further analyses.
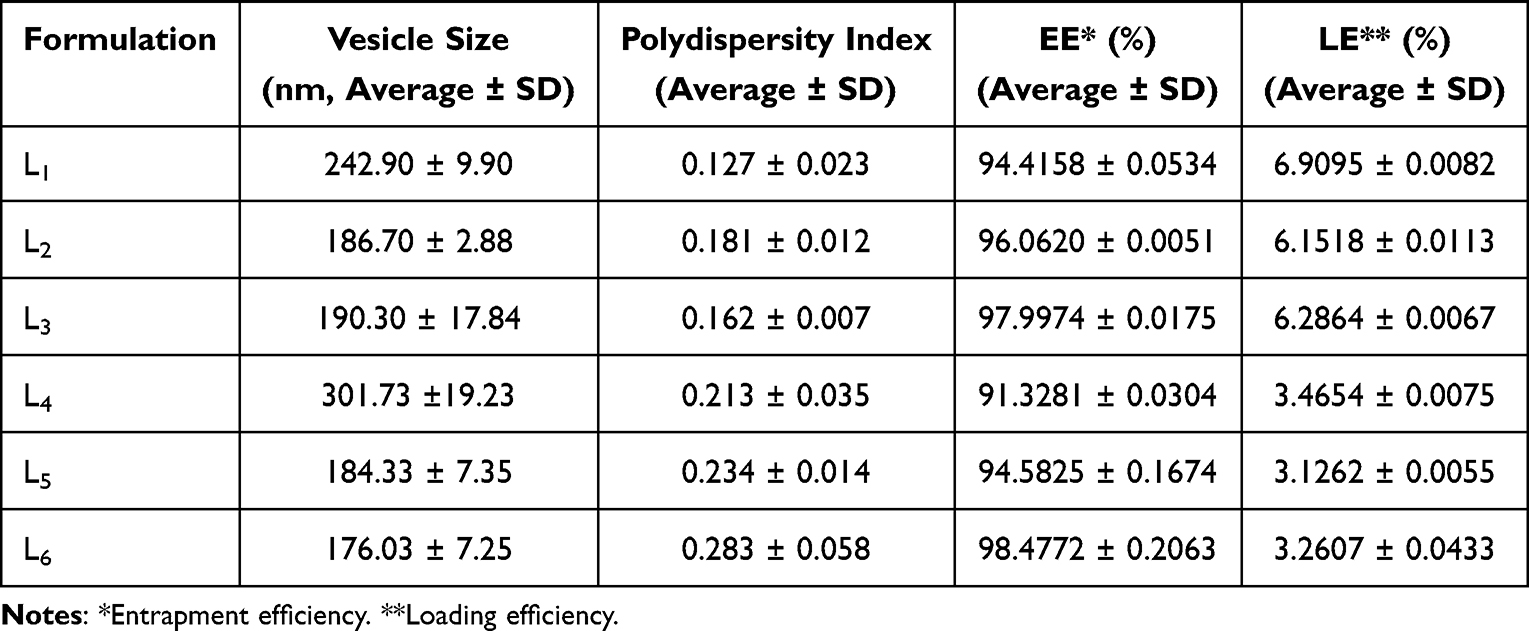 |
Table 3 Vesicle Size, PDI, EE % and LE% of Different Niosomal Formulations Containing Letrozole (L1-L6). Data are Represented as Mean ± SD, n = 3 |
Morphological Characterization of Optimized Niosomes
Figure 1A–F demonstrates the particle size of selected letrozole-loaded niosomes and related empty niosome formulations. As can be seen, the average particle size and PDI of L1 is 232.5 nm and 0.119, respectively (Figure 1A). The average particle size and PDI of L1B is 173 nm and 0.155, respectively (Figure 1B). The average particle size and PDI of L2 is 184.7 nm and 0.188, respectively (Figure 1C). The average particle size and PDI of L2B is 158.5 nm and 0.172, respectively (Figure 1D). Moreover, the average size and PDI of L3 is 188.2 nm and 0.156, respectively (Figure 1E). The average particle size and PDI of L3B is 184.4 nm and 0.175, respectively (Figure 1F). Figure S1A, C and E reveals that the zeta potential of L1, L2 and L3 is −18.9, −23.7 and −20.6 mV, respectively. Moreover, Figure S1B, D and F demonstrates that the zeta potential of L1B, L2B and L3B is −25.3, −28.7 and −27.9 mV, respectively. Morphology of optimized niosomal formulation (L3) was studied by SEM, TEM and AFM. Figure 1G shows the SEM image of the niosomes, which confirms a uniform spherical shape and a smooth surface with an average size of 40 nm without any aggregation. The size of the niosomes obtained by SEM was smaller than that measured by the Nano Zetasizer. Figure 1H illustrates internal and topology structure of the niosomes which have been imaged by TEM. This image also confirms the spherical and uniform structure of the vesicles. The AFM image of the niosomes is indicated in Figure 1I. In this figure, the niosomes also show a spherical shape, but there was a large variation in the vesicle size, which may be related to the fusion of the niosomes as a result of interactions between the mica substrate and niosome surfaces.
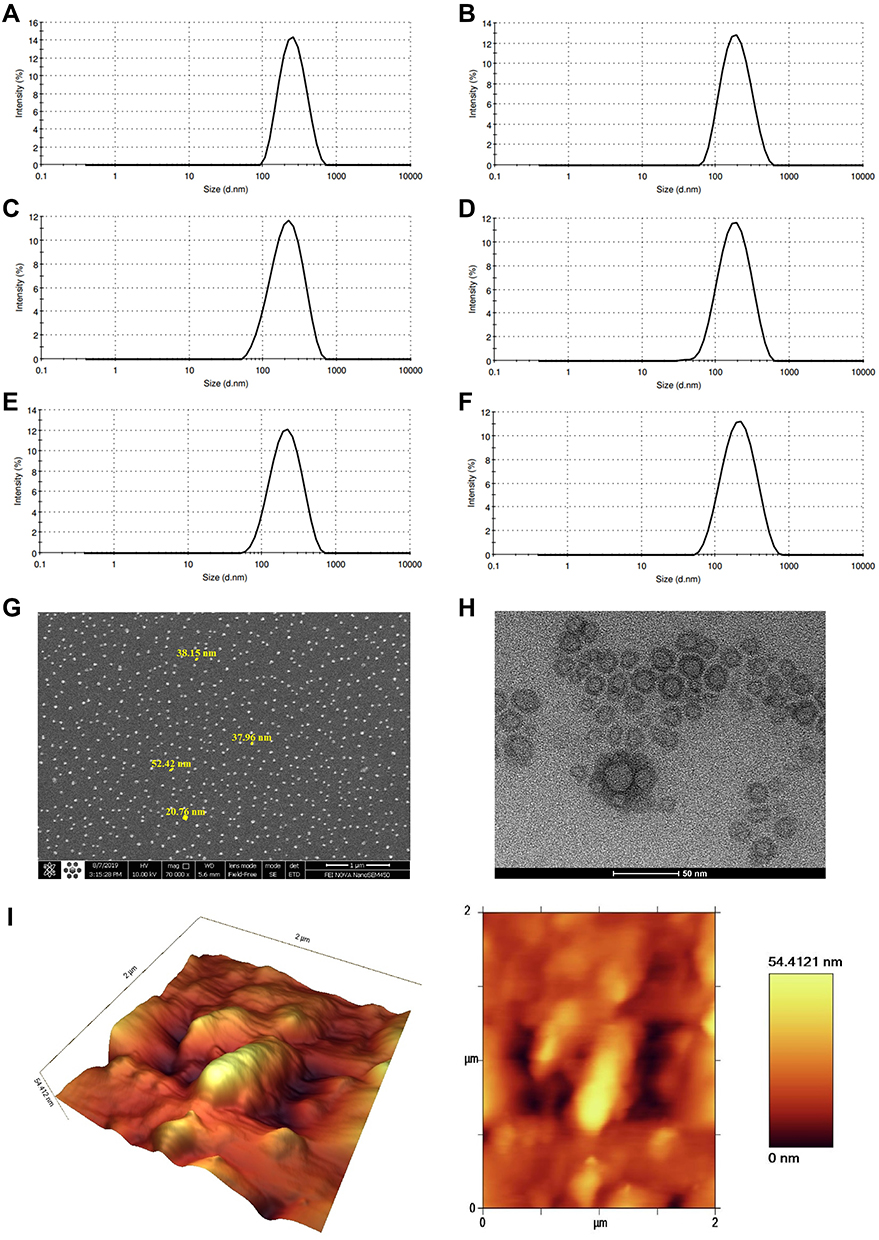 |
Figure 1 (A–F) Graphical presentation of the average size distribution of L1, L1B, L2, L2B, L3 and L3B respectively. Morphological characterization of optimized niosomes: (G) scanning electron microscopy (SEM), (H) transmission electron microscopy (TEM), and (I) Atomic force microscopy (AFM). |
Fourier Transform Infrared (FT-IR) Analysis
FT-IR spectra for different components of the niosomal formulations are represented in Table 4. The optimized empty niosomes (L3B) have most of the characteristic peaks of its components, including 80, DCP and cholesterol (Figure 2A and Table 4).41 FT-IR spectrum of L showed intense band of functional groups, 1640–1690 cm−1 (N = C bonding), 800 cm−1 (N–H out-of-plane bending vibrations), 1550–1640 cm−1 (N-H bonding), 1600–1680 cm−1 (C–C bonding), 1450–1600 cm−1 (Aromatic ring of C = C), 2250 cm−1 (C ≡ N bonding), and 1000–1350 cm−1 (N-C bonding). The IR spectrum of L3 showed characteristics peaks at 3452 cm−1, (O-H stretching), 1125 cm−1 (C–O stretching), 1747 cm−1 (C =O stretching), 1000–1250 cm−1 (Aliphatic C-N stretching), 2200 cm−1 (C ≡ N bonding), and 2800–3000 cm−1 (C-H stretching). Furthermore, the FT-IR spectrum of excipients including Span80, cholesterol, and DCP has been reported in Table 4. However, the C=C stretching peaks (at 1674 cm−1) peaks in cholesterol have vanished in the FT-IR spectra of the niosomes, further demonstrating the entrapment of cholesterol in the lipid bilayer shell and the formation of the niosomes.42,43 Another important result was disappearing of the main characteristics peaks of the drug molecule in the final optimized niosomal formulation, which revealed the successful encapsulation of the drug by the niosomes.
 |
Table 4 The Main Characteristic Peaks for FT-IR Spectra of Different Samples or Chemicals |
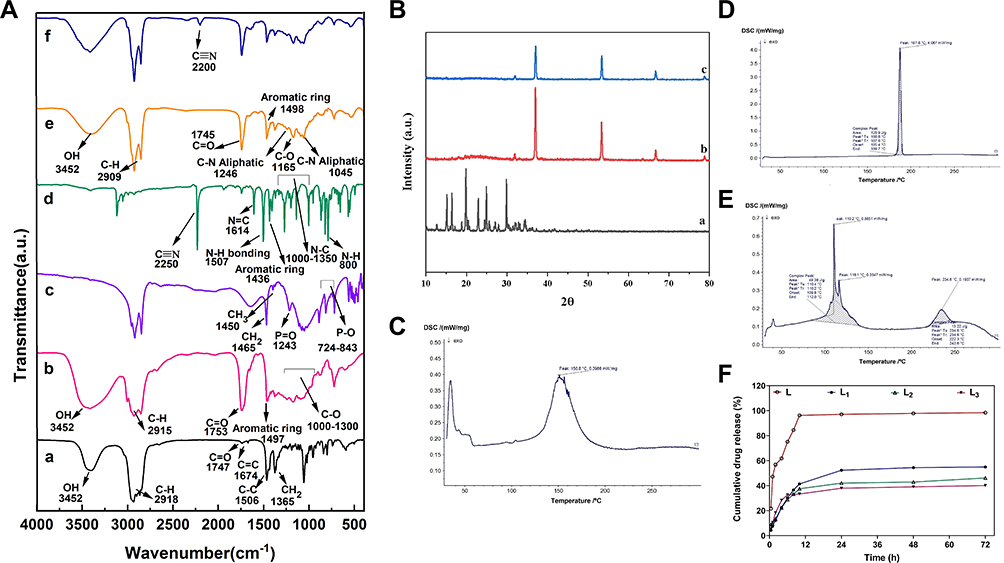 |
Figure 2 (A) Fourier Transform Infrared FTIR Spectra of (a) Cholesterol, (b) Span80, (c) DCP, (d) L, (e) L3B, and (f) L3). (B) XRD patterns of (a) L, (b) L3B, and (c) L3. DSC thermograms of (C) L3B, (D) L and (E) L3. (F) In vitro drug release profile of free letrozole and release profile of letrozole in optimum formulation of letrozole-loaded niosomes (L1, L2 and L3). Data are represented as mean ± SD. |
Powder X-Ray Diffractometry (XRD) Analysis
The results obtained from the XRD analysis illustrated that despite the crystalline structure of L, the L3 showed an almost amorphous structure that confirmed the successful entrapment of the drug into the niosomes (Figure 2B). This result was consistent with previous reports of XRD pattern for other formulations.
Differential Scanning Calorimetry (DSC) Measurements
DSC data (Figures 2C–E) revealed that free letrozole has a clearly sharp endotherm peak at 187.6 °C relating to its melting point. However, the DSC thermogram of L3 represented a slight difference over 110.2, 116.1 and 234.6°C, which may result from a change in letrozole structure and could be indicative of inclusion complex formation.
Drug Release Study
This study was carried out to inspect the effect of the niosomes on the releasing rate of the drug from the vesicles. The achievement of a desirable drug release system was another aim of the study obtained using release kinetic models. Figure 2F presents the amount of letrozole retained in the different formulations of niosomes during the specific time intervals. The results revealed that the release of letrozole from niosomal formulations has a biphasic profile; an initial burst of release followed by a constant or slow rate of release. The amounts of drug released from all niosomal formulations were obtained about 33–36% during the first 8 hours. After this time, the rate of release was constant, and no significant change in the rate of release was observed in all formulations.
Linear form of different kinetic models was plotted according to release data, in order to find the release mechanism. To determine the kinetic of release for optimized formulations, the regression coefficient of linear curve was calculated. As the kinetic model with a regression coefficient close to 1 is a desirable model for the release profile, Korsmeyer–Peppa’s was selected as an appropriate model for all prepared niosomal letrozole formulations (Table 5).
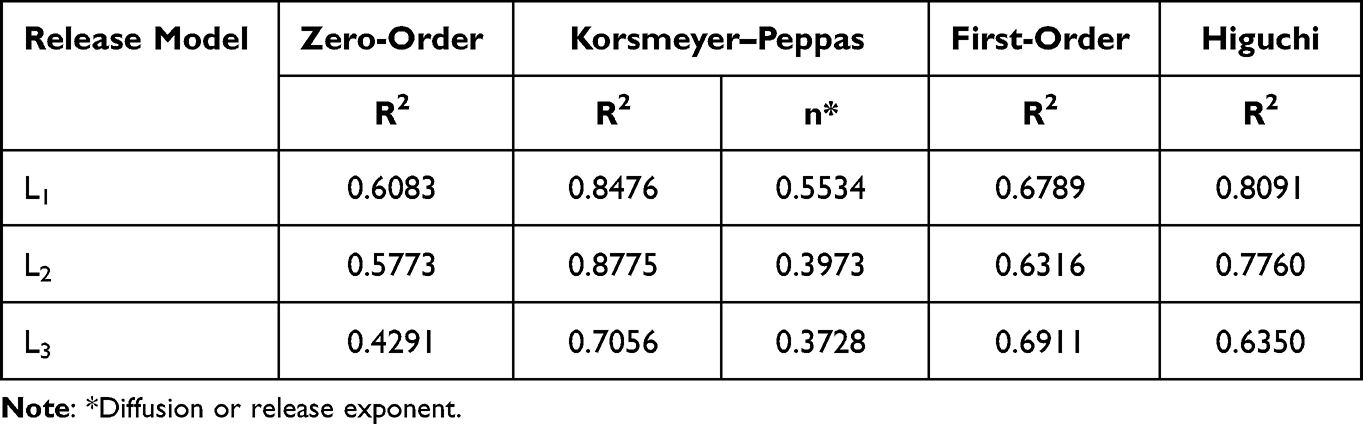 |
Table 5 The Release Kinetic Models and the Parameters Obtained for Optimum Niosomal Formulations Containing Letrozole (L1-L3) |
Physical Stability of Letrozole-Loaded Niosomes
The physical stability of the niosomal formulations was determined by measuring the vesicle size and the retained drug in the niosomes before and after 2 months of storage at two different temperatures. In all niosomal formulations, the EE% decreased, whereas the particle size and PDI increased during the storage time. The samples stored at 4 ± 2°C were more stable than the samples stored at 25 ± 2°C. The change in particle size, PDI and EE% of the L3 formulation stored at 4°C and 25°C in different time intervals was lower than L1 and L2 formulations. The complete data of stability is represented in Figure 3. In all formulations, the size of the nanoparticles was changed. Changes in L1 were only significant on days 30 and 60. L2 on days 14, 30, and 60 and L3 only represented significant changes (P-value < 0.05) changes in day 30. Moreover, polydispersity index of L1 and L3 was only significant in day 60, whereas PDI of L2 was significantly different in day 30 and 60 for prepared samples which were stored at 4 ± 2°C and 25 ± 2°C. The EE of all formulations was significantly (P <0.05) different on days 30 and 60 in both storage conditions (Figure 3).
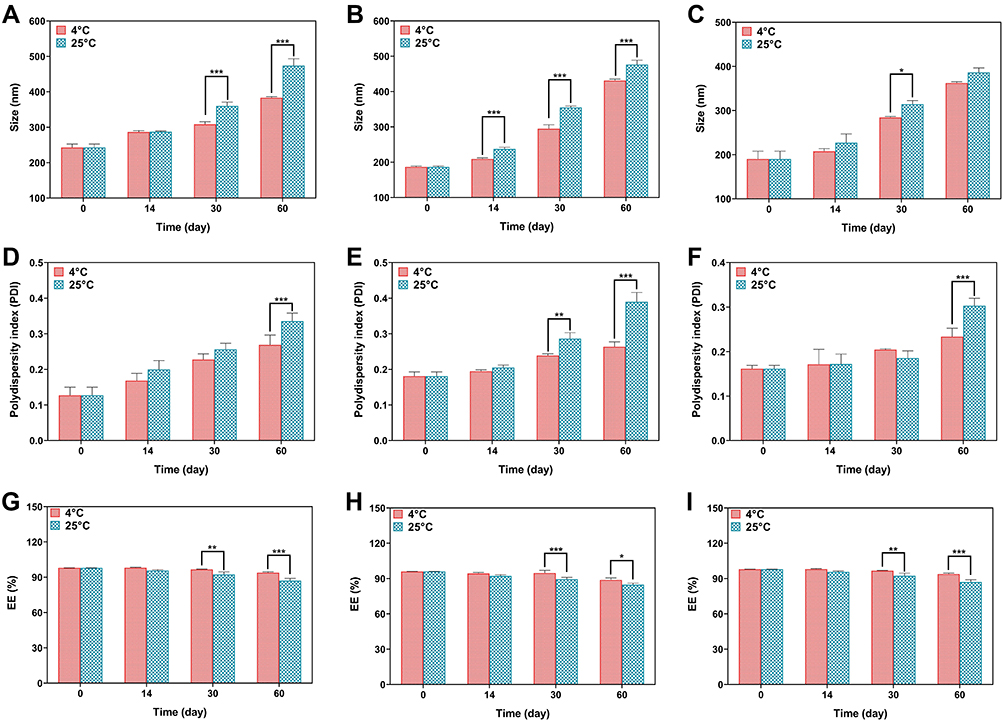 |
Figure 3 (A–C) Size stability evaluation of L1 (A), L2 (B) and L3 (C) formulations, (D–F) PDI stability evaluation of L1 (D), L2 (E) and L3 (F) formulations, (G–I) EE (%) stability evaluation of L1 (G), L2 (H) and L3 (I) formulations. Data are represented as mean ± SD and n=3; ***P<0.001, **P<0.01, *P<0.05. |
In vitro Cell Viability
The MTT assay was performed to investigate the antiproliferative effects of different formulations of niosomes (L3B, L, L3 and L+L3) on cancer cells. Figure 4A–D is a comparison between the effect of different formulations on MCF10A cell viability. Based on Figure 4A, cytotoxicity effect of L3B on MCF10A after 72 h was higher at 200 µg/mL of drug concentration. As Figure 4B shows, the cytotoxicity effect of L on this cell line after 72 h was dramatically higher at 100 µg/mL (P<0.05). The effect of L3 on MCF10A proliferation was absolutely higher after 72 h at 12.5, 50, 100 and 200 µg/mL of drug concentration (Figure 4C). Furthermore, the cell viability of cells treated with L+L3 represented a remarkable time-dependent decrease, after 72 h, at concentrations of about 6.25, 12.5, 25, 50 and 100 µg/mL (Figure 4D).
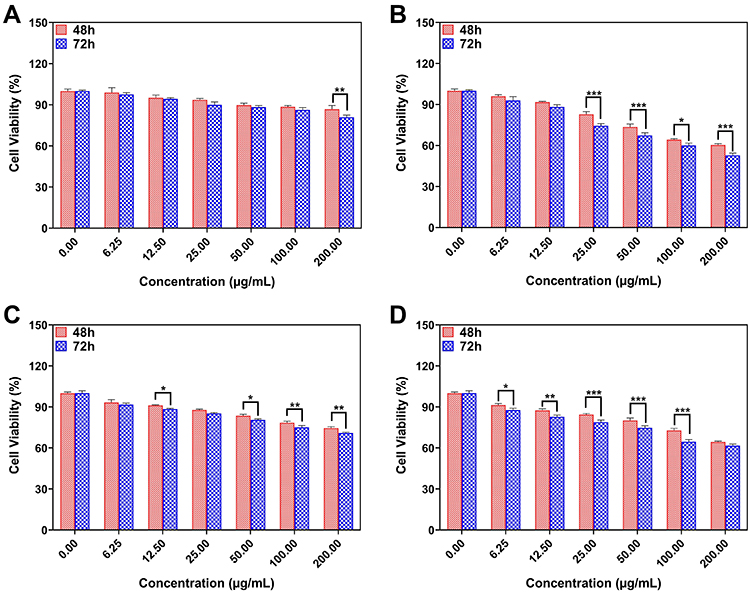 |
Figure 4 (A) The effect of L3B, (B) L, (C) L3 and (D) L+L3 samples on the viability of MCF10A cells. Data are represented as mean ± SD and n=3; ***P<0.001, **P<0.01, *P<0.05. |
Figures 5A–D represents the MCF-7 cell viability treated with L3B, L, L3 and L+L3 formulations after 48 and 72 h. As results show, the cell viability of cells treated with L3B after 48 h is higher than cells treated with L3B after 72 h at concentrations of 6.25, 12.5 and 25 µg/mL. The cell viability of treated cells with L at concentration 200 µg/mL after 72 h is 7% lower than the same concentration after 48 h. Viability of cancer cells after 48 h which were treated with L3 compared with 72 h dramatically decreased at 6.25, 12.5, 50 and 200 µg/mL. However, there is no remarkable difference in cell viability of MCF-7 cells treated with L + L3 neither after 48 h nor after 72 h. Figure 5E–H shows the cell viability of MDA-MB-231 treated with L3B, L, L3 and L+L3 formulations after 48 and 72 h. The results reveal a significant decrease of MDA-MB-231 cell viability at 6.25, 12.5 and 25 µg/mL after 72 h of treatment with drug-free niosomes in contrast with 48 h treatment. Overall, it seems that the antiproliferation activity of drug had been improved after 72 h in comparison with 48 h. To illustrate, cell viability of cells treated with L, after 48 h was higher than 72 h at concentration of 12.5, 25, 100 and 200 µg/mL. Moreover, cytotoxicity of L3 after 72 h is 7% greater than 48 h only at concentration of about 25 µg/mL of drug.
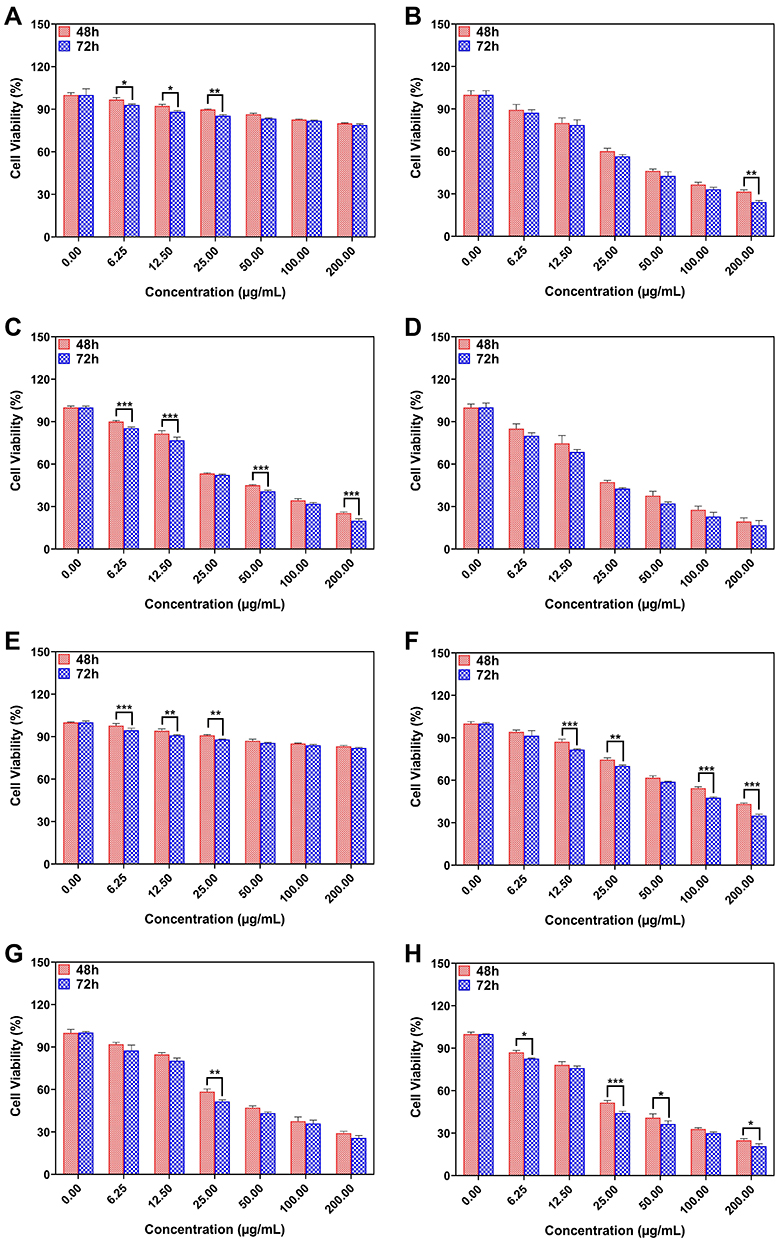 |
Figure 5 (A–H) The drug concentration effect of L3B, L, L3 and L+L3 samples on the viability of (A–H) MCF-7 and (E–H) MDA-MB-231 cells. Data are represented as mean ± SD and n=3; ***P<0.001, **P<0.01, *P<0.05. |
Schematic of cytotoxicity assay of letrozole from a niosome is represented in Figure 6A. As indicated in Figure 6B–E, there is a significant decrease (P<0.05) between IC50 of the L formulation compared with the L3 and L+L3 formulations in both breast cancer cell lines at 48 and 72 h(Figure 6B and D). Furthermore, IC50 of all formulations decreased in a time-dependent manner for both MCF-7 and MDA-MB-231 cell lines (Figure 6C and E). This decrease was significant for the L and L3 formulations, but not for the L + L3 formulation (Figure 6C and E).
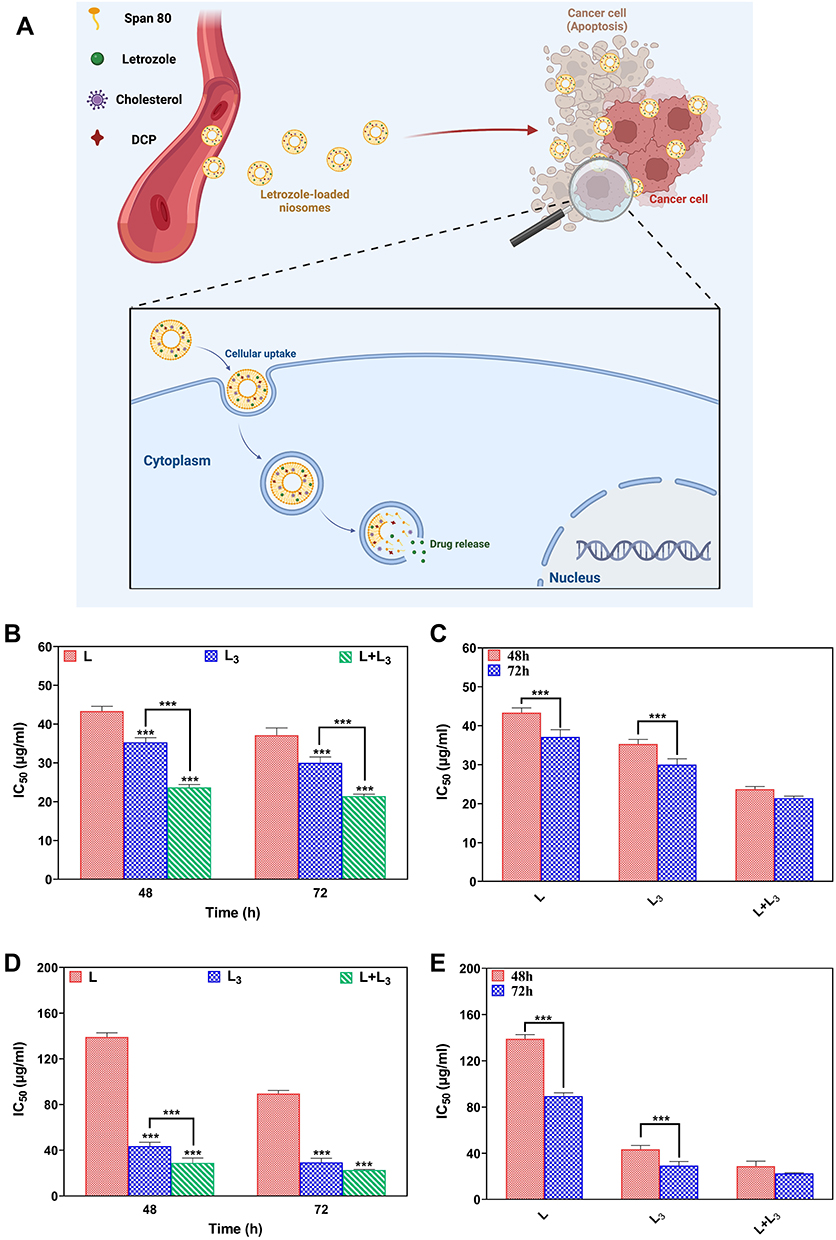 |
Figure 6 Schematic of cytotoxicity assay of letrozole from a niosome (A); IC50 values for MCF-7 cells after 48 h and 72 h treatment (B); Comparison between IC50 values in the different formulations in the different time points for MCF-7 cells (C); IC50 values for MDA-MB-231 cells after 48 h and 72 h treatment (D); Comparison between IC50 values in the different formulations in the different time points for MDA-MB-23 cells (E). Data are represented as mean ± SD and n=3; P<0.001***. |
Apoptotic Gene Expression Analysis
Inhibitory features of all formulations impact on the expression level of different genes inside the breast cancer cells. The expression of apoptotic Bax, Bcl2 and p53 genes in treated cancerous cells at transcription levels, were measured by real-time PCR (Figure 7A). Comparison between gene expressions in cancer cell lines (MCF-7, MDA-MB-231) and control group indicated a significant increase in the expression level of pro-apoptotic Bax and p53 genes (Figure 7B, D, E, and G) and also a remarkable decrease in the expression of anti-apoptotic Bcl2 gene, after 72 h exposure to the L, L3, and L+L3 formulations (Figures 7C and F). Furthermore, the expression level of Bax and p53 in cancer cells treated with L3 and L + L3 were significantly higher than that of the L formulation (Figures 7B, D, E, and G). A significantly lower level of Bcl2 expression was obtained for cells treated with L3 and L + L3, while a higher level of expression was achieved for the L formulation (Figure 7C and F).
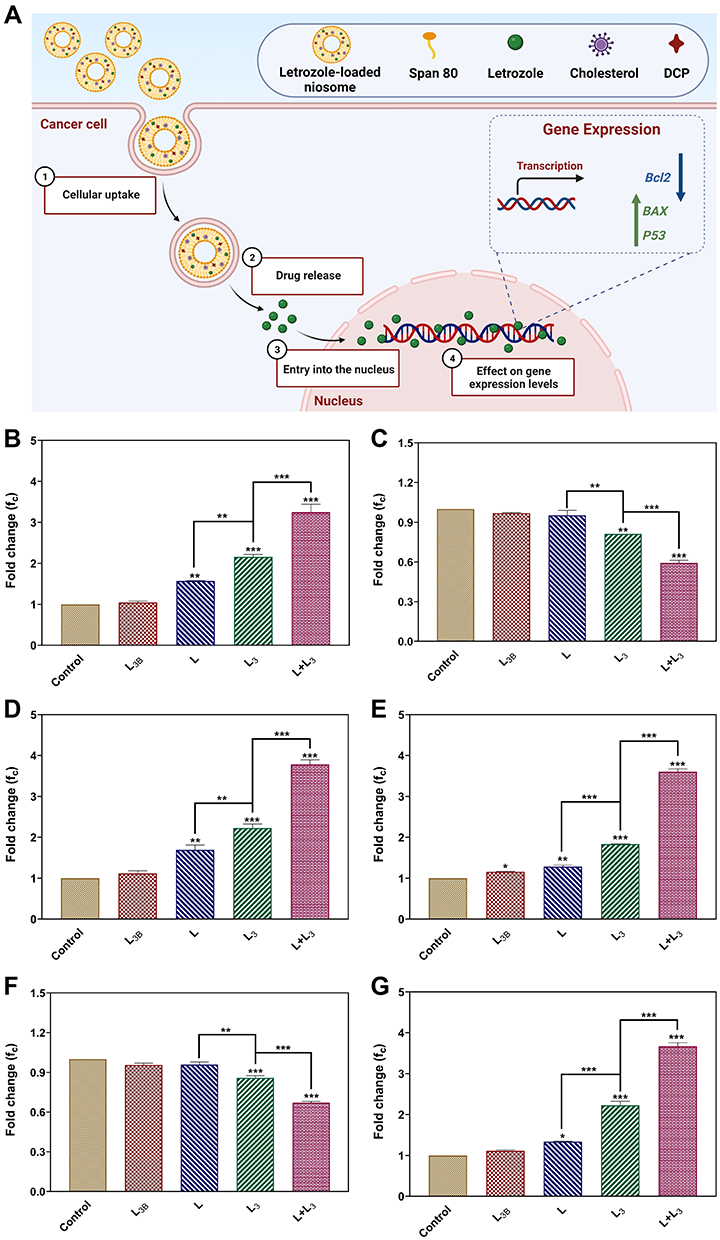 |
Figure 7 (A) The expression of apoptosis BAXax, Bcl2BCL2 and Pp53 genes in treated cancerous cells; (B–D) The expression of Bax, Bcl2 and p53 genes in MCF-7, and (E–G) in MDA-MB-231 cells after treatment with different samples. The IC50 was used for each sample. Data are represented as mean ± SD and n=3; ***P<0.001, **P<0.01, *P<0.05. |
Apoptosis Study
The Annexin-PI staining by flow cytometry was used to study the cytotoxicity, apoptosis and necrosis of the breast cancer treated by different formulations of letrozole (Figure 8A). In this regard, the MCF-7 and MDA-MB-231 cells were treated for 72 h with L3B, L, L3 and L+L3 formulations at their IC50s. As illustrated in Figure 8B and C, the apoptosis rate of MCF-7 and MDA-MB-231 cells which treated by letrozole solution (L) was about 15.505% and 15.96%, respectively. The rate of apoptosis of MCF-7 and MDA-MB-231 cells treated with L3 was approximately 23.86% and 25.665%, respectively, and this rate for MCF-7 and MDA-MB-231 cells treated with L + L3 was obtained around 38.70% and 44.665%, respectively. The rate of apoptosis for the cells treated by L3 and L+L3 was significantly greater than that of treated by L and control groups (Figure 8D and E).
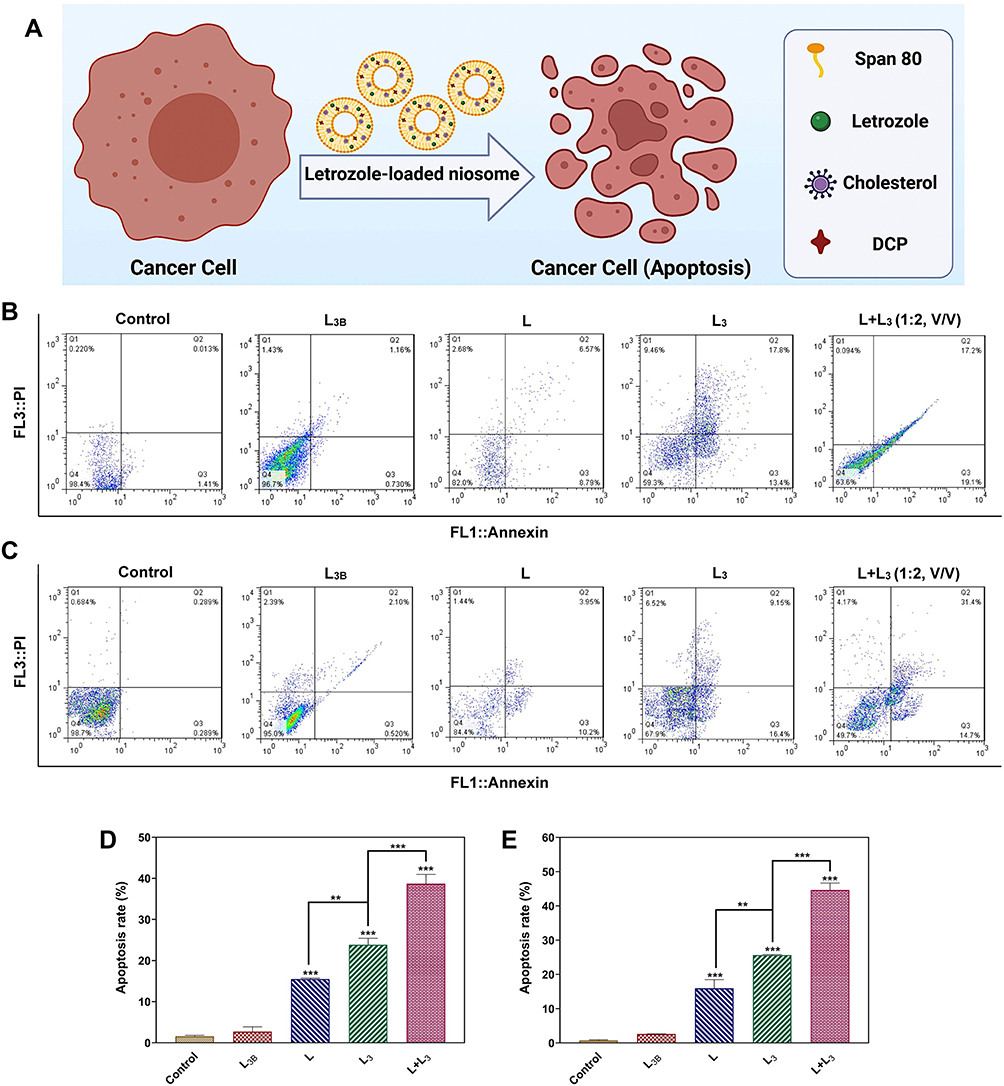 |
Figure 8 (A) The apoptosis assay of the breast cancer cells treated by different formulations of letrozole; (B) The flow cytometry of MCF-7 and (C) MDA-MB-231 cells after treatment with different samples. Different quadrants in the scatter plot of double variable flow cytometry could reveal the following information: the Q1 quadrant (FITC−/PI+): necrotic cells; the Q2 quadrant (FITC+/PI+): late apoptotic cells; Q3 quadrant (FITC+/PI−): early apoptotic cells; and the Q4 quadrant (FITC−/PI−): living cells. Data are represented as mean ± SD. (D) The quantitative apoptosis rate analysis of MCF-7 cells and (E) MDA-MB-231 cells after treatment with different samples. Data are represented as mean ± SD and n=3; ***P<0.001, **P<0.01. |
Confocal Laser Scanning Microscopy
The cell-penetration and internalization potency of the niosomes into cancerous cells was investigated by confocal microscopy with fluorescence detection. Moreover, the efficiency of niosome uptake by the cancer cells has been evaluated via this method. In this way, the staining of the target cells was performed using coumarin-6. Also, Nile red was used as a hydrophobic model molecule for the detection. As illustrated in the images of Figure S2, co-localization of the medication and the stained cell, and further internalization are recognized through well mixing of the colors, which results in a compilation of two different colors. The intensity of the mixed color represents well co-localization and overlap of the ingredients.44
Cell Cycle Analysis
The effect of different formulations of letrozole on cell cycle progression in the breast cancer cells was investigated by flow cytometry (Figure 9A and B). As demonstrated in Figure 9C and D, treatment with L, L3, and L + L3 formulations, led to arresting cells in the sub-G1 phase of the cell cycle in both breast cancer cell lines. The amount of sub-G1 cell population in MCF-7 cells treated with L, L3 and L+L3 was obtained about 6.12%, 13.04% and 19.58%, respectively. This amount for MDA-MB-231 cells treated with L, L3, and L + L3 was around 8.22%, 12.96%, and 21.20%, respectively. These results were in agreement with the results of the apoptosis study in which higher apoptosis rate was observed in MDA-MB-231 cells with higher impact for L+L3 formulation.
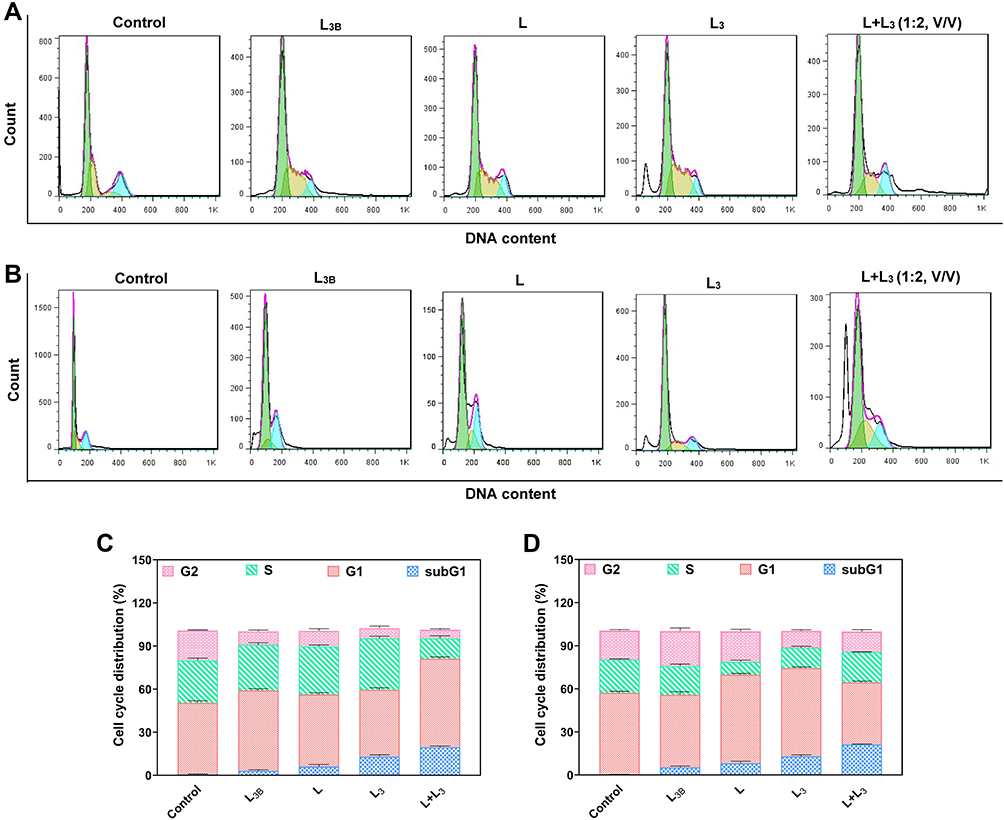 |
Figure 9 (A) Cell cycle analysis of MCF-7 and (B) MDA-MB-231 cells treated by different formulations of niosomes by the same concentration of the drug. (C) Cell cycle distribution for MCF-7 cells and (D) MDA-MB-231 cells after treatment with different samples. The control sample refers to the cells without treatment with any drug or nanomaterial. Data are represented as mean ± SD. |
Discussion
This study aims at developing niosomal formulation of letrozole as a potential platform to target and treat breast cancer. As illustrated in Table 3, niosomal formulations with different lipid-to-drug molar ratios and surfactant type were exhibited with various sizes and PDI. The entrapment efficiency and particle size strongly depend on the type of surfactants and the amount of cholesterol (i.e., lipid) in the niosomal structure because any change in chemical type and chemical composition directly affects the hydrophilic-lipophilic balance (HLB) in the niosomal formulation.45–48 The smaller size of the 80-span niosomes may be attributed to the length of the hydrophobic chain of this surfactant and the more hydrophilic-hydrophobic interaction between the encapsulated letrozole, cholesterol, DCP, and the hydrophobic chain of the surfactant.41 The prepared niosomes with a lipid-to-drug ratio of 10 showed a considerably smaller size compared with those with a lipid-to-drug ratio of 20. These results were in agreement with other studies42 which have indicated that a higher amount of lipid in the niosomal formulation might result in a thicker lipid bilayer and larger nanoparticles.42 The size of the particles is a crucial parameter for efficient drug delivery, which can affect the entrapment efficiency and drug release. This study confirmed that the amount of cholesterol could significantly affect the mean size of the niosomes, which was according to previous reports, that is, increasing the amount of cholesterol; the size of the vesicles was increased.49–53
The polydispersity index illustrates the uniformity of particle size and is a criterion for the width of the size distribution.54 The PDI value varies between 0 and 1, and the lower PDI value belongs to the more homogeneous suspension. The uniform particles have a narrow size distribution and low tendency to aggregate.55 Our results indicated that probe sonication decreases the particle size of the niosomes and results in a higher amount of cholesterol, which leads to lower entrapment efficiency of the drug. These findings were in agreement with previous reports.49,50 It seems that beyond a certain level of cholesterol, the bilayer structure may be altered and the amount of drug retained may be reduced.51 Therefore, an optimal cholesterol ratio should be selected to achieve a high amount of drug loading and niosome stability.55,56
The size of the vesicles measured by SEM and TEM, were smaller than those measured by Nano Zetasizer (DLS). This difference may be related to the drying process during the SEM and TEM imaging. In other words, SEM and TEM give the mean size of dried nano particles (measures the exact diameter of each particle). However, DLS measures the hydrodynamic diameter that includes core plus any molecule attached or adsorbed on the surface, including ions and water molecules.52,57,58
The rate of drug release depends on the composition and fluidity of the bilayer membrane. Moreover, electrostatic interactions between drug and surfactants are essential, mainly when the drug exists in an ionized form at physiologic pH.59 The initial phase involves the almost accelerated release of letrozole and then followed by a more passive release phase. The rapid initial release can be attributed to the release of loosely attached drug molecules on the surface of the vesicles and the slower phase is fundamentally related to the diffusion of letrozole through the bilayers.60–62
According to the R2 values of the release kinetic models in Table 5, it was found that drug release is controlled by diffusion and erosion mechanisms,42,63,64 and the values of n (0.43 <n <0.85) indicate that drug release is based on Fickian diffusion release.65,66
More stability of the niosomes stored at 4 ± 2°C is possibly due to less mobility of bilayer at this temperature.27,42,67 Increasing the size of the vesicle during storage may be related to its fusion68 or aggregation.69 Also, the decrease in EE% at high temperatures may be due to more fluidization of the lipid vesicles and drug leakage.70,71 In addition to this, due to the irregularity of the surfactant fatty acid chain at high temperatures, the thickness of the two layers decreases and leads to more drug diffusion from the vesicles.67 Also, at high temperature, the fatty acid chain of the surfactants gets irregular configuration so that the bilayer thickness decreases and the rate of diffusion across the bilayer membrane increases.67
Letrozole is considered as a great in vitro and in vivo aromatase inhibitor. Studies on relative effects of letrozole and anastrozole on model cellular endocrine and tumor systems containing aromatase illustrated that there is no difference between letrozole and anastrozole which are equipotent in a cell-free aromatase, while letrozole is 10–30 times more potent than anastrozole in inhibiting intracellular aromatase.72 A study on 54 postmenopausal women who had invasive breast cancer demonstrated a remarkably higher suppression of estradiol in patients treated with 2.5 mg letrozole in comparison with those who have been treated with 1 mg of anastrozole.73 Moreover, using 0.1–5 mg/day of letrozole decreased the concentration of estradiol, estrone, and estrone sulfate plasma by 75–95% from baseline, whereas doses >0.5 mg suppress estrogens to below the limit of detection.74 In a study on 713 postmenopausal women with advanced breast cancer previously treated with an anti-estrogen, the effect of letrozole (2.5 mg/day) and anastrozole (1 mg/day) were directly compared. The results showed a higher responsibility rate for letrozole in contrast with anastrozole (19.1 vs 12.3%, P = 0.013).75 Other clinical trial research showed that 2.5 mg of letrozole is more effective and tolerable compared with 160 mg megestrol acetate. Additionally, 0.5 mg/day dosage of letrozole was associated with poorer response rates in this study.76 In another study which developed and evaluated the effect of letrozole-loaded hyaluronic acid/chitosan-coated poly(d,l-lactide-co-glycolide) nanoparticles on 24 female albino mice (20–25 g) it was found that 300 mg/kg of the letrozole-loaded nanoparticles (equivalent to 10 mg/kg drug) is well tolerable.77
The Food and Drug Administration of USA approved 2.5 mg/day of letrozole tablets as first-line treatment for postmenopausal women with hormone receptor-positive or hormone receptor-unknown locally advanced or metastatic breast cancer.9 Whereas niosomal formulation of this drug revealed higher cytotoxic activity on cancer cells at lower drug concentration in this study. Treatment of cancer cells with free letrozole and a letrozole-loaded niosome showed a correlation between dosage and toxicity. Interestingly, the results showed that cytotoxicity effect of free letrozole was lower than the letrozole-loaded niosome at the same concentration. A possible explanation for these findings is that the antiproliferative activity of drug has been enhanced by niosomal encapsulation. As expected, drug-free niosomes showed no cytotoxicity against treated cells. It confirmed that the niosomes are biocompatible enough to be used as a drug delivery system. Flow cytometric results indicated that the cytotoxicity of letrozole and letrozole-loaded niosomes on MDA-MB-231 cells was conducted through induction of apoptosis. Therefore, the niosome preparation process had no effect on the mechanism of action of the drug. These results are consistent with those of other studies that state that cancer cell progression and growth depend on the balance between pro- and antiapoptotic proteins, including the Bax and BCL-2 genes.78,79 The expression level of p53 increased remarkably. It was shown that P53 plays a role as a regulator of the Bax to BCL-2 ratio in the cell by increasing the expression of pro-apoptotic proteins such as Bax and Bid. Furthermore, interaction between p53 with proteins of the BCL-2 family leads to the activation and translocation of Bax and Bid to the outer membrane of mitochondria. p53 also translocated directly to mitochondria to activate the mitochondrial apoptosis pathway.80–83 Cell localization and penetration is an important feature of nanoparticles that has been investigated in previous studies. Polymeric nanoparticles penetrate into cancer cells, diffuse in the cytoplasm, and escape from endosomal degradation.56,84,85 Another study revealed that nanoparticles of mesoporous silica could enter the cells and remain for a long time which is enough to allow the release of drug from formulation.86 TAT modification of liposome enhances drug delivery in the brain and especially glioma tissues.74 Furthermore, conjugation of TAT peptide on optimized PEGylated niosome improved cellular uptake into Hela cells.87 In similar study, the internalization of doxorubicin encapsulated in nanoparticle was evaluated. Confocal microscopy results showed that encapsulated doxorubicin mainly localized in the cytoplasm through endocytosis pathway while free doxorubicin aggregated in cancer cell membrane and entered slowly by a diffusion.88 In other work, simvastatin-loaded niosomes revealed higher toxicity and apoptotic rate can be attributed to the higher delivery.89 Silibinin, cisplatin, and vinblastine loaded niosomes had higher cytotoxicity than free drugs in T-47D, TC-1, and BT-20 cancer cells, respectively.90–92 These reports support the current conclusion due to our observations by confocal microscopy, namely, higher toxicity and apoptotic rate of the letrozole-loaded niosomes attributed to the higher delivery efficiency of drug-loaded niosomes into cancer cells.
Conclusions
The present study showed that providing a niosomal formulation of letrozole was adequate, more effective, and less harmful. The synthesized letrozole-loaded niosomes were found to have homogeneous nanoscale sizes and showed a sustained drug release pattern in physiological conditions. The biological activity of encapsulated letrozole was enhanced due to improved drug stability and physicochemical properties. In vitro studies showed that letrozole-loaded niosomes induced apoptosis in both breast cancer cell lines (MCF-7 and MDA-MB-231), which could result from down-regulation or up-regulation of genes related to apoptosis (Bax, Bcl2, and p53). Localization of nanoparticles inside the cells and interaction between nanoparticles and living cells are very important in nanotechnology-based intracellular delivery of poorly water-soluble drugs. Intercellular localization and the long persistence of niosomes inside the cancer cells could improve the therapeutic effects of niosomal formulations. Therefore, the results of this study can be considered a promising methodology for designing a safe and effective targeted drug delivery system for breast cancer therapy.
Data Sharing Statement
All data that were analyzed during this study are included in this published article.
Ethics Approval and Consent to Participate
There are no “human subjects” in this study.
Acknowledgment
The authors would like to acknowledge the Pasteur Institute of Iran for providing the necessary laboratory facilities for this study. E.M. would like to acknowledge the support from the National Institute of Biomedical Imaging and Bioengineering (5T32EB009035).
Author Contributions
All authors made a significant contribution to the work reported, whether that is in the conception, study design, execution, acquisition of data, analysis and interpretation, or in all these areas; took part in drafting, revising or critically reviewing the article; gave final approval of the version to be published; have agreed on the journal to which the article has been submitted; and agree to be accountable for all aspects of the work.
Funding
This research did not receive any specific grant from funding agencies in the public, commercial, or not-for-profit sectors.
Disclosure
The authors declare that they have no competing interests in this work.
References
1. Bray F, Ferlay J, Soerjomataram I, et al. Global cancer statistics 2018: GLOBOCAN estimates of incidence and mortality worldwide for 36 cancers in 185 countries. CA. 2018;68(6):394–424.
2. Dijkshoorn AB, van Stralen HE, Sloots M, et al. Prevalence of cognitive impairment and change in patients with breast cancer: a systematic review of longitudinal studies. Psycho-Oncol. 2021;30(5):635–648.
3. Gomathi T, Sudha PN, Florence JAK, et al. Fabrication of letrozole formulation using chitosan nanoparticles through ionic gelation method. IntJ Bio Macromol. 2017;104:1820–1832. doi:10.1016/j.ijbiomac.2017.01.147
4. Sarhadi M, Aryan L. The estrogen receptor and breast cancer: a complete review. Trans Appl Sci. 2020;6(04):309–314.
5. Molani S, Madadi M, Wilkes WJO. A partially observable Markov chain framework to estimate overdiagnosis risk in breast cancer screening: incorporating uncertainty in patients adherence behaviors. Omega. 2019;89:40–53.
6. Sayyad NB, Sabale PM, Umare MD, et al. Aromatase inhibitors: development and current perspectives. Indian J Pharm Educ Res. 2022;56(2):311–320.
7. Jamshidifar E, Eshrati Yeganeh F, Shayan M, et al. Super magnetic niosomal nanocarrier as a new approach for treatment of breast cancer: a case study on SK-BR-3 and MDA-MB-231 cell lines. Int J Mol Sci. 2021;22(15):7948. doi:10.3390/ijms22157948
8. Hemati Azandaryani A, Kashanian S, Derakhshandeh K. Folate conjugated hybrid nanocarrier for targeted letrozole delivery in breast cancer treatment. Pharma Res. 2017;34(12):2798–2808. doi:10.1007/s11095-017-2260-x
9. Cohen MH, Johnson JR, Li N, et al. Approval summary: letrozole in the treatment of postmenopausal women with advanced breast cancer. Clin Cancer Res. 2002;8(3):665–669.
10. Guo B, Li JJ, Ma YL, et al. Efficacy and safety of letrozole or anastrozole in the treatment of male infertility with low testosterone‐estradiol ratio: a meta‐analysis and systematic review. Andrology. 2022. doi:10.1111/andr.13185
11. Shirzad M, Jamehbozorgi S, Akbarzadeh I, et al. The role of polyethylene glycol size in chemical spectra, cytotoxicity, and release of PEGylated nanoliposomal cisplatin. Assay Drug Dev Technol. 2019;17(5):231–239. doi:10.1089/adt.2019.923
12. Boran G, Tavakoli S, Dierking I, et al. Synergistic effect of graphene oxide and zoledronic acid for osteoporosis and cancer treatment. Sci Rep. 2020;10(1):1–12.
13. Haseli S, Pourmadadi M, Samadi A, et al. A novel pH‐responsive nanoniosomal emulsion for sustained release of curcumin from a chitosan‐based nanocarrier: emphasis on the concurrent improvement of loading, sustained release, and apoptosis induction. Biotechnol Prog. 2022;38(5):e3280
14. Soltantabar P, Calubaquib E L, Mostafavi E, Biewer M C and Stefan M C. Enhancement of Loading Efficiency by Coloading of Doxorubicin and Quercetin in Thermoresponsive Polymeric MicellesEnhancement of Loading Efficiency by Coloading of Doxorubicin and Quercetin in Thermoresponsive Polymeric Micelles. Biomacromolecules. 2020;21(4):1427–1436. doi:10.1021/acs.biomac.9b01742
15. Shad PM, Karizi SZ, Javan RS, et al. Folate conjugated hyaluronic acid coated alginate nanogels encapsulated oxaliplatin enhance antitumor and apoptosis efficacy on colorectal cancer cells (HT29 cell line). Toxicology in Vitro. 2020;65:104756.
16. Seleci M, Ag Seleci D, Joncyzk R, et al. Smart multifunctional nanoparticles in nanomedicine. Bio Nano Materials. 2016;17(1–2):33–41. doi:10.1515/bnm-2015-0030
17. Akbarzadeh I. Niosomal Delivery of Simvastatin to MDA-MB-231 Cancer Cells. Drug Development and Industrial Pharmacy; 2020:1–50.
18. Akbarzadeh I, Tavakkoli Yaraki M, Bourbour M, et al. Optimized doxycycline-loaded niosomal formulation for treatment of infection-associated prostate cancer: an in-vitro investigation. J Drug Deliv Sci Technol. 2020;57:101715. doi:10.1016/j.jddst.2020.101715
19. Mostafavi E and Zare H. Carbon-based nanomaterials in gene therapy. OpenNano, 2022;7:100062. doi:10.1016/j.onano.2022.100062
20. Ashrafizadeh M et al. Doxorubicin-loaded graphene oxide nanocomposites in cancer medicine: stimuli-responsive carriers, co-delivery and suppressing resistance. Expert Opinion on Drug Delivery, 2022;19(4): 355–382. doi:10.1080/17425247.2022.2041598
21. Zare H, Ahmadi S, Ghasemi A, Ghanbari M, Rabiee N, Bagherzadeh M, Karimi M, Webster T J, Hamblin M R and Mostafavi E. Carbon Nanotubes: Smart Drug/Gene Delivery Carriers. Int. J. Nanomed, 2021;16:1681–1706. doi:10.2147/IJN.S299448
22. Amani, H, Mostafavi, E, Arzaghi, H, Alebouyeh, M R, Akbarzadeh, A, Pazoki-Toroudi, H R, Webster, T J Would colloidal gold nanocarriers present an effective diagnosis or treatment for ischemic stroke?. Int. J. Nanomed. 2019;14:8013–8031. doi:10.2147/IJN.S210035
23. Mostafavi E, Zarepour A, Barabadi H, Zarrabi A, Truong L B and Medina-Cruz D. Antineoplastic activity of biogenic silver and gold nanoparticles to combat leukemia: Beginning a new era in cancer theragnostic. Biotechnology Reports. 2022;34:e00714. doi 10.1016/j.btre.2022.e00714
24. Dastneshan A et al . Cefazolin encapsulated UiO-66-NH2 nanoparticles enhance the antibacterial activity and biofilm inhibition against drug-resistant S. aureus: in vitro and in vivo studies. Chemical Engineering Journal. 2022;140544. doi: 10.1016/j.cej.2022.140544
25. Bazzazan S et al. Engineered UIO-66 metal-organic framework for delivery of curcumin against breast cancer cells: An in vitro evaluation. Journal of Drug Delivery Science and Technology. 2022;104009. doi: 10.1016/j.jddst.2022.104009
26. Porrang S, Davaran S, Rahemi N, Allahyari S and Mostafavi E. How Advancing are Mesoporous Silica Nanoparticles? A Comprehensive Review of the Literature. Int. J. Nanomed.2022;17:1803–1827. doi: 10.2147/IJN.S353349
27. Hedayati C, Abolhassani Targhi A, Shamsi F, et al. Niosome‐encapsulated tobramycin reduced antibiotic resistance and enhanced antibacterial activity against multidrug‐resistant clinical strains of Pseudomonas aeruginosa. J Biomed Mater Res. 2021;109(6):966–980. doi:10.1002/jbm.a.37086
28. Zhang Y, Zhu C, Zhang Z, et al. Oxidation triggered formation of polydopamine-modified carboxymethyl cellulose hydrogel for anti-recurrence of tumor. Colloids Surf B. 2021;207:112025. doi:10.1016/j.colsurfb.2021.112025
29. Zhang L, He G, Yu Y, et al. Design of biocompatible chitosan/polyaniline/laponite hydrogel with photothermal conversion capability. Biomolecules. 2022;12(8):1089. doi:10.3390/biom12081089
30. Wang S, Yang Y, Wu H, et al. Thermosensitive and tum or microenvironment activated nanotheranostics for the chemodynamic/photothermal therapy of colorectal tumor. J Colloid Interface Sci. 2022;612:223–234. doi:10.1016/j.jcis.2021.12.126
31. Targhi AA, et al. Synergistic effect of curcumin-Cu and curcumin-Ag nanoparticle loaded niosome: enhanced antibacterial and anti-biofilm activities. Bioorg Chem. 2021;115:105116.
32. Mansoori-Kermani A, Khalighi S, Akbarzadeh I, et al. Engineered hyaluronic acid-decorated niosomal nanoparticles for controlled and targeted delivery of epirubicin to treat breast cancer. Material Today Bio. 2022;16:100349. doi:10.1016/j.mtbio.2022.100349
33. Naseroleslami M, Niri NM, Akbarzade I, et al. Simvastatin-loaded nano-niosomes confer cardioprotection against myocardial ischemia/reperfusion injury. Drug Deliv Transl Res. 2022;12(6):1423–1432. doi:10.1007/s13346-021-01019-z
34. Yuksel N, Bayindir ZS, Aksakal E, et al. In situ niosome forming maltodextrin proniosomes of candesartan cilexetil: in vitro and in vivo evaluations. Int J Biol Macromol. 2016;82:453–463. doi:10.1016/j.ijbiomac.2015.10.019
35. Azizi S, Norouzian D. Characteristics of pegylated niosomal letrozole. J Chem Pharm Res. 2015;7(2):423–427.
36. Dey SK, Mandal B, Bhowmik M, et al. Development and in vitro evaluation of Letrozole loaded biodegradable nanoparticles for breast cancer therapy. Braz J Pharm Sci. 2009;45(3):585–591. doi:10.1590/S1984-82502009000300025
37. Dabbagh Moghaddam F, et al. Delivery of melittin-loaded niosomes for breast cancer treatment: an in vitro and in vivo evaluation of anti-cancer effect. Cancer Nanotechnol. 2021;12(1):1–35 doi:10.1186/s12645-021-00085-9.
38. Sadeghi S, Ehsani P, Cohan RA, et al. Design and physicochemical characterization of lysozyme loaded niosomal formulations as a new controlled delivery system. Pharm Chem J. 2020;53(10):921–930. doi:10.1007/s11094-020-02100-6
39. Moghtaderi M, Mirzaie A, Zabet N, et al. Enhanced antibacterial activity of echinacea angustifolia extract against multidrug-resistant Klebsiella pneumoniae through niosome encapsulation. Nanomaterials. 2021;11(6):1573. doi:10.3390/nano11061573
40. Chamani E, Ebrahimi R, Khorsandi K, et al. In vitro cytotoxicity of polyphenols from Datura innoxia aqueous leaf-extract on human leukemia K562 cells: DNA and nuclear proteins as targets. Drug Chem Toxicol. 2020;43(2):138–148. doi:10.1080/01480545.2019.1629588
41. Agarwal S, Mohamed MS, Raveendran S, et al. Formulation, characterization and evaluation of morusin loaded niosomes for potentiation of anticancer therapy. RSC Adv. 2018;8(57):32621–32636. doi:10.1039/C8RA06362A
42. Ghafelehbashi R, Akbarzadeh I, Tavakkoli Yaraki M, et al. Preparation, physicochemical properties, in vitro evaluation and release behavior of cephalexin-loaded niosomes. Int J Pharm. 2019;569(p):118580. doi:10.1016/j.ijpharm.2019.118580
43. Nasseri B. Effect of cholesterol and temperature on the elastic properties of niosomal membranes. Int J Pharm. 2005;300(1–2):95–101. doi:10.1016/j.ijpharm.2005.05.009
44. Zeng X, Morgenstern R, Nyström AMJB. Nanoparticle-directed sub-cellular localization of doxorubicin and the sensitization breast cancer cells by circumventing GST-mediated drug resistance. Biomaterials. 2014;35(4):1227–1239. doi:10.1016/j.biomaterials.2013.10.042
45. Bnyan R, Khan I, Ehtezazi T, et al. Surfactant effects on lipid-based vesicles properties. J Pharm Sci. 2018;107(5):1237–1246. doi:10.1016/j.xphs.2018.01.005
46. Chmiel T, Mieszkowska A, Kempińska-Kupczyk D, et al. The impact of lipophilicity on environmental processes, drug delivery and bioavailability of food components. Microchem J. 2019;146:393–406. doi:10.1016/j.microc.2019.01.030
47. Kumar GP, Rajeshwarrao P. Nonionic surfactant vesicular systems for effective drug delivery—an overview. Acta Pharm Sin B. 2011;1(4):208–219. doi:10.1016/j.apsb.2011.09.002
48. Nowroozi F. Effect of surfactant type, cholesterol content and various downsizing methods on the particle size of niosomes. Iran J Pharm Sci. 2018;17(Suppl2):1.
49. Moghassemi S, Hadjizadeh A, Omidfar K. Formulation and characterization of bovine serum albumin-loaded niosome. Aaps Pharmscitech. 2017;18(1):27–33. doi:10.1208/s12249-016-0487-1
50. Gurrapu A, Jukanti R, Bobbala SR, et al. Improved oral delivery of valsartan from maltodextrin based proniosome powders. Adv Powder Technol. 2012;23(5):583–590. doi:10.1016/j.apt.2011.06.005
51. Agarwal R, Katare O, Vyas S. Preparation and in vitro evaluation of liposomal/niosomal delivery systems for antipsoriatic drug dithranol. Int J Pharm. 2001;228(1–2):43–52. doi:10.1016/S0378-5173(01)00810-9
52. Sadeghi S, Bakhshandeh H, Ahangari Cohan R, et al. Synergistic anti-staphylococcal activity of niosomal recombinant lysostaphin-LL-37. Inte J Nanomed. 2019;14:9777. doi:10.2147/IJN.S230269
53. Barani M, Mirzaei M, Torkzadeh-Mahani M, et al. Lawsone-loaded Niosome and its antitumor activity in MCF-7 breast Cancer cell line: a Nano-herbal treatment for Cancer. DARU J Pharm Sci. 2018;26(1):11–17. doi:10.1007/s40199-018-0207-3
54. Moghassemi S, Parnian E, Hakamivala A, et al. Uptake and transport of insulin across intestinal membrane model using trimethyl chitosan coated insulin niosomes. Mater Sci Eng. 2015;46:333–340. doi:10.1016/j.msec.2014.10.070
55. Waddad AY, Abbad S, Yu F, et al. Formulation, characterization and pharmacokinetics of Morin hydrate niosomes prepared from various non-ionic surfactants. Int J Pharm. 2013;456(2):446–458. doi:10.1016/j.ijpharm.2013.08.040
56. Malatesta M, Giagnacovo M, Costanzo M, et al. Diaminobenzidine photoconversion is a suitable tool for tracking the intracellular location of fluorescently labelled nanoparticles at transmission electron microscopy. Eur J Histochem. 2012;56(2):20. doi:10.4081/ejh.2012.20
57. Karimifard S, Rezaei N, Jamshidifar E, et al. pH-responsive chitosan-adorned niosome nanocarriers for co-delivery of drugs for breast cancer therapy. ACS Applied Nano Materials. 2022;5(7):8811–8825. doi:10.1021/acsanm.2c00861
58. Amale FR, Ferdowsian S, Hajrasouliha S, et al. Gold nanoparticles loaded into niosomes: a novel approach for enhanced antitumor activity against human ovarian cancer. Adv Powder Technol. 2021;32(12):4711–4722.
59. Tavano L, Muzzalupo R, Picci N, et al. Co-encapsulation of antioxidants into niosomal carriers: gastrointestinal release studies for nutraceutical applications. Colloids Surf B Biointerfaces. 2014;114:82–88. doi:10.1016/j.colsurfb.2013.09.058
60. Pardakhty A, Varshosaz J, Rouholamini A. In vitro study of polyoxyethylene alkyl ether niosomes for delivery of insulin. Int J Pharm. 2007;328(2):130–141. doi:10.1016/j.ijpharm.2006.08.002
61. Khazaeli P, Pardakhty A, Shoorabi H. Caffeine-loaded niosomes: characterization and in vitro release studies. Drug Deliv. 2007;14(7):447–452. doi:10.1080/10717540701603597
62. Heidari F. Optimization and Characterization of Tannic Acid Loaded Niosomes for Enhanced Antibacterial and Anti-Biofilm Activities. Advanced Powder Technology; 2020.
63. Dash S, Murthy PN, Nath L, et al. Kinetic modeling on drug release from controlled drug delivery systems. Acta Pol Pharm. 2010;67(3):217–223.
64. Bruschi ML. Strategies to Modify the Drug Release from Pharmaceutical Systems. Woodhead Publishing; 2015.
65. Korsmeyer RW, Gurny R, Doelker E, et al. Mechanisms of solute release from porous hydrophilic polymers. Int J Pharm. 1983;15(1):25–35. doi:10.1016/0378-5173(83)90064-9
66. Sadeghi S, Ehsani P, Cohan RA, et al. Design and physicochemical characterization of lysozyme loaded niosomal formulations as a new controlled delivery system. Pharm Chem J. 2020;53:1–10.
67. Balasubramaniam A, Anil Kumar V, Sadasivan Pillai K. Formulation and in vivo evaluation of niosome-encapsulated daunorubicin hydrochloride. Drug Dev Ind Pharm. 2002;28(10):1181–1193. doi:10.1081/DDC-120015351
68. Lawrence M, Chauhan S, Lawrence SM, et al. The formation, characterization and stability of non-ionic surfactant vesicles. STP Pharma Sci. 1996;6(1):49–60.
69. Seras-Cansell M, Ollivon M, Lesieur S. Generation of non-ionic monoalkyl amphiphile-cholesterol vesicles: evidence of membrane impermeability to octyl glucoside. STP Pharma Sci. 1996;6(1):12–20.
70. Pardakhty A, Moazeni E, Varshosaz J, et al. Pharmacokinetic study of niosome-loaded insulin in diabetic rats. DARU J Pharm Sci. 2011;19(6):404.
71. Mirzaie A, Peirovi N, Akbarzadeh I, et al. Preparation and optimization of ciprofloxacin encapsulated niosomes: a new approach for enhanced antibacterial activity, biofilm inhibition and reduced antibiotic resistance in ciprofloxacin-resistant methicillin-resistance Staphylococcus aureus. Bioorg Chem. 2020;103:104231. doi:10.1016/j.bioorg.2020.104231
72. Bhatnagar AS. The discovery and mechanism of action of letrozole. Breast Cancer Res Treat. 2007;105(1):7–17.
73. Dixon J, Renshaw L, Young O, et al. Letrozole suppresses plasma oestradiol (E2) levels more completely than anastrozole in postmenopausal women with breast cancer. Am J Clin Oncol. 2006;24(18_suppl):552.
74. Trunet P, Mueller P, Bhatnagar AS, et al. Open dose-finding study of a new potent and selective nonsteroidal aromatase inhibitor, CGS 20 267, in healthy male subjects. J Clin Endocrinol Metab. 1993;77(2):319–323. doi:10.1210/jcem.77.2.8345034
75. De Boer R, Burris H, Monnier A, et al. on behalf of the H2H trial steering committee. The Head to Head trial: letrozole vs anastrozole as adjuvant treatment of postmenopausal patients with node positive breast cancer. J Clin Oncol. 2006;24(18S):582s.
76. Dombernowsky P, Smith I, Falkson G, et al. Letrozole, a new oral aromatase inhibitor for advanced breast cancer: double-blind randomized trial showing a dose effect and improved efficacy and tolerability compared with megestrol acetate. J Clin Oncol. 1998;16(2):453–461. doi:10.1200/JCO.1998.16.2.453
77. Radwan R, et al. Development and Evaluation of Letrozole-Loaded Hyaluronic Acid/Chitosan-Coated Poly (d, l-Lactide-Co-Glycolide) Nanoparticles. J Pharm Innov. 2021;17:1–12.
78. Wood WG, Igbavboa U, Muller WE, et al. Statins, Bcl-2, and apoptosis: cell death or cell protection? Mol Neurobiol. 2013;48(2):308–314. doi:10.1007/s12035-013-8496-5
79. Yoon O, Roh J. Downregulation of KLF4 and the Bcl-2/Bax ratio in advanced epithelial ovarian cancer. Oncol Lett. 2012;4(5):1033–1036. doi:10.3892/ol.2012.834
80. Hemann M, Lowe S. The p53–Bcl-2 Connection. Nature Publishing Group; 2006.
81. Vaseva AV, Moll UM. The mitochondrial p53 pathway. Biochim Biophys Acta. 2009;1787(5):414–420. doi:10.1016/j.bbabio.2008.10.005
82. Vousden KH, Lu X. Live or let die: the cell’s response to p53. Nat Rev Cancer. 2002;2(8):594–604. doi:10.1038/nrc864
83. Khorani M, Bobe G, Matthews DG, et al. The impact of the hAPP695 SW transgene and associated amyloid-β accumulation on murine hippocampal biochemical pathways. J. Alzheimer’s Dis. 2022;1–19.
84. Costanzo M, Carton F, Marengo A, et al. Fluorescence and electron microscopy to visualize the intracellular fate of nanoparticles for drug delivery. Eur J Histochem. 2016;60(2). doi:10.4081/ejh.2016.2640
85. Varkouhi AK, Scholte M, Storm G, et al. Endosomal escape pathways for delivery of biologicals. J Control Release. 2011;151(3):220–228. doi:10.1016/j.jconrel.2010.11.004
86. Sadeghi Ghadi Z, Ebrahimnejad P. Curcumin entrapped hyaluronan containing niosomes: preparation, characterisation and in vitro/in vivo evaluation. J Microencapsul. 2019;36(2):169–179. doi:10.1080/02652048.2019.1617360
87. Yadavar-Nikravesh M-S, Ahmadi S, Milani A, et al. Construction and characterization of a novel tenofovir-loaded pegylated niosome conjugated with tat peptide for evaluation of its cytotoxicity and anti-hiv effects. Adv Powder Technol. 2021;32(9):3161–3173.
88. Xia X-X, Wang M, Lin Y, et al. Hydrophobic drug-triggered self-assembly of nanoparticles from silk-elastin-like protein polymers for drug delivery. Biomacromolecules. 2014;15(3):908–914. doi:10.1021/bm4017594
89. Akbarzadeh I, Saremi Poor A, Yaghmaei S, et al. Niosomal delivery of simvastatin to MDA-MB-231 cancer cells. Drug Dev Ind Pharm. 2020;46(9):1535–1549. doi:10.1080/03639045.2020.1810269
90. Amiri B, Ebrahimi-Far M, Saffari Z, et al. Preparation, characterization and cytotoxicity of silibinin-containing nanoniosomes in T47D human breast carcinoma cells. Asian Pac J Cancer Prev. 2016;17(8):3835–3838.
91. Kanaani L, Javadi I, Ebrahimifar M, Ebrahimi Shahmabadi H, Akbarzadeh Khiyav A, Mehrdiba T. Effects of cisplatin-loaded niosomal nanoparticleson BT-20 human breast carcinoma cells. Asian Pac J Cancer Prev. 2017;18(2):365. doi:10.22034/APJCP.2017.18.2.365
92. Amiri B, Ahmadvand H, Farhadi A, et al. Delivery of vinblastine-containing niosomes results in potent in vitro / in vivo cytotoxicity on tumor cells. Drug Dev Ind Pharm. 2018;44(8):1371–1376. doi:10.1080/03639045.2018.1451880
 © 2022 The Author(s). This work is published and licensed by Dove Medical Press Limited. The
full terms of this license are available at https://www.dovepress.com/terms
and incorporate the Creative Commons Attribution
- Non Commercial (unported, 3.0) License.
By accessing the work you hereby accept the Terms. Non-commercial uses of the work are permitted
without any further permission from Dove Medical Press Limited, provided the work is properly
attributed. For permission for commercial use of this work, please see paragraphs 4.2 and 5 of our Terms.
© 2022 The Author(s). This work is published and licensed by Dove Medical Press Limited. The
full terms of this license are available at https://www.dovepress.com/terms
and incorporate the Creative Commons Attribution
- Non Commercial (unported, 3.0) License.
By accessing the work you hereby accept the Terms. Non-commercial uses of the work are permitted
without any further permission from Dove Medical Press Limited, provided the work is properly
attributed. For permission for commercial use of this work, please see paragraphs 4.2 and 5 of our Terms.
Recommended articles
From Plant Based Therapy to Plant-Derived Vesicle-Like Nanoparticles for Cancer Treatment: Past, Present and Future

An Y, Sun JX, Ma SY, Xu MY, Xu JZ, Liu CQ, Wang SG, Xia QD
International Journal of Nanomedicine 2025, 20:3471-3491
Published Date: 17 March 2025