")
Back to Journals » Journal of Hepatocellular Carcinoma » Volume 9
Impaired Autophagy Response in Hepatocellular Carcinomas Enriches Glypican-3 in Exosomes, Not in the Microvesicles
Authors Koksal AR, Thevenot P, Aydin Y, Nunez K, Sandow T, Widmer K, Nayak L, Scott J, Delk M, Moehlen MW, Cohen AJ, Dash S
Received 27 May 2022
Accepted for publication 24 August 2022
Published 7 September 2022 Volume 2022:9 Pages 959—972
DOI https://doi.org/10.2147/JHC.S376210
Checked for plagiarism Yes
Review by Single anonymous peer review
Peer reviewer comments 3
Editor who approved publication: Dr Ahmed Kaseb
Ali Riza Koksal,1,2 Paul Thevenot,3 Yucel Aydin,1 Kelley Nunez,3 Tyler Sandow,4 Kyle Widmer,5 Leela Nayak,5 John Scott,1 Molly Delk,2 Martin W Moehlen,2 Ari J Cohen,3,6 Srikanta Dash1,2,5
1Department of Pathology and Laboratory Medicine, Tulane University Health Sciences Center, New Orleans, LA, USA; 2Department of Gastroenterology and Hepatology, Tulane University Health Sciences Center, New Orleans, LA, USA; 3Department of Gastroenterology and Hepatology, Institute of Translational Research, Ochsner Health, New Orleans, LA, USA; 4Department of Radiology, Multi-Organ Transplant Institute, Ochsner Health, New Orleans, LA, USA; 5Southeast Louisiana Veterans Health Care System, New Orleans, LA, USA; 6Department of General Surgery, Multi-Organ Transplant Institute, Ochsner Health, New Orleans, LA, USA
Correspondence: Srikanta Dash, Department of Pathology and Laboratory Medicine, Tulane University Health Sciences Center, 1430 Tulane Avenue, New Orleans, LA, 70112, USA, Tel +1 504-988-2519, Fax +1 504-988-7389, Email [email protected]
Background and Aim: HCC development in liver cirrhosis is associated with impaired autophagy leading to increased production of extracellular vesicles (EVs) including exosomes and microvesicles. The goal of the study is to determine which of these particles is primarily involved in releasing of HCC-specific biomarker glypican-3 (GPC3) when autophagy is impaired.
Methods: Streptavidin-coated magnetic beads were coupled with either biotinylated CD63 or Annexin A1 antibodies. Coupled beads were incubated with EVs isolated from either HCC culture or serum. EVs captured by immuno-magnetic beads were then stained with FITC or PE fluorescent-conjugated antibodies targeting exosomes (CD81), and microvesicles (ARF6). The percentage of GPC3 enrichment in the microvesicles and exosomes was quantified by flow cytometry. The impact of autophagy modulation on GPC3 enrichment in exosomes and microvesicles was assessed by treating cells with Torin 1 and Bafilomycin A1. For clinical validation, GPC3 content was quantified in microvesicles, and exosomes were isolated from the serum of patients with a recent HCC diagnosis.
Results: The immune-magnetic bead assay distinguishes membrane-derived microvesicles from endosome-derived exosomes. The GPC3 expression was only seen in the CD63 beads group but not in the Annexin A1 beads group, confirming that in HCC, GPC3 is preferentially released through exosomes. Furthermore, we found that autophagy induction by Torin1 decreased GPC3-positive exosome secretion and decreased microvesicle release. Conversely, autophagy inhibition by Bafilomycin A1 increased the secretion of GPC3-positive exosomes. Serum analysis showed CD81+ve EVs were detected in exosomes and ARF6+ve vesicles were detected in microvesicles, suggesting that immunoaffinity assay is specific. The exosomal GPC3 enrichment was confirmed in isolated EVs from the serum of patients with HCC. The frequency of GPC3-positive exosomes was higher in patients with HCC (12.4%) compared to exosomes isolated from non-cirrhotic and healthy controls (3.7% and 1.3% respectively, p< 0.001).
Conclusion: Our results show that GPC3 is enriched in the endolysosomal compartment and released in exosome fractions when autophagy is impaired.
Keywords: hepatocellular carcinoma, glypican 3, exosome, biomarker, magnetic beads
Introduction
Mammalian cells release various membrane-enclosed vesicles called extracellular vesicles (EVs). They are called exosomes, amphisomes, microvesicles, and apoptotic bodies.1 Exosomes are 30–150 nm diameter vesicles derived from the endosomal compartment originating from intraluminal vesicles (ILVs) also known as multivesicular body (MVB). The fusion of multivesicular bodies with the cell membrane promotes exosome release.2 Amphisomes are hybrid organelles generated due to the fusion of endosomes with autophagosomes.3 The impaired lysosomal degradation could cause amphisome release. Microvesicles are usually 150–1000 nm in diameter and are released by budding directly from the plasma membrane.4 Apoptotic bodies are generated when cells undergo apoptosis and are bigger in size with a diameter of 500 nm to 2000 nm.5 Autophagy is an intracellular membrane-trafficking lysosomal degradation process that provides both cellular protection and adaptation to cellular stress as well as energy production by degrading endogenous and exogenous materials delivered to the cytoplasm. It also plays a vital role in EV biogenesis and secretion.6 Autophagy and endocytosis are two cellular processes implicated in membrane receptor degradation and recycling, with both pathways terminating in lysosomal degradation.7 These processes are essential for attenuating oncogenic cell signaling and cancer prevention.8 Furthermore, impairment of autophagy leads to hepatocellular carcinoma (HCC) development in several animal models and this effect has been demonstrated in cirrhotic livers with HCC.9,10 Liver-specific deletion of autophagy genes (ATG5 or ATG7) caused a spectrum of hepatic diseases including steatosis, inflammation, fibrosis, hepatomegaly, and HCC.11,12 Moreover, impaired autophagy promotes tumorigenesis in Beclin1 or LkB1 gene knockout mice livers.13,14 Another mouse model showed that impaired autophagy induces hepatocyte dedifferentiation into biliary-like liver progenitor cells which are responsible for the development of HCC.8
The liver plays a central role in maintaining EV concentration in the blood by acting as a natural scavenger, controlling EV uptake and release.15 The release of EVs into the circulation increases with the progression of chronic liver disease due to viral and non-viral etiologies.16 A publication from our laboratory showed that the EV release is increased when autophagy was impaired in the hepatitis C virus (HCV) cell culture model.17 Another research showed that impaired autophagy promotes EVs release by directly fusing autophagic vesicles to the membrane.18 However, EVs in the peripheral circulation are quite heterogeneous since many different tissues actively secrete EVs.2 Ideally, to achieve clinical utility as a surveillance biomarker, the circulating EVs should be HCC-specific.
The GPC3 is a reliable immunohistochemical marker for HCC diagnosis.19 We previously showed that GPC3 accumulates along with an autophagy flux protein p62 in autophagy impaired HCC tissues.20 Given the role of GPC3 in exosome biogenesis and its overexpression in HCC, GPC3 represents an ideal target for EV-mediated HCC surveillance.21,22 The lack of a reliable method to detect EV-associated biomolecules in the native state hinders the widespread clinical use of disease-specific EVs as biomarkers.23 Immuno-magnetic affinity purification of EVs using specific antibodies offers a potential solution.24–26 The assay detects biomolecules in the native stage and uses a minimal amount of serum sample. Annexin A1 and ARF6 are specific markers for microvesicles shed from the plasma membrane and CD63, CD81, and CD9 are exosome markers confirmed in several studies.27–32
Our first aim in this study is to optimize the immuno-magnetic affinity assay for the detection of HCC-specific exosomes using a small volume of serum. This EV-based immune-magnetic affinity assay described here is reliable, and reproducible with a rapid turnaround time appropriate for biomarker testing in a clinical laboratory. Furthermore, we proposed that autophagy impairment plays an essential role in the selection of EV types for carrying HCC-specific cargoes. Understanding this association would allow us to find EV-based biomarkers for diagnosis and treatment response. The second aim of this study is to determine whether the impaired autophagy response in HCC preferentially selects a certain type of EVs for GPC3 release. Our study results indicate that the impaired autophagy response in HCC releases GPC3 predominantly through exosomes, not through microvesicles.
Materials and Methods
Cell Culture and Reagents
Huh-7.5 cell line was obtained from the laboratory of Charles Rice, Rockefeller University. It was cultured in DMEM high glucose with 10% fetal calf serum (FBS), L-glutamine, 1mM sodium pyruvate, and 0.1mM non-essential amino acids with 1% penicillin and streptomycin. Huh-7.5 cells were transfected with CD63-GFP plasmid, and multiple stable cell clones expressing (Huh-7.5-CD63-GFP) were selected using G-418 (Sigma-Aldrich, St. Louis, MO) selection. HepG2 cell line, Human cholangiocarcinoma cell line (HuCCA), and human embryonic kidney cell line (HEK 293) were purchased from ATCC. These two cell lines were cultured according to the instruction provided by the supplier and maintained with media change every three days. Torin 1 was purchased from EMD Millipore, Burlington, MA (475991–10MG), and Bafilomycin A1 was purchased from Cell Signaling Technology, Danvers, MA (54645S). Exosome-free fetal bovine serum was purchased from ThermoFisher, Waltham, MA (A2720803). Monoclonal rabbit and mouse antibodies were used as primary antibodies in Western blot as well as fluorescent microscopy imaging. Anti-CD81 rabbit monoclonal (MA5-13548) and anti-GPC3 rabbit monoclonal (MA5-16368) were purchased from ThermoFisher. Anti-ARF6 rabbit monoclonal (5740S) and anti-Beta actin rabbit monoclonal rabbit (4970S) were purchased from Cell Signaling. Anti-TSG 101 mouse monoclonal (sc-7964) was purchased from Santa Cruz Biotechnology. All pictures were captured at the same exposure time. We used Huh7.5 cells in all IF experiments and they were negative for GFP.
EV Purification from Cell Culture Supernatant
Cells were cultured in exosome-depleted media for three days prior to EV analysis. Briefly, cellular debris was removed from the culture supernatant by centrifugation at 2000 g for 30 minutes. Cleared supernatants were transferred to a new tube and mixed with 0.5 volumes of total EV isolation reagent from Invitrogen Carlsbad, CA (4478359). Tubes were incubated at 4℃ overnight. The following day samples were centrifuged at 10,000 g for one hour at 4 ℃. The resulting supernatant was carefully removed, and the EV pellet was resuspended in phosphate buffer saline (PBS) and stored at −20℃. EVs concentration and size distribution were determined using NanoSight (Model NTA3300 with 532 nm green laser module, Malvern, Worcestershire, UK). Biotin anti-human CD63 antibody (Clone: H5C6) was purchased from BioLegend, San Diego, CA (353018). Biotin-conjugated Annexin A1 antibody was purchased from FabGennix Frisco, TX (ANXA1-BIOTIN). Anti-GPC3 (sc-390587 AF488), Anti-ARF6 (sc-7971 FITC), and Anti-CD81 (sc-166029 PE) were purchased from Santa Cruz Biotechnology, Santa Cruz, CA.
Immuno-Magnetic Bead-Based Affinity Flow Cytometry
Streptavidin-coated magnetic beads were purchased from Invitrogen Carlsbad, CA (10608D). Beads were prewashed in PBS and then incubated with biotinylated antibodies for one hour. Antibodies to CD63 or Annexin A1 were used at a proportion of 4 µ g/1x107 of beads. Antibody-conjugated beads were washed twice using PBS with 1% Bovine Serum Albumin (BSA) to block the nonspecific bindings sites. Twenty microliters of antibody-coupled beads were incubated with a 100 µL final volume of cell culture-derived EVs overnight at 4℃ by rotating. The following protocol was used for immuno-magnetic separation of EVs in human serum. Serum samples were centrifuged briefly at 2000 rpm for 5 minutes to remove debris. Ten microliters of serum were diluted in 100 µL PBS and directly incubated with immuno-magnetic beads to capture EVs in the native form. The next day, the EV-bead complex was kept in a magnetic stand and washed twice using PBS with 1% BSA. Following this step, the EV-bead complex was incubated with fluorescence-labeled antibodies (1:500) diluted in 100 µL of blocking buffer for one hour at room temperature. Beads were washed in PBS 1% BSA and then analyzed on a Becton-Dickinson flow cytometer (BD FACS Celesta) using BD FACSDiva Software 6.0, San Jose, CA. Advanced flow cytometry analyses and graph productions were performed using Flowing Software version 2.5.1 developed by Turku Bioscience (Turku, Finland). We used biotinylated CD63 or biotinylated Annexin A1 to couple to magnetic beads, then we used different fluorophore-conjugated antibodies to increase sensitivity and specificity for detection of exosome or microvesicle subpopulations. CD81 is an exosome-specific marker and ARF6 is a marker specific for microvesicles. We selected biotinylated antibodies CD63 and Annexin A1 for coupling to streptavidin-coated magnetic beads because biotin-conjugated antibodies for these two are readily available. We could not find a vendor who sells biotinylated ARF6 and CD81 antibodies.
Serum Cohort Study
Peripheral blood specimens from HCC patients were obtained through a prospective study approved by the Ochsner Health Institutional Review Board (IRB) (protocol 2016.131.B) and included 25 patients. Serum samples from cirrhotic patients and healthy individuals were obtained through a prospective study approved by the Tulane University IRB (Protocol 2017–197) and included 25 patients in each group. The HCC serum sample used in this investigation were obtained from a tertiary transplant center at Ochsner Clinic. This center usually follows patients who have cirrhosis and their pre-t BCLC stage A or B. All the patients were on their transplant list. We believe that this assay should be sensitive for the detection of stage C and D HCC.
All HCC cases were diagnosed by biopsy or CT/MRI meeting the Liver Imaging Reporting and Data System (LI-RADS) criteria. According to Barcelona classification, all cases were in stage A or B and were inside the Milan criteria. This study was also conducted by the Declaration of Helsinki. Serum samples were obtained from patients who have F3/4 liver fibrosis due to non-alcoholic steatohepatitis (NASH) diagnosed by Tulane University Gastroenterology and Hepatology department. Serum samples were used for control group analysis which are collected from age and sex-matched healthy individuals with no existing liver-related diagnosis.
Western Blot
Western blotting was performed using a standard protocol established in our laboratory. Cultured cells were harvested by the treatment of trypsin- EDTA (Life Technologies, Carlsbad, CA, USA) at different time points and were washed twice with PBS, then lysed in ice-cold RIPA buffer (Sigma-Aldrich, St. Louis, MO, USA) with a protease inhibitor (ThermoFisher Scientific, Waltham, MA, USA) and phosphatase inhibitor cocktail (Sigma-Aldrich, St. Louis, MO, USA). The total protein content of the extract was quantified using NanoDropTM 2000 (ThermoFisher Scientific, Waltham, MA, USA). Cell lysates (approximately 20 μg of protein) were loaded by SDS-PAGE and transferred into a nitrocellulose membrane (0.45 μm pore-size, ThermoFisher Scientific, Waltham, MA, USA). The membrane was blocked using 0.05 g/mL blotting-grade milk powder (Bio-Rad, Hercules, CA, USA) for two hours at room temperature, then incubated with a primary antibody for overnight incubation on an orbital shaker at 4℃. After overnight incubation, the antigen-antibody complex was visualized with HRP-conjugated goat anti-rabbit or anti-mouse IgG (Cell Signaling, Beverly, MA, USA), then developed with an ECL detection system (SupersignalTM West Pico PLUS, ThermoFisher Scientific, Waltham, MA, USA) using the Bio-Rad ChemiDoc imaging system. ImageJ software version 1.52p (NIH, Bethesda, MD, USA) was used to process the images derived from Western blot and immunostaining.
Statistical Analysis
Statistical analysis was performed using GraphPad Prism software version 8 (GraphPad Software, Inc., La Jolla, CA, USA). All experiments were performed 3 independent times with fresh cultures of cells each time to obtain 3 replicates. The variables were investigated using visual (histograms, probability plots) and analytical methods (Kolmogorov–Smirnov/Shapiro–Wilk tests) to determine whether they were normally distributed. Kruskal–Wallis test was used to compare exosomal concentration, size, and expression of GPC3, AR6, and CD81 in healthy, cirrhosis, and HCC groups. A value of P < 0.017, calculated by Bonferroni correction, was considered statistically significant in this triple comparison. The Mann–Whitney U-test was used to evaluate differences between the two study subgroups. The statistical significance was shown as ns P>0.05, *P < 0.05, **P < 0.01, ***P < 0.001.
Results
Immuno-Magnetic Affinity Assay for Capturing Microvesicles and Exosomes
The procedure for isolating microvesicles and exosomes is outlined in Figure 1A. The immuno-magnetic beads were prepared by mixing streptavidin-conjugated magnetic beads with biotinylated antibodies followed by blocking and incubation directly with the serum for EV capture. In the final step, FITC-labeled CD81 antibodies or PE-labeled ARF6 antibodies were added (Figure 1B). After protocol validation, the input volume was gradually decreased to an assay minimum volume of 10 μL of serum. There was no effect on assay sensitivity as the volume increased above 10 μL input. An added EV purification step was investigated before the immuno-magnetic affinity assay however the additional step did not provide increased assay sensitivity (Supplementary Figure 1). Forward Scatter (FSC)/Side Scatter (SSC) signals plots were used to identify bead-EVs complexes while excluding bead aggregates or debris (Figure 2A). The effectiveness of streptavidin-biotin binding was assessed by incubating streptavidin-coated beads with biotinylated FITC or biotinylated PE fluorochrome. A stronger signal representing 91.6% positivity and 97.7% was observed when FITC-conjugated biotin and PE-conjugated biotin were used, respectively (Figure 2B). These data confirmed that the binding capacity of the streptavidin-coated magnetic beads used in our assay is comparable. The specificity of the assay in detecting the exosomes and microvesicles in HCC cell culture was determined. As shown in Figure 2C, the affinity isolation method can distinguish microvesicles (ARF6+/ CD81-) from exosomes (ARF6-/ CD81 +). While the expression of CD81 was significantly higher in the CD63-coupled beads group than in the Annexin A1 group (92.6% and 1.7% respectively, p<0.001), ARF6 expression was predominantly seen in the Annexin A1 group (0.2% and 29.6% respectively, p<0.01). The segregation of CD81 to the CD63 isolations and ARF6 to the Annexin A1 isolation confirms assay efficiency in generating pure populations of exosomes and microvesicles with negligible cross-contamination (Figure 2D).
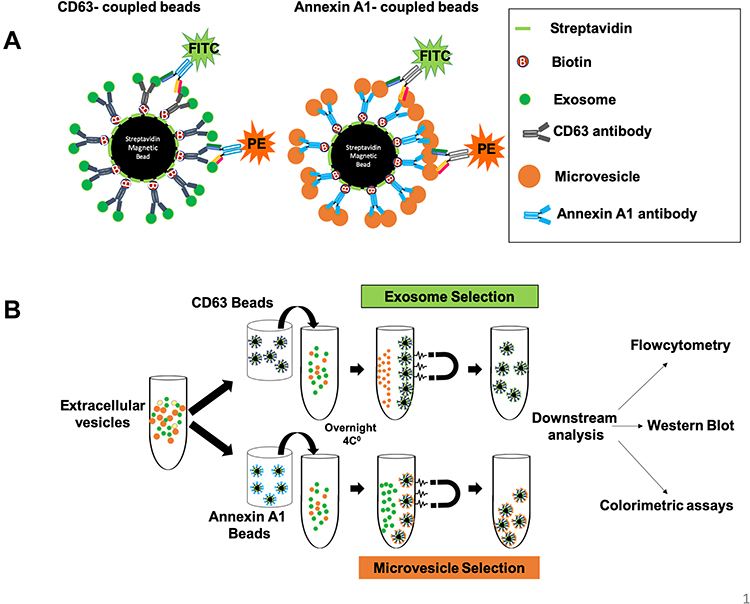 |
Figure 1 Schematic diagram of immuno-magnetic affinity assay used for isolation of exosomes and microvesicles. (A) Four micron-diameter streptavidin magnetic beads were coated with biotin-labeled antibodies used to capture exosomes and microvesicles. A fluorescence [Fluorescein isothiocyanate (FITC) or Phycoerythrin (PE)] labeled antibody was used for the detection of exosomes and microvesicles by flow cytometry. (B) Represents the actual steps used to purify exosomes or microvesicles in their native stage. Serum samples were diluted in PBS and centrifuged briefly to remove debris. Then serum samples were incubated with antibody-coated magnetic beads for overnight incubation at 4℃ to capture exosomes/microvesicles. The next day, exosomes and microvesicles were selected by using a magnetic stand. Beads were washed two times using 500 microliters of PBS with 1% BSA. The captured exosomes or microvesicles were then stained with fluorescence-labeled CD81 or ARF6 antibodies for one hour. After this step, tubes were kept on a magnetic stand, and they were washed two times. The beads were resuspended in 500 microliters of PBS with 1%BSA and analyzed by a flow cytometer. For Western blot analysis, the beads containing exosomes or microvesicles from step one were directly lysed in RIPA buffer, and Western blot analysis was performed using peroxidase-labeled antibodies. |
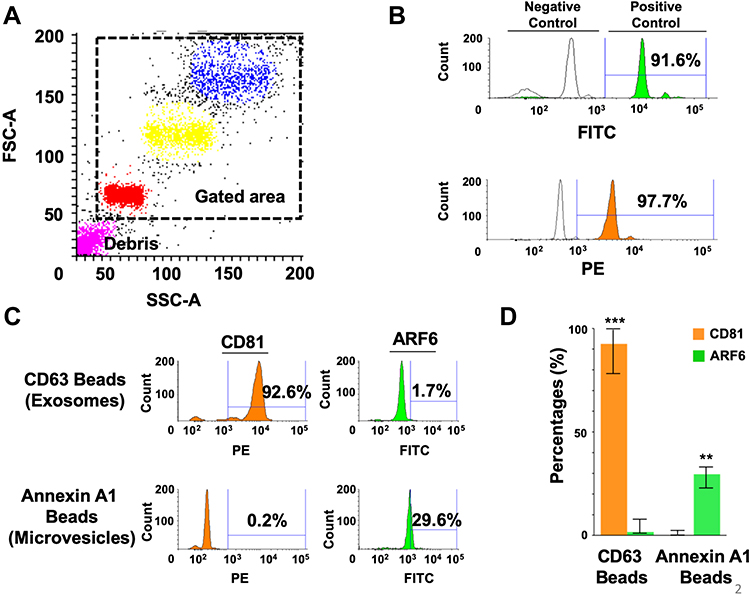 |
Figure 2 Show the specificity of the immune-magnetic bead method used to isolate exosomes and microparticles. (A) Show gating strategy of streptavidin-labeled magnetic beads used by flow cytometry using Phycoerythrin (PE)-labeled biotin or Fluorescein isothiocyanate (FITC)-labeled biotin. The forward scatter (FSC), and side scatters (SSC) data were used to gate for a single population of beads for analysis, avoiding clumped beads. (B) Show the percentage of magnetic beads conjugation with streptavidin using FITC-Biotin and PE-Biotin. (C) Validation of immune-magnetic affinity isolation methods using extracellular vesicles isolated from Huh-7.5 cell culture. A very high percentage of exosomes were detected by using CD63 antibody-coated magnetic beads. A very high rate of ARF6 positive microvesicles was seen using Annexin A1 coated beads. (D) Show reproducibility of the assay separating exosomes from microvesicles. The results are expressed as the mean percentage ± standard deviation and analyzed by Mann Whitney U-test. **P < 0.01, ***P < 0.001. |
GPC3 is Enriched in Exosomes, Not in Microvesicles
We previously showed that GPC3 expressing exosomes can be detected in the serum of patients with HCC cirrhosis.33 Solid malignancies, including HCC, excrete both exosomes and microvesicles but which type of particle is selected by HCC for releasing GPC3 is not elucidated. Using the immuno-magnetic affinity assay, we examined both EV fractions in HCC cell culture supernatants. We found that 53.4% of the CD63 conjugated bead population was positive for GPC3 with 92.8% of the events positive for the exosome marker CD81 (Figure 3A). In contrast, only 0.9% of Annexin A1-conjugated beads were positive for GPC3 prominently expressing the ARF6 microvesicle marker at 45.7% (Figure 3A). This confirms that GPC3 is specifically enriched in exosome fractions of HCC-derived EVs. These results were confirmed in exosome and microvesicle digests using Western blot (Figure 3B), where a prominent GPC3 signal is observed in the total EV digest and specifically enriched in the CD63 exosome fraction. The relative intensity of Western blot signals shows preferential enrichment of GPC3 in exosomes (Figure 3C).
 |
Figure 3 Show immune-magnetic affinity isolation detect GPC3 in HCC cell culture-derived exosomes, not in the microvesicles. (A) Detection of exosomes and microvesicles in the extracellular vesicles isolated from HCC cell culture. First, EVs were isolated from HCC cell culture using by total exosome isolation reagent. Second, exosomes and microvesicles were selected from total EVs using CD63 or Annexin A1 antibodies conjugated magnetic beads. Immuno-affinity capture exosomes or microvesicles were stained with Alexa Fluor 488 labeled GPC3. Approximately 53.4% of CD63 conjugated magnetic beads show positive for GPC3 as compared to 0.9% of Annexin A1 conjugated beads. About 92.8% of CD63 beads show positive for CD81, as compared to 45.7% of Annexin A1 beads. (B) Western blot analysis shows the distribution of GPC3 in the total non-selected and selected EVs. (C) The bar graph represents the relative intensity of GPC3 proteins according to particle-specific protein bands in Western blot. The results are expressed as the mean intensity ± standard deviation and analyzed by Mann Whitney U-test. *P < 0.05, **P < 0.01. |
Only Hepatocellular Carcinoma Cell Lines Secrete GPC3-Positive Exosomes
To confirm that GPC3 expressing exosomes were specific to HCC, EVs were isolated from the culture supernatants of two HCC lines (Huh-7.5 and HepG2), a cholangiocarcinoma cell line (HuCCA), and a kidney cell line (HEK293). GPC3 content was quantified by flow cytometry following immuno-magnetic affinity isolation using (Figure 4A). In representative isolation, GPC3 expression after confirming CD81 purity was present in 57% of exosomes from Huh-7.5 and 29% of exosomes of HepG2 with negligible signal in the exosomes of HuCCA (2%) and HEK293 (1%) cells. Flow cytometry data from each independent assay among the different cell lines consistently confirmed the release of GPC3-positive exosomes was specific to HCC (Figure 4B). To confirm the lack of GPC3 signal in the HuCCA and HEK293 cells was not due to differences in total EV production, the EV concentration and size from each cell line were confirmed using nanoparticle tracking analysis. The EV concentration and size were consistent and similar among each cell line investigated (Figures 4C and D), with similar morphology observed in representative images from each isolation (Figure 4E). Collectively, these results confirm that GPC3 expressing exosomes are specific to HCC.
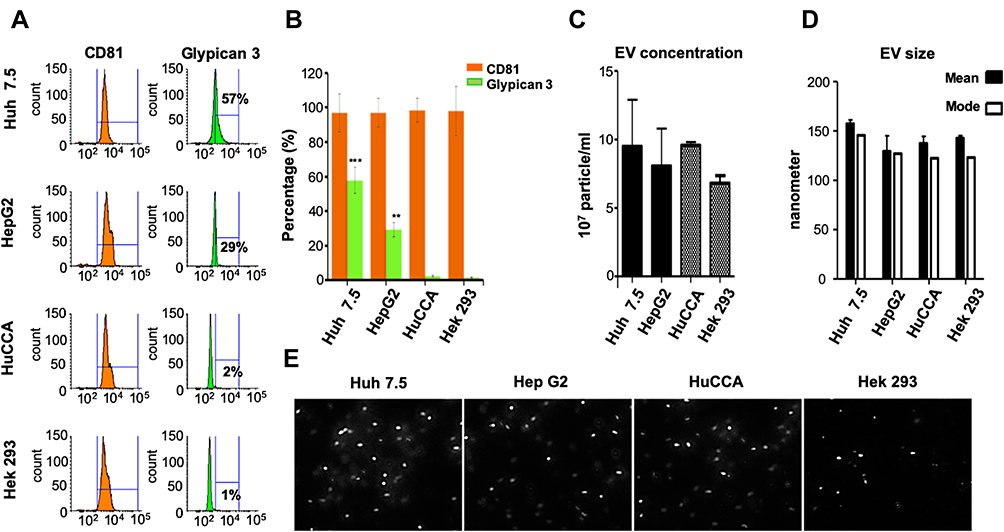 |
Figure 4 Immuno-magnetic bead assay detects GPC3 in HCC exosomes, not exosomes secreted by cholangiocarcinoma (HuCCA) or human embryonic kidney cells (HEK293). (A) GPC3 detection in exosomes isolated from two HCC cell lines. GPC3 was not detected in exosomes isolated from non-HCC cell lines (HuCCA or HEK293). (B) The bar graph represents the relative distribution of GPC3 and CD81 among HCC and non-HCC cultures. Data indicate mean ± standard deviation and are analyzed by the Mann–Whitney U-test. P values were displayed as **P<0.01, ***P<0.001. (C) Shows the concentration of EVs isolated from hepatic and non-hepatic culture by NanoSight. (D) The bar graph shows the mean and mode of EV sizes derived from hepatic and non-hepatic cell cultures. (E) Representative images of different cell culture-derived EVs were captured from actual videos of Nanoparticle tracking analysis. |
Autophagy Induction Degrades GPC3, Whereas Autophagy Inhibition Accumulates Its Expression in HCC Cells
We recently showed that cultured hepatoma cells undergo autophagy-mediated EV release after hepatitis C infection.17 To investigate the role of autophagy in the release of exosomes containing GPC3 in HCC, we examined the GPC3 expression after treatment with autophagy inducer (Torin 1) and inhibitor (Bafilomycin A1). As Torin 1 concentration increased, the CD63-GFP construct progressively degraded compared to treatment with Bafilomycin A1 which stabilized and augmented CD63-GFP expression (Figures 5A and 5B). To confirm that productive autophagy resulted in EV degradation, HCC cells were stained for the exosome-associated proteins GPC3 and Tsg101. In agreement with CD63-GFP expression patterns, Torin 1 induction decreased GPC3 and Tsg101, while Bafilomycin A1 augmented the expression of both markers within HCC cells (Figure 5C). Exosome degradation and loss of GPC3 expression after autophagy induction and augmentation after autophagy inhibition were confirmed at the protein level by Western blot (Figure 5D). This data collectively confirms that GPC3 is enriched in the endolysosomal compartment and released in exosome fractions when autophagy is impaired.
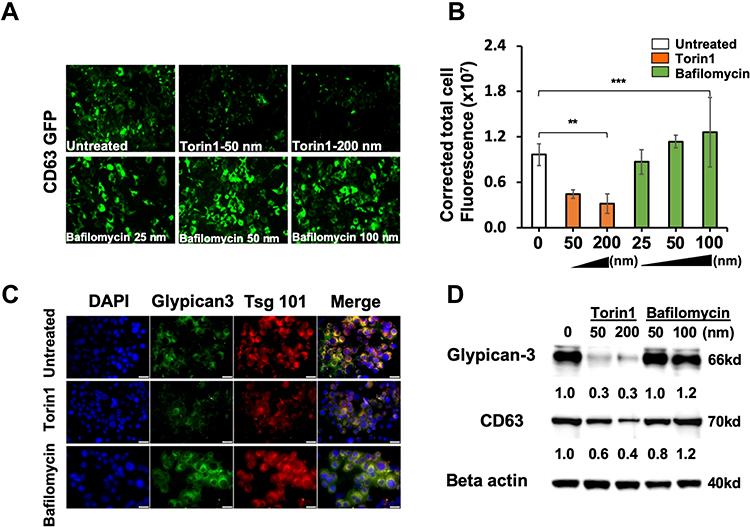 |
Figure 5 Impaired autophagy promotes GPC3 accumulation in exosomes. CD63-GFP stable cell line was treated with increasing concentrations of Torin 1 or Bafilomycin A1 for 72 hours. (A) Demonstrate the expression of CD63-GFP in Torin 1 treated and Bafilomycin A1 treated by fluorescence microscopy. (B) Quantification of CD63-GFP expression in Torin 1 and Bafilomycin A1 treated culture by Image J software. (C) Fluorescence microscopy images show the expressions of GPC3, and Tsg 101 in Torin 1 and Bafilomycin A1 treated cells. (D) Western blot analysis shows autophagy induction by Torin 1 leads to GPC3 and CD63 degradation. Data indicate mean ± standard deviation and are analyzed by the Mann–Whitney U-test. P values were displayed as **P<0.01, ***P<0.001. |
Autophagy Induction Decreases GPC3-Positive Exosomes, Whereas Autophagy Inhibition Increases GPC3-Positive Exosomes
Nanoparticle tracking and the immuno-magnetic affinity assay were then used to confirm the release of exosomes and microvesicles to the culture supernatant following autophagy induction and inhibition. Representative nanoparticle tracking size histograms and images confirm the presence of exosomes with autophagy modulation (Figure 6A). In agreement with the intracellular molecular analysis, supernatant exosome concentration decreased with Torin1 treatment while Bafilomycin A1 treatment at 100 nM triggered a significant increase in EV concentration (Figure 6B). The immuno-magnetic affinity assay confirmed exosomes generated with Bafilomycin A1 retain CD63 expression while co-expressing both CD81 and GPC3 (Figure 6C). Autophagy induction completely abrogated microvesicle release compared to untreated and Bafilomycin A1 groups although an absence of GPC3 in microvesicle content was consistent across all treatment groups. These findings confirm the intracellular molecular analysis, that HCC cells produce and release GPC3 exosomes, and that this effect is exacerbated when autophagy is impaired.
 |
Figure 6 Impact of autophagy on exosome and microvesicle production in HCC cell culture. (A) Huh-7.5 cells were treated with an autophagy inducer (Torin 1) and autophagy inhibitor (Bafilomycin A1). Total EVs were isolated from Huh-7.5 cells by total exosome isolation reagent (Invitrogen). Nanoparticle tracking analysis showing the actual view of concentration and size of EV preparation. (B) Shows EV size and concentration in Huh-7.5 cells treated with Torin 1 and Bafilomycin A1. (C) Shows the impact of autophagy on exosome and microvesicle production determined by the immune-magnetic affinity isolation method. Autophagy induction decreased the production of exosomes, whereas autophagy inhibition increased exosome production. Autophagy modulation has a similar effect on microvesicle production. Autophagy induction decreased GPC3 positive exosomes. Data indicate mean ± standard deviation and are analyzed by the Mann–Whitney U-test. P values were displayed as ns P>0.05, *P<0.05, **P<0.01, ***P<0.001. |
GPC3 Enriched Exosomes Were Detected in Cirrhotic Patients Who Developed HCC
For clinical validation of EV-associated GPC3 expression in HCC cirrhosis, we assembled a serum cohort from healthy individuals, patients who have liver cirrhosis with and without HCC (n = 25 per group, total n = 75). First, a nanoparticle analysis was used to confirm EV concentration and size distribution, with exosome and microvesicle GPC3 expression characterized in a 10 μL serum isolate (Figure 7A). EV concentration trended higher with progression to cirrhosis and HCC cirrhosis with no observed effect on the EV size distribution (Figure 7B). Second, the immune-affinity assay was utilized to measure GPC3, CD81, and ARF6 positive vesicles in exosome and microvesicle populations among three groups of serum cohorts. GPC3 positive vesicles were detected in exosome fractions, not in the microvesicles. We found that the mean exosomal GPC3 expression was significantly higher in the HCC group than either in the cirrhosis or control group (12.4% ± 2.4, 3.7% ± 0.6, and 1.3% ± 0.2 respectively, p<0.001). In contrast, GPC3 detection in microvesicles was minimal using Annexin A1 coupled magnetic beads (Figure 7C) (n = 10 per group, total n = 30). Likewise, CD81 positive vesicles were exclusively detected in exosome fractions of normal, cirrhosis, and HCC serum. CD81 positive vesicles were absent in the microvesicle fraction confirming assay specificity (Figure 7D). To make sure that the low detection of microvesicles using CD81 beads is not due to differences in EV preparation, the same set of samples was analyzed using AnnexinA1 beads and ARF6 positive vesicles were quantified by flow analysis. ARF6 positive vesicles were adequately detected in microvesicle fractions of healthy, cirrhosis, and HCC samples. ARF6 positive vesicles were not detected in exosome fractions of normal, cirrhosis, and HCC serum samples. (Figure 7E) (n = 5 per group, total n = 15). These serum results confirm that GPC3-positive vesicles were detected in exosomes by immuno-magnetic affinity assay and absent in microvesicles. The immunoaffinity assay can detect HCC exosomes in a small volume of serum.
 |
Figure 7 GPC3 detection in exosomes and microvesicles using serum samples from patients with HCC. Validation studies show GPC3 enriched in exosomes, not in the microvesicles of HCC patients. Immuno-magnetic isolation protocol for the detection of GPC3 using 10µL of serum samples from healthy liver cirrhosis without and with HCC . (A) Nanosight view of EVs isolated from healthy control, cirrhosis, and HCC. (B) Show the concentration and size of EVs isolated from 10µL of serum from healthy control, cirrhosis without, and with HCC. (C) Show the GPC3 enrichment in exosomes (CD63 coupled beads) and microvesicles (Annexin A1 coupled beads) isolated from serum samples. Immuno-magnetic affinity isolation of microvesicles shows a negative expression of GPC3. (D) Show CD81 detection in exosomes and microvesicles derived from healthy controls, liver cirrhosis, and HCC patients. (E) The line plot graphs demonstrate ARF6 expression in serum samples incubated with Annexin A1 or CD63 coupled beads. Kruskal–Wallis test was used to compare the expression of GPC3, AR6, and CD81 in healthy, cirrhosis, and HCC groups. A value of P < 0.017 was considered statistically significant in this triple comparison (nsP >0.017). The Mann–Whitney U-test was used to evaluate differences between the two study subgroups. The statistical significance was shown as, **P < 0.01, ***P < 0.001. |
Discussion
EV biology has risen to the cutting edge of biomedical research and translational medicine. Although EVs production has been observed in various disease conditions, the potential for EVs to contain biomolecules associated with a cancer prognosis or early detection has attracted significant attention.34 However, the molecular composition of circulating EVs is quite heterogeneous and has complicated identifying cancer-derived exosomes as well as candidate biomarkers in either the EV contents or on the EV surface.35 Our study aims to investigate whether GPC3, which is a reliable diagnostic tissue marker of HCC, is expressed in exosomes or microvesicles and its relationship with autophagy impairment in HCC cases. Moreover, we aimed to validate the purity and specificity of the immuno-magnetic affinity assay and its translatable applications in characterizing EV-associated biomarkers in clinical specimens. As research into EV biology has expanded so have the methods for EV isolation and analysis. Although ultracentrifugation remains the most common method, sample turnaround and throughput limitations are likely not feasible for clinical translational.36 Direct precipitation of EVs offers a practical alternative but sacrifices sample purity and may introduce biomolecular contaminates. For clinical translation, EV assays will require high sensitivity and reliability while remaining cost-effective with high-throughput capabilities.28,29,32,37–41 We developed a sensitive and reproducible method for identifying exosomes and microvesicles and their molecular features to address these limitations. The immuno-magnetic beads allow for higher sample purity by increasing the wash capacity by substantially decreasing the wash time compared to ultracentrifugation.42–46 As a proof of principle, we showed that our modified immuno-magnetic affinity assay can accurately isolate and differentiate exosomes from microvesicles. Further, this method requires minimal whole blood volume, utilizing only 10µL of serum, and was designed to be complex with conventional clinical flow cytometry. We selected microvesicles and exosomes since their release is directly regulated by autophagy. Besides that, these vesicles are found in circulation in relatively high concentrations. Apoptotic bodies are not stable since they are taken by macrophages and the reticuloendothelial system that perform phagocytosis of dead cells. The role of amphisome release in liver disease is not well understood. We found a difference between the quantification of exosomes (CD81 positive) and microvesicles (ARF6 positive) in HCC cell culture using CD63 and Annexin A1 beads respectively. There may two reasons for seeing this difference. First, the impaired autophagy response in Huh7.5 cells releases more exosomes than microvesicles. This is supported by human serum data showing that GPC3 positive liver-derived exosome number is high in HCC patients and microvesicles are low. The GPC3 positive liver-derived exosomes are low in healthy control, whereas the microvesicles number are high in healthy individuals as compared to HCC. Second, it is also possible that the number of ARF6 molecules expressed in the microvesicle is lower than the number of CD81 molecules expressed in the exosome. We propose future research in this area will clarify how impaired autophagy regulates exosome and microvesicle release.
Glypicans are heparan sulfate proteoglycans (HSPGs) attached to the extracellular surface of the plasma membrane through a glycosyl-phosphatidylinositol (GPI) anchor.47–49 While there are six members of glypicans (GPC1-6), GPC3 is the most investigated one in the literature.50 GPC3 plays a role in endocytosis and degradation of GPC3- Hedge-hog (Hh) Complex.51 The low-density-lipoprotein-related receptor-1 (LRP-1) mediates the Hh-induced endocytosis of the GPC-Hh Complex.52 Our data agree with this report, showing that inducing autophagy in HCC promotes the fusion of endosome-autophagosome-lysosome and GPC3 degradation. Besides, impaired autophagy prevents GPC3 degradation leading to its accumulation in multivesicular bodies and release through exosomes in HCC. Our laboratory recently showed that exosomal GPC3 is closely related to the impairment of autophagy by using ELISA analysis of HCC samples.33 However, using the immuno-magnetic affinity assay, we show that GPC3 is restricted to the exosomal EV fraction both in the hepatoma cell lines and in the HCC samples. This suggests that GPC3 plays a major role in the biogenesis of multivesicular bodies and exosome release.53 Exosome-associated GPC3 was confined to HCC cell lines where exosome production could be modulated by promoting or inhibiting autophagy. GPC3-expressing exosomes could be detected in a cohort of patients with recently diagnosed, early-stage HCC. Additionally, GPC3-expressing exosomes were also detected in a subgroup of patients with cirrhosis. This result justifies investigating GPC3 exosomes as a potential biomarker for HCC surveillance and early detection. The development of serum exosome-based biomarkers that measure the impaired autophagy response in the liver could be a powerful marker for HCC detection and treatment. In this regard, understanding the autophagy-related control mechanisms of the exosome and microvesicle release remains an important area of investigation.
Hepatocellular carcinoma (HCC) is a major type of liver cancer that develops in the background of cirrhosis after several decades of chronic liver disease due to viral and non-viral etiologies.19 Chronic exposure to viral and non-viral agents induces an integrated stress response which changes the cellular plasticity and cell fate.10,54 At present many oncogenic processes have been implicated in HCC development including loss of tumor suppressors, angiogenesis, the immunosuppressive microenvironment in cirrhotic liver, inflammation, epigenetics modifications, and cancer stem cells. In addition, emerging new evidence indicates that angiogenesis and immunosuppressive microenvironment are frequently involved in HCC development.55,56 The combination of anti-antiangiogenic drugs with immune check-point inhibitors increases the success of HCC treatment. A plethora of second-line therapies using regorafenib and cabozantinib has been recently introduced for HCC treatment showing promising results.57 We propose that the immune-magnetic affinity assay for quantification of GPC3 as well as other molecules related to another oncogenic signaling in peripheral blood can be used to monitor response to new lines of immunotherapy treatment. However, the mechanism of HCC development in liver cirrhosis is not well understood. A deeper understanding of molecular mechanisms and how changes in hepatocellular plasticity promote HCC development in liver cirrhosis will allow the selection of accurate biomarkers.
Conclusion
The results show that immuno-magnetic bead-based detection of HCC exosomes provides a valuable and sensitive method that can be utilized to study the role of GPC3 expressing exosomes in the early diagnosis of HCC and treatment response. This method can be scaled to include a combination of EV-associated biomarkers, including those linked to impaired autophagy. Multi-biomarker exosome panels may provide a link between HCC biomarker expression and molecular aberrations associated with impaired autophagy which may have important implications for prognosis and risk of disease progression.
Acknowledgments
The authors acknowledge our collaborators who have supplied reagents and supported our research in the hepatitis research laboratory at Tulane University Health Sciences Center. This work was directly supported by Veterans Affairs Merit Review Grant: 1I0IBX004516-01A1 and Louisiana Clinical and Translational Science (LACaTS) Center Grant: U54GM104940.
Disclosure
Dr Paul Thevenot reports grants from The American Society of Transplant Surgeons, during the conduct of the study; grants from Society of Interventional Oncology, grants from FUJIFILM Wako Diagnostics, grants from Boston Scientific, outside the submitted work. The authors report no other conflicts of interest in this work.
References
1. Battistelli M, Falcieri E. Apoptotic bodies: particular extracellular vesicles involved in intercellular communication. Biology. 2020;9(1). doi:10.3390/biology9010021
2. van Niel G, D’Angelo G, Raposo G. Shedding light on the cell biology of extracellular vesicles. Nat Rev Mol Cell Biol. 2018;19(4):213–228. doi:10.1038/nrm.2017.125
3. Lie PPY, Yoo L, Goulbourne CN, et al. Axonal transport of late endosomes and amphisomes is selectively modulated by local Ca(2+) efflux and disrupted by PSEN1 loss of function. Sci Adv. 2022;8(17):eabj5716. doi:10.1126/sciadv.abj5716
4. Mathieu M, Martin-Jaular L, Lavieu G, Théry C. Specificities of secretion and uptake of exosomes and other extracellular vesicles for cell-to-cell communication. Nat Cell Biol. 2019;21(1):9–17. doi:10.1038/s41556-018-0250-9
5. Malhi H. Emerging role of extracellular vesicles in liver diseases. Am J Physiol Gastrointest Liver Physiol. 2019;317(5):G739–g749. doi:10.1152/ajpgi.00183.2019
6. Leidal AM, Debnath J. Emerging roles for the autophagy machinery in extracellular vesicle biogenesis and secretion. FASEB Bioadv. 2021;3(5):377–386. doi:10.1096/fba.2020-00138
7. Birgisdottir ÅB, Johansen T. Autophagy and endocytosis - interconnections and interdependencies. J Cell Sci. 2020;133(10). doi:10.1242/jcs.228114
8. Barthet VJA, Brucoli M, Ladds M, et al. Autophagy suppresses the formation of hepatocyte-derived cancer-initiating ductular progenitor cells in the liver. Sci Adv. 2021;7(23). doi:10.1126/sciadv.abf9141
9. Chava S, Lee C, Aydin Y, et al. Chaperone-mediated autophagy compensates for impaired macroautophagy in the cirrhotic liver to promote hepatocellular carcinoma. Oncotarget. 2017;8(25):40019–40036. doi:10.18632/oncotarget.16685
10. Niture S, Lin M, Rios-Colon L, Qi Q, Moore JT, Kumar D. Emerging roles of impaired autophagy in fatty liver disease and hepatocellular carcinoma. Int J Hepatol. 2021;2021:6675762. doi:10.1155/2021/6675762
11. Lee YA, Noon LA, Akat KM, et al. Autophagy is a gatekeeper of hepatic differentiation and carcinogenesis by controlling the degradation of Yap. Nat Commun. 2018;9(1):4962. doi:10.1038/s41467-018-07338-z
12. Takamura A, Komatsu M, Hara T, et al. Autophagy-deficient mice develop multiple liver tumors. Genes Dev. 2011;25(8):795–800. doi:10.1101/gad.2016211
13. Nakau M, Miyoshi H, Seldin MF, Imamura M, Oshima M, Taketo MM. Hepatocellular carcinoma caused by loss of heterozygosity in Lkb1 gene knockout mice. Cancer Res. 2002;62(16):4549–4553.
14. Qu X, Yu J, Bhagat G, et al. Promotion of tumorigenesis by heterozygous disruption of the beclin 1 autophagy gene. J Clin Invest. 2003;112(12):1809–1820. doi:10.1172/jci20039
15. Németh K, Varga Z, Lenzinger D, et al. Extracellular vesicle release and uptake by the liver under normo- and hyperlipidemia. Cell Mol Life Sci. 2021;78(23):7589–7604. doi:10.1007/s00018-021-03969-6
16. Momen-Heravi F, Saha B, Kodys K, Catalano D, Satishchandran A, Szabo G. Increased number of circulating exosomes and their microRNA cargos are potential novel biomarkers in alcoholic hepatitis. J Transl Med. 2015;13:261. doi:10.1186/s12967-015-0623-9
17. Aydin Y, Koksal AR, Reddy V, et al. Extracellular vesicle release promotes viral replication during persistent HCV infection. Cells. 2021;10(5):984. doi:10.3390/cells10050984
18. Xu J, Yang KC, Go NE, et al. Chloroquine treatment induces secretion of autophagy-related proteins and inclusion of Atg8-family proteins in distinct extracellular vesicle populations. Autophagy. 2022:1–14. doi:10.1080/15548627.2022.2039535
19. Guo M, Zhang H, Zheng J, Liu Y. Glypican-3: a new target for diagnosis and treatment of hepatocellular carcinoma. J Cancer. 2020;11(8):2008–2021. doi:10.7150/jca.39972
20. Bao L, Chandra PK, Moroz K, et al. Impaired autophagy response in human hepatocellular carcinoma. Exp Mol Pathol. 2014;96(2):149–154. doi:10.1016/j.yexmp.2013.12.002
21. Christianson HC, Belting M. Heparan sulfate proteoglycan as a cell-surface endocytosis receptor. Matrix Biol. 2014;35:51–55. doi:10.1016/j.matbio.2013.10.004
22. Roucourt B, Meeussen S, Bao J, Zimmermann P, David G. Heparanase activates the syndecan-syntenin-ALIX exosome pathway. Cell Res. 2015;25(4):412–428. doi:10.1038/cr.2015.29
23. Zarovni N, Corrado A, Guazzi P, et al. Integrated isolation and quantitative analysis of exosome shuttled proteins and nucleic acids using immunocapture approaches. Methods. 2015;87:46–58. doi:10.1016/j.ymeth.2015.05.028
24. Jeppesen DK, Fenix AM, Franklin JL, et al. Reassessment of Exosome Composition. Cell. 2019;177(2):428–445.e18. doi:10.1016/j.cell.2019.02.029
25. Lane RE, Korbie D, Trau M, Hill MM. Purification protocols for extracellular vesicles. Methods Mol Biol. 2017;1660:111–130. doi:10.1007/978-1-4939-7253-1_10
26. Raposo G, Stoorvogel W. Extracellular vesicles: exosomes, microvesicles, and friends. J Cell Biol. 2013;200(4):373–383. doi:10.1083/jcb.201211138
27. Cappello F, Fais S. Extracellular vesicles in cancer pros and cons: the importance of the evidence-based medicine. Semin Cancer Biol. 2022. doi:10.1016/j.semcancer.2022.01.011
28. Correll VL, Otto JJ, Risi CM, et al. Optimization of small extracellular vesicle isolation from expressed prostatic secretions in urine for in-depth proteomic analysis. J Extracell Vesicles. 2022;11(2):e12184. doi:10.1002/jev2.12184
29. Davies RT, Kim J, Jang SC, Choi EJ, Gho YS, Park J. Microfluidic filtration system to isolate extracellular vesicles from blood. Lab Chip. 2012;12(24):5202–5210. doi:10.1039/c2lc41006k
30. El-Shennawy L, Hoffmann AD, Dashzeveg NK, et al. Circulating ACE2-expressing extracellular vesicles block broad strains of SARS-CoV-2. Nat Commun. 2022;13(1):405. doi:10.1038/s41467-021-27893-2
31. Jiao Y, Xu P, Shi H, Chen D, Shi H. Advances on liver cell-derived exosomes in liver diseases. J Cell Mol Med. 2021;25(1):15–26. doi:10.1111/jcmm.16123
32. Kanwar SS, Dunlay CJ, Simeone DM, Nagrath S. Microfluidic device (ExoChip) for on-chip isolation, quantification and characterization of circulating exosomes. Lab Chip. 2014;14(11):1891–1900. doi:10.1039/c4lc00136b
33. Aydin Y, Koksal AR, Thevenot P, et al. Experimental validation of novel glypican 3 exosomes for the detection of hepatocellular carcinoma in liver cirrhosis. J Hepatocell Carcinoma. 2021;8:1579–1596. doi:10.2147/jhc.S327339
34. Dalli J, Norling LV, Renshaw D, Cooper D, Leung KY, Perretti M. Annexin 1 mediates the rapid anti-inflammatory effects of neutrophil-derived microparticles. Blood. 2008;112(6):2512–2519. doi:10.1182/blood-2008-02-140533
35. Dalli J, Serhan CN. Specific lipid mediator signatures of human phagocytes: microparticles stimulate macrophage efferocytosis and pro-resolving mediators. Blood. 2012;120(15):e60–72. doi:10.1182/blood-2012-04-423525
36. Kowal J, Arras G, Colombo M, et al. Proteomic comparison defines novel markers to characterize heterogeneous populations of extracellular vesicle subtypes. Proc Natl Acad Sci USA. 2016;113(8):E968–77. doi:10.1073/pnas.1521230113
37. Livshits MA, Khomyakova E, Evtushenko EG, et al. Isolation of exosomes by differential centrifugation: theoretical analysis of a commonly used protocol. Sci Rep. 2015;5:17319. doi:10.1038/srep17319
38. Wang Z, Hj W, Fine D, et al. Ciliated micropillars for the microfluidic-based isolation of nanoscale lipid vesicles. Lab Chip. 2013;13(15):2879–2882. doi:10.1039/c3lc41343h
39. Wunsch BH, Smith JT, Gifford SM, et al. Nanoscale lateral displacement arrays for the separation of exosomes and colloids down to 20 nm. Nat Nanotechnol. 2016;11(11):936–940. doi:10.1038/nnano.2016.134
40. Yang F, Liao X, Tian Y, Li G. Exosome separation using microfluidic systems: size-based, immunoaffinity-based and dynamic methodologies. Biotechnol J. 2017;12(4). doi:10.1002/biot.201600699
41. Zhao Z, Yang Y, Zeng Y, He M. A microfluidic ExoSearch chip for multiplexed exosome detection towards blood-based ovarian cancer diagnosis. Lab Chip. 2016;16(3):489–496. doi:10.1039/c5lc01117e
42. Berg Luecke L, Gundry RL. Assessment of streptavidin bead binding capacity to improve quality of streptavidin-based enrichment studies. J Proteome Res. 2021;20(2):1153–1164. doi:10.1021/acs.jproteome.0c00772
43. Campos-Silva C, Suárez H, Jara-Acevedo R, et al. High sensitivity detection of extracellular vesicles immune-captured from urine by conventional flow cytometry. Sci Rep. 2019;9(1):2042. doi:10.1038/s41598-019-38516-8
44. Kawakami K, Fujita Y, Kato T, et al. Diagnostic potential of serum extracellular vesicles expressing prostate-specific membrane antigen in urologic malignancies. Sci Rep. 2021;11(1):15000. doi:10.1038/s41598-021-94603-9
45. Nakai W, Yoshida T, Diez D, et al. A novel affinity-based method for the isolation of highly purified extracellular vesicles. Sci Rep. 2016;6:33935. doi:10.1038/srep33935
46. Sun N, Lee YT, Zhang RY, et al. Purification of HCC-specific extracellular vesicles on nanosubstrates for early HCC detection by digital scoring. Nat Commun. 2020;11(1):4489. doi:10.1038/s41467-020-18311-0
47. Balaraju AK, Hu B, Rodriguez JJ, Murry M, Glypican LF. 4 regulates planar cell polarity of endoderm cells by controlling the localization of Cadherin 2. Development. 2021;148(14). doi:10.1242/dev.199421
48. Kolluri A, Ho M. The role of glypican-3 in regulating Wnt, YAP, and hedgehog in liver cancer. Front Oncol. 2019;9:708. doi:10.3389/fonc.2019.00708
49. Norman M, Vuilleumier R, Springhorn A, Gawlik J, Pyrowolakis G. Pentagone internalises glypicans to fine-tune multiple signalling pathways. Elife. 2016;5. doi:10.7554/eLife.13301
50. Zhou F, Shang W, Yu X, Tian J. Glypican-3: a promising biomarker for hepatocellular carcinoma diagnosis and treatment. Med Res Rev. 2018;38(2):741–767. doi:10.1002/med.21455
51. Qiao D, Yang X, Meyer K, Friedl A. Glypican-1 regulates anaphase promoting complex/cyclosome substrates and cell cycle progression in endothelial cells. Mol Biol Cell. 2008;19(7):2789–2801. doi:10.1091/mbc.e07-10-1025
52. Capurro MI, Shi W, Filmus J. LRP1 mediates Hedgehog-induced endocytosis of the GPC3-Hedgehog complex. J Cell Sci. 2012;125:3380. doi:10.1242/jcs.098889
53. Filmus J. The function of glypicans in the mammalian embryo. Am J Physiol Cell Physiol. 2022;322(4):C694–c698. doi:10.1152/ajpcell.00045.2022
54. Aydin Y, Stephens CM, Chava S, et al. Chaperone-mediated autophagy promotes beclin1 degradation in persistently infected hepatitis C virus cell culture. Am J Pathol. 2018;188(10):2339–2355. doi:10.1016/j.ajpath.2018.06.022
55. Leone P, Solimando AG, Fasano R, et al. The evolving role of immune checkpoint inhibitors in hepatocellular carcinoma treatment. Vaccines. 2021;9(5). doi:10.3390/vaccines9050532
56. Ribatti D, Solimando AG, Pezzella F. The anti-VEGF(R) drug discovery legacy: improving attrition rates by breaking the vicious cycle of angiogenesis in cancer. Cancers. 2021;13(14):3433. doi:10.3390/cancers13143433
57. Solimando AG, Susca N, Argentiero A, et al. Second-line treatments for advanced hepatocellular carcinoma: a systematic review and bayesian network meta-analysis. Clin Exp Med. 2022;22(1):65–74. doi:10.1007/s10238-021-00727-7
 © 2022 The Author(s). This work is published and licensed by Dove Medical Press Limited. The full terms of this license are available at https://www.dovepress.com/terms.php and incorporate the Creative Commons Attribution - Non Commercial (unported, v3.0) License.
By accessing the work you hereby accept the Terms. Non-commercial uses of the work are permitted without any further permission from Dove Medical Press Limited, provided the work is properly attributed. For permission for commercial use of this work, please see paragraphs 4.2 and 5 of our Terms.
© 2022 The Author(s). This work is published and licensed by Dove Medical Press Limited. The full terms of this license are available at https://www.dovepress.com/terms.php and incorporate the Creative Commons Attribution - Non Commercial (unported, v3.0) License.
By accessing the work you hereby accept the Terms. Non-commercial uses of the work are permitted without any further permission from Dove Medical Press Limited, provided the work is properly attributed. For permission for commercial use of this work, please see paragraphs 4.2 and 5 of our Terms.