")
Back to Journals » Journal of Multidisciplinary Healthcare » Volume 16
Impact of Various Fluid Volumes on Mechanical Ventilation Time, Hospitalization Duration, and Hospitalization Cost in Postoperative Patients with Left Ventricular Diastolic Dysfunction Undergoing Non-Cardiac Surgery
Received 28 September 2023
Accepted for publication 16 November 2023
Published 6 December 2023 Volume 2023:16 Pages 3873—3885
DOI https://doi.org/10.2147/JMDH.S437114
Checked for plagiarism Yes
Review by Single anonymous peer review
Peer reviewer comments 2
Editor who approved publication: Dr Scott Fraser
Zheng Wang,1,2 Xin Du,1 Jianzeng Dong1
1Department of Cardiology, Capital Medical University Affiliated Anzhen Hospital, Beijing, 100029, People’s Republic of China; 2Department of Intensive Care Unit, Peking University International Hospital, Beijing, 102206, People’s Republic of China
Correspondence: Jianzeng Dong; Xin Du, Department of Cardiology, Capital Medical University Affiliated Anzhen Hospital, No. 2 of Anzhen Road, Chaoyang District, Beijing, 100029, People’s Republic of China, Tel +86 13911828375 ; +86 13370103558, Fax +86 1084005363, Email [email protected]; [email protected]
Objective: To describe the effects of various fluid strategies on mechanical ventilation time and other outcomes in patients with diastolic dysfunction undergoing non-cardiac surgery.
Methods: After evaluation, 192 Intensive Care patients met the inclusion criteria. Based on infusion volume and fluid balance, we categorized patients into quartiles using two grouping methodologies. The first quartiles for total infusion volume on day one of ICU admission after surgery were as follows: Q1 ≤ 2.02 mL/kg/h; Q2 > 2.02 to 2.69 mL/kg/h; Q3 > 2.69 to 3.86 mL/kg/h; Q4 > 3.86 mL/kg/h. The second quartiles for fluid balance divided by actual body weight multiplied by the corresponding number of hours were as follows: G1 ≤ − 0.07 mL/kg/h; G2 > − 0.07 to 0.56 mL/kg/h; G3 > 0.56 to 1.54 mL/kg/h; G4> 1.54 mL/kg/h. The primary outcome was mechanical ventilation time. The research utilized both univariate and multivariate negative binomial regression models.
Results: The fourth group (Q4 and G4) had a significant impact on mechanical ventilation time(P< 0.05).There were also significant differences between Q4 or G4 and some other groups in terms of ICU time, ICU cost, total hospital time, and total hospital cost (P < 0.05).After negative binomial regression analysis,Q2 and Q4 were approximately 2.406 times (95% CI 1.153– 5.017, P = 0.019) and 3.532 times (95% CI 1.812– 6.883, P < 0.01) longer than Q1 respectively, when grouped by infusion volume, but there was no significant difference between G groups. And Q4 or G4 also differed significantly from other parameters of clinical outcomes (P < 0.05).
Conclusion: For patients admitted to the ICU following non-cardiac surgery with left ventricular diastolic dysfunction, the greater the fluid infusion or fluid balance, the greater the mechanical ventilation time, ICU or hospital time, and cost.
Keywords: fluid strategies, left ventricular diastolic dysfunction, non-cardiac surgery, mechanical ventilation time, perioperative period
Introduction
Intensive care unit (ICU) patients a high prevalence of left ventricular diastolic dysfunction (LVDD), which is an independent predictor of mortality in critically ill patients in the ICU.1–3 In critically ill patients in the ICU, left ventricular diastolic dysfunction (LVDD) is also associated with difficulty weaning mechanical ventilation and prolonged ICU time.4,5 Further, LVDD complicates the treatment of surgical patients in the ICU; post-operative surgical patients are unable to consume food or medication orally and require fluid infusions to maintain the stability of the internal environment and treat diseases associated with it. However, in surgical patients in the ICU with LVDD, fluid infusions can affect the lungs through the heart, resulting in pulmonary edema and increasing the duration required for mechanical ventilation. On the other hand, insufficient fluid infusion volume may indirectly increase the time required for mechanical ventilation; inadequate fluid infusion volume further reduces the left ventricular filling pressure, resulting in a decrease in cardiac output, which then leads to tissue perfusion.
In a 2018 epidemiological survey, Li et al6 found that the incidence of diastolic dysfunction among patients in the ICU was as high as 59%. The prevalence of LVDD is partially driven by the patient demographic: a significant proportion of patients in the ICU are elderly and suffer from multiple comorbidities that are chronic risk factors for diastolic dysfunction, such as hypertension, diabetes, chronic kidney disease, valvular heart disease, and coronary artery disease. Patients can also develop LVDD in the ICU due to acute factors such as acute hemodynamic changes, sepsis or septic shock, hypoxia, mechanical ventilation, myocardial ischemia, atrial fibrillation, drug withdrawal, acute renal failure, anesthetic drugs, and cardiac compression.7 Normal diastolic dysfunction, impaired relaxation, pseudonormal pattern, and restrictive filling diastolic dysfunction were observed in 49%, 16%, 19%, and 16%, of patients in the ICU, respectively.
Post-operative patients, particularly those who have undergone surgery requiring anesthesia, represent a significant proportion of patients in the intensive care unit who may require mechanical ventilation. About 300 million patients worldwide receive non-cardiac surgery annually to treat a variety of primary diseases, which increases patient life expectancy and improves quality of life.8,9 However, non-cardiac surgery also increases the risk of post-operative complications, particularly cardiovascular complications, and mortality.10,11 Elderly patients constitute a significant proportion of post-operative ICU patients and are especially susceptible to post-operative cardiovascular complications due to a higher prevalence of pre-existing coronary heart disease, LVDD, and/or comorbid risk factors.12 In Belgium and the United States, about 45% of patients age more than 45 years12 and about 37% of patients age more than 65 years13 who underwent non-cardiac surgeries were at risk of developing independent cardiovascular disease. In China, approximately 74 million non-cardiac surgeries are performed annually, 30% of which are performed on patients with coronary heart disease.14 With the acceleration of the aging process of the population, the number of elderly patients who require non-cardiac surgery increases year by year. Therefore, a significant and increasing proportion of non-cardiac surgery patients in the ICU have diastolic dysfunction, which is an independent risk factor for post-operative cardiovascular events.15–18
While clinicians can roughly evaluate the presence of diastolic dysfunction through commonly accepted indicators, it is currently not feasible to precisely measure diastolic function,19 and specific assessments of diastolic function are less prevalent than specific assessments of systolic function. Diastolic dysfunction is frequently neglected in postoperative fluid management; clinicians pay more attention to fluid management in patients with systolic dysfunction and frequently disregard fluid management in patients with diastolic dysfunction. However, findings indicate that patients with diastolic dysfunction are more likely to have pulmonary edema20 and fluid accumulation, and that fluid management in non-cardiac patients with diastolic dysfunction may affect mechanical ventilation duration through increased extravascular lung water.
Existing research on fluid management strategies for non-cardiac surgery patients focuses on open fluid strategy,21–25 goal-directed fluid strategy,26–29 and the impact of varying fluid volumes during anesthesia on patient clinical outcomes.28 The impact of post-operative fluid management strategies for patients with left ventricular diastolic dysfunction on the duration of mechanical ventilation has not been thoroughly investigated.
Methods
Study Protocol and Approval
The Biomedical Ethics Committee of Peking University International Hospital reviewed and approved this retrospective study on April 2, 2023 (2023-KY-0010-01). This study was conducted in accordance with the declaration of Helsinki. Due to the retrospective nature of the study, the requirement of patient consent for inclusion was waived. Patient personal privacy and data confidentiality has been upheld.
Patients
The ethical committee of Peking University International Hospital approved this retrospective study initiated by the investigator. The medical records of 1,830 patients admitted to the Department of Intensive Care, Peking University International Hospital between January 2020 and December 2021 were reviewed. This study enrolled 192 patients. (Figure 1).
 |
Figure 1 Study flow diagram illustrating the surgical cohort used for data analysis. |
Inclusion criteria: 1) Patients older than 40 years of age; 2) surgical grade of 3 or higher; 3) patients who were diagnosed with left ventricular diastolic dysfunction by results of preoperative or postoperative echocardiography examinations (When viewed in the apical four-chamber view using pulsed Doppler echocardiography, the ratio of early diastolic mitral flow velocity (E) to late diastolic mitral flow velocity (A) should be less than 1; alternatively, when measured by tissue Doppler imaging, the ratio of early diastolic mitral flow velocity (E) to early diastolic mitral annular velocity (e’) of the left ventricular lateral wall should be equal to or greater than 10);30,31 and 4) with an artificial airway to receive mechanical ventilation when transferred to the ICU.
Exclusion criteria: patients 1) with decreased ejection fraction (< 50%), 2) with the presence of atrial fibrillation, 3) who had been admitted for emergency surgery, 4) receiving vasoactive drugs (due to severe circulatory disturbance), and 5) who had undergone lobectomy or hepatectomy surgery (due to particularities of mechanical ventilation and fluid management for these patients).28
Recorded Variables
General data on patients, including sex, age, BMI, history of smoking and drinking alcohol, major diagnosis, diagnosis of complications, and APACHE II (Acute Physiology and Chronic Health Evaluation Second Edition) score, were collected when they were admitted to the ICU after surgery. Data pertaining to operations included surgery type, surgical grade, and duration of the operation. Fluid balance data included the total ICU fluid volume and balance on the day following surgery.
Measures of Outcomes
The primary outcome was the duration of mechanical ventilation following surgery. The secondary outcomes included ICU time, total hospital time, ICU cost, and total hospital cost. The hospitalization information system was used to calculate ICU time and total hospital time. The ICU cost and total hospital cost were derived from an internal financial monitoring system and represent the sum of direct and indirect expenses incurred by the institution.
Grouping
Based on infusion volume and fluid balance, we grouped patients into quartiles according to two grouping methodologies.
On days two and one of ICU admission following surgery, the total infusion volume was calculated by adding the volumes of crystalloid and one-and-a-half times colloid.32 Total infusion volume on day one of admission to the ICU after surgery divided by actual body weight multiplied by the corresponding number of hours was analyzed as quartiles: quartile 1 (Q1) ≤ 2.02 mL/kg/h; quartile 2 (Q2) > 2.02 to 2.69 mL/kg/h; quartile 3 (Q3) > 2.69 to 3.86 mL/kg/h; quartile 4 (Q4) > 3.86 mL/kg/h.
The fluid balance was calculated by subtracting the total fluid volume from the total fluid loss, which included urine volume, drainage volume, blood loss, etc. on day one of admission to the ICU following surgery. As quartiles, fluid balance divided by actual body weight multiplied by the corresponding number of hours was analyzed: quartile 1 (G1) ≤ −0.07 mL/kg/h; quartile 2 (G2) > −0.07 to 0.56 mL/kg/h; quartile 3 (G3) > 0.56 to 1.54 mL/kg/h; and quartile 4 (G4) > 1.54 mL/kg/h.
Statistics
Continuous variables with a skewed distribution are expressed as the median with interquartile ranges (IQR), whereas data with a normal distribution are summarized as the mean ± standard deviation. The covariance analysis was used to compare the differences between the observation groups, and BMI, APACHE-II score, operation time, surgical classification, diabetes, hypertension, and pulmonary disease were adjusted. The incidence rate ratios (IRR) were calculated using a negative binomial regression to analyze the effect of the infusion volume and fluid balance volume on the number of ventilator hours, the length of stay in the ICU and hospital, and the cost incurred in the ICU and hospital. First, this analysis was conducted without any adjustments, and then it was adjusted for variables such as BMI, APACHE-II scores, operation time, surgical classification, diabetes, hypertension, and pulmonary disease. A P value < 0.05 was considered significant. The statistical analysis was performed with SPSS version 25.0.
For the outcome variables were all count data, to explore whether different fluid balance volumes and different infusion volumes were related to the duration of mechanical ventilation, length of ICU stay, total length of hospital stay, ICU cost, and total hospitalization cost, negative binomial regression was used for analysis. The outcome of the group with the lowest fluid balance volume (Q1) was used as the control group. The relationship between the outcomes corresponding to the other three groups of fluid balance and the Q1 outcome was calculated, and the Incidence rate ratio (IRR) value and the corresponding 95% CI were also obtained. To further reduce the possibility of other potential variables affecting the outcome, this study also adjusted for BMI, APACHE-II, operation duration, operation grade, diabetes, hypertension, and pulmonary disease, and obtained the adjusted IRR value and corresponding 95% CI.
Results
Patient Characteristics
Table 1 displays the clinical data and prognosis of patients. Abdominal surgery (n = 86), craniocerebral surgery (n = 63), maxillofacial head and neck surgery (n = 35), urinary surgery (n = 3), thoracic surgery (n = 3), and orthopedic surgery (n = 2) were among the surgical procedures undergone by the patients in this study.
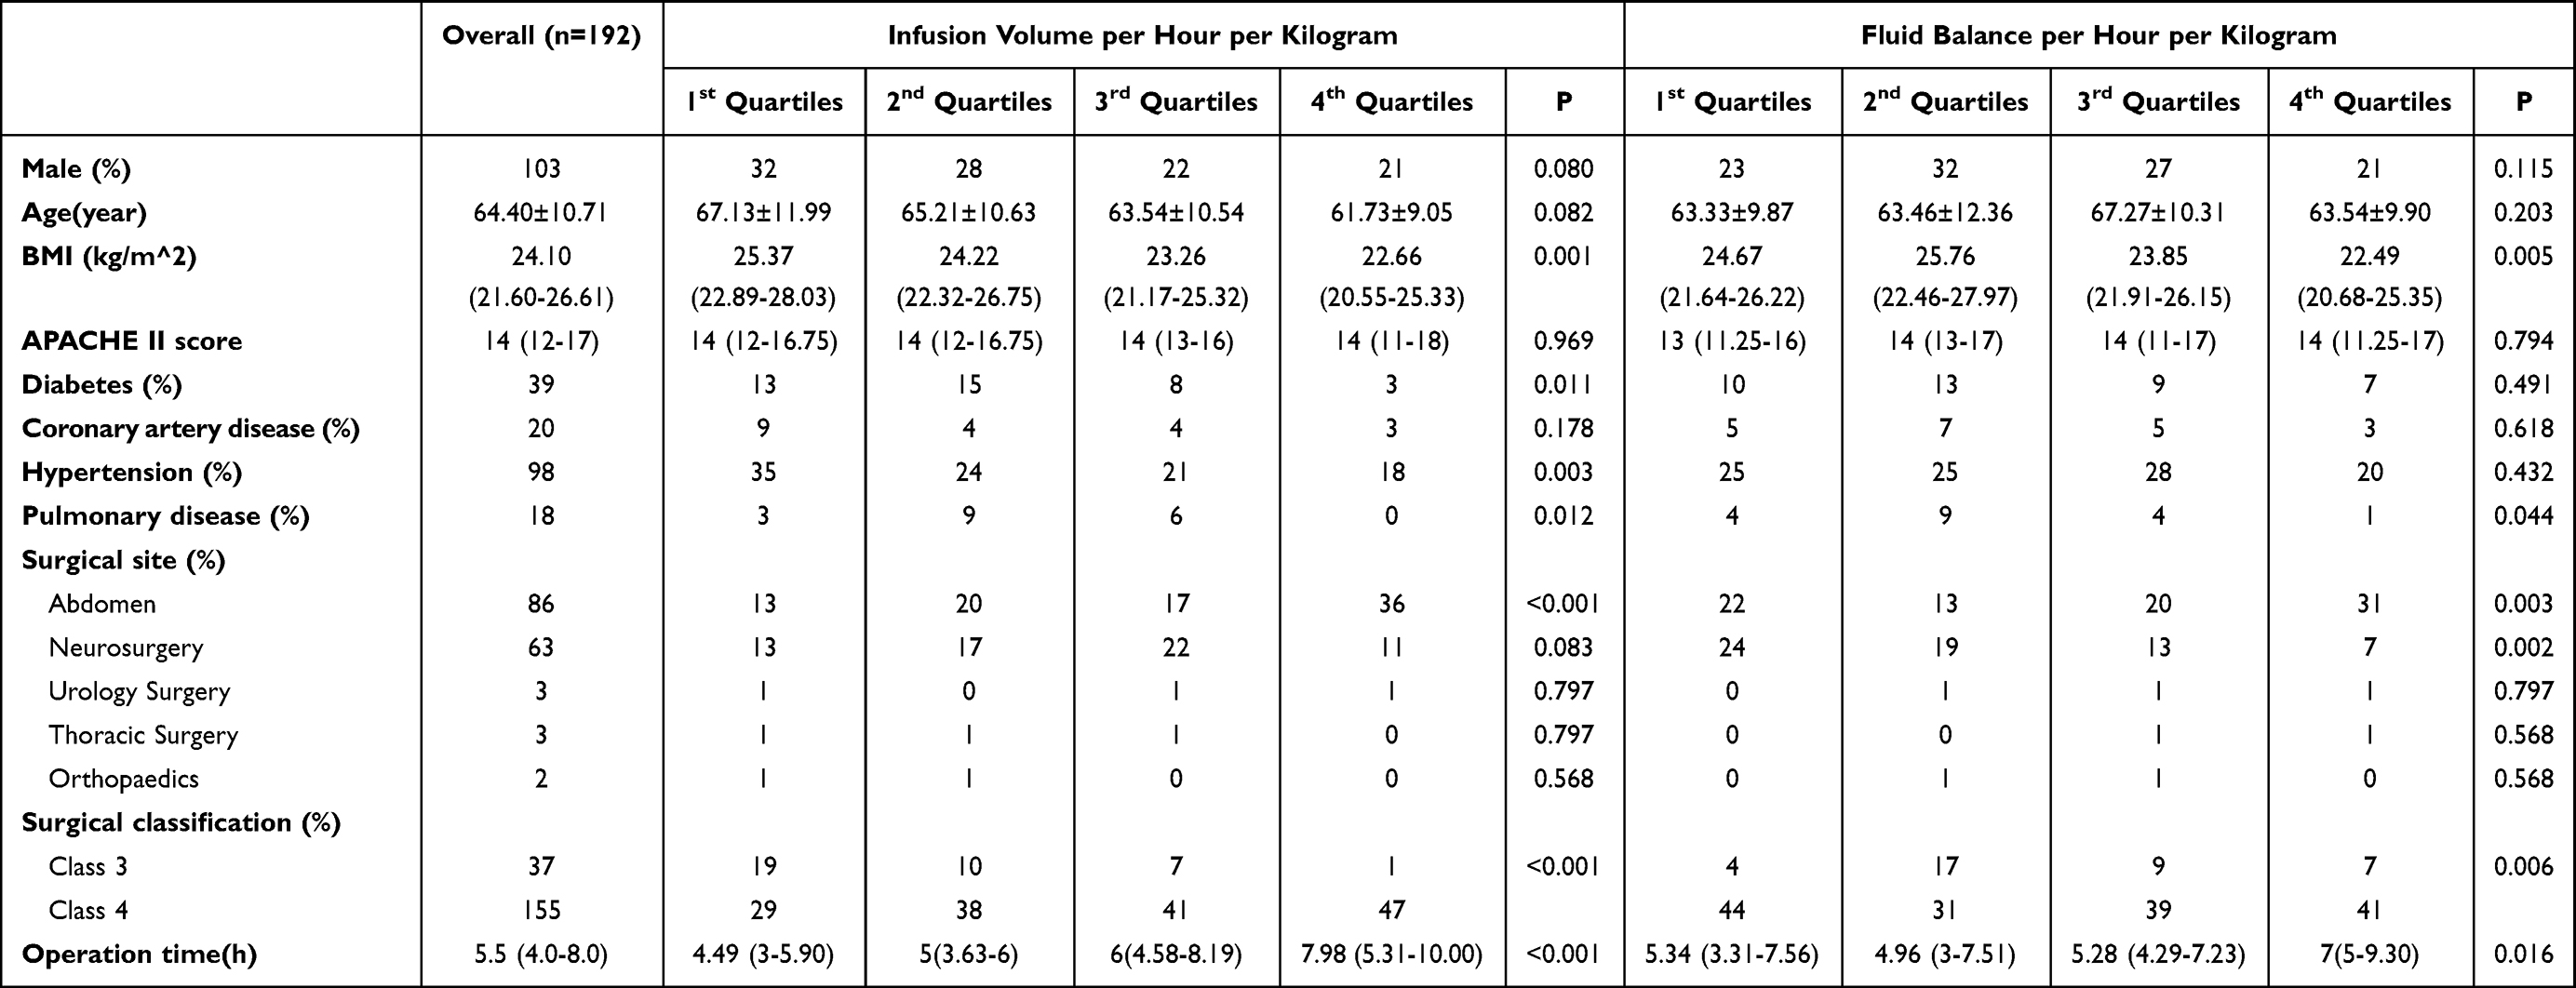 |
Table 1 Patients Characteristics at Inclusion |
There were statistically significant differences between groups in terms of BMI, operation time, diabetes, hypertension, pulmonary disease, and surgical classification. Patients in the higher quartiles of infusion volume had lower BMIs, longer operation durations, and were less likely to have a history of diabetes, hypertension, or pulmonary disease, and this was also consistent for patients in the higher quartiles for fluid balance.
Primary Outcome
Our findings show a correlation between perioperative infusion volume and fluid balance with mechanical ventilation time following non-cardiac surgery. The group with the most fluid and the longest mechanical ventilation time. When the infusion volume exceeded 3.86 mL/kg/h or the liquid balance exceeded 1.54 mL/kg/h in the fourth group (Q4 or G4), it had a significant impact on mechanical ventilation time (P < 0.05). However, there was no statistically significant difference between the three groups with relatively low infusion volumes or liquid balances (Figures 2A and 3A).
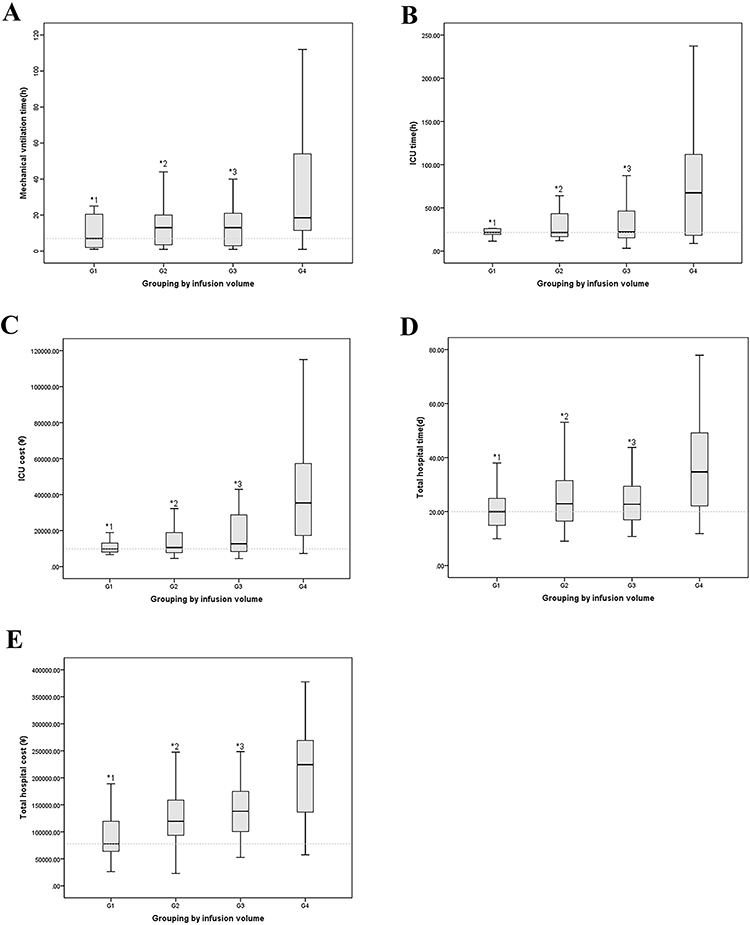 |
Figure 2 Effect of infusion volume on outcomes. The association between infusion volume and primary or secondary outcomes was analyzed using multivariable models adjusted for BMI, APACHE-II scores, operation time, surgical classification, diabetes, hypertension, and pulmonary disease. (A) The results of paired comparison among groups by analysis of variance showed that there was a correlation between mechanical ventilation time and excessive infusion volume (Compared with Q4: *1P < 0.01, *2P = 0.035, *3P < 0.01). There were no relationships between Q1, Q2, and Q3 in pairs. (B) The results of paired comparison among groups by analysis of variance showed that there was a correlation between ICU time and excessive infusion volume (Compared with Q4: *1P, *2P, and *3P were all < 0.01). There were no relationships between Q1, Q2, and Q3 in pairs. (C) The results of paired comparison among groups by analysis of variance showed that there was a correlation between ICU cost and excessive infusion volume (Compared with Q4: *1P,*2P, and *3P were all < 0.01). There were no relationships between Q1, Q2, and Q3 in pairs. (D) The results of paired comparison among groups by analysis of variance showed that there was a correlation between total hospital time and excessive infusion volume (Compared with Q4: *1P,*2P, and *3P were all < 0.01). There were no relationships between Q1, Q2, and Q3 in pairs. (E) The results of paired comparison among groups by analysis of variance showed that there was a correlation between total hospital cost and excessive infusion volume (Compared with Q4: *1P,*2P, and *3P were all < 0.01). There were no relationships between Q1, Q2, and Q3 in pairs. Abbreviations: APACHE, acute physiology and chronic health evaluation; BMI, body mass index. |
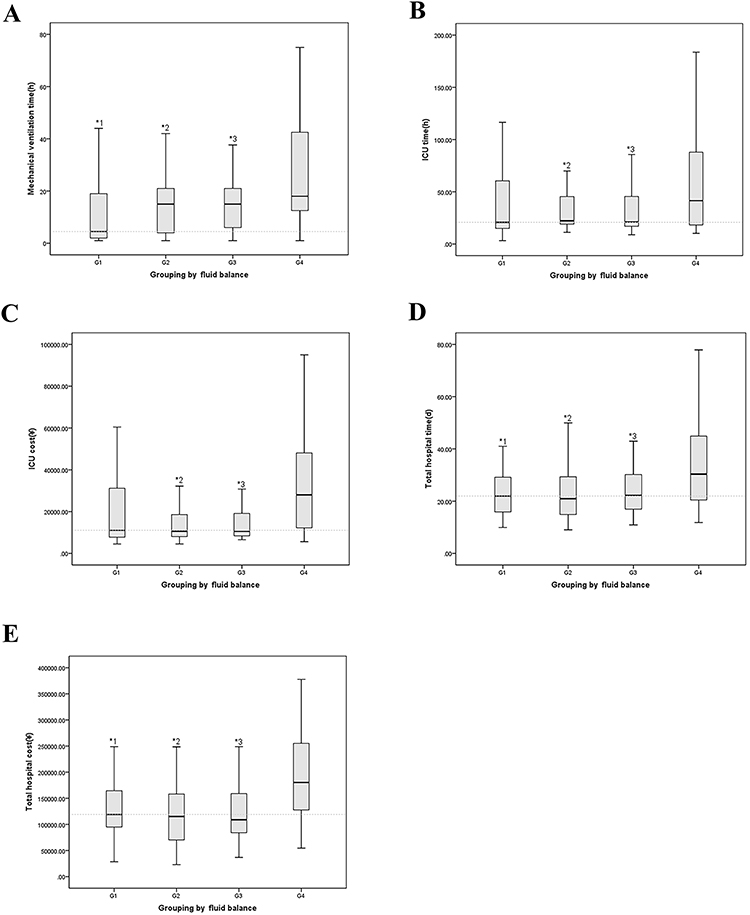 |
Figure 3 Effect of fluid balance on outcomes. The association between infusion volume and primary or secondary outcomes was analyzed using multivariable models adjusted for BMI, APACHE-II scores, operation time, surgical classification, diabetes, hypertension, and pulmonary disease. (A) The results of paired comparison among groups by analysis of variance showed that there was a correlation between mechanical ventilation time and fluid balance (Compared with the G4: *1P = 0.018, *2P < 0.01, *3P = 0.011). There were no relationships between G1, G2, and G3 in pairs. (B) The results of paired comparison among groups by analysis of variance showed that there was a correlation between ICU time and fluid balance (Compared with the G4: *2P and *3P were all < 0.01). There were no relationships between G1, G2, and G3 in pairs. (C) The results of paired comparison among groups by analysis of variance showed that there was a correlation between ICU cost and fluid balance (Compared with the G4: *2P < 0.01, *3P = 0.01). There were no relationships between G1, G2, and G3 in pairs. (D) The results of paired comparison among groups by analysis of variance showed that there was a correlation between total hospital time and fluid balance (Compared with the G4: *1P < 0.01, *2P = 0.015, *3P < 0.01). There were no relationships between G1, G2, and G3 in pairs. (E) The results of paired comparison among groups by analysis of variance showed that there was a correlation between total hospital cost and fluid balance (Compared with the G4: *1P,*2P and *3P were all < 0.01). There were no relationships between G1, G2, and G3 in pairs. Abbreviations: APACHE, acute physiology and chronic health evaluation; BMI, body mass index. |
Furthermore, when the incidence rate ratios were calculated, the results indicated that after adjusting for BMI, APACHE-II score, operation time, surgical classification, diabetes, hypertension, and pulmonary disease, the mechanical ventilation times of Q2 and Q4 were approximately 2.406 times (95% CI 1.153–5.017, P = 0.019) and 3.532 times (95% CI 1.812–6.883, P < 0.01) longer than Q1 respectively when grouped by infusion volume (Table 2). However, for the fourth group with the greatest liquid balance, there was a trend toward prolonged mechanical ventilation time, but no significant multiple relationship, which may be due to the small sample size (Table 3).
 |
Table 2 Effect of Infusion Volume on Outcomes |
 |
Table 3 Effect of Fluid Balance on Outcomes |
Secondary Outcomes
When grouping by infusion volume, there were significant differences in ICU time, ICU cost, total hospital time, and total hospital cost between the Q4 group and the other three groups, with the group receiving the most fluid having the longest ICU and hospital time and the highest cost (Figure 2B–E). Other than grouping by fluid balance, there were significant differences in ICU time, ICU cost, total hospital time, and total hospital cost between the G4 group and the G2 and G3 groups, and between the G4 group and the G1 group (Figure 3B–E).
Moreover, when grouped by infusion volume and after the BMI, APACHE-II score, operation time, surgical classification, diabetes, hypertension, and pulmonary disease were adjusted, the ICU time of Q4 was 2.168 (95% CI 1.313–3.579, P = 0.002) times longer than Q1, the ICU cost was 3.621 (95% CI 2.024–5.502, P < 0.001) times, the total hospital time was 1.385 (95% CI 1.091–1.758, P = 0.007) times, and the total hospital cost was 1.733 (95% CI 1.384–2.170, P < 0.001) times. In addition, the total hospital costs for Q2 and Q3 were 1.240 (95% CI 1.039–1.480, P = 0.017) and 1.259 (95% CI 1.059–1.496, P = 0.009) times higher than Q1, respectively (Table 2).
After adjusting for BMI, APACHE-II score, operation time, surgical classification, diabetes, hypertension, and pulmonary disease, the only significant differences between G4 and G1 when grouped by fluid balance were total hospital time and total hospital cost. The total hospital time was 1.277 (95% CI 1.039–1.568, P = 0.020) times, and the total hospital cost was 1.227 (95% CI 1.003–1.502, P = 0.047) times (Table 3).
Discussion
During perioperative recovery from non-cardiac surgery in patients with left ventricular diastolic dysfunction in the ICU, we retrospectively analyzed patient data to investigate the relationship between fluid volume or fluid balance and mechanical ventilator time, as well as related issues such as cost and length of stay. The objective was to guide the ICU clinician on fluid infusion during the perioperative period in patients with left ventricular diastolic dysfunction.
Effect on Mechanical Ventilation Time
The results demonstrate that perioperative fluid volume and fluid balance following non-cardiac surgery are indeed closely correlated with mechanical ventilation time. The group with the greatest infusion volume (Q4) tended to have the longest mechanical ventilation time, and that increased by more than 3.5 times.
But for the fourth group with the greatest liquid balance, there was a trend of prolonged mechanical ventilation time but no significant multiple relationship, which may be due to the small sample size. Another factor to consider could be that the infusion volume response fluid volume over a brief period is not calculated. Consequently, the impact on cardiac function and pulmonary edema may be more direct. And in some patients with a relative deficiency in blood volume, even though a small quantity of fluid was administered, the outflow may be reduced, resulting in a greater volume balance. And at this stage, the impact on cardiac function or pulmonary edema is minimal. Therefore, infusion volume may have a greater effect on ventilator duration in patients with diastolic dysfunction who have not undergone cardiac surgery.
In addition, insufficient infusion in the first group could theoretically result in insufficient left ventricular filling pressure and impact cardiac output, thereby influencing the duration of mechanical ventilation. However, this phenomenon was not observed in this study. This may be due to the fact that patients were treated postoperatively under close observation in the ICU unit, where the fluid volume was not administered at a level that would cause systemic hypoperfusion and interfere with the duration of mechanical ventilation.
Therefore, in patients admitted to the ICU with left ventricular diastolic dysfunction who have undergone non-cardiac surgery, an excessive infusion volume has a significant impact on mechanical ventilator time and should be given more consideration.
Effect on Hospital Time and Hospital Cost (Either in the ICU or Total Hospitalization)
The influence of infusion volume and fluid balance on mechanical ventilation time may have a potential impact on hospital time and hospital cost (intensive care unit and total). Therefore, it may have a certain impact on social and medical resources from the perspective of medical economics. According to studies, reducing the mechanical ventilation time can shorten hospital time and costs.33 On the other hand, prolonged mechanical ventilation also increases the risk of ventilator-associated pneumonia, which increases the length and cost of hospitalization and places a significant burden on families.34–38
ICU Time and ICU Cost
Similar to mechanical ventilation time, when grouping by infusion volume, ICU time and ICU cost of the fourth group were significantly different from the other three groups and more than doubled with ICU time and closed three times with ICU cost than the group with the least infusion volume. However, when the groups were classified based on their fluid equilibrium, there was no significant difference between them. The possible explanation is that it is the same as ventilator time, and patients are typically transferred out of the ICU shortly after they are weaned from the ventilator.
Therefore, for patients with diastolic dysfunction who have undergone non-cardiac surgery, when the infusion volume is at a relatively low level, it has almost no effect on the time and cost of ICU; however, when the infusion volume reaches a certain level, it will have a certain impact on ICU medical resources and place an economic burden on patients. When managing these patients, we must pay close attention to this.
Total Hospital Time and Cost
The results of our study demonstrate that the influence of fluid on the hospitalization time and cost was identical; that is, the fourth group had the highest infusion volume, or balance volume, which significantly prolonged the hospitalization length and increased the cost. Therefore, minimizing the quantity of infusion or negative balance may reduce the length and cost of hospitalization, thereby preventing the waste of medical resources and easing the financial burden of patients.
Limitations
Although the ICU recovery period for patients who have undergone non-cardiac surgery is only a small portion of the perioperative period, the body remains in a particularly fragile physiological state, and the internal environment is unstable, especially for patients with cardiac dysfunction. However, diastolic dysfunction is frequently ignored by clinicians. Therefore, the treatment strategy during the period may have some effect on the mechanical ventilation time of patients, and through the effect of mechanical ventilation time on the cost and length of hospitalization, it will have a corresponding impact on them as well as an effect on the reasonable distribution of medical resources and expenses. Currently, relevant studies are restricted to the anesthesia process,28,39–41 and there is a lack of research on postoperative time in the ICU. This study is an investigation in this regard. However, as a single-center retrospective study, there are inevitably some limitations; additional prospective studies are required to refine diastolic function and fluid volume infusion strategies in order to clarify the optimal infusion volume or fluid balance volume for clinical work. The true relationship between ventilator time and infusion volume or fluid balance volume during postoperative time in the ICU in patients with left ventricular diastolic dysfunction who have undergone non-cardiac surgery can be described more scientifically if multi-center case data can be added to increase the sample size.
Conclusion
For patients admitted to the ICU after non-cardiac surgery with left ventricular diastolic dysfunction, there was a non-linear relationship between fluid volume or balance and mechanical ventilator time, and the group with the highest fluid volume or balance had a significant impact on mechanical ventilator time. In addition, increased fluid volume and balance had significant effects on hospital time and cost (either in the ICU or total hospitalization).
Acknowledgments
We would like to acknowledge the hard and dedicated work of all the staff that implemented the intervention and evaluation components of the study.
Funding
No external funding was received to conduct this study.
Disclosure
The authors declare that they have no competing interests.
References
1. Landesberg G, Gilon D, Meroz Y., et al. Diastolic dysfunction and mortality in severe sepsis and septic shock. Eur Heart J. 2012;33(7):895–903. doi:10.1093/eurheartj/ehr351
2. Ikonomidis I, Nikolaou M, Dimopoulou I, et al. Association of left ventricular diastolic dysfunction with elevated NT-pro-BNP in general intensive care unit patients with preserved ejection fraction: a complementary role of tissue Doppler imaging parameters and NT-pro-BNP levels for adverse outcome. Shock. 2010;33(2):141–148. doi:10.1097/SHK.0b013e3181ad31f8
3. Sturgess DJ, Marwick TH, Joyce C, et al. Prediction of hospital outcome in septic shock: a prospective comparison of tissue Doppler and cardiac biomarkers. Crit Care. 2010;14(2):R44. doi:10.1186/cc8931
4. Lamia B, Maizel J, Ochagavia A, et al. Echocardiographic diagnosis of pulmonary artery occlusion pressure elevation during weaning from mechanical ventilation. Crit Care Med. 2009;37(5):1696–1701. doi:10.1097/CCM.0b013e31819f13d0
5. Papanikolaou J, Makris D, Saranteas T, et al. New insights into weaning from mechanical ventilation: left ventricular diastolic dysfunction is a key player. Intensive Care Med. 2011;37(12):1976–1985. doi:10.1007/s00134-011-2368-0
6. Li Y, Yin W, Qin Y, et al. Preliminary exploration of epidemiologic and hemodynamic characteristics of restrictive filling diastolic dysfunction based on echocardiography in critically ill patients: a retrospective study. Biomed Res Int. 2018;2018:5429868. doi:10.1155/2018/5429868
7. Karrowni W, Chatterjee K. Diastolic heart failure: the current understanding and approach for management with focus on intensive care unit patients. J Intensive Care Med. 2014;29(3):119–127. doi:10.1177/0885066612453131
8. Weiser TG, Haynes AB, Molina G, et al. Estimate of the global volume of surgery in 2012: an assessment supporting improved health outcomes. Lancet. 2015;385(Suppl 2):S11. doi:10.1016/S0140-6736(15)60806-6
9. Weiser TG, Regenbogen SE, Thompson KD, et al. An estimation of the global volume of surgery: a modelling strategy based on available data. Lancet. 2008;372(9633):139–144. doi:10.1016/S0140-6736(08)60878-8
10. Devereaux PJ, Sessler DI. Cardiac complications in patients undergoing major noncardiac surgery. N Engl J Med. 2015;373(23):2258–2269. doi:10.1056/NEJMra1502824
11. Roshanov PS, Walsh M, Devereaux PJ, et al. External validation of the revised cardiac risk index and update of its renal variable to predict 30-day risk of major cardiac complications after non-cardiac surgery: rationale and plan for analyses of the VISION study. BMJ Open. 2017;7(1):e013510. doi:10.1136/bmjopen-2016-013510
12. Kuznetsova T, Herbots L, Lopez B, et al. Prevalence of left ventricular diastolic dysfunction in a general population. Circ Heart Fail. 2009;2(2):105–112. doi:10.1161/CIRCHEARTFAILURE.108.822627
13. Smilowitz NR, Berger JS. Perioperative cardiovascular risk assessment and management for noncardiac surgery: a review. JAMA. 2020;324(3):279–290. doi:10.1001/jama.2020.7840
14. Shengshou H, Runlin G, Lisheng L, et al. Summary of the 2018 report on cardiovascular diseases in China. Chinese Circulation J. 2019;34(3):209–220.
15. Fayad A, Ansari MT, Yang H, Ruddy T, Wells GA. Perioperative diastolic dysfunction in patients undergoing noncardiac surgery is an independent risk factor for cardiovascular events: a systematic review and meta-analysis. Anesthesiology. 2016;125(1):72–91. doi:10.1097/ALN.0000000000001132
16. Sellers D, Srinivas C, Djaiani G. Cardiovascular complications after non-cardiac surgery. Anaesthesia. 2018;73(Suppl S1):34–42. doi:10.1111/anae.14138
17. Kaw R, Hernandez AV, Pasupuleti V, et al. Effect of diastolic dysfunction on postoperative outcomes after cardiovascular surgery: a systematic review and meta-analysis. J Thorac Cardiovasc Surg. 2016;152(4):1142–1153. doi:10.1016/j.jtcvs.2016.05.057
18. Kusunose K, Okushi Y, Yamada H, et al. Prognostic value of frailty and diastolic dysfunction in elderly patients. Circ J. 2018;82(8):2103–2110. doi:10.1253/circj.CJ-18-0017
19. Sanderson JE. Diastolic heart failure: fact or fiction? Heart. 2003;89(11):1281–1282. doi:10.1136/heart.89.11.1281
20. Singh A, Mehta Y. Heart failure with preserved ejection fraction (HFpEF): implications for the anesthesiologists. J Anaesthesiol Clin Pharmacol. 2018;34(2):161–165. doi:10.4103/joacp.JOACP_352_16
21. Lowell JA, Schifferdecker C, Driscoll DF, Benotti PN, Bistrian BR. Postoperative fluid overload: not a benign problem. Crit Care Med. 1990;18(7):728–733. doi:10.1097/00003246-199007000-00010
22. Frost EA. The rise and fall of the third space: appropriate intraoperative fluid management. J Med Assoc Thai. 2013;96(8):1001–1008.
23. Woodcock TE, Woodcock TM. Revised Starling equation and the glycocalyx model of transvascular fluid exchange: an improved paradigm for prescribing intravenous fluid therapy. Br J Anaesth. 2012;108(3):384–394. doi:10.1093/bja/aer515
24. Feldheiser A, Aziz O, Baldini G, et al. Enhanced Recovery After Surgery (ERAS) for gastrointestinal surgery, part 2: consensus statement for anaesthesia practice. Acta Anaesthesiol Scand. 2016;60(3):289–334. doi:10.1111/aas.12651
25. Silva JM, de Oliveira AM, Nogueira FA, et al. The effect of excess fluid balance on the mortality rate of surgical patients: a multicenter prospective study. Crit Care. 2013;17(6):R288. doi:10.1186/cc13151
26. Gustafsson UO, Scott MJ, Schwenk W, et al. Guidelines for perioperative care in elective colonic surgery: enhanced Recovery After Surgery (ERAS((R))) Society recommendations. World J Surg. 2013;37(2):259–284. doi:10.1007/s00268-012-1772-0
27. Miller TE, Myles PS. Perioperative Fluid Therapy for Major Surgery. Anesthesiology. 2019;130(5):825–832. doi:10.1097/ALN.0000000000002603
28. Shin CH, Long DR, McLean D, et al. Effects of intraoperative fluid management on postoperative outcomes: a hospital registry study. Ann Surg. 2018;267(6):1084–1092. doi:10.1097/SLA.0000000000002220
29. Messina A, Robba C, Calabro L, et al. Association between perioperative fluid administration and postoperative outcomes: a 20-year systematic review and a meta-analysis of randomized goal-directed trials in major visceral/noncardiac surgery. Crit Care. 2021;25(1):43. doi:10.1186/s13054-021-03464-1
30. Morris DA, Belyavskiy E, Aravind-Kumar R, et al. Potential usefulness and clinical relevance of adding left atrial strain to left atrial volume index in the detection of left ventricular diastolic dysfunction. JACC Cardiovasc Imaging. 2018;11(10):1405–1415. doi:10.1016/j.jcmg.2017.07.029
31. Sonaglioni A, Lombardo M, Nicolosi GL, et al. Incremental diagnostic role of left atrial strain analysis in thrombotic risk assessment of nonvalvular atrial fibrillation patients planned for electrical cardioversion. Int. J Cardiovasc Imaging. 2021;37(5):1539–1550. doi:10.1007/s10554-020-02127-6
32. Orbegozo Cortes D, Gamarano Barros T, Njimi H, Vincent JL. Crystalloids versus colloids: exploring differences in fluid requirements by systematic review and meta-regression. Anesth Analg. 2015;120(2):389–402. doi:10.1213/ANE.0000000000000564
33. Coplin WM, Pierson DJ, Cooley KD, Newell DW, Rubenfeld GD. Implications of extubation delay in brain-injured patients meeting standard weaning criteria. Am J Respir Crit Care Med. 2000;161(5):1530–1536. doi:10.1164/ajrccm.161.5.9905102
34. Gupta S, Boville BM, Blanton R, et al. A multicentered prospective analysis of diagnosis, risk factors, and outcomes associated with pediatric ventilator-associated pneumonia. Pediatr Crit Care Med. 2015;16(3):e65–73. doi:10.1097/PCC.0000000000000338
35. Restrepo MI, Anzueto A, Arroliga AC, et al. Economic burden of ventilator-associated pneumonia based on total resource utilization. Infect Control Hosp Epidemiol. 2010;31(5):509–515. doi:10.1086/651669
36. Safdar N, Dezfulian C, Collard HR, Saint S. Clinical and economic consequences of ventilator-associated pneumonia: a systematic review. Crit Care Med. 2005;33(10):2184–2193. doi:10.1097/01.CCM.0000181731.53912.D9
37. Yang CC, Shih NC, Chang WC, Huang SK, Chien CW. Long-term medical utilization following ventilator-associated pneumonia in acute stroke and traumatic brain injury patients: a case-control study. BMC Health Serv Res. 2011;11(1):289. doi:10.1186/1472-6963-11-289
38. Umscheid CA, Mitchell MD, Doshi JA, Agarwal R, Williams K, Brennan PJ. Estimating the proportion of healthcare-associated infections that are reasonably preventable and the related mortality and costs. Infect Control Hosp Epidemiol. 2011;32(2):101–114. doi:10.1086/657912
39. Varadhan KK, Lobo DN. A meta-analysis of randomised controlled trials of intravenous fluid therapy in major elective open abdominal surgery: getting the balance right. Proc Nutr Soc. 2010;69(4):488–498. doi:10.1017/S0029665110001734
40. Thacker JK, Mountford WK, Ernst FR, Krukas MR, Mythen MM. Perioperative fluid utilization variability and association with outcomes: considerations for enhanced recovery efforts in sample US surgical populations. Ann Surg. 2016;263(3):502–510. doi:10.1097/SLA.0000000000001402
41. Regenbogen SE, Shah NJ, Collins SD, Hendren S, Englesbe MJ, Campbell DA. Population-based assessment of intraoperative fluid administration practices across three surgical specialties. Ann Surg. 2017;265(5):930–940. doi:10.1097/SLA.0000000000001745
 © 2023 The Author(s). This work is published and licensed by Dove Medical Press Limited. The full terms of this license are available at https://www.dovepress.com/terms.php and incorporate the Creative Commons Attribution - Non Commercial (unported, v3.0) License.
By accessing the work you hereby accept the Terms. Non-commercial uses of the work are permitted without any further permission from Dove Medical Press Limited, provided the work is properly attributed. For permission for commercial use of this work, please see paragraphs 4.2 and 5 of our Terms.
© 2023 The Author(s). This work is published and licensed by Dove Medical Press Limited. The full terms of this license are available at https://www.dovepress.com/terms.php and incorporate the Creative Commons Attribution - Non Commercial (unported, v3.0) License.
By accessing the work you hereby accept the Terms. Non-commercial uses of the work are permitted without any further permission from Dove Medical Press Limited, provided the work is properly attributed. For permission for commercial use of this work, please see paragraphs 4.2 and 5 of our Terms.