Back to Journals » OncoTargets and Therapy » Volume 11
Impact of targeting transforming growth factor β-2 with antisense OT-101 on the cytokine and chemokine profile in patients with advanced pancreatic cancer
Authors D'Cruz OJ, Qazi S, Hwang L, Ng K, Trieu V
Received 8 January 2018
Accepted for publication 26 February 2018
Published 14 May 2018 Volume 2018:11 Pages 2779—2796
DOI https://doi.org/10.2147/OTT.S161905
Checked for plagiarism Yes
Review by Single anonymous peer review
Peer reviewer comments 2
Editor who approved publication: Dr Samir Farghaly
Osmond J D’Cruz,1 Sanjive Qazi,2 Larn Hwang,1,3 Kevin Ng,1 Vuong Trieu1,3
1Autotelic Inc, Costa Mesa, CA, USA; 2Biology Department, Gustavus Adolphus College, Saint Peter, MN, USA; 3Oncotelic Inc, Agoura Hills, CA, USA
Background: Overexpression of the cytokine – transforming growth factor-beta 2 (TGF-β2) – has been implicated in the malignant progression of pancreatic cancer (PAC). OT-101 (trabedersen) is an antisense oligodeoxynucleotide designed to target the human TGF-β2 mRNA. In a Phase I/II study, OT-101 treatment with subsequent chemotherapy was characterized by outstanding overall survival (OS) in patients with PAC.
Objective: This study sought to identify 1) co-regulated sets of cyto-/chemokines; 2) potential mechanisms that link TGF-β receptor type 2 receptor inhibition that may result in the induction of a cytokine storm; and 3) predictive biomarkers for OS outcome in OT-101-treated patients with PAC.
Materials and methods: Plasma levels of 31 cyto-/chemokines were tracked over three cycles of OT-101 therapy (140 mg/m2/day) in 12 PAC patients. Samples were acquired before onset of OT-101 therapy and at eight selected time points during therapy. A mixed ANCOVA model was developed for 19 cyto-/chemokines with median expression >1 following OT-101 therapy. Regression and hierarchical clustering analyses were performed to identify correlated expressions in each patient across cyto-/chemokines or in each cyto-/chemokine across patients. Plasma cyto-/chemokine levels were compared with OS with and without subsequent chemotherapy.
Results: Three highly correlated subsets of cyto-/chemokines (Cluster 1: EGF, MIP-1α, MIP-1β; Cluster 2: FGF-2, MIG, IP-10, IL-15, IFN-α, IL-12; and Cluster 3: HGF, IL-6, IL-8) were identified following OT-101 therapy. Suppression of TGF-β signaling by OT-101 led to upregulation of IL-8, IL-15, IP-10, and HGF. Protein–protein interaction networks constructed using STRING10 algorithm identified a relationship between IL-8, IL-15, and TGF-β receptor type 2 inhibition. The mixed analysis of covariance model that examined the levels of 19 cyto-/chemokines with OS as the covariate at each of the time points resulted in IL-8 and IL-15 exhibiting a significant association with OS during Cycle 1 of therapy. In the whole-blood culture model, the cytokines with the most pronounced increase after OT-101 treatment were IL-1β, IL-8, and MCP-1.
Conclusion: No consistent responses in cyto-/chemokine levels were observed due to OT-101 treatment. Levels of IL-8 and IL-15 during Cycle 1 were positively associated with OS across 12 patients with PAC and served as potential biomarkers for treatment outcome following OT-101 therapy.
Keywords: antisense oligonucleotides, biomarkers, cytokines, pancreatic cancer, survival, transforming growth factor-beta 2
Introduction
Transforming growth factor-beta (TGF-β) is a multifunctional regulatory polypeptide that controls many aspects of cell function – including cell proliferation, differentiation, migration, apoptosis, adhesion, angiogenesis, immune surveillance, and survival.1 TGF-β has a dual role in cancer.2 It is tumor suppressive in premalignant cells and in the early stage of tumor development, but strongly protumorigenic at later stages of tumor progression. Autocrine TGF-β signaling promotes epithelial–mesenchymal transition, which increases cell invasion and metastasis.3 Paracrine TGF-β signaling stimulates angiogenesis and contributes to an immune-tolerant environment by suppressing T lymphocytes and natural killer (NK) cells. The overall balance of tumor inflammatory mechanisms is polarized to promote angiogenesis, tumor cell survival, and immune escape, all contributing to tumor growth.4 Consequently, different strategies have been developed to inhibit TGF-β activity in the tumor microenvironment including 1) blocking the production of TGF-β with antisense molecules, 2) blocking the activity of TGF-β with neutralizing antibodies, 3) blocking the interaction between TGF-β and its receptors (TGF-βR) with soluble forms of TGF-βRs, and 4) blocking TGF-β–mediated receptor signaling by small-molecule tyrosine kinase inhibitors of TGF-βRII and TGF-βRIII.5–8
OT-101 (trabedersen) is an 18-mer phosphorothioate antisense oligodeoxynucleotide designed to specifically target the human TGF-β2 mRNA.5,9,10 On the basis of data showing that TGF-β2 is overexpressed in multiple cancers and that its levels are closely related to tumor progression, OT-101 has been clinically evaluated in patients with high-grade glioma, pancreatic and colorectal cancers, as well as melanoma.10–15 Furthermore, inhibition of TGF-β2 in tumor tissue leads to reversal of tumor-induced immune suppression as well as inhibition of tumor growth, invasion, and metastasis.8–10 Similar to its function in malignant glioma, TGF-β2 appears to play a central role in the malignancy and progression of pancreatic cancer (PAC).16,17 All three mammalian isoforms of TGF-β (TGF-β1, TGF-β2, and TGF-β3) are overexpressed in human PAC cells in comparison to the normal human pancreas.16 However, only overexpression of the TGF-β2 isoform in either tumor tissue or plasma has been shown to correlate with advanced tumor stage and a more aggressive metastasizing tumor phenotype, as proven both by animal studies and clinical observations in humans.16,18,19 In PAC, TGF-β2 plasma levels of patients are significantly elevated threefold as compared to healthy controls.
OT-101 reduced TGF-β2 secretion in PAC cell lines (Hup-T3, Hup-T4, and PA-TU-8902), with a half maximal inhibitory concentration (IC50) in the low micromolar range without a transfection reagent, efficiently suppressed cell proliferation, and completely blocked migration of PAC cells.5,9,10 Most importantly, OT-101 at clinically applied doses reversed TGF-β2–mediated immunosuppression of PAC cells targeted by lymphokine- activated killer (LAK) cells, resulting in considerably increased LAK cell–mediated cytotoxicity.5,10 Furthermore, in an orthotopic mouse model of metastatic PAC, intraperitoneal treatment with OT-101 significantly reduced tumor growth, lymph node metastasis, and angiogenesis.9 In a Phase I/II clinical trial in 37 patients with advanced PAC, a subset of patients who received OT-101 treatment followed by subsequent chemotherapy showed outstanding overall survival (OS) benefit.20 Consequently, combining agents targeting the tumor microenvironment with chemotherapeutic agents is an emerging therapeutic arsenal against cancer.21 Therefore, it will be important to determine the effect of OT-101 as an immunomodulating agent on the tumor microenvironment.
Cytokines play a pivotal role in the induction of cell-mediated and humoral immunity. Patients with advanced-stage cancer appear to experience a simultaneous immunostimulation and immunosuppression with increased concentrations of immunomodulating cytokines.22 The result is a local inflammatory environment that appears to be a consistent component of malignant tumors.23–25 Because OT-101 can interfere with autocrine TGF-β2 signaling and can reverse the immunosuppressive effects exerted by tumor-derived TGF-β2,5,9,10 a better understanding of the molecular cross-talk between tumor cells and the immune system would be helpful in developing immunotherapeutic approaches to PAC. OT-101 stimulates immune cells as a consequence of TGF-β2 inhibition and of target independent effects. In the course of this immune stimulation, inflammatory cytokines are secreted.26 Thus, the main goals of the present study were to analyze, in depth, the cyto-/chemokine expression patterns in PAC patients exposed to OT-101 treatment with and without subsequent chemotherapy and to identify whether this sequential strategy is associated with better survival outcome.
In this study, we sought to identify 1) co-regulated sets of cyto-/chemokines; 2) potential mechanisms that link TGFBR2 receptor inhibition that may result in the induction of a cytokine storm; and 3) predictive biomarkers for OS outcome in OT-101–treated PAC patients. This analysis utilized data from plasma levels of 31 cyto-/chemokines quantitated from a subset of 12 PAC patients in the Phase 1/II (P001) study to determine the impact of OT-101 on clinical outcome. Plasma samples analyzed were acquired before the onset of OT-101 therapy, during the screening phase of the study, and at selected time points (TPs) during the therapy. In addition, both stimulated and unstimulated whole-blood cultures of healthy volunteers were tested ex vivo for either induction or repression of 34 cyto-/chemokines by OT-101. Taken together, these findings suggest the lack of a clear indication of a cytokine storm-like phenomenon of OT-101, although the drug is not without stimulating potential on cells of the human immune system under physiological conditions. Using the mixed analysis of variance (ANOVA) model, levels of IL-8 and IL-15 during Cycle 1 were positively associated with OS across 12 PAC patients and served as potential predictive biomarkers for treatment outcome following sequential OT-101 and chemotherapy strategies for PAC.
Materials and methods
Patient selection, study design, and OT-101 therapy
A Phase I/II OT-101 multicenter dose-escalation clinical study (P001 study) was conducted in Germany in adult patients (n = 61), stage III or IV (AJCC 2002) with advanced PAC (n = 37), malignant melanoma (n = 19), and colorectal cancer (n = 5), all known to overproduce TGF-β2. This clinical trial (NCT00844064) was sponsored by Antisense Pharma GmbH (Regensburg, Germany) and approved by the Ethics Committee of the Charité Berlin Campus Virchow-Klinikum (Berlin, Germany). Written informed consent was obtained from all study subjects, and ethical committee approval was given by all participating centers. Patients were treated with OT-101 by continuous intravenous (IV) infusion in escalating doses (40 mg/m2/day up to 330 mg/m2/day) of two treatment schedules (initial schedule: 7-days on, 7-days off (n = 17); modified schedule: 4-days on, 10-days off (n = 44); two cycles as core study and up to 10 cycles for expanded study). The dose of 140 mg/m2/day was chosen based upon a trend for better tolerability as compared to higher doses for this schedule while also showing some disease stabilization during the escalation phase.
Plasma samples from a subset of 12 patients (three men [43–73 years] and nine women [40–75 years]) with advanced PAC were analyzed in an exploratory analytical study to assess the impact of OT-101 treatment on levels of 31 circulating cyto-/chemokines. These patients were treated with OT-101 (140 mg/m2/day) in the 4-days-on, 10-days-off schedule (1 cycle = 14 days). Blood samples were collected from 23 TPs, with the following TPs having the cyto-/chemokine measurements from most of the patients and, thus, were included in the analysis. Day 1 values for each patient were baseline levels (TP) for the 31 cyto-/chemokines prior to OT-101 treatment. Following initiation of IV OT-101 therapy: Cycle 1/Day 2 (TP 2), Cycle 1/Day 5 (TP 3), Cycle 2/Day 1 (TP 6), Cycle 2/Day 2 (TP 7), Cycle 2/Day 5 (TP 8), final visit/Day 29 (TP 9), and exit period/Cycle 3/Day 5 (TP 11, 34th day). Samples in ethylenediaminetetraacetic acid were measured in duplicate, and data were acquired by Lophius Biosciences (Regensburg, Germany) for the analysis of multiple cytokines.
The following 31 analytes were measured: EGF, eotaxin, FGF-basic, G-CSF, granulocyte–monocyte colony-stimulating factor, HGF, IFN-α, IFN-γ, IL-1RA, IL-1β, IL-2, IL-2R, IL-4, IL-5, IL-6, IL-7, IL-8, IL-10, IL-12 (p40/p70), IL-13, IL-15, IL-17, IP-10, MCP-1, MIG, MIP-1α, MIP-1β, RANTES, TNF-α, VEGF, and MICA. Cyto-/chemokine concentration in pg/mL for each plasma sample was measured in duplicate. In cases where the concentration was too low to be determined, the values of the detection limit were used for further calculations. Detection limits were provided by the manufacturer of the assay (Lophius Biosciences). In cases where the concentration was too high to be determined, the 1.5-fold value of the highest standard for the applicable cyto-/chemokine that was measured on the plate was used for further calculations.
Analysis of cyto-/chemokine response to three cycles of OT-101 therapy
An ANCOVA model was developed to characterize time evolution of cyto-/chemokine levels following OT-101 treatment. The dependent variable was the standardized log10-transformed values calculated from the mean and standard deviation (SD) of each cyto-/chemokine in each patient. Cyto-/chemokines were treated as a categorical variable, TPs were treated as a continuous variable and each patient was treated as a random factor with a separate variance component (to control for multiple measurements taken from the same individual and to take into account differences in the responses between individuals). This model corrects for the appropriate degrees of freedom (DF) in a model with both fixed (time effect, cytokine effect and time cytokine interaction) and random effects (patient to patient variation). The model consisted of 19 measureable cyto-/chemokines with median expression >1.
Hierarchical cluster analysis of cyto-/chemokine profile
Regression and hierarchical cluster analyses were conducted to identify potential cytokine signatures in patients investigated in this cohort as follows: 1) characterization of pre- and postdose circulating levels of 31 cyto-/chemokines in 12 PAC patients at eight selected TPs during OT-101 treatment protocol; 2) identify co-regulated sets of cyto-/chemokines to characterize initiation of a cytokine storm; 3) potential mechanisms that link TGFBR2 inhibition that may result in the induction of a cytokine storm; 4) examine patient-to-patient variability in the response profiles for cyto-/chemokines involved in the emergence of a cytokine storm; and 5) investigate the relationship between cyto-/chemokine levels and OS outcome in 12 patients. Pearson pairwise correlation coefficients of cyto-/chemokine levels across all TPs and all patients were utilized to construct a correlation cluster figure to identify co-regulated cyto-/chemokines. Cluster figures were either depicted for each individual patient or across all patients by utilizing standardized values calculated from the mean and SD of each cyto-/chemokine in each patient.
Protein–protein interaction networks
Protein–protein interaction networks were constructed using STRING10 algorithm (http://string-db.org/) for co-regulated cyto-/chemokines to identify potential hub proteins connecting TGFBR2 pathways to cyto-/chemokines. In these diagrams, the nodes depict protein identifiers. Networks were visualized by first seeding the inputs and then growing the networks to identify connecting hubs between the inputs. The edges indicated the confidence level for the association that was calculated from various lines of experimental evidence (Neighborhood, Gene Fusion, Co-occurrence, Co-expression, Experiments, Text mining, Databases, and Homology. All associations were filtered for >90% confidence). Clustering was conducted on the association scores to group protein–protein interaction networks (“MCL” algorithm provided by the software). Solid lines represent connections within clusters, and dotted lines show connections between clusters.
Cyto-/chemokine response to OT-101 treatment over three cycles and OS outcome
An ANCOVA model was utilized to investigate the association of 30 cytokine levels measured across 12 patients over three cycles of OT-101 therapy (measured at Cycle 1, Days 2 and 5; Cycle 2, Days 1, 2 and 5; final visit [Day 29]; exit period/Cycle 3/Day 5 [Day 34]) and the OS outcome. The dependent variable was the standardized log10-transformed values calculated from the mean and SD of each cyto-/chemokine in each patient. The ANCOVA model was constructed such that at each of the cycles and TPs, two factors (cyto-/chemokine id and OS as a covariate) and an interaction term (cyto-/chemokine id x OS to profile the dependent variable response for each of the cyto-/chemokines and the OS) described changes in cyto-/chemokines and related it to OS. TPs with which the model exhibited significant effects were further examined for the association of the cyto-/chemokine response and OS across 12 patients. Moreover, the median OS of a subset of patients following OT-101 therapy who received either single- or multi-agent chemotherapy (oxaliplatin, 5-fluorouracil, paclitaxel, gemcitabine, erlotinib, or capecitabine) that was dosed within 2 weeks of the last OT-101 infusion were compared. To test whether the assumptions of the model were satisfied, normal quantile plots were examined for distribution of the residuals of the model. The significance of the relationship of the cyto-/chemokine and OS was assessed from the interaction term parameters and model error determination for each of the cyto-/chemokines (P-values < 0.05 were deemed significant if the false discovery rate [FDR] was <10%, considering all the relationships in the interaction term). All calculations were carried out in JMP 10.02 (SAS, Cary, NC, USA).
Whole-blood cell cultures for the cyto-/chemokine response to OT-101
A whole-blood culture model was utilized to quantitate the cyto-/chemokine response to OT-101. Whole-blood cultures, in general, are superior to other culture models of cells of the human immune system in that these cultures include the complete spectrum of cells of the immune system found circulating in peripheral blood.27 The whole-blood cultures were initiated within 1 hour of blood collection in order to prevent any loss of cell activity or nonspecific activation of the leukocytes. Both unstimulated and stimulated whole-blood cell cultures (without cell culture medium or serum, but stimulated by bacterial lipopolysaccharide [LPS] or staphylococcal enterotoxin B [SE-B – a bacterial superantigen]) were grown in 96-well micro-culture plates with corresponding controls (unstimulated cell control, unstimulated solvent control, stimulation control, and stimulated solvent control). For each donor, one plate was prepared with all experiments being conducted in triplicate. Different dilutions of OT-101 (0.187, 0.75, 3, 12, and 48 μg/mL) were transferred into the plate and incubated with whole-blood cells of different donors for 1 hour. Thereafter, media for the unstimulated cultures or the different stimuli (LPS [10 ng/mL] or SE-B [25 ng/mL]) were added to the blood cells in order to mimic inflammatory situations within the cell cultures: the mixture of sample and capture microspheres were thoroughly mixed and incubated at room temperature (RT) for 1 hour. At the end of the 48-hour stimulation, the supernatants in triplicate were tested as follows: Multiplexed cocktails of biotinylated reporter antibodies for each multiplex were then added robotically and, after thorough mixing, incubated for 1 hour at RT. Multiplexes were developed using an excess of streptavidin–phycoerythrin solution for 1 hour at RT. Analysis of each multiplexed reaction in matrix buffer was conducted in a Luminex 100/200 instrument, and the resulting data stream was interpreted using data analysis software developed at Rules-Based Medicine (Myriad Genetics, Austin, TX, USA).
Analyte determination in whole-blood culture
Except for IFN-α, which was subsequently measured by enzyme-linked immunoassay (ELISA), the concentration of each analyte to be tested in the supernatants from the blood culture was determined using a multiparametric bead-based readout system (Luminex™), called the multi-analyte profile (MAP) test. Aliquots of thawed and clarified samples were introduced into one of the capture microsphere multiplexes of the human MAP cores #1 and #2. The following 34 analytes were studied by the MAP test: brain-derived neurotrophic factor, granulocyte–monocyte colony-stimulating factor, IL-1α, IL-2, IL-5, IL-8, IL-12 p70, IL-18, MIP-1α, matrix metalloproteinase (MMP)-2, MCP-1, TNF-α, eotaxin, intercellular adhesion molecule-1, IL-1β, IL-3, IL-6, IL-10, IL-15, IL-23, MIP-1β, MMP-3, stem cell factor, TNF-β, Factor VII, IFN-γ, IL-1ra, IL-4, IL-7, IL-12 p40, IL-17, MMP-9, VEGF, and IFN-α (single test by ELISA). For each multiplex, both calibrators and controls were included on each microtiter plate. The eight-point calibrators were run in the first and last columns of each plate and three-level controls (high, medium, and low) were included in duplicate. Unknown values for the analytes localized in a specific multiplex were determined with four or five parameters by using weighted and nonweighted curve-fitting algorithms of the data analysis package. To evaluate the results of these experiments, a ratio was calculated by dividing the values of the different OT-101 concentrations by the values of the matched control cultures: 1) the stimulated solvent control for the activated blood cultures and 2) the solvent control for the unstimulated blood cultures. A stimulation index (SI) was used to categorize the analyte results (SI <0.7 to SI >2.0, or >30% inhibition to >100% stimulation).
Results
Cyto-/chemokine profiles during OT-101 therapy in PAC patients
The impact of OT-101 treatment (Phase I/II, P001 study) on 31 cyto-/chemokine levels was assessed in a subset of 12 patients with advanced PAC. These patients were treated with OT-101 (140 mg/m2/day) in the 4-days-on, 10-days-off schedule (1 cycle = 14 days). Day 1 values (TP 1) for each patient were baseline levels prior to OT-101 treatment. Among the 23 TPs for blood sampling after the initiation of OT-101 therapy, blood from eight TPs were tested for cyto-/chemokine levels on Cycle 1/Day 2 (TP 2), Cycle 1/Day 5 (TP 3), Cycle 2/Day 1 (TP 6), Cycle 2/Day 2 (TP 7), Cycle 2/Day 5 (TP 8), final visit/Day 29 (TP 9), and exit period: Cycle 3/Day 5 (TP 11, 34th day). The expression of 12 of the 31 cyto-/chemokines investigated were below the lower limit of detection (pg/mL). The induction or repression of 19 quantifiable cyto-/chemokine levels was assessed by normalizing the levels of each cyto-/chemokine to the levels observed in the screening sample for each TP. An ANCOVA model was utilized to investigate the association of 19 cyto-/chemokine levels measured across 12 patients over three cycles of OT-101 therapy and the OS outcome with and without subsequent chemotherapy. The dependent variable was the standardized log10-transformed values calculated from the mean and SD of each cyto-/chemokine in each patient.
Correlated cyto-/chemokine response during three cycles of OT-101 therapy
The mixed ANCOVA model explained a significant proportion of the observed data for the quantifiable levels of 19 cyto-/chemokines (EGF, eotaxin, FGF basic, HGF, IFN-α, IL1RA, IL-2R, IL-6, IL-7, IL-8, IL-12, IL-15, IP-10, MCP-1, MICA, MIG, MIP-1α, MIP-1β, and RANTES; R2 = 0.76, P < 0.0001; Figure 1). The variance component that examined patient-to-patient variation (random effect) accounted for 16.8% of total variance. Significant differences were observed between cyto-/chemokine levels (F18,1547 = 250, P < 0.0001), and levels of cyto-/chemokines across TPs (F1,1550 = 14.4, P = 0.0002) with no interaction between cytokine levels and regression across TPs (F18,1547 = 1.05, P = 0.398). The significant time effect in this model enabled the characterization of the correlational structure of these expression values across patients and cyto-/chemokines to identify modules of co-regulated cyto-/chemokines. An examination of the parametric estimates of the mixed ANCOVA model across TPs to identify individually affected cyto-/chemokines showed that only EGF levels increased significantly across TPs (DF = 1,547, T = 2.59, P = 0.0097). An increasing trend was observed for 13 of the 19 cyto-/chemokines (Figure 2). Values differed significantly between TPs for eotaxin, G-CSF, IL-6, IL-15, and IP-10.
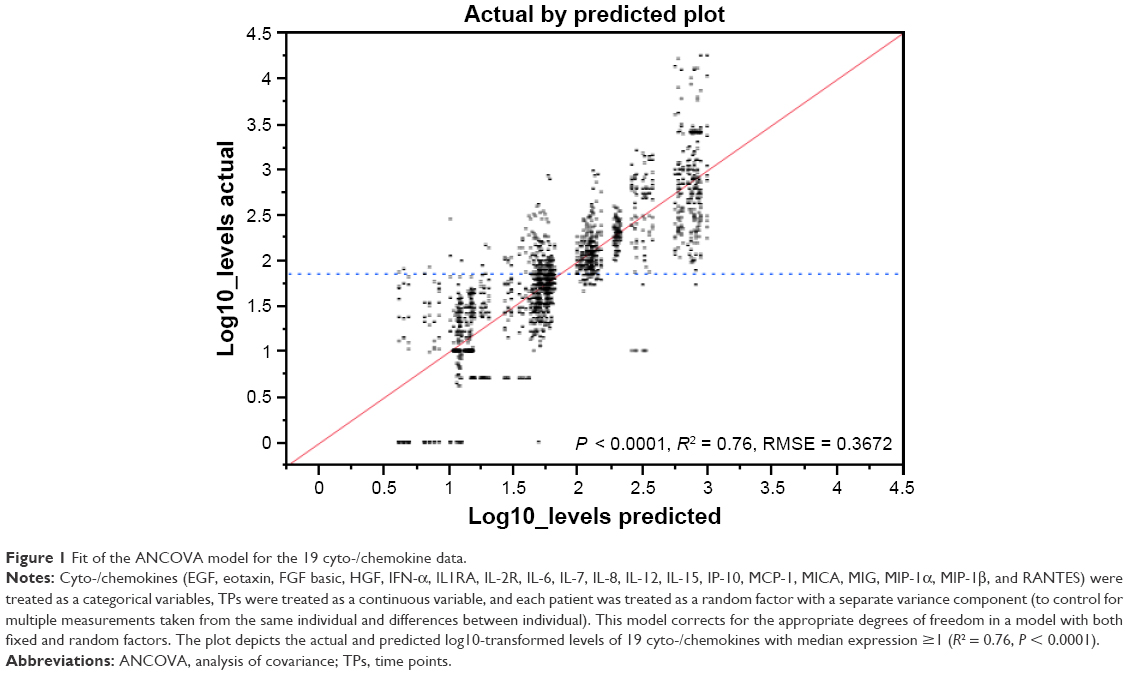 | Figure 1 Fit of the ANCOVA model for the 19 cyto-/chemokine data. |
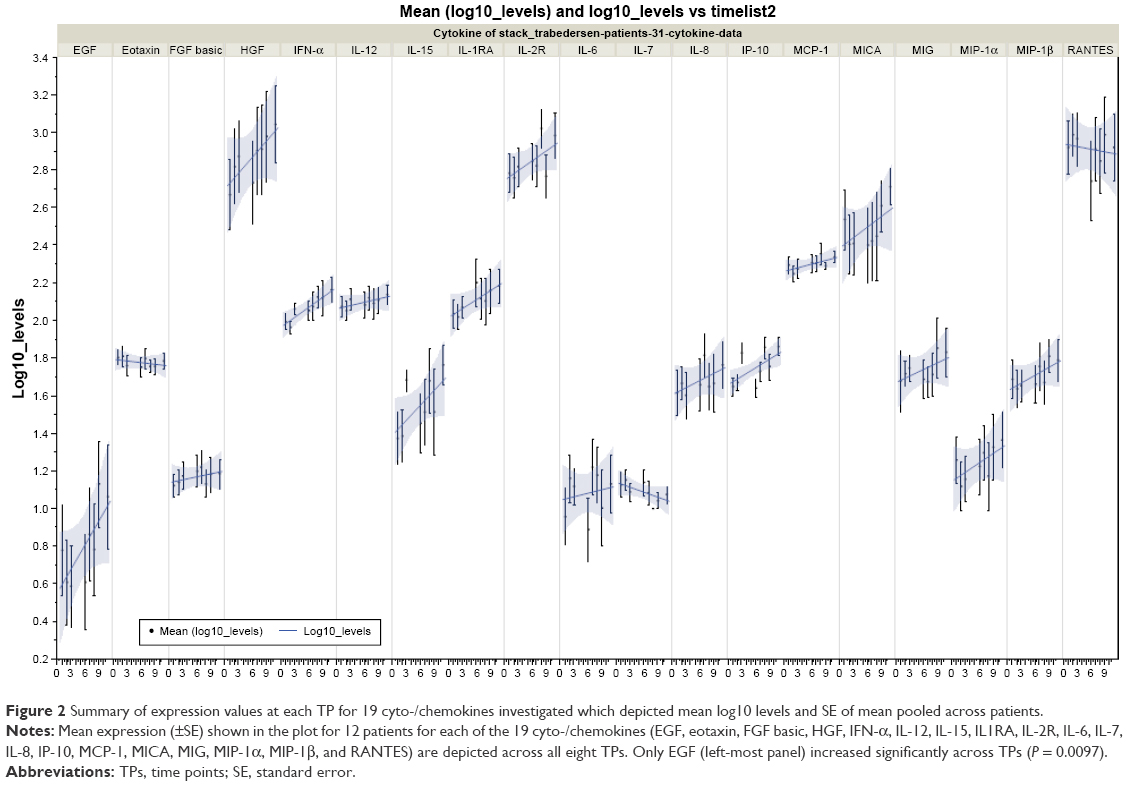 | Figure 2 Summary of expression values at each TP for 19 cyto-/chemokines investigated which depicted mean log10 levels and SE of mean pooled across patients. |
Hierarchical cluster analysis of patient cyto-/chemokine levels
Finding patient clusters according to their relative cyto-/chemokine levels may reveal useful and/or meaningful insights into groups of patients that might differ in their response to OT-101 treatment. Therefore, cluster analysis was conducted for eight TP values. Clustering of correlation coefficients resulted in the identification of three highly correlated subsets of cyto-/chemokines (Figure 3; Cluster 1: EGF, CCL3/MIP-1α, and CCL4/MIP-1β; Cluster 2: FGF2, CXCL9/MIG, CXCL10/IP-10, IL-15, IFNA1/IFN-α, and IL12A/IL-12; and Cluster 3: HGF, IL-6, and IL-8).
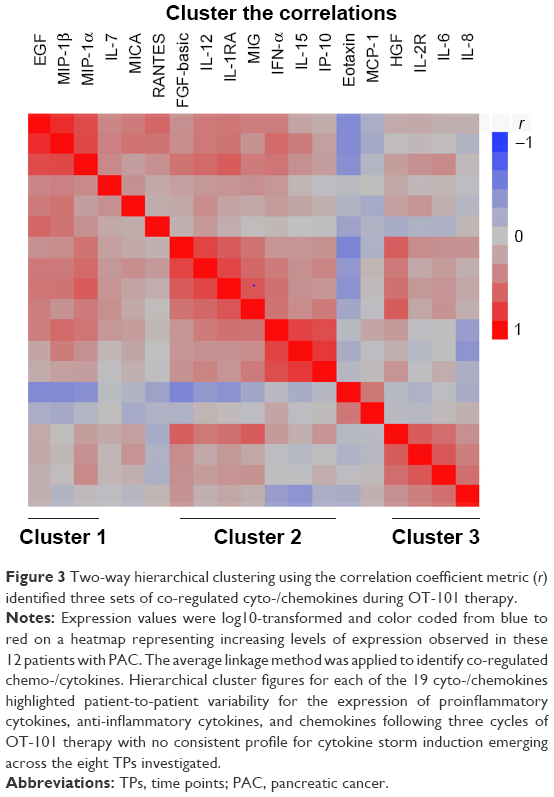 |
Figure 3 Two-way hierarchical clustering using the correlation coefficient metric (r) identified three sets of co-regulated cyto-/chemokines during OT-101 therapy. |
Protein–protein interaction networks were constructed using STRING10 algorithm for co-regulated cyto-/chemokines to identify potential hub proteins connecting TGFBR2 pathways to cyto-/chemokines. Networks were visualized by initially seeding the inputs from 16 co-regulated cyto-/chemokines (EGF, CCL11, IFN-α, IL-10, IL-12A, IL-15, IL-1β, IL-1RN, IL-2, IL-4, CXCL8, CXCL10, CCL2, MICA, CXCL9, and CCL3). Positive correlations of at least five TPs were considered for calculation of Pearson correlation coefficients from 12 patients and 30 cyto-/chemokines (18,646 pairs). In total, 1,762 correlations were significant with P < 0.05 (FDR = 53%). In total, 175 correlations were significant at the 0.002 level (FDR = 21%), from 12 patients treated with three cycles of OT-101, and then grown to identify the connecting hubs between the inputs. Correlations of cytokines and chemokines in comparisons of patients 1035 and 1037 identified only 44 significant correlations with other patients. This analysis identified 16 cytokines co-regulated between these two patients to five other patients in the data set. STAT1, STAT3, MYD88, and TRAF6 formed hub proteins connecting these 16 cytokines with no clear emergence of a cytokine storm in these patients.
Potential interactions with the TGFBR1/2 pathway and Cluster 1–3 proteins were evaluated using the STRING10 algorithm to identify and group connecting protein–protein interaction networks. Connections of the TGFBR2 pathway to Cluster 1 proteins potentially occur through STAT3, JUN, SRC, and SHC1 proteins (Figure 4); connections to Cluster 2 proteins can occur via UBC, CTNNB1, MYD88, and TRAF6 (Figure 5); and connections to Cluster 3 can occur via RELA, EP300, and HDAC2 (Figure 6).
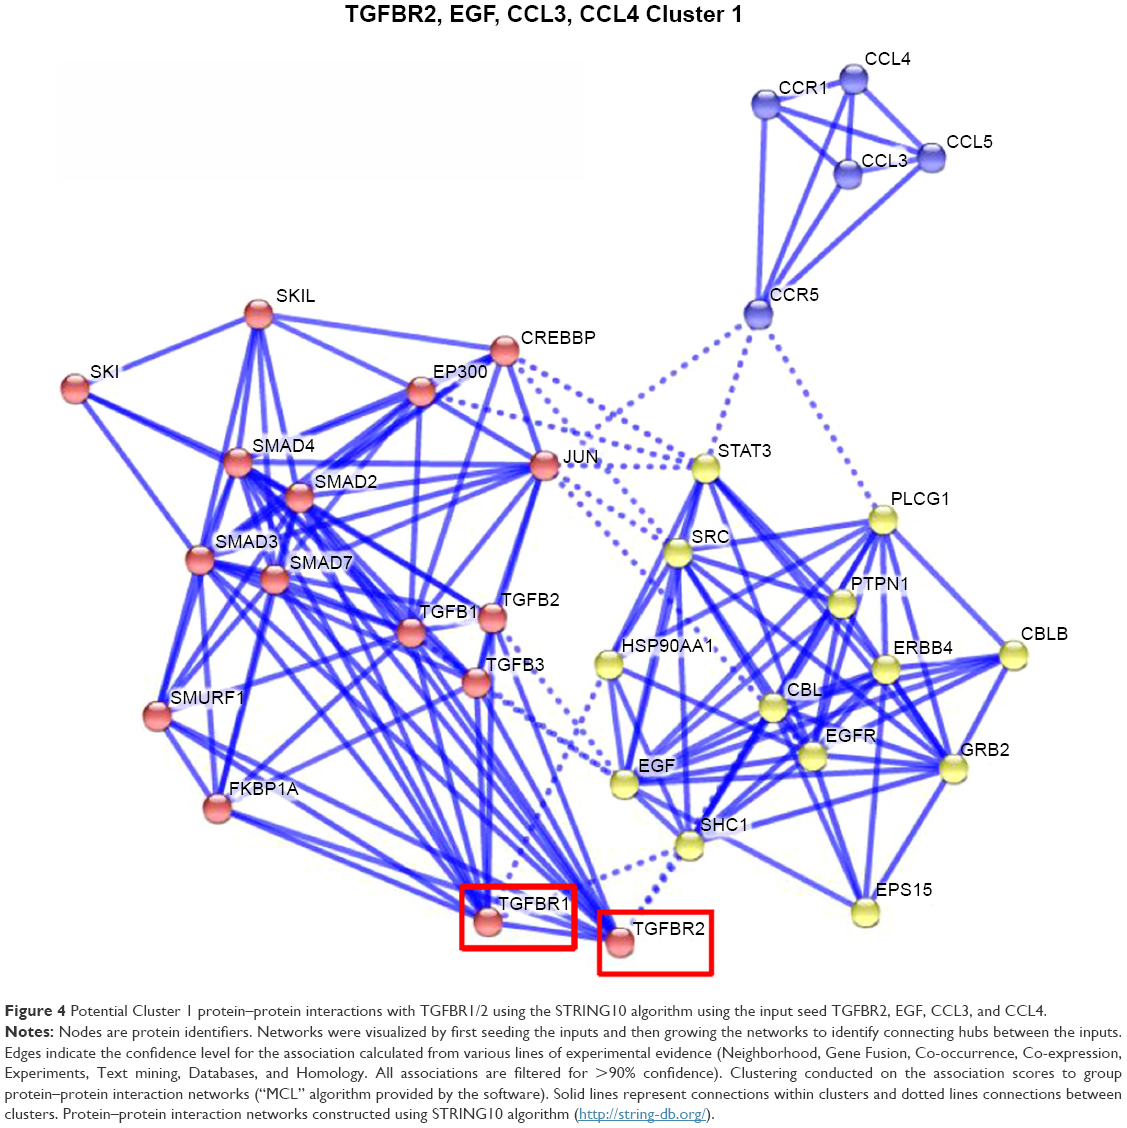 |
Figure 4 Potential Cluster 1 protein–protein interactions with TGFBR1/2 using the STRING10 algorithm using the input seed TGFBR2, EGF, CCL3, and CCL4. |
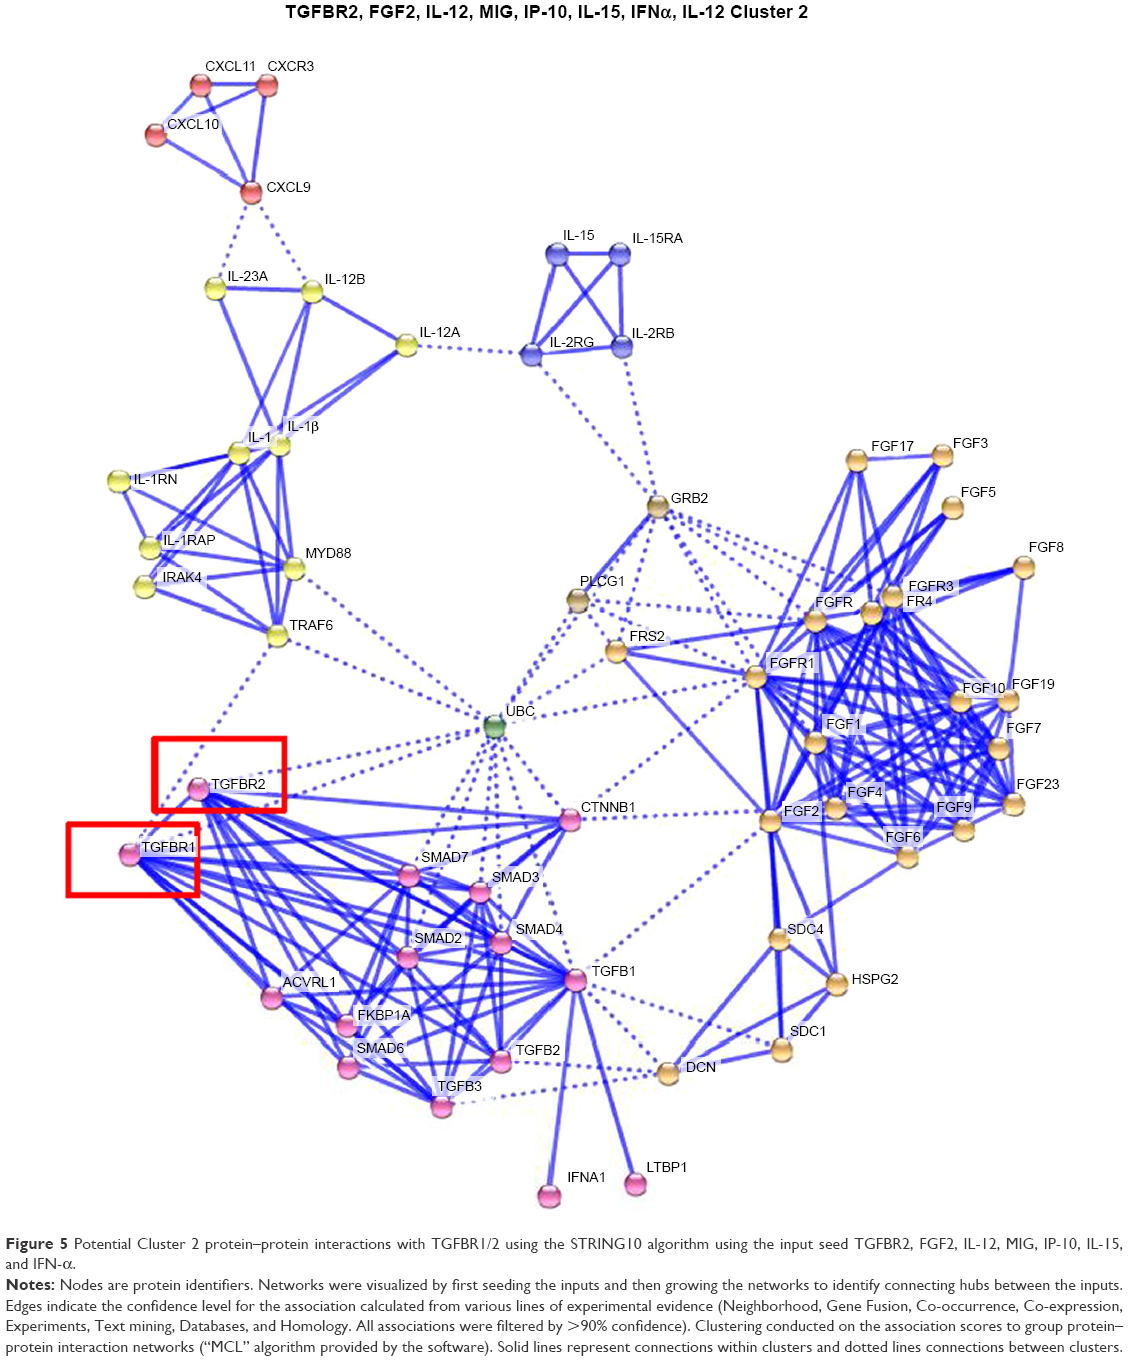 | Figure 5 Potential Cluster 2 protein–protein interactions with TGFBR1/2 using the STRING10 algorithm using the input seed TGFBR2, FGF2, IL-12, MIG, IP-10, IL-15, and IFN-α. |
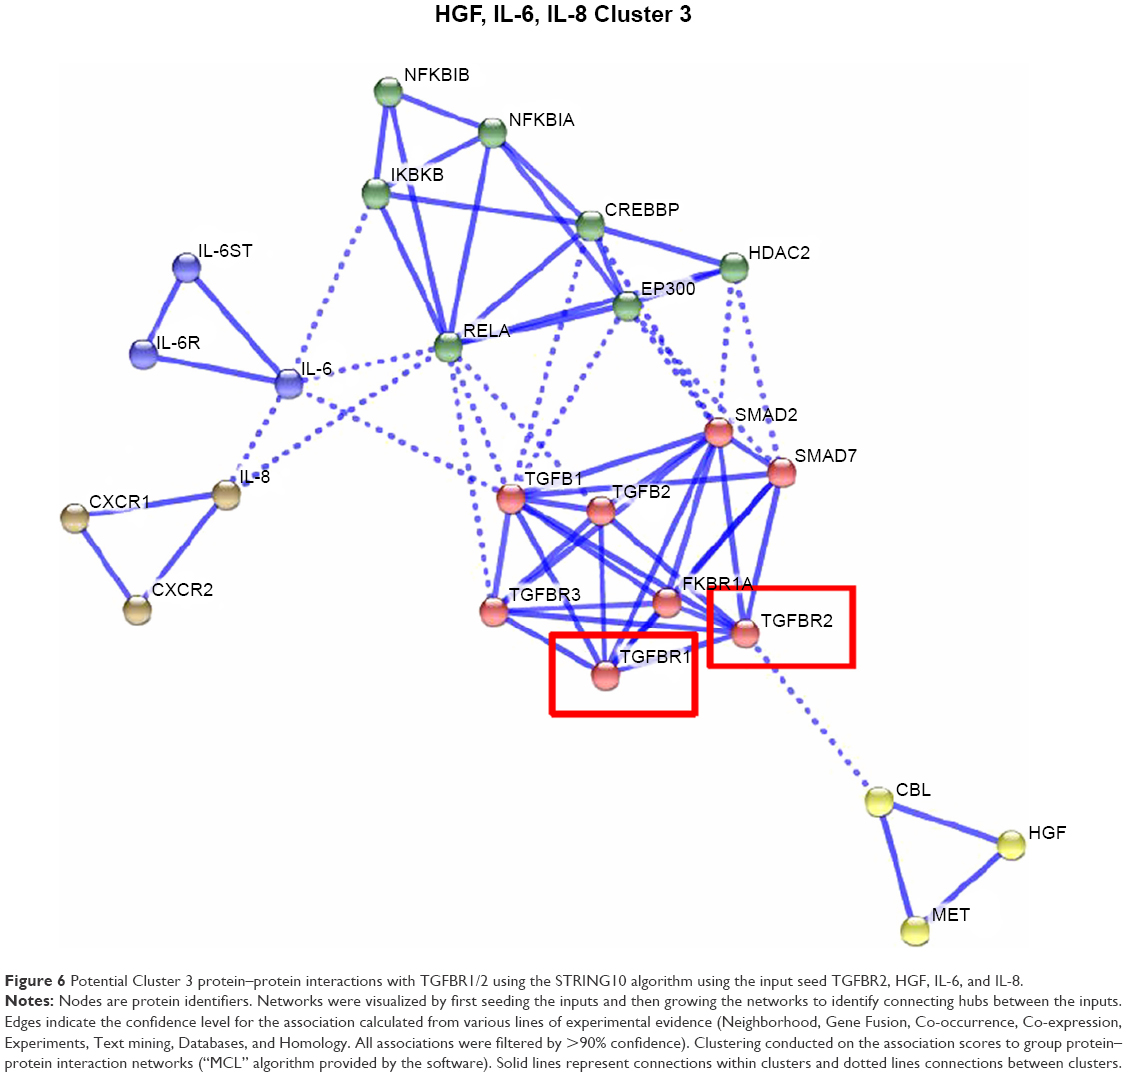 |
Figure 6 Potential Cluster 3 protein–protein interactions with TGFBR1/2 using the STRING10 algorithm using the input seed TGFBR2, HGF, IL-6, and IL-8. |
Identification of protein–protein interactions linking TGFBR2 to cyto-/chemokines
To identify cross-talk mechanisms for TGF-β pathways and transcriptional activation of cyto-/chemokines, a text-mining approach was undertaken. Suppression of TGF-β signaling by OT-101 led to a significant upregulation of IL-15, IP-10, and HGF, with a mean induction factor of 2.7, 1.7, and 2.2, respectively. Furthermore, positive correlations were observed with other cyto-/chemokines that were investigated in this study. Therefore, a literature survey was carried out through text mining in an EVEX database, which contains more than 40 million biomolecular events among more than 76 million automatically extracted gene/protein name listings (http://evexdb.org/), to identify potential mechanisms that exhibited downregulation of transcriptional activation of cyto-/chemokines via activation of the TGF-β pathway. Two mechanisms were discovered that linked TGF-β pathway activation and downregulation of STAT1 via the IFN pathway that targets IP-10 and MIG expression,28,29 whereas STAT6 targeted HGF which was upregulated by OT-101.30 In addition, the TGF-β pathway is capable of inhibiting nuclear factor-kB (NF-κB), which targets TNF-α, IL-1β, IL-6, IL-12, and MIP-1β activation via p38.31 Both of these mechanisms for the negative regulation via STAT1 and NF-κB pathways were identified in the protein–protein networks linking TGFBR2 to cyto-/chemokines, thereby providing potential mechanisms for the induction of cytokine storms in these patients.
Examination of patient to patient variation for the expression of proinflammatory cytokines, anti-inflammatory factors, and chemokines revealed that four (patients 1035, 1037, 1044, and 1051) out of 12 patients exhibited a consistent increase in the levels of proinflammatory cytokines (IL-1β and MIP-1α), and fewer patients registered increases for each of the other cytokines in the study (Figure 7). Hierarchical cluster figures for each of the cyto-/chemokines highlighted patient-to-patient variability for the time profiles following three cycles of OT-101 treatment, with no consistent profile for induction of cytokine storm emergence across all the eight TPs investigated. Standardized expression values for each patient and each cyto-/chemokine presented as a cluster figure showed that the expression values ranged to within 2.5 SD units.
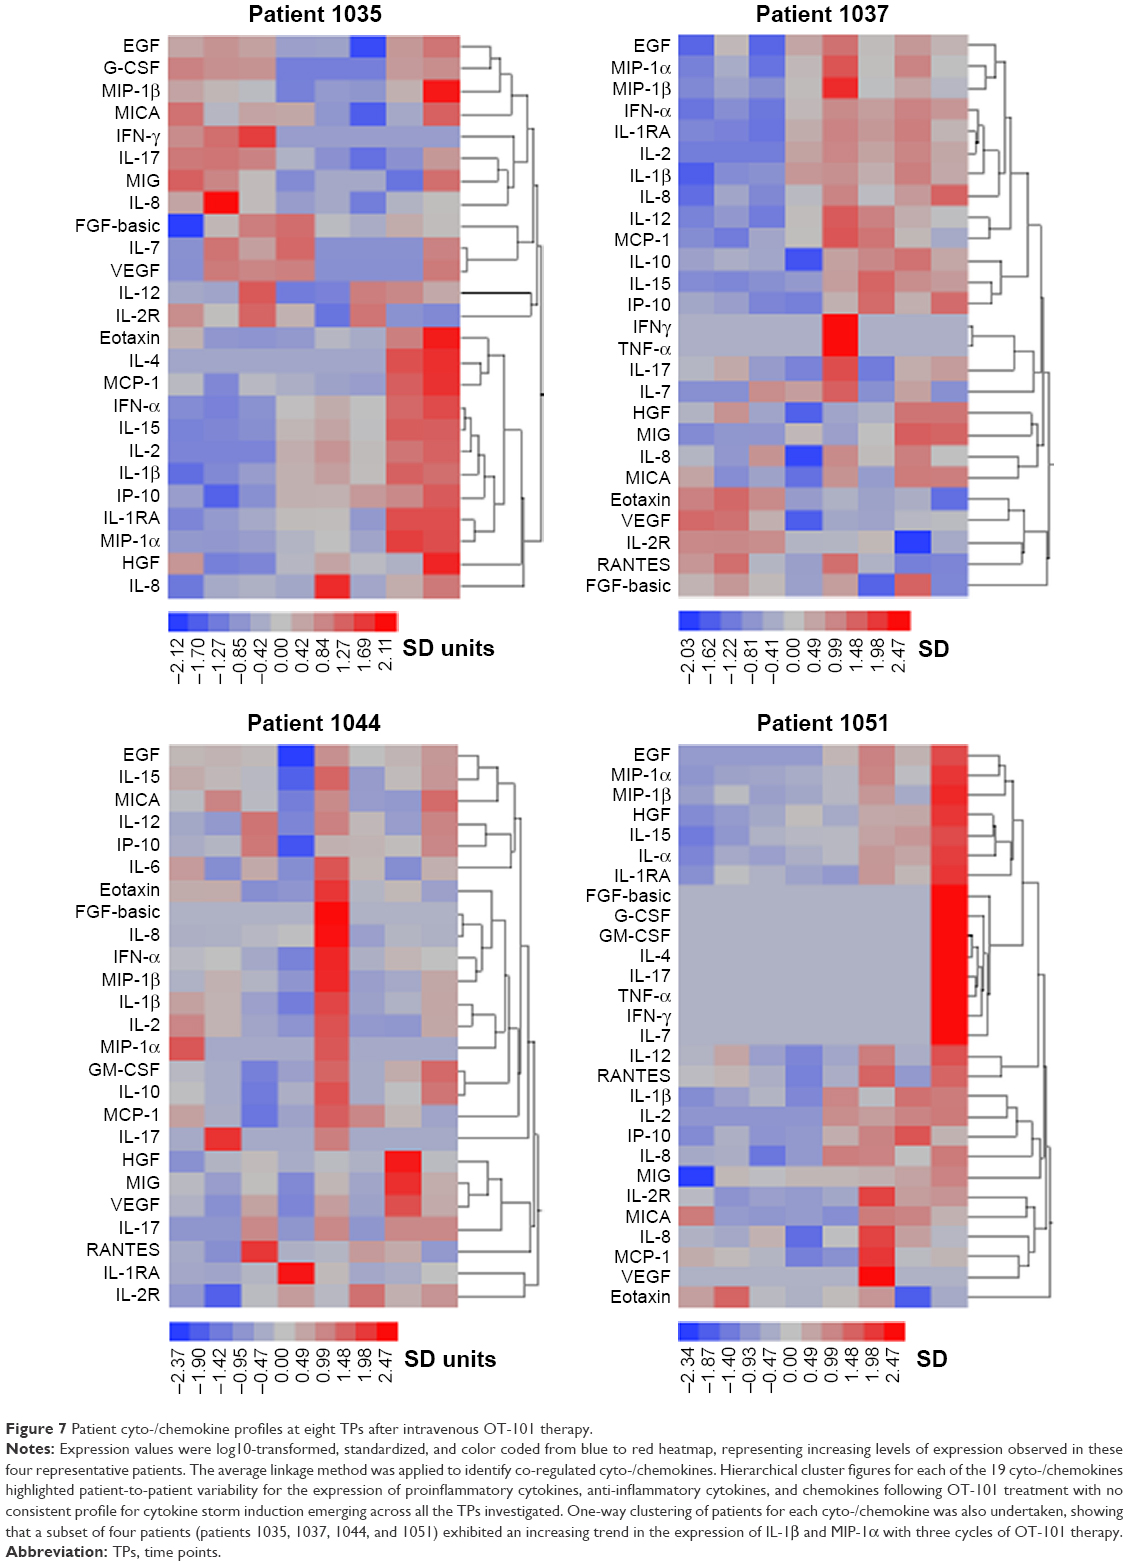 | Figure 7 Patient cyto-/chemokine profiles at eight TPs after intravenous OT-101 therapy. |
OT-101–induced cyto-/chemokine levels correlated with OS
The cyto-/chemokine response to OT-101 treatment over three cycles and OS outcome was examined. The ANCOVA model explained a significant proportion of the observed data for Cycle 1/Day 2 measurements of cyto-/chemokines (R2 = 0.3, F59,217 = 1.575, P < 0.0103). Other TPs did not exhibit a significant model fit or significant relationships in the interaction term: Baseline, R2 = 0.271, P = 0.0542 (no significant relationships in the interaction term); Cycle 1/Day 5, R2 = 0.26, P = 0.0984; Cycle 2/Day 1, R2 = 0.2, P = 0.892; Cycle 2/Day 2, R2 = 0.26, P = 0.368; Cycle 2/Day 5, R2 = 0.400, P = 0.0256 (no significant relationships in the interaction term); and final visit (Day 2), R2 = 0.170, P = 0.996; Cycle 3/Day 5 (Day 34), R2 = 0.229, P = 0.463. Three significant associations of cyto-/chemokine and OS were observed at Cycle 1/Day 2 measurements (7% FDR): eotaxin (negative association, T-value = −3.55, n = 12, P = 0.0005); IL-8 (positive association, T-value = 2.92, n = 12, P = 0.0039); and TNF-α (positive association, n = 4, T-value = 2.74, P = 0.0067).
IL-8 and IL-15 levels significantly correlated with OS
A detailed representation of EGF, IL-8, and IL-15 levels depicted using a heatmap and the clustering of patients across three cycles of OT-101 treatment exhibited variable responses in each of the 12 patients and at each of the treatment cycles (Figure 8). Patients were clustered according to the peak of the EGF, IL-8, and IL-15 response during Cycles 1–3. Pairwise correlations during Cycle 1 revealed that plasma EGF levels were positively associated with OS in nine patients with PAC measured after Cycle 1/Day 5 treatment with OT-101 (bivariate analysis with R2 = 0.64, DF = 7.1, T-value = 3.55, P = 0.0094). Although ANCOVA analysis suggested that EGF levels increased consistently across the three cycles of treatment, the survival benefit is lost when examining Cycles 2 and 3 and there was a trend of a negative relationship between EGF levels and OS.
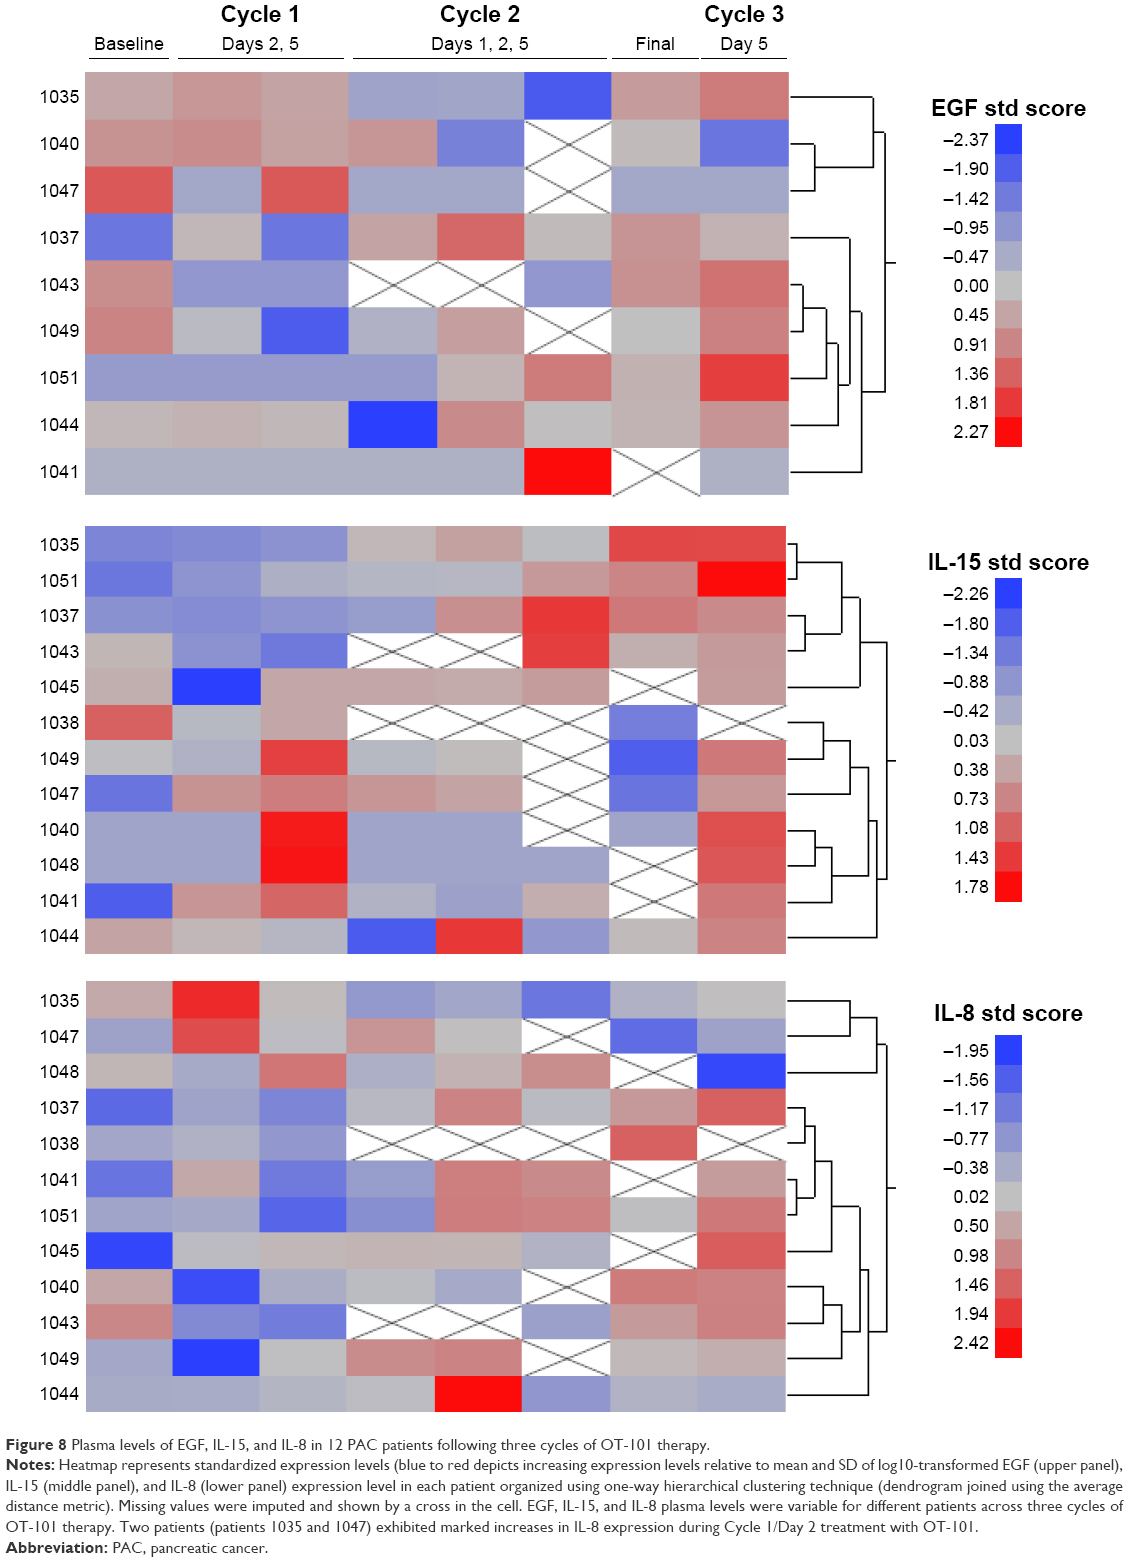 | Figure 8 Plasma levels of EGF, IL-15, and IL-8 in 12 PAC patients following three cycles of OT-101 therapy. |
Peak levels of IL-8 response after 2 days of OT-101 treatment were positively correlated with OS in patients with PAC. The maximum levels of IL-8 measured after Day 2 were subtracted from the maximum levels on Day 5 treatment after each cycle and these standardized scores were correlated with log10-transformed OS values. Figure 9 depicts the significant regression and 95% CI for 11 patients (Patient 1038 is shown but not included in the calculation because measurements were only taken after Cycle 1 therapy; R2 = 0.58, F1,9 = 12.32, P = 0.0068), whereby the increasing difference of IL-8 following Day 2 treatment versus Day 5 treatment was positively correlated with OS.
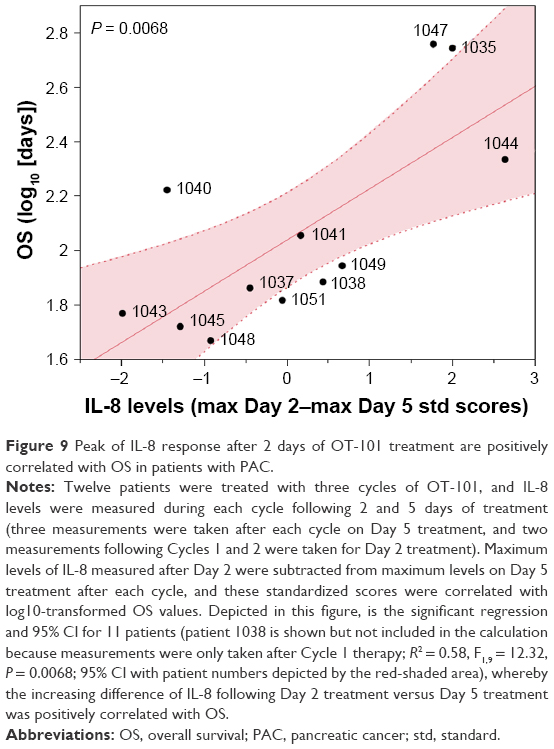 |
Figure 9 Peak of IL-8 response after 2 days of OT-101 treatment are positively correlated with OS in patients with PAC. |
Given the improved OS of patients receiving chemotherapeutic treatment following OT-101 as compared to those who did not, the correlational analysis of cyto-/chemokine levels with OS was further delineated in the subset of 12 patients with PAC. The results showed positive correlations between OS and levels of IFN-α, IL-6, IL-8, IL-12, IL-15, and IP-10 with and without subsequent chemotherapy. Predictive biomarkers should, in principle, determine the potential survival response beginning at an OS of 0 months. IL-8 and IL-15 were the only cytokines that intercepted at the zero axis with and without subsequent chemotherapy, suggesting that the plasma levels of these two cytokines can predict 0% survival at the lower limit, regardless of whether they received subsequent chemotherapy (Figure 10). This indicated the potential to predict efficacy based on the maximum difference between Day 2 and Day 5 levels of these two cytokines and OS during OT-101 treatment and subsequent chemotherapy. With the subsequent chemotherapy as the covariate in the ANCOVA model, a significant positive correlation was observed between the difference in IL-8 levels and OS (P = 0.002), as well as a strong positive trend in OS for three patients (5.5, 18.2, and 18.9 months) with subsequent single- or multi-agent chemotherapy (P < 0.07) administered within 2 weeks of OT-101 treatment (Figure 10A). Similarly, levels of IL-15 exhibited a significant positive correlation with OS following OT-101 treatment (R2 = 0.50, P = 0.032). However, due to low patient numbers, this positive trend with subsequent chemotherapy did not achieve statistical significance (R2 = 0.93, P = 0.172; Figure 10B).
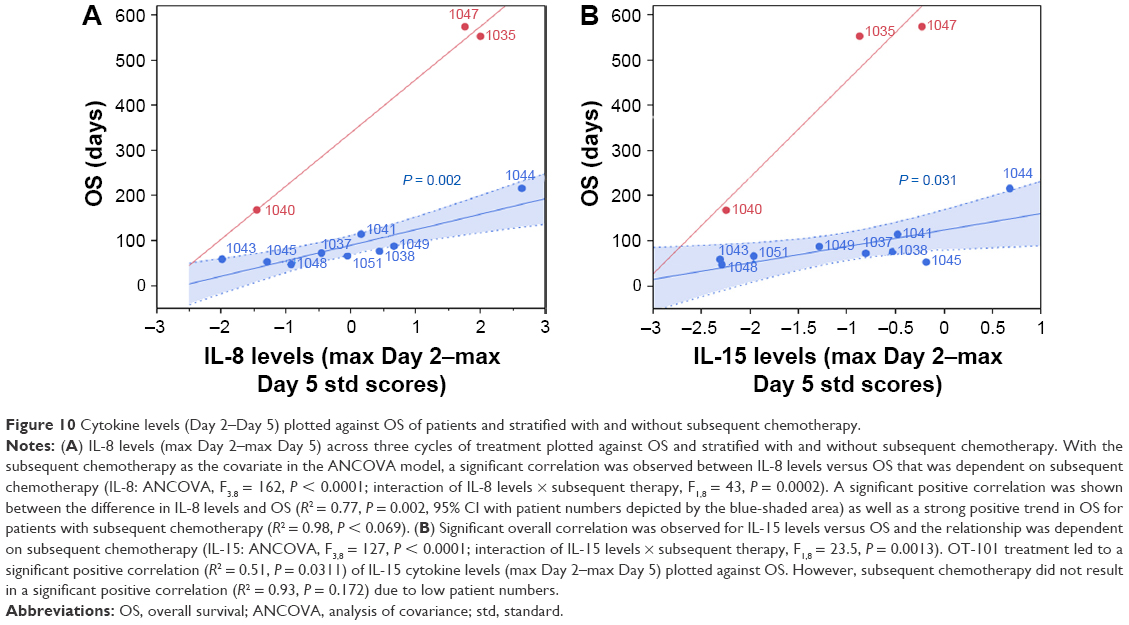 |
Figure 10 Cytokine levels (Day 2–Day 5) plotted against OS of patients and stratified with and without subsequent chemotherapy. |
Effect of OT-101 in the whole-blood cultures of healthy volunteers
OT-101 elicited proinflammatory cytokine and chemokine responses in ex vivo studies with human peripheral blood mononuclear cells that do not express TGF-β2. Among the 34 cyto-/chemokines analyzed in whole-blood cultures of healthy volunteers, mediators with the most pronounced increase after OT-101 treatment were IL-1β, IL-1RA, IL-6, IL-8, MCP-1, and MIP-1β as well as IL-10. Only three of these were found to be increased by OT-101 in experimentally stimulated cultures (IL-1β, IL-8, and MCP-1; Figure 11A), whereas IL-10 was found to be inhibited. Levels of IL-6 and MIP-1β were not influenced by OT-101 in activated immune cells. OT-101–mediated release of IL-1β, IL-8, and MCP-1 was markedly increased when blood cultures were co-stimulated with LPS/S-EB, mimicking a preinflammed state (Figure 11B). In unstimulated cultures, the increase in cyto-/chemokines levels occurred only at the highest concentration of OT-101 tested (48 μg/mL) and never reached >10% of the amount released by the cells stimulated by either LPS or S-EB, except in the case of MCP-1. The release of this chemokine was found to be increased by OT-101 up to 20%. IFN-α was measured by single ELISA and also exhibited a moderate costimulating effect of OT-101 on the LPS/S-EB-activated cultures of two of the three donors. These findings suggest the lack of a clear indication of a cytokine storm-like phenomenon of OT-101, although the drug is not without stimulating potential on the cells of the human immune system under physiological conditions.
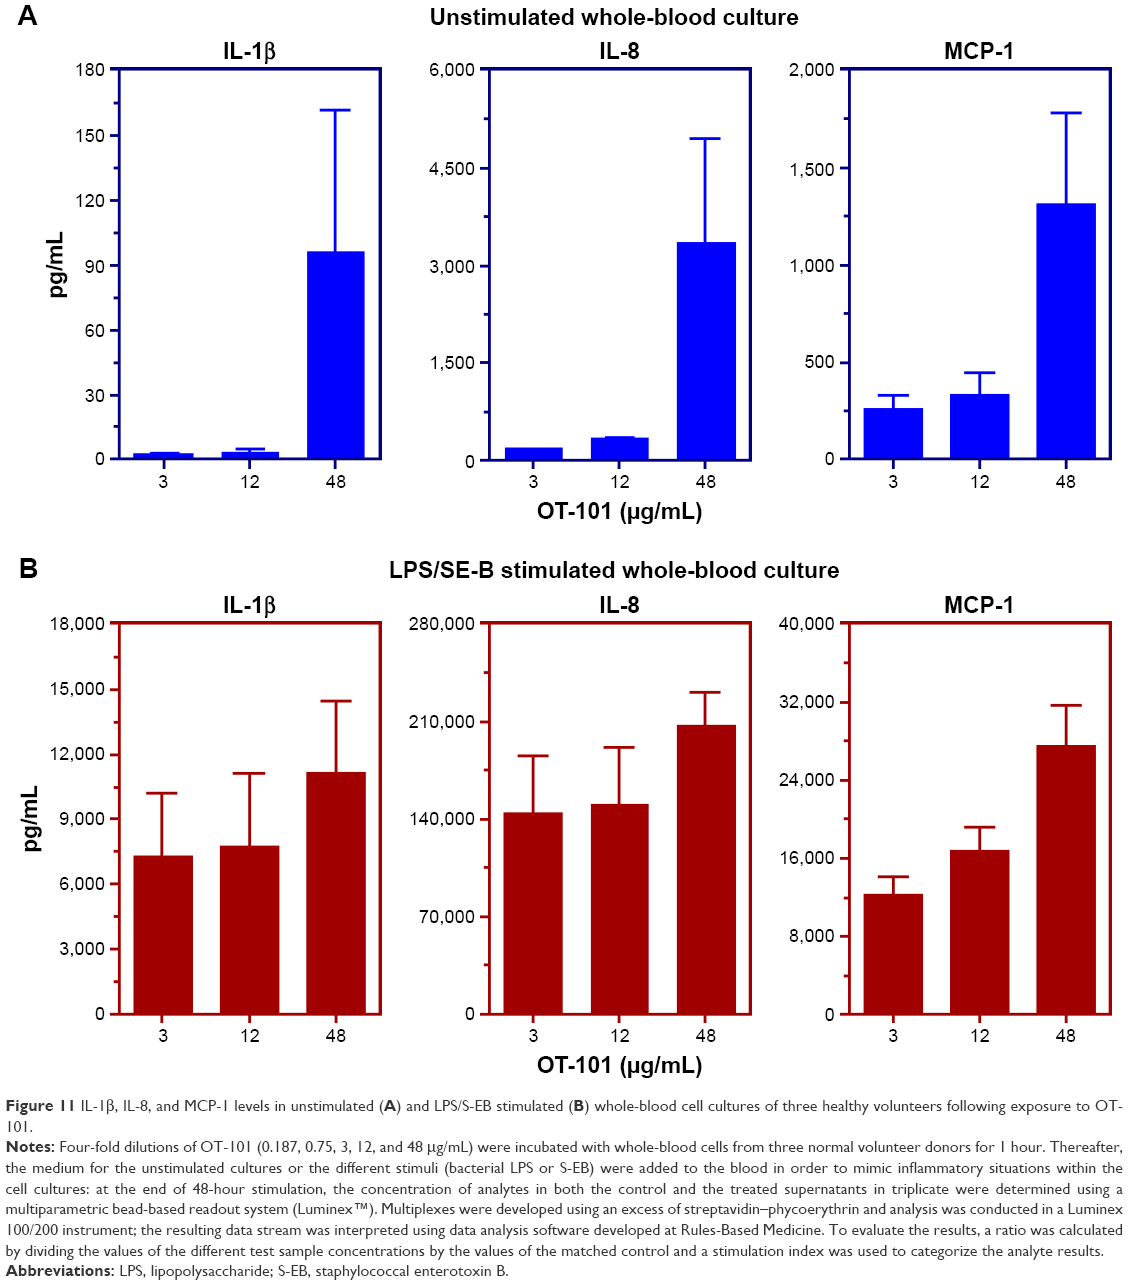 | Figure 11 IL-1β, IL-8, and MCP-1 levels in unstimulated (A) and LPS/S-EB stimulated (B) whole-blood cell cultures of three healthy volunteers following exposure to OT-101. |
Discussion
An appropriate balance of the T-helper type 1 and T-helper type 2 (Th1/Th2-type) cytokine profile is considered important for an effective antitumor response. Patients with advanced-stage tumor appear to experience simultaneous immunostimulation and immunosuppression with increased concentrations of cytokines, including IL-6, IL-8, IL-10, IL-18, TGF-β, MIF, and TNF-α.23 The result is a local inflammatory environment that appears to be a consistent component of malignant tumors.23–25 TGF-β2 production in tumors shifts the cytokine balance toward immunosuppression by suppressing the secretion and activity of Th1 inflammatory cytokines, decreasing the expression levels of cytokine receptors, and stimulating immunsuppressive factors such as IL-10 and prostaglandin E2.32–34 A shift from a Th2 to Th1 cytokine is important for mounting an effective antitumor immune response.35,36 This study assessed the putative impact of infusion therapy of antisense oligonucleotide OT-101 in a subset of patients with advanced PAC on the plasma levels of 31 cyto-/chemokines. In addition, both stimulated and unstimulated whole-blood cultures of healthy volunteers were tested ex vivo for either induction or repression of 34 cyto-/chemokines by OT-101.
OT-101 specifically binds to human TGF-β2 mRNA and downregulates its protein expression in tumor cells.5,8,37 Inhibition of TGF-β2 is, therefore, assumed to increase the release of inflammatory cytokines and is part of the intended antitumor response.33 Indeed, changes in cyto-/chemokine levels were identified in some patients during the course of the Phase I/II clinical study with three cycles of OT-101 infusion. Plasma levels of quantifiable cyto-/chemokines were log10-transformed and the expression of each cyto-/chemokine was standardized in each PAC patient across the selected TPs 1, 2, 3, 6, 7, 8, 9, and 11 post treatment. However, no consistent responses in cyto-/chemokine levels were observed during three cycles of OT-101 treatment using the mixed-model ANCOVA. Each patient exhibited a high level of variation in time profiles for the 19 quantifiable cyto-/chemokines, and the expression values ranged from −2.4 to +2.5 SD units, suggesting that these changes were not in the order of magnitude that is typically observed with immune modulators such as therapeutic antibodies.5,9,38–40
A two-way clustering analysis was utilized to organize the expression of cytokines across rows and the patient at each TP to visualize high levels of expression that were consistent across patients and TPs. A high expression cluster was identified, but a closer examination of this cluster did not reveal components of the cytokine storm across multiple patients at multiple TPs. A correlation cluster analysis revealed three clusters of co-regulated expression and a supervised protein–protein network depiction of potential connection hubs between TGFBR2 and the cytokine pathways, and also identified UBC, STAT1, STAT3, and NFKB interactions as potential mechanisms for increases in cytokine levels via TGFBR2 inhibition. Controlling for patient-to-patient variability, only EGF showed a significant increase in levels across TPs. A statistically significant upregulation of cyto-/chemokine levels was found for the factors HGF, IFN-α, and IL-15 in Cluster 1. The eotaxin level was significantly downregulated in Cluster 2. The high level of patient-to-patient variability in the time profiles of cytokine expression levels suggests that the changes in these expression levels were highly context-specific, requiring a much larger sample of patients to identify consistent trends.
A literature review was conducted to compile the various mechanisms of cytokine storms induced by viruses, monoclonal antibodies, and other cyto-/chemokines. The constituents of a cytokine storm were highly dependent on the induction mechanism and model system used.41–43 Common mediators of cytokine storms included IL-1β, IL-2, IL-6, IL-8, IL-10, IL-12, IL-17, IFNγ, MIP-1α, and TNF-α. Peak levels of IFN-γ, IL-6, sgp130, and sIL-6R are highly associated with severe cytokine-release syndrome.43 In the present study, protein–protein interaction networks that connected the TGFBR2 pathway to the cytokine storm identified common hub proteins, such as UBC, TRAF6, MYD88, and STAT3, as the ones identified from the correlation cluster analysis. This prompted an examination for the signature of the mediators of cytokine storms from the OT-101–treated patients. An examination of co-regulated sets of cytokines and chemokines did not reveal a cluster of common cytokine storm mediators. Although potential mechanisms that link TGFBR2 receptor inhibition to the induction of a cytokine storm were identified in a literature review and analysis of protein–protein network, the cluster analysis of standardized expression levels stratified across patients and cyto-/chemokines did not reveal an elevated signature for the emergence of a cytokine storm following repeated intravenous OT-101 treatment.
Further confirmatory studies were conducted with whole-blood cultures of healthy volunteers for evaluating the potential for cytokine storm induction by OT-101. Whole-blood cultures provide a complete spectrum of cells of the immune system found in the peripheral blood, thereby ensuring a maximum cell-to-cell cooperation for characterizing the activity profile of immune modulators.44–47 Using the whole-blood culture model derived from three normal healthy volunteers, biologically relevant effects of OT-101 were found. The mediators with the most pronounced increase after OT-101 treatment were IL-1β, IL-1RA, IL-6, IL-8, MCP-1, and MIP-1β as well as IL-10. OT-101–mediated release of IL-1β, IL-8, and MCP-1 was further increased when blood cultures were co-stimulated with LPS/S-EB, mimicking a pre-inflammed state, whereas IL-10 was inhibited. Thus, OT-101 triggered a background activity in unstimulated whole-blood cultures, which was a minor fraction of the experimentally stimulated cultures. When added to cultures stimulated with LPS/S-EB (mimicking a preinflamed immune system in vivo), OT-101 revealed a more differential stimulatory type of response. Taken together, there was no clear indication of a cytokine storm-like phenomenon with OT-101 during a Phase I/II clinical study in PAC patients as well as in whole-blood cultures of healthy volunteers, although OT-101 is not without stimulating potential on the cells of the human immune system under physiological conditions.
Given the improved OS of patients receiving chemotherapy following OT-101 as compared to those who did not, the correlation analysis of cyto-/chemokine levels with OS was delineated in the subset of 12 patients with PAC. For a more practical application of the predictive biomarkers, the correlation between fluctuations in cyto-/chemokine levels from OT-101 treatment – represented by the maximum difference between Cycle 1 Day 2 values and Day 5 values – and OS was further investigated. The maximum levels of cyto-/chemokine levels on Day 5 were subtracted from levels on the Day 2, and these standardized scores were correlated with OS values. Results showed positive correlations between OS and levels of IFN-α, IL-6, IL-8, IL-12, IL-15, and IP-10. Only regression lines of IL-8 and IL-15 levels for patients with and without subsequent chemotherapy intersected at an OS of 0 months. With the subsequent chemotherapy as the covariate in the ANCOVA model, significant positive correlation was shown between the difference in IL-8 and IL-15 levels and OS, as well as a significant increase in OS for three patients (5.5, 18.2, and 18.9 months) with subsequent single- or multi-agent chemotherapy administered within 2 weeks of OT-101 treatment.
Both IL-8 and IL-15 play important roles in immune-mediated antitumor response and chemotherapy.48 IL-8 produced by tumor cells exerts various functions in shaping protumoral vascularization and inflammation/immunity.49–51 IL-8 expression is primarily regulated by activator protein 1 and NF-κB transcription factors. Because of its potent proinflammatory properties, IL-8 is tightly regulated, and its expression is low or undetectable in normal tissue. Different stimuli have been shown to upregulate IL-8 expression, and high IL-8 levels have been reported in serum or tissue specimens from patients with tumor and they correlated with tumor size, depth of infiltration, stage, and prognosis;52–54 however, its value as a tumor biomarker to predict changes in tumor burden and to monitor response to therapy has been poorly explored.19,55,56 In contrast, IL-15 has already been proven to have a beneficial effect in patients with PAC because IL-15–producing PAC cells induce a tumor-reducing effect via NK cells,57,58 and that human umbilical cord blood-derived mesenchymal stem cells producing IL-15 eradicate pancreatic tumors in mice.59 In PAC specifically, it has been shown that higher absolute levels of NK cells in circulation are associated with better survival.60 Consequently, IL-15 has the potential to play an important role in the treatment of PAC by stimulating NK cells to target both tumor cells and the surrounding desmoplastic barrier.
In addition to these clinical findings, our earlier preclinical studies demonstrated that OT-101 synergizes with paclitaxel (PTX) and dacarbazine (DTIC) when tested in three xenograft tumor models (glioblastoma, ovarian cancer, and melanoma), with enhanced antitumor activity and prolonged survival.21,61 Both PTX and DTIC have been shown to exhibit drug-IL-8 upregulation (16 and four associations with PTX and DTIC, respectively), identified using text mining in the CTDbase (http://ctdbase.org/). Of the 718 genes affected by PTX and the 25 genes affected by DTIC, 17 were affected by IL-8. Of the 222 genes affected by temozolomide (TZM), 52 were affected by both TZM and PTX. PTX induces reactive oxygen species-dependent expression of hypoxia-inducible factor-1 α (HIF-1α) and HIF-2α, leading to HIF-mediated expression of IL-6, IL-8, and MDR1, which promote the survival of cancer cells – a response that is a critical determinant of treatment failure and patient mortality.62,63 DTIC induces IL-8 protein overexpression and secretion via transcriptional upregulation in melanoma cell lines.64 Future clinical trials are planned to further explore the relationship between IL-8 and IL-15 and sequential OT-101 and chemotherapy strategies, as Th1 cytokines should increase with elimination of immunosuppression activity of TGF-β2 via OT-101 treatment. Currently, the gemcitabine plus nab-paclitaxel combination and the FOLFIRINOX regimen are the first-line therapies for patients with advanced PAC.65,66 Whereas improvements to patient survival have been made in such advances, the majority of patients will progress after 6 months of treatment. New therapies with greater efficacy are urgently needed for this disease. To this end, targeting tumor desmoplasia with OT-101 to improve drug delivery and overcome chemoresistance is being investigated as a new therapeutic approach.
Conclusion
The cluster analysis of standardized expression levels of plasma cyto-/chemokines did not reveal an elevated signature for the emergence of a cytokine storm following OT-101 treatment, although the drug is not without stimulating potential on cells of the human immune system. Using the mixed ANOVA model, a spike in levels of IL-8 and IL-15 during Cycle 1 were positively associated with OS across 12 patients with PAC and served as potential predictive biomarkers for treatment outcome following OT-101 therapy. Future clinical trials should further explore the relationship between IL-8, IL-15, and sequential OT-101 and chemotherapeutic strategies as Th1 cytokines should increase with the elimination of the immunosuppressive activity of TGF-β2 via OT-101 treatment.
Disclosure
The authors report no conflicts of interest in this work.
References
Massagué J. TGFbeta in cancer. Cell. 2008;134(2):215–230. | ||
Bierie B, Moses HL. Tumor microenvironment: TGFbeta: the molecular Jekyll and Hyde of cancer. Nat Rev Cancer. 2006;6(7):506–520. | ||
Jakowlew SB. Transforming growth factor-beta in cancer and metastasis. Cancer Metastasis Rev. 2006;25(3):435–457. | ||
Achyut BR, Yang L. Transforming growth factor-β in the gastrointestinal and hepatic tumor microenvironment. Gastroenterology. 2011;141(4):1167–1178. | ||
Jaschinski F, Rothhammer T, Jachimczak P, Seitz C, Schneider A, Schlingensiepen KH. The antisense oligonucleotide trabedersen (AP 12009) for the targeted inhibition of TGF-β2. Curr Pharm Biotechnol. 2011;12(12):2203–2213. | ||
Jaschinski F, Korhonen H, Janicot M. Design and selection of antisense oligonucleotides targeting transforming growth factor beta (TGF-β) isoform mRNAs for the treatment of solid tumors. In: Walther W, Stein U, editors. Gene Therapy of Solid Cancers: Methods and Protocols, Methods in Molecular Biology. Chapter 9. New York: Springer Science+Business Media; 2015:137–151. | ||
Fang H, DeClerck YA. Targeting the tumor microenvironment: from understanding pathways to effective clinical trials. Cancer Res. 2013;73(16):4965–4977. | ||
Neuzillet C, Tijeras-Raballand A, Cohen R, et al. Targeting the TGFβ pathway for cancer therapy. Pharmacol Ther. 2015;147:22–31. | ||
Schlingensiepen KH, Schlingensiepen R, Steinbrecher A, et al. Targeted tumor therapy with the TGF-beta 2 antisense compound AP 12009. Cytokine Growth Factor Rev. 2006;17(1–2):129–139. | ||
Schlingensiepen KH, Jaschinski F, Lang SA, et al. Transforming growth factor-beta 2 gene silencing with trabedersen (AP 12009) in pancreatic cancer. Cancer Sci. 2011;102(6):1193–1200. | ||
Kjellman C, Olofsson SP, Hansson O, et al. Expression of TGF-beta isoforms, TGF-beta receptors, and SMAD molecules at different stages of human glioma. Int J Cancer. 2000;89(3):251–258. | ||
Kaminska B, Kocyk M, Kijewska M. TGF beta signaling and its role in glioma pathogenesis. Adv Exp Med Biol. 2013;986:171–187. | ||
Bogdahn U, Hau P, Stockhammer G, et al; Trabedersen Glioma Study Group. Targeted therapy for high-grade glioma with the TGF-β2 inhibitor trabedersen: results of a randomized and controlled phase IIb study. Neuro Oncol. 2011;13(1):132–142. | ||
Hau P, Jachimczak P, Schlingensiepen R, et al. Inhibition of TGF-beta2 with AP 12009 in recurrent malignant gliomas: from preclinical to phase I/II studies. Oligonucleotides. 2007;17(2):201–212. | ||
Oettle H, Seufferlein T, Luger T, et al. Final results of a phase I/II study in patients with pancreatic cancer, malignant melanoma, and colorectal carcinoma with trabedersen. J Clin Oncol. 2012;30:abstract 4034. | ||
Friess H, YamanakaY, Büchler M, et al. Enhanced expression of transforming growth factor beta isoforms in pancreatic cancer correlates with decreased survival. Gastroenterology. 1993;105(6):1846–1856. | ||
von Bernstorff W, Voss M, Freichel S, et al. Systemic and local immunosuppression in pancreatic cancer patients. Clin Cancer Res. 2001;7(3 Suppl):925s–932s. | ||
Choudhury A, Moniaux N, Ulrich AB, et al. MUC4 mucin expression in human pancreatic tumours is affected by organ environment: the possible role of TGFbeta2. Br J Cancer. 2004;90(3):657–664. | ||
Bellone G, Smirne C, Mauri FA, et al. Cytokine expression profile in human pancreatic carcinoma cells and in surgical specimens: implications for survival. Cancer Immunol Immunother. 2006;55(6):684–698. | ||
Trieu V, D’Cruz O, Qazi S, Ng K, Hwang L. Correlation of circulating IL-8 levels with improved overall survival in advanced pancreatic cancer patients in response to antisense OT-101 (Trabedersen) therapy. Presented at: the 2017 Gastrointestinal Cancers Symposium; January 19–21; 2017; San Francisco, CA. | ||
D’Cruz O, Lee C, Trieu V, Hwang L. Transforming growth factor-beta 2 (TGF-β2) antisense oligonucleotide (ASO) OT-101 synergizes with chemotherapy in preclinical tumor models. Poster presented at: AACR Annual Meeting 2017; April 1–5; 2017; Washington, DC, Abstract No 2800, Cancer Res. 2017;77(13 Suppl):2800. | ||
Hanahan D, Coussens LM. Accessories to the crime: functions of cells recruited to the tumor microenvironment. Cancer Cell. 2012;21(3):309–322. | ||
Lippitz BE. Cytokine patterns in patients with cancer: a systematic review. Lancet Oncol. 2013;14(6):e218–e228. | ||
Mantovani A, Allavena P, Sica A, Balkwill F. Cancer-related inflammation. Nature. 2008;454(7203):436–444. | ||
Grivennikov SI, Greten FR, Karin M. Immunity, inflammation, and cancer. Cell. 2010;140(6):883–899. | ||
Wakefield LM, Sporn MB. Suppression of carcinogenesis: a role for TGF-beta and related molecules in prevention of cancer. Immunol Ser. 1990;51:217–243. | ||
Mueller SC, März R, Schmolz M, Drewelow B. Intraindividual long term stability and response corridors of cytokines in healthy volunteers detected by a standardized whole-blood culture system for bed-side application. BMC Med Res Methodol. 2012;12:112. | ||
Reardon C, McKay DM. TGF-beta suppresses IFN-gamma-STAT1-dependent gene transcription by enhancing STAT1-PIAS1 interactions in epithelia but not monocytes/macrophages. J Immunol. 2007;178(7):4284–4295. | ||
Park IK, Letterio JJ, Gorham JD. TGF-beta 1 inhibition of IFN-gamma-induced signaling and Th1 gene expression in CD4+ T cells is Smad3 independent but MAP kinase dependent. Mol Immunol. 2007;44(13):3283–3290. | ||
Tomida M, Saito T. The human hepatocyte growth factor (HGF) gene is transcriptionally activated by leukemia inhibitory factor through the Stat binding element. Oncogene. 2004;23(3):679–686. | ||
Strippoli R, Benedicto I, Foronda M, et al. p38 maintains E-cadherin expression by modulating TAK1-NF-kappa B during epithelial-to-mesenchymal transition. J Cell Sci. 2010;123(Pt 24):4321–4331. | ||
Letterio JJ, Roberts AB. Regulation of immune responses by TGF-beta. Annu Rev Immunol. 1998;16:137–161. | ||
Wojtowicz-Praga S. Reversal of tumor-induced immunosuppression: a new approach to cancer therapy. J Immunother. 1997;20(3):165–177. | ||
Wojtowicz-Praga S. Reversal of tumor-induced immunosuppression by TGF-beta inhibitors. Invest New Drugs. 2003;21(1):21–32. | ||
DeNardo DG, Coussens LM. Inflammation and breast cancer. Balancing immune response: crosstalk between adaptive and innate immune cells during breast cancer progression. Breast Cancer Res. 2007;9(4):212. | ||
Bindea G, Mlecnik B, Fridman WH, Pagès F, Galon J. Natural immunity to cancer in humans. Curr Opin Immunol. 2010;22(2):215–222. | ||
Hau P, Jachimczak P, Schlaier J, Bogdahn U. TGF-β2 signaling in high-grade gliomas. Curr Pharm Biotechnol. 2011;12:2150–2157. | ||
D’Elia RV, Harrison K, Oyston PC, Lukaszewski RA, Clark GC. Targeting the “cytokine storm” for therapeutic benefit. Clin Vaccine Immunol. 2013;20(3):319–327. | ||
Suntharalingam G, Perry MR, Ward S, et al. Cytokine storm in a phase 1 trial of the anti-CD28 monoclonal antibody TGN1412. New Engl J Med. 2006;355(10):1018–1028. | ||
Rouce RH, Heslop HE. Forecasting cytokine storms with new predictive biomarkers. Cancer Discov. 2016;6(6):579–580. | ||
Chen Y, Liu D. Chimeric antigen receptor (CAR)-directed adoptive immunotherapy: a new era in targeted cancer therapy. Stem Cell Investig. 2014;1:2. | ||
DeFrancesco L. CAR-T cell therapy seeks strategies to harness cytokine storm. Nat Biotechnol. 2014;32(7):604. | ||
Liu Q, Zhou YH, Yang ZQ. The cytokine storm of severe influenza and development of immunomodulatory therapy. Cell Mol Immunol. 2016;13(1):3–10. | ||
Kenter MJ, Cohen AF. Establishing risk of human experimentation with drugs: lessons from TGN1412. Lancet. 2006;368(9544):1387–1391. | ||
Stebbings R, Findlay L, Edwards C, et al. “Cytokine storm” in the phase I trial of monoclonal antibody TGN1412: better understanding the causes to improve preclinical testing of immunotherapeutics. J Immunol. 2007;179(5):3325–3331. | ||
Stebbings R, Eastwood F, Poole S, Thorpe R. After TGN1412: recent developments in cytokine release assays. J Immunotoxicol. 2013;10(1):75–82. | ||
Finco D, Grimaldi C, Fort M, et al. Cytokine release assays: current practices and future directions. Cytokine. 2014;66(2):143–155. | ||
Germano G, Allavena P, Mantovani A. Cytokines as a key component of cancer-related inflammation. Cytokine. 2008;43(3):374–379. | ||
Xie K. Interleukin-8 and human cancer biology. Cytokine Growth Factor Rev. 2001;12(4):375–391. | ||
Yuan A, Chen JJ, Yao PL, Yang PC. The role of interleukin-8 in cancer cells and microenvironment interaction. Front Biosci. 2005;10:853–865. | ||
Waugh DJ, Wilson C. The interleukin-8 pathway in cancer. Clin Cancer Res. 2008;14(21):6735–6741. | ||
Baggiolini M, Walz A, Kunkel SL. Neutrophil-activating peptide-1/interleukin 8, a novel cytokine that activates neutrophils. J Clin Invest. 1989;84(4):1045–1049. | ||
Araki S, Omori Y, Lyn D, et al. Interleukin-8 is a molecular determinant of androgen independence and progression in prostate cancer. Cancer Res. 2007;67(14):6854–6862. | ||
Gabellini C, Trisciuoglio D, Desideri M, et al. Functional activity of CXCL8 receptors, CXCR1 and CXCR2, on human malignant melanoma progression. Eur J Cancer. 2009;45(14):2618–2627. | ||
Chen Y, Shi M, Yu GZ, et al. Interleukin-8, a promising predictor for prognosis of pancreatic cancer. World J Gastroenterol. 2012;18(10):1123–1129. | ||
Kotyza J. Interleukin-8 (CXCL8) in tumor associated non-vascular extracellular fluids: its diagnostic and prognostic values. A review. Int J Biol Markers. 2012;27(3):169–178. | ||
Yoshida Y, Tasaki K, Miyauchi M, et al. Impaired tumorigenicity of human pancreatic cancer cells retrovirally transduced with interleukin-12 or interleukin-15 gene. Cancer Gene Ther. 2000;7(2):324–331. | ||
Van Audenaerde JRM, De Waele J, Marcq E, et al. Interleukin-15 stimulates natural killer cell-mediated killing of both human pancreatic cancer and stellate cells. Oncotarget. 2017;8(34):56968–56979. | ||
Jing W, Chen Y, Lu L, et al. Human umbilical cord blood-derived mesenchymal stem cells producing IL-15 eradicate established pancreatic tumor in syngeneic mice. Mol Cancer Ther. 2014;13(8):2127–2137. | ||
Davis M, Conlon K, Bohac GC, et al. Effect of pemetrexed on innate immune killer cells and adaptive immune T cells in subjects with adenocarcinoma of the pancreas. J Immunother. 2012;35(8):629–640. | ||
Trieu V, Huang L, D’Cruz O, Hwang L. Synergistic anti-tumor activity of OT-101, a TGF-β2 inhibitor, and dacarbazine against C8161 human melanoma xenograft in athymic nude mice. Poster presented at: The 10th Canadian Melanoma Conference; February 19–20; 2016; Whistler, BC. | ||
Furukawa S, Soeda S, Kiko Y, et al. MCP-1 promotes invasion and adhesion of human ovarian cancer cells. Anticancer Res. 2013;33(11):4785–4790. | ||
Samanta D, Gilkes DM, Chaturvedi P, Xiang L, Semenza GL. Hypoxia-inducible factors are required for chemotherapy resistance of breast cancer stem cells. Proc Natl Acad Sci U S A. 2014;111(50):E5429–E5438. | ||
Lev DC, Ruiz M, Mills L, McGary EC, Price JE, Bar-Eli M. Dacarbazine causes transcriptional up-regulation of interleukin 8 and vascular endothelial growth factor in melanoma cells: a possible escape mechanism from chemotherapy. Mol Cancer Ther. 2003;2(8):753–763. | ||
Conroy T, Desseigne F, Ychou M, et al. FOLFIRINOX versus gemcitabine for metastatic pancreatic cancer. N Engl J Med. 2011;364(19):1817–1825. | ||
Von Hoff DD, Ervin T, Arena FP, et al. Increased survival in pancreatic cancer with nab-paclitaxel plus gemcitabine. N Engl J Med. 2013;369(18):1691–1703. |
 © 2018 The Author(s). This work is published and licensed by Dove Medical Press Limited. The
full terms of this license are available at https://www.dovepress.com/terms
and incorporate the Creative Commons Attribution
- Non Commercial (unported, 3.0) License.
By accessing the work you hereby accept the Terms. Non-commercial uses of the work are permitted
without any further permission from Dove Medical Press Limited, provided the work is properly
attributed. For permission for commercial use of this work, please see paragraphs 4.2 and 5 of our Terms.
© 2018 The Author(s). This work is published and licensed by Dove Medical Press Limited. The
full terms of this license are available at https://www.dovepress.com/terms
and incorporate the Creative Commons Attribution
- Non Commercial (unported, 3.0) License.
By accessing the work you hereby accept the Terms. Non-commercial uses of the work are permitted
without any further permission from Dove Medical Press Limited, provided the work is properly
attributed. For permission for commercial use of this work, please see paragraphs 4.2 and 5 of our Terms.