")
Back to Journals » Clinical Epidemiology » Volume 7
Impact of missing data mechanism on the estimate of change: a case study on cognitive function and polypharmacy among older persons
Authors Lavikainen P, Leskinen E, Hartikainen S, Möttönen J, Sulkava R, Korhonen MJ
Received 19 August 2014
Accepted for publication 24 October 2014
Published 4 February 2015 Volume 2015:7 Pages 169—180
DOI https://doi.org/10.2147/CLEP.S72918
Checked for plagiarism Yes
Review by Single anonymous peer review
Peer reviewer comments 5
Editor who approved publication: Professor Henrik Sørensen
Piia Lavikainen,1,2 Esko Leskinen,3 Sirpa Hartikainen,1,2 Jyrki Möttönen,4 Raimo Sulkava,5 Maarit J Korhonen6
1Kuopio Research Centre of Geriatric Care, University of Eastern Finland, Kuopio, Finland; 2School of Pharmacy, Faculty of Health Sciences, University of Eastern Finland, Kuopio, Finland; 3Department of Mathematics and Statistics, University of Jyväskylä, Jyväskylä, Finland; 4Department of Social Research, University of Helsinki, Helsinki, Finland; 5Department of Geriatrics, Institute of Public Health and Clinical Nutrition, Faculty of Health Sciences, University of Eastern Finland, Kuopio, Finland; 6Department of Pharmacology, Drug Development and Therapeutics, University of Turku, Turku, Finland
Abstract: Longitudinal studies typically suffer from incompleteness of data. Attrition is a major problem in studies of older persons since participants may die during the study or are too frail to participate in follow-up examinations. Attrition is typically related to an individual’s health; therefore, ignoring it may lead to too optimistic inferences, for example, about cognitive decline or changes in polypharmacy. The objective of this study is to compare the estimates of level and slope of change in 1) cognitive function and 2) number of drugs in use between the assumptions of ignorable and non-ignorable missingness. This study demonstrates the usefulness of latent variable modeling framework. The results suggest that when the missing data mechanism is not known, it is preferable to conduct analyses both under ignorable and non-ignorable missing data assumptions.
Keywords: attrition, latent variable modeling, longitudinal, Mini-Mental State Examination, number of drugs, older persons
Introduction
Cognitive decline and polypharmacy, defined as use of multiple drugs or more drugs than are medically necessary, are major and often interrelated health problems affecting the older population.1,2 There is a rich literature dealing with the potential determinants of cognitive decline and polypharmacy as well as interventions to reduce these phenomena.3–5 Longitudinal studies among the oldest old, however, typically suffer from incompleteness of data; attrition is a major challenge since these very elderly participants may die during the study or become too frail to participate in follow-up examinations. Attrition is typically related to the individual’s health, and the remaining participants may no longer be representative of the original study population.6 Accordingly, ignoring missing observations may lead to biased results and to overly optimistic inferences about cognitive decline or trends in polypharmacy.7
Very few of the previous studies investigating cognitive decline in older people, measured for example as a change in the Mini-Mental State Examination (MMSE) score, have considered how the missing data mechanism can affect the trend estimate.8 Different methods have been used in earlier studies eg, investigation of change scores that assume missing completely at random (MCAR) mechanism for dropouts. However, there are more sophisticated methods such as mixed models, latent growth models, and growth mixture models which allow for missing at random (MAR).9–11 The study of Muniz-Terrera et al demonstrated latent growth curve (LGC) analyses that allow for both random and non-random missingness but the results of the measurement models were reported only for the MAR mechanism.12 With respect to polypharmacy in older persons, developmental trends have been presented as a difference in the number of drugs in use between two time points assuming a linear trend.13–17
Data from the Geriatric Multidisciplinary Strategy for the Good Care of the Elderly (GeMS) study, a population-based 3 year follow-up study of a random sample of persons aged 75 and older in a Finnish city, provided us with an opportunity to examine the impact of missing data mechanism on the estimates of change in cognitive function and the number of drugs in use. These outcome variables were chosen because they display different features: the MMSE score declines with age and has missing values due to both unit and item non-response. The number of drugs in use at a given point in time typically increases with age and has missing values only because of unit non-response. More specifically, our objective was to compare the estimates of baseline level and the slope of change in cognitive function and number of drugs in use produced by traditional models with an assumption of ignorable missingness and Diggle-Kenward selection models that include explicit models for missing data mechanism and assume either ignorable or non-ignorable missingness.18–22 The aim of this study was to identify the best fitting model for both outcomes and to evaluate the significance of the differences among the estimation results. The secondary objective was to demonstrate the usefulness of a latent variable modeling framework. In this paper, LGC models, alone and combined with logistic regression models for the missing data mechanism, were fitted to the dataset in a structural equation modeling framework using Mplus software.23 LGC measurement models were preferred as these models employ a straightforward mathematical formulation and the estimation results do not require advanced mathematical expertise to interpret the outcome. An additional motivation for the study was that an example of estimating a selection model including the LGC model as a measurement model was recently described in the sixth version of the Mplus User’s Guide.24
Material and methods
Data came from the baseline examination of the GeMS study and its three follow-up examinations performed at 1 year intervals in 2004–2007. The original GeMS sample population (n=1,000) was selected randomly from persons born before 1 November 1928 and living in the city of Kuopio, Finland. The GeMS study has been described in greater detail elsewhere.25–27 Our study population included those 781 persons who participated in the baseline examination.
During the 3 year follow-up, 172 persons (22%) of the baseline population dropped out, primarily because of death (153 persons or 89% of dropouts) (Figure 1). This type of missingness can be called monotone missingness, attrition, or dropout because once a person left the study he or she could not return. Both unit and item non-response occurred in the GeMS study. The sample characteristics with sample sizes are shown in Table 1.
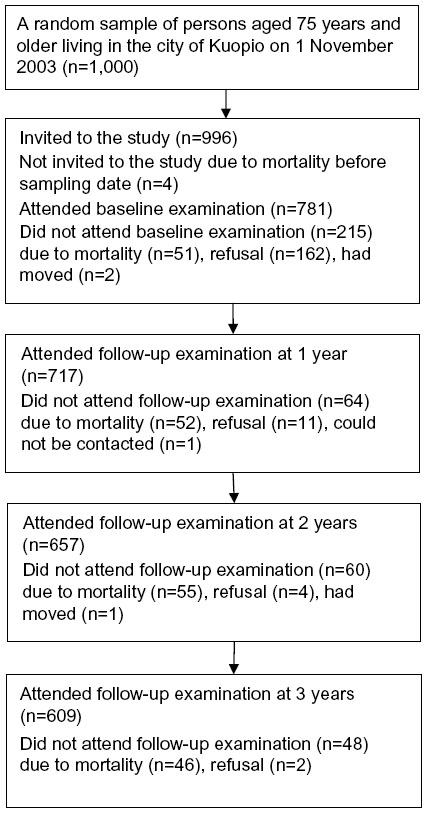 | Figure 1 Flow diagram of the participants. |
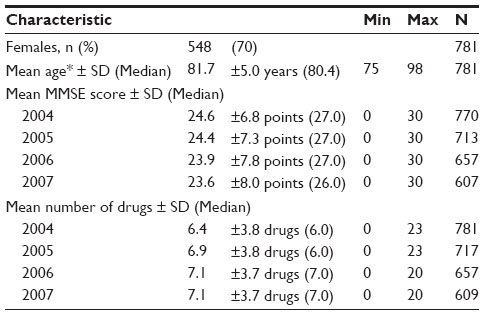 | Table 1 Sample characteristics |
Data on cognition and drug use were collected during the interviews conducted by three trained study nurses. Here, the MMSE test consisted of 30 items. Test results vary between 0 to 30 points with lower points indicating cognitive impairment. At the baseline examination, eleven participants had missing data. This was mainly because the participants were demented or experienced difficulties with communication (item non-response). Earlier studies have shown that a low MMSE score is predictive for the probability of dropping out of a study.9,12,28
During the interview, participants were asked to specify all the drugs (prescription and over the counter) they were currently taking in an open-ended question. In an attempt to reduce recall error, participants were requested to bring their drug containers and prescriptions with them to the interview. If the participant was unable to answer the questions, the required information was given by a close relative or caregiver. Therefore, the number of drugs being used by the participant could be measured for all participants at every examination. The number of drugs included all drugs ie, those being taken regularly and those taken as needed. Further, earlier studies have shown that the number of drugs in use is associated with mortality.29,30
In the baseline examination, information on participants’ background and health status was also recorded. In the present analyses, age and sex were used as external covariates to predict the probability of dropout.9,12
Statistical modeling
Missing data mechanisms
Missing data mechanisms were classified according to Rubin’s taxonomy.31 Dropout was considered as MCAR if the probability of dropping out did not depend on the observed or unobserved outcomes. If the dropout was MAR, the probability of dropping out may have depended on the observed outcomes, but it was conditionally independent of unobserved outcomes given the observed outcomes. However, if the dropout was not MCAR or MAR, it was missing not at random (MNAR). For example, in studies of older individuals, persons with rapidly declining cognition can be expected to leave the study either because they die or become too frail to participate. If the probability of the MMSE score missing at a particular examination was related to its value at previous examinations, but not upon current or future values, then the missing data were MAR but not MCAR. If observations were MNAR, then the probability of observing the MMSE at examination t was related to its potentially unobserved value at that same examination. In this longitudinal setting with monotone dropout, if data were MAR, the likelihood-based analysis that ignores the missing data mechanism produces valid inference; hence, MAR was termed as ignorable dropout whereas MNAR was termed as non-ignorable as the explicit model for missing data mechanism was needed.32
The effect of the missing data mechanism on the estimation was explored by comparing estimation results derived by traditional models with the ignorable missing data mechanism and the Diggle-Kenward selection models which included explicit models either for ignorable or non-ignorable missing data mechanism. In this study, indicator variables R of dropout, scored as binary discrete-time survival indicators, were defined to identify what is known and what is missing.
Measurement model
In our study, LGC models were used as a measurement model for full data to investigate the growth rates of the MMSE scores and the number of drugs in use and the association between the baseline level and the developmental trend across four examinations.33 The adopted LGC model can be presented as a piecewise linear trend model
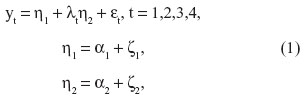
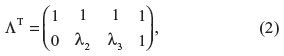
where yt is the observed outcome, η1 is a latent level component and η2 is the latent slope component.34–36 Similarly, parameters α1 and α2 are the means of the latent level and slope components. Variables εt are the measurement errors, and variables ζ1 and ζ2 consist of the variations of the latent level and slope components, respectively. The mean values of variables ε and ζ were zero and all covariances between them were assumed to be zero. Parameters λt are factor loadings at time t for the latent slope and, to obtain an identifiable model, restrictions λ1=0 and λ4=1 were applied. The covariance matrix of the latent variables is cov(η) = cov(ζ) = ψ and the covariance matrix of the observed responses is cov(y) = ΛψΛT + Θ, where
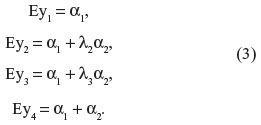
and Θ is the covariance matrix of the measurement errors. The mean values of the observed outcomes can be written as follows:
Dropout model
In the selection models, binary logistic regressions were fitted together with LGC models to take into account the relationships between the previous and/or current measured outcome variables and the dropout (Figure 2).21,32 The logistic regression model used as a model for dropout makes it possible for dropout to depend on both observed and missing outcomes and on covariates x; for example,

at time t. Dropout is ignorable when the regression coefficient ψ4=0 and non-ignorable otherwise.
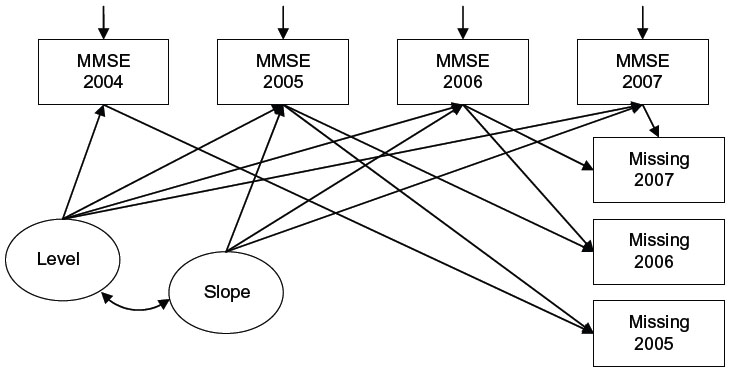 | Figure 2 Latent growth curve model for Mini-Mental State Examination (MMSE) score under non-ignorable missing data assumption (Model 3). |
Table 2 lists all the LGC models and selection models according to the outcome variable. By varying the composition of the explicit dropout models we wanted to discover how sensitive the estimates from the measurement models would be to different specifications for the dropout process.
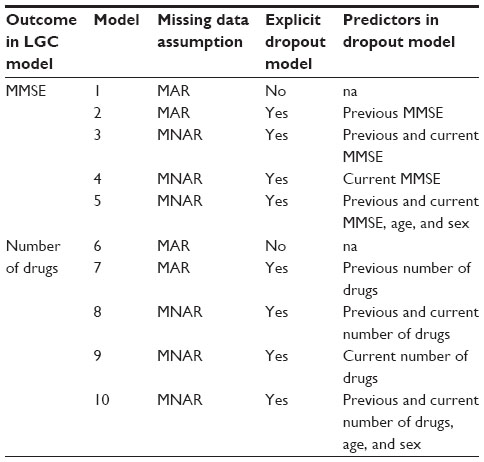 | Table 2 Fitted latent growth curve (LGC) models with or without explicit models for dropout under different missing data assumptions |
Goodness of fit of the LGC models was evaluated using five indicators: χ2 test, comparative fit index (CFI), Tucker-Lewis index (TLI), root mean square error of approximation (RMSEA), and standardized root mean residual (SRMR).37,38 A non-significant P-value (P≥0.05) related to the χ2 test indicates that the model provides a good fit for the data. The CFI evaluates the adequacy of the specified model in relation to the baseline model and it varies between 0 and 1 with values greater than 0.95 reflecting an excellent fit of the model to the data. The TLI is a normed-fit index that has a similar interpretation as the CFI. The RMSEA measures the approximation error in the model and values below 0.05 are suggestive of an excellent fit. Finally, the SRMR measures the average of the residual correlations and values less than 0.03 are indicative of an excellent fit of the model. The Satorra-Bentler chi-square difference test was used to test the fit between the nested models.39,40
All the statistical analyses were performed within a structural equation modeling framework using the Mplus statistical package Version 6.12 with the standard MAR missing data method where missing values are not imputed, but instead parameters and standard errors are estimated from all available data.23 Robust Maximum Likelihood estimation was used to derive non-normality robust standard errors, because the MMSE score and the number of drugs in use were not normally distributed.24 All P-values reported are two sided.
Results
Dropout model
It was not clear whether or not the missing data in our study sample were ignorable and no test was available to distinguish between ignorable and non-ignorable missingness. It was found that at every follow-up examination, MMSE scores before dropout were statistically significantly lower for dropouts than for those who remained in the study (unpaired Student’s t-tests, P<0.001). A similar phenomenon appeared with the number of drugs in use; those remaining in the study used a lower number of drugs than those dropping out at each particular examination except at the first follow-up examination (unpaired t-tests, P<0.001; except for the first follow-up, P=0.072). For those who refused to participate after the baseline examination or the first or second follow-up examinations, the missingness was assumed to be non-ignorable. However, when a participant died, he/she has left the universe of interest and literally speaking there is no missing data at all.41 In these situations, missing data may often be regarded as ignorable. However, according to Schafer and Graham, a steep decline in an unmeasured outcome may precede the death of a participant if examinations are spaced far apart in time, and this means that the missing data should be assessed as non-ignorable.41 In this study, sensitivity analyses of the missingness assumption in traditional models were performed by jointly modeling the measurement and dropout processes under the Diggle-Kenward selection modeling framework (Figure 2) with the assumptions of both ignorable and non-ignorable missingness.
Modeling results for the MMSE score
In an attempt to estimate the growth rates and the association between baseline level and growth rate, LGC models were fitted. First, traditional models under the assumption of ignorable missing data were fitted and the shape of the growth was investigated. Second, when the suitable shape had been identified, explicit models for missing data mechanism were added into the traditional model. In our dataset, nine missing data patterns emerged for the MMSE score.
Ignorable LGC models
In the context of the MMSE score, a model with latent intercept and slope components was estimated first. In this model, the slope was defined to measure the average rate of change between the baseline examination and the last follow-up examination. The fit of the final model was good: χ2 (3, N=777) =9.49, P=0.02, CFI =0.99, TLI =0.98, RMSEA =0.05 and SRMR =0.02. The estimation results of the model are shown in Table 3 (Model 1).
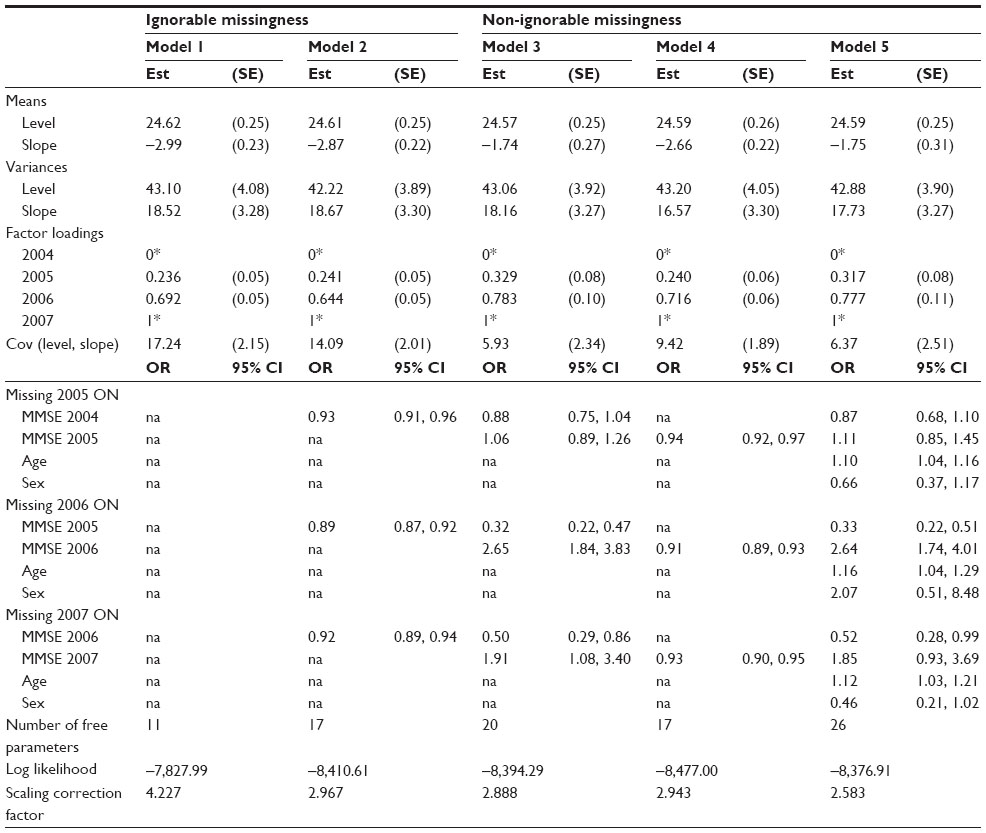 | Table 3 Estimation results from latent growth curve models for MMSE with and without logistic regression models for dropout, GeMS study, Kuopio, Finland, 2004–2007 |
The mean of the MMSE score at baseline was 24.6 points. The average rate of growth was negative and statistically significant (−2.99, P<0.001) meaning that during the 3 years, the average MMSE score declined by three points. The variance of the latent baseline level component (43.10, P<0.001) and the variance of the latent slope component (18.52, P<0.001) were both statistically significant indicating that there were significant inter-individual differences in these two factors. In addition, the covariance between latent baseline level and latent slope was positive and statistically significant (17.24, P<0.001) suggesting that the higher the baseline score, the slower the rate of decline from baseline to the end of the 3 year follow-up.
When logistic dropout models were jointly modeled with the measurement model (Diggle-Kenward model with ignorable missing data assumption), the growth estimate of the MMSE score and other parameters remained at the same level as in the previous model (Table 3, Model 2). The model revealed that the previous MMSE score was associated with the likelihood of dropping out of the study at the next follow-up examination. For example, an individual having one point higher MMSE score at the first follow-up examination in 2005 had 0.89 times lower odds of dropping out of the study before the follow-up examination in 2006 compared to those having a one point lower MMSE score at the first follow-up examination (95% confidence interval [CI]: 0.87, 0.92).
Non-ignorable LGC models
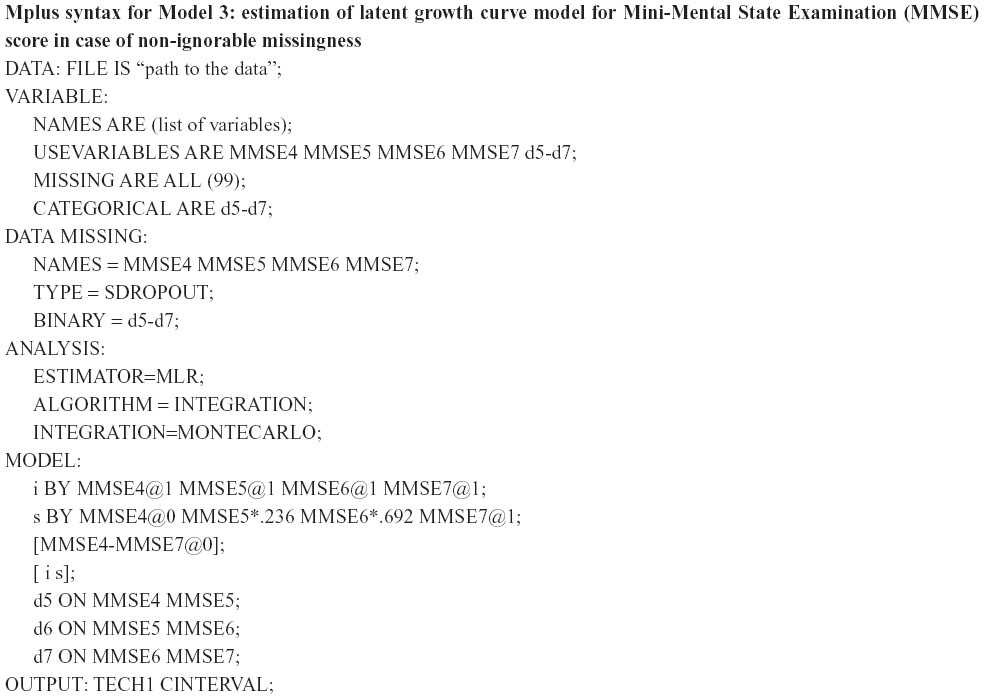
Next, the assumption of non-ignorable missing data mechanism was taken into account by adding the current MMSE scores as predictors for the dropout probabilities into Model 2 (Table 3, Model 3). The model is presented graphically in Figure 2. This means that for those who dropped out of the study, the current outcome was unobserved. Dropout models with time-variant effects of the previous and current MMSE scores on the probability of dropout were considered. The mean of slope estimate of the LGC model reduced to −1.74 (P<0.001) points per 3 years, which is considerably less than the estimates obtained with Models 1 and 2 (−2.99 and −2.87 points respectively) which applied the ignorable missing data assumption. Variances of the level and the slope remained unchanged in comparison to previous LGC models.
Odds ratios from the logistic dropout models were in the opposite direction for the previous and current MMSE scores: high previous score decreased the risk of dropout whereas high current, potentially unobserved score increased the risk (Table 3, Model 3). For example, rewriting the estimation results for the year 2006 as
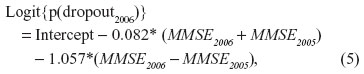
suggests that the probability of dropout increases when MMSE scores decrease. The average level of the MMSE score has only a minor influence on the probability of dropout. Since there were odds ratios with broad 95% CIs and highly correlated MMSE scores, we concluded that the coefficients and their standard errors were being affected by collinearity problems and therefore, the CIs were not interpreted. However, according to the Satorra-Bentler chi-square difference test (χ2=13.38, df =3, P=0.004) Model 3 still remained preferable to Model 2. (For the Mplus syntax used to produce Model 3, see Supplementary material.)
When a selection model under non-ignorable missingness with only the current measured MMSE scores as predictors for the dropout probabilities was evaluated, it was observed that odds ratios were in the same direction and of the same magnitude as in Model 2 for the previous measured MMSE scores (Table 3, Model 4). However, the odds ratios for the current MMSE scores were in the opposite direction to the corresponding odds ratios in Model 3. The estimate of the average growth rate was closer to the corresponding estimates from the models with ignorable missingness than found with Model 3 under non-ignorable missing data.
Finally, age and sex were added to Model 3 as external covariates for the probability of dropping out of the study in order to investigate whether external covariates could convert the non-ignorable process into an ignorable one. The results revealed that the effect of external covariates on the odds ratios and the CIs of the previous and current MMSE scores was only marginal and the growth estimate remained unchanged (Table 3, Model 5). Sex did not exert a statistically significant effect on the probability of dropout while the risk of dropping out increased with increasing age. According to the Satorra-Bentler chi-square difference test (χ2=22.19, df = 6, P=0.001) Model 5 is preferable to Model 3.
Altogether, when comparing the five LGC models for the MMSE scores with or without explicit models for missing data mechanism, it could be seen that the choice of the dropout model had an effect on the growth estimates of the LGC model. According to the Satorra-Bentler chi-square difference tests between nested models, Model 5 under the assumption of non-ignorable missing data was preferred.
Modeling results for number of drugs
In investigation of how missingness could affect the growth estimates when exploring changes in polypharmacy, LGC models for the number of drugs in use were investigated. In the same manner as for the MMSE score, LGC models under ignorable and non-ignorable missing data assumptions were evaluated.
Ignorable growth curve models
Starting with a traditional model under an assumption of ignorable missing data, an LGC model was estimated with the latent intercept and linear slope components. The fit of the model was poor: χ2 (5, N=781) =56.14, P<0.001, CFI =0.96, TLI =0.95, RMSEA =0.11 and SRMR =0.02, and the modification indices suggested that letting the error terms correlate would improve the fit of the model significantly. The fit of the final model was good: χ2 (4, N=781) =7.74, P=0.10, CFI =1.00, TLI =1.00, RMSEA =0.04 and SRMR =0.01 (Table 4, Model 6).
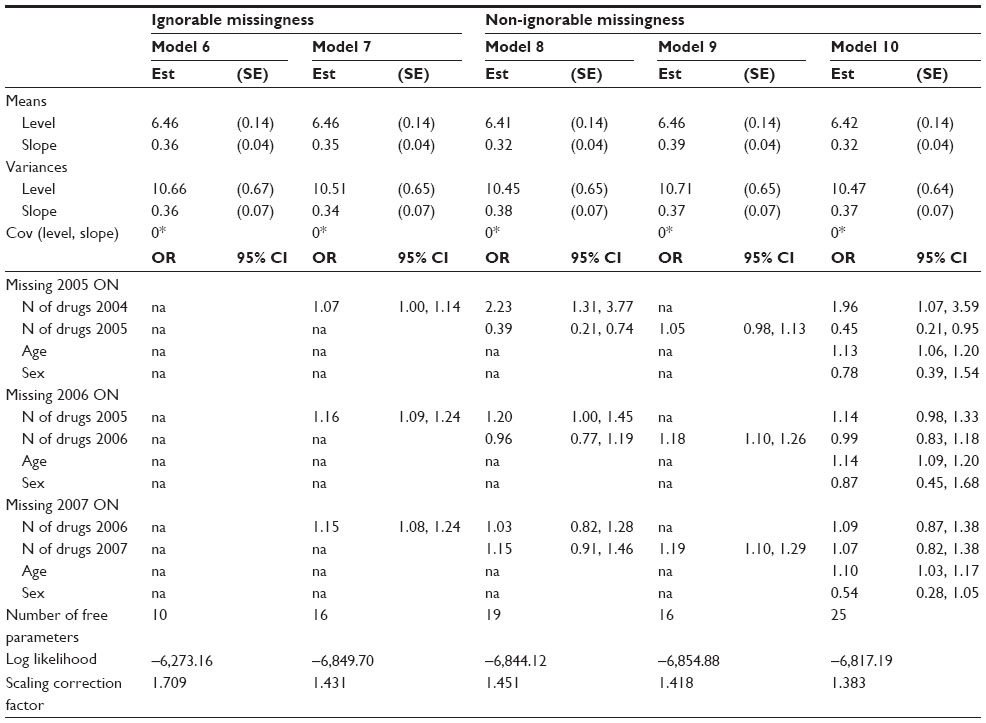 | Table 4 Estimation results from latent growth curve models for number of drugs in use with and without logistic regression models for dropout, GeMS study, Kuopio, Finland, 2004–2007 |
The average number of drugs at baseline was 6.46 and the rate of growth was positive and statistically significant, 0.36 drugs (P<0.001). In other words, it would take approximately 3 years to receive an extra drug due to the linear growth (Table 4, Model 6). The variances of the latent level component and the latent slope component were statistically significant, 10.66 (P<0.001) and 0.36 (P<0.001), respectively, indicating that there were significant inter-individual differences in these two growth factors. According to the zero-covariance between the latent intercept component and the latent slope component, there was no dependence between the baseline level and the rate of growth.
When binary logistic regressions with dropout indicators were added to the previous model in order to explicitly model the ignorable missing data mechanism with the previous measured numbers of drugs as time-variant covariates, the growth estimate remained the same as in the traditional model. This selection model is presented in Table 4 as Model 7. The variances of the latent variables were reduced, but only marginally. The number of drugs in use was related to dropping out of the study ie, the higher the number of drugs in use at the previous examination, the more likely was the dropout.
Non-ignorable growth curve models
Adding the current number of drugs as a predictor for the probability of dropout in addition to the previous measured number of drugs to Model 7 made it possible for us to investigate the effect of non-ignorable missing data assumption on the growth estimate (Table 4, Model 8). The average baseline level estimate and the growth rate estimate as well as their variances were at the same level as in Models 6 and 7 when ignorable missing data assumption was applied. As in the corresponding Model 3 for the MMSE score, odds ratios describing the effect of the number of drugs in use on the dropout probabilities were again in opposite directions for previous and current values although there was some fluctuation across one in odds ratios for the current number of drugs among the years. Rewriting the dropout model for the year 2005 as
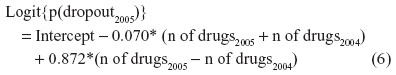
suggests that the probability of dropout in 2005 increases when there is a large increment in the number of drugs between the previous and current year. The average level of number of drugs has only a minor influence on the probability of dropout. Satorra-Bentler chi-square difference test between Models 7 and 8 revealed that the Model 7 under ignorable missing data assumption achieved a better fit than Model 8 when non-ignorable missingness was assumed (χ2=7.17, df =3, P=0.067).
In addition a model was explored when one uses the non-ignorable missing data assumption where the current measured number of drugs in use alone predicted the probability of dropout. The growth estimate increased slightly while all the other estimates remained at their original level (Table 4, Model 9). As in Model 7 where probability of dropout was regressed on the previous measured number of drugs in use, the current number of drugs was statistically significantly related to dropping out of the study: the more drugs the participant had at the follow-up, the more likely it was that he/she would be missing in that particular follow-up examination. However, some of the odds ratios for the current number of drugs were in the opposite direction to the corresponding odds ratios in Model 8.
Adding age and sex into Model 8 under the assumption of non-ignorable missing data did not have any effect on the growth estimates and their standard errors when compared to a similar model without external covariates (Table 4, Model 10). The results revealed that sex did not exert a statistically significant effect on the probability of dropout, but increasing age increased the risk of dropping out of the study at all of the follow-up examinations.
To summarize, when comparing all the five LGC models fitted for the number of drugs outcome with or without explicit models for the missing data mechanism, the growth estimates did not vary extensively between the models. With respect to the LGC models with explicit models for missingness, Model 7 using the ignorable missing data assumption was preferred.
Discussion
This case study on cognitive function and polypharmacy in older persons reveals that missing data mechanism is a key component in analysis of data from longitudinal studies among older persons. It was not obvious whether the missing data in this study were ignorable or non-ignorable; therefore, ignoring the missing data mechanism might have led to invalid and inefficient inferences of the population of interest. Secondly, the usefulness of latent variable modeling was demonstrated.
The results from the LGC models revealed that, in case of the continuous outcomes, the results derived by explicitly modeling the non-ignorable missing data mechanism in selection models suffered from collinearity problems due to high correlations between consecutive measures in the logistic part of the models. The MMSE score contained an item non-response in addition to a non-response due to dropout whereas the number of drugs could be measured for all persons participating in the GeMS study. For the MMSE score, the best fitting model was the selection model utilizing the non-ignorable missing data assumption with additional predictors for dropout. This model suggested that the average baseline MMSE score remains at its level (24.6 points) and the slope of change is slower (−1.8 points for non-ignorable and −3.0 points for traditional model) during the 3 years of follow-up when compared with the estimation results from the traditional LGC model. CIs of the slope estimates were not overlapping (95% CIs [−1.1, −2.4] and [−2.5, −3.4], respectively). For the outcome number of drugs, models utilizing the ignorable missing data assumption had the best fit; no clinically significant differences emerged in the estimation results obtained from various models fitted (6.4–6.5 drugs for baseline level and 0.3–0.4 drugs for the slope of change). However, the selection model utilizing the ignorable missing data assumption revealed that the previous number of drugs predicted the probability of dropout. This type of information cannot be produced by traditional models. The results for the number of drugs outcome were consistent with those of Schafer and Graham and Collins et al – departures from the assumption of ignorable missingness were not strong enough to have any clinically significant impact on estimates and standard errors.41,42 On the other hand, Diggle and Kenward reported similar results as found here for the MMSE score in Models 3 and 5 with the non-ignorable missing data assumption.18 They explained the difference in growth rates produced by ignorable and non-ignorable models in terms of the parameters of the dropout component of a selection model rather than as a problem due to collinearity.
It is also worthwhile considering how sensitive MMSE scores or number of drugs as outcome variables, are to older persons deteriorating or dying, especially when these outcomes are measured at 1 year intervals. It might be that in this study deviations from ignorable missingness were not so marked because of the short interval between examinations. In the studies conducted by Muniz-Terrera et al and Dufouil et al, follow-up interviews were carried out on an average of 2, 7, and 9 years after the baseline examination, and as a result, explicit modeling of the non-ignorable missing data mechanism was recommended.12,28
In selection models, three separate logistic models for dropouts were constructed, one for each of the follow-up examinations, and combined with measurement models. Our hybrid models were selection models that have been criticized for employing missing data mechanisms which may be implausible.43 In preliminary analyses, adding years of education and self-reported health (in addition to age and sex) as predictors into the non-ignorable dropout models had only a negligible effect on the baseline and change estimates (data not shown). The final non-ignorable analyses were performed without these covariates. Some authors have proposed fixing parameters for current outcome in dropout models at reasonable values with expert opinion. This was considered inappropriate in our study since some unverifiable assumptions would need to have been made.43,44 Based on the estimation results from this study, previous MMSE scores and number of drugs were sufficiently representative to predict the dropout since examinations were performed annually and also deaths, which were the principal cause (89%) of dropouts, occurred within a relatively short period before the following examinations. The previously measured outcomes were statistically significant predictors of drop-out, which is an indication of a survival bias.
In our data, the outcomes were not normally distributed; hence, the Robust Maximum Likelihood estimation was applied. The outcome number of drugs is a count variable but was treated as a continuous variable in growth curve models as the variable was not bounded at zero. Alternatively, we could have used the LGC model for a count outcome assuming a Poisson or negative binomial distribution which is straightforward in the Mplus.24 In addition to Diggle-Kenward selection models, other alternatives with which to model the non-ignorable missing data mechanism using maximum likelihood estimation included shared parameter models,45 pattern-mixture models,21,32 Muthén et al22 newly introduced extensions of the before mentioned models and Beunckens et al46 proposed latent-class mixture models. In this study, deaths and other reasons for dropout were combined and missing data indicators were created based on them since they both resulted in permanent missing data. Application of the selection models in a study of older people was conceptually challenging because the outcomes were related to death. Another possibility would be to model deaths separately from other types of missingness.
The design of the GeMS study can be regarded as a limitation of this study. The number of examinations (altogether four) limits the choice of models that can be constructed.
Structural equation modeling is a very flexible method of analysis when both continuous and discrete representations are provided in the same model. From the latent variable models estimated in this paper, it can be concluded that traditional LGC models fitted with the assumption of MAR were robust since taking the ignorable missing data mechanism into account did not have any effect on the growth estimates. Finally, we conclude that in the context of longitudinal studies of an elderly population where attrition is a problem, it is recommended that sensitivity analyses for the assumption of missing data should be performed and caution is needed when modeling non-ignorable missing data.
Acknowledgments
The Geriatric Multidisciplinary Strategy for the Good Care of the Elderly (GeMS) study was financially supported by the Social Insurance of Finland and the municipality of Kuopio. The study protocol was approved by the Research Ethics Committee of the Hospital District of Northern Savo as required by Finnish legislation. Written informed consent was obtained from the subjects or their relatives. The authors wish to thank Prof Simon Bell and Ewen MacDonald for linguistic advice.
Disclosure
The authors report no conflicts of interest in this work.
References
Maher RL Jr, Hanlon JT, Hajjar ER. Clinical consequences of polypharmacy in elderly. Expert Opin Drug Saf. 2014;13(1):57–65. | |
Jyrkkä J, Enlund H, Lavikainen P, Sulkava R, Hartikainen S. Association of polypharmacy with nutritional status, functional ability and cognitive capacity over a three-year period in an elderly population. Pharmacoepidemiol Drug Saf. 2010;20(5):514–522. | |
Reijnders J, van Heugten C, van Boxtel M. Cognitive interventions in healthy older adults and people with mild cognitive impairment: a systematic review. Ageing Res Rev. 2013;12(1):263–275. | |
Patterson SM, Hughes C, Kerse N, Cardwell CR, Bradley MC. Interventions to improve the appropriate use of polypharmacy for older people. Cochrane Database of Syst Rev. 2012;5:CD008165. | |
Clyne B, Bradley MC, Hughes C, Fahey T, Lapane KL. Electronic prescribing and other forms of technology to reduce inappropriate medication use and polypharmacy in older people: a review of current evidence. Clin Geriatr Med. 2012;28(2):301–322. | |
Caracciolo B, Palmer K, Monastero R, Winblad B, Bäckman L, Fratiglioni L. Occurrence of cognitive impairment and dementia in community: A 9-year-long prospective study. Neurology. 2008;70(19 Pt 2):1778–1785. | |
Diehr P, Lee Johnson LL. Accounting for missing data in end-of-life research. J Palliat Med. 2005;8 Suppl 1:S50–S57. | |
Folstein MF, Folstein SE, McHugh PR. “Mini-Mental State”: a practical method for grading the cognitive state of patients for the clinician. J Psychiatr Res. 1975;12(3):189–198. | |
Muniz-Terrera G, Matthews F, Dening T, Huppert FA, Brayne C, CC75C Group. Education and trajectories of cognitive decline over 9 years in very old people: methods and risk analysis. Age Ageing. 2009;38(3):277–282. | |
Small BJ, Bäckman L. Longitudinal trajectories of cognitive change in preclinical Alzheimer’s disease: a growth mixture modeling analysis. Cortex. 2007;43(7):826–834. | |
Jacqmin-Gadda H, Commenges D, Fabrigoule C, Dartigues JF. A 5-year longitudinal study of the Mini-Mental State Examination in normal aging. Am J Epidemiol. 1997;145(6):498–506. | |
Muniz-Terrera G, Matthews F, Brayne C. A comparison of parametric models for the investigation of the shape of cognitive change in the older population. BMC Neurol. 2008;8:16. | |
Lapi F, Pozzi C, Mazzaglia G, et al. Epidemiology of suboptimal prescribing in older, community dwellers: a two-wawe, population-based survey in Dicomano, Italy. Drugs Aging. 2009;26(12):1029–1038. | |
Jyrkkä J, Vartuainen L, Hartikainen S, Sulkava R, Enlund H. Increasing use of medicines in elderly persons: a five-year follow-up of the Kuopio 75+ Study. Eur J Clin Pharmacol. 2006;62(2):151–158. | |
Linjakumpu T, Hartikainen S, Klaukka T, Veijola J, Kivelä SL, Isoaho R. Use of medications and polypharmacy are increasing among the elderly. J Clin Epidemiol. 2002;55(8):809–817. | |
Jylhä M. Ten-year change in the use of medical drugs among the elderly – a longitudinal study and cohort comparison. J Clin Epidemiol. 1994;47(1):69–79. | |
Steward RB, Moore MT, May FE, Marks RG, Hale WE. A longitudinal evaluation of drug use in ambulatory elderly population. J Clin Epidemiol. 1991;44(12):1353–1359. | |
Diggle P, Kenward M. Informative drop-out in longitudinal data analysis (with discussion). Appl Stat. 1994;43(1):49–93. | |
Hogan JW, Laird NM. Model-based approaches to analysing incomplete longitudinal and failure time data. Stat Med. 1997;16(1–3):259–272. | |
Molenberghs G, Verbeke G. A review of linear mixed models for longitudinal data, possibly subject to dropout. Statistical Modelling. 2001;1:235–269. | |
Enders CK. Missing not at random models for latent growth curve analyses. Psychol Methods. 2011;16:1–16. | |
Muthén B, Asparouhov T, Hunter A, Leuchter A. Growth modeling with non-ignorable dropout: alternative analyses of the STAR*D Antidepressant Trial. Psychol Methods. 2011;16(1):17–33. | |
statmodel.com [homepage on the Internet]. Muthén LK, Muthén BO. Mplus Version 6 (1998–2010). [updated April 25, 2010; cited September 16, 2010]. Available from: http://www.statmodel.com. Accessed November 14, 2014. | |
Muthén LK, Muthén BO. Mplus User’s Guide. Sixth Edition. Los Angeles, CA: Muthén and Muthén; 1998–2010. | |
Lampela P, Hartikainen S, Sulkava R, Huupponen R. Adverse drugs effects in elderly people – a disparity between clinical examination and adverse effects self-reported by the patient. Eur J Clin Pharmacol. 2007;63(5):509–515. | |
Hiitola P, Enlund H, Kettunen R, Sulkava R, Hartikainen S. Postural changes in blood pressures and prevalence of orthostatic hypotension among the home-dwelling elderly aged 75 years or older. J Hum Hypertens. 2009;23(1):33–39. | |
Rikala M, Hartikainen S, Sulkava R, Korhonen M. Validity of the Finnish Prescription Register for measuring psychotropic drug exposures among elderly Finns – a population-based intervention study. Drugs Aging. 2010;27(4):337–349. | |
Dufouil C, Brayne C, Clayton D. Analysis of longitudinal studies with death and dropout: a case study. Stat Med. 2004;23(14):2215–2226. | |
Jyrkkä J, Enlund H, Korhonen MJ, Sulkava R, Hartikainen S. Polypharmacy status as an indicator for mortality in an elderly population. Drugs Aging. 2009;26(12):1039–1048. | |
Espino DV, Bazaldua OV, Palmer RF, et al. Suboptimal medication use and mortality in an older adult community-based cohort: Results from the Hispanic EPESE study. J Gerontol A Biol Sci Med Sci. 2006;61(2):170–175. | |
Rubin DB. Inference and missing data. Biometrika. 1976;63(3):581–592. | |
Little RJ. Modeling the drop-out mechanism in repeated-measures studies. J Am Stat Assoc. 1995;90:1112–1121. | |
Muthén BO, Khoo ST. Longitudinal studies of achievement growth using latent variable modeling. Learn Individ Differ. 1998;10:73–101. | |
Aunola K, Leskinen E, Onatsu-Arvilommi T, Nurmi JE. Three methods for studying developmental change: A case of reading skills and self-concept. Br J Educ Psychol. 2002;72(Pt 3):343–364. | |
Bast J, Reitsma P. Matthew effects in reading: A comparison of latent growth curve models and simplex models with structured means. Multivariate Behav Res. 1997;32(2):135–167. | |
Jöreskog KG. Estimation and testing of simplex models. Br J Math Stat Psychol. 1970;23:121–145. | |
Browne KA, Cudeck R. Alternative ways of assessing model fit. In: Bollen KA, Long JS, editors. Testing Structural Equation Models. Newbury Park, CA: Sage; 1993:136–162. | |
Marsh HW, Balla JR, Hau KT. An evaluation of incremental fit indices: A clarification of mathematical and empirical processes. In: Marcoulides GA, Schumacker RE, editors. Advanced Structural Equation Modelling Techniques. Hillsdale, NJ: Erlbaum; 1996:315–353. | |
Satorra A. Scaled and adjusted restricted tests in multi-sample analysis of moment structures. In: Heijmans RDH, Pollock DSG, Satorra A, editors. Innovations in Multivariate Statistical Analysis. A Festschrift for Heinz Neudecker. London: Kluwer Academic Publishers; 2000:233–247. | |
statmodel.com [homepage on the Internet]. Chi-Square Difference Testing Using the Satorra-Bentler Scaled Chi-Square. Available from: http://www.statmodel.com/chidiff.shtml. Accessed November 14, 2014. | |
Schafer JL, Graham JW. Missing data: our view of the state of the art. Psychol Methods. 2002;7(2):147–177. | |
Collins LM, Schafer JL, Kam CM. A comparison of inclusive and restrictive strategies in modern missing-data procedures. Psychol Methods. 2001;6(4):330–351. | |
Kenward MG, Molenberghs G. Parametric models for incomplete continuous and categorical longitudinal data. Stat Methods Med Res. 1999;8(1):51–83. | |
Daniels MJ, Hogan JW. Missing Data in Longitudinal Studies: Strategies for Bayesian Modeling and Sensitivity Analysis. CRC Press; 2008. | |
Gao S. A shared random effect parameter approach for longitudinal dementia data with non-ignorable missing data. Stat Med. 2004;23(2):211–219. | |
Beunckens C, Molenberghs G, Verbeke G, Mallinckrodt C. A latent-class mixture model for incomplete longitudinal Gaussian data. Biometrics. 2008;64(1):96–105. |
Supplementary material
 © 2015 The Author(s). This work is published and licensed by Dove Medical Press Limited. The full terms of this license are available at https://www.dovepress.com/terms.php and incorporate the Creative Commons Attribution - Non Commercial (unported, v3.0) License.
By accessing the work you hereby accept the Terms. Non-commercial uses of the work are permitted without any further permission from Dove Medical Press Limited, provided the work is properly attributed. For permission for commercial use of this work, please see paragraphs 4.2 and 5 of our Terms.
© 2015 The Author(s). This work is published and licensed by Dove Medical Press Limited. The full terms of this license are available at https://www.dovepress.com/terms.php and incorporate the Creative Commons Attribution - Non Commercial (unported, v3.0) License.
By accessing the work you hereby accept the Terms. Non-commercial uses of the work are permitted without any further permission from Dove Medical Press Limited, provided the work is properly attributed. For permission for commercial use of this work, please see paragraphs 4.2 and 5 of our Terms.