Back to Journals » Breast Cancer: Targets and Therapy » Volume 17
Immune and Metabolic Reprogramming Induced by Paclitaxel, Capecitabine and Eribulin in Breast Cancer: Insights into Therapeutic Targets
Authors Hsiao HH, Patel R ![]() , Kalinski P, Takabe K
, Kalinski P, Takabe K ![]() , Ernstoff MS, Rosario SR, Gandhi S
, Ernstoff MS, Rosario SR, Gandhi S
Received 26 September 2024
Accepted for publication 1 April 2025
Published 29 April 2025 Volume 2025:17 Pages 359—372
DOI https://doi.org/10.2147/BCTT.S498070
Checked for plagiarism Yes
Review by Single anonymous peer review
Peer reviewer comments 3
Editor who approved publication: Professor Harikrishna Nakshatri
Hua-Hsin Hsiao,1,* Riya Patel,2,* Pawel Kalinski,3 Kazuaki Takabe,4 Marc S Ernstoff,5 Spencer R Rosario,1,6 Shipra Gandhi7
1Department of Biostatistics and Bioinformatics, Roswell Park Comprehensive Cancer Center, Buffalo, NY, 14263, USA; 2Department of Medicine, Roswell Park Comprehensive Cancer Center, Buffalo, NY, 14263, USA; 3Department of Immunology, Roswell Park Comprehensive Cancer Center, Buffalo, NY, 14263, USA; 4Department of Surgical Oncology, Roswell Park Comprehensive Cancer Center, Buffalo, NY, 14263, USA; 5ImmunoOncology, NCI Division of Cancer Treatment and Diagnosis, Bethesda, MD, 20892, USA; 6Department of Pharmacology and Therapeutics, Roswell Park Comprehensive Cancer Center, Buffalo, NY, 14263, USA; 7Department of Medical Oncology, Roswell Park Comprehensive Cancer Center, Buffalo, NY, 14263, USA
*These authors contributed equally to this work
Correspondence: Spencer R Rosario, Roswell Park Comprehensive Cancer Center, Elm & Carlton Street, Buffalo, NY, 14263, USA, Email [email protected] Shipra Gandhi, Roswell Park Comprehensive Cancer Center, Elm & Carlton Street, Buffalo, NY, 14263, USA, Email [email protected]
Purpose: Chemotherapeutic agents are known to exert anti-tumor effects by not only invoking cytotoxic effects, but also by altering both the immune profile and metabolic milieu. These alterations to both the immune milieu and circulating metabolome may be leveraged for designing rationale drug combinations with immunotherapeutic agents, once chemotherapy fails.
Patients and Methods: Using publicly available transcriptomic data for breast cancer (BC) patients treated with neoadjuvant chemotherapy (GSE162187), we assessed transcriptional alterations that coincide with response to chemotherapy. To further study the metabolic and immune alterations associated with chemotherapeutic resistance, plasma samples from BC patients treated with eribulin, paclitaxel and capecitabine were obtained and assessed via Metabolomics and Luminex, at time of progression as compared to baseline.
Results: Transcriptomics analysis revealed enrichment of amino acid and lipid metabolic pathways, as well as immune pathways including B cells, complement cascade and T cells, in patients resistant to chemotherapy. To validate these findings and assess the differences among different chemotherapies, plasma samples were obtained at baseline and disease progression. Increases in IL-18; IL-22, amylin and IL-6 were observed at the time of disease progression on eribulin, capecitabine and paclitaxel, respectively. Metabolically, increases in docosahexaenoic acid and decreases in sphingomyelins; increases in triacylglycerides and decreases in fatty acids, and decreases in glutamic acid, lipids and phosphatidylcholines were observed on disease progression on eribulin, capecitabine and paclitaxel, respectively.
Conclusion: Distinct patterns of metabolic and immune dysregulation were associated with resistance to eribulin, capecitabine and paclitaxel. Varied immune and metabolic profiles were specific to each of the three chemotherapies, representing potential novel, and individualized, points of therapeutic leverage.
Keywords: chemoresistance, immune regulation, metabolism, metastatic breast cancer
Introduction
In addition to direct killing of cancer cells, chemotherapeutic agents induce multiple biological effects on the host tissues and the immune system, affecting the tumor microenvironment (TME), tumor and immune cell metabolism (reduction of PDL-1 and FOXP3 expression with eribulin), the production of cytokines (an increase in serum IFN-gamma, IL-2, IL-6, GM-CSF cytokines with paclitaxel) and immune cell survival and function (enhancement of PBMX NK and LAK cell activity with paclitaxel; CD8+ effector memory cells and NK cells with capecitabine).1–3 While it is known that chemotherapy can interfere with systemic metabolism4,5 and immunity,6 the metabolic changes occurring in the TME, which can have a significant impact on the development of chemoresistance and immune regulation, has been less studied. Interestingly, these immune effects may be secondary to chemotherapy-induced changes in tumor gene expression patterns directly, but may be actionable nonetheless.7,8 Therefore, understanding the differences in the immune milieu at the time of chemotherapeutic resistance will provide further insight into complex interactions occurring during treatment, and may enhance rational drug combination strategies that include immunotherapeutic agents.9,10
To this end, several high-throughput approaches have gained momentum recently, with metabolomics, a measure of metabolic changes, coming to the forefront in chemotherapeutic resistance research.11 Given metabolic reprogramming is considered a fundamental hallmark of cancer and the improvement of techniques to study metabolism, understanding metabolism presents an important direction of tumor research, with more achievable diverse assessment.12 The Warburg effect, also known as aerobic glycolysis, and reverse Warburg effect, predominated the study of cancer metabolism for 80 years, as a proposed adaptation to support the biosynthetic requirements of uncontrolled proliferation.13 The reverse Warburg effect refers to production of lactate by cancer-associated fibroblasts and the repurposing of lactic acid as a metabolic substrate by cancer cells.14 These processes, have been thoroughly studied, not only in the context of tumor cells, but also in terms of their impacts on the immune system. For example, the acidosis in the TME resulting from reverse Warburg effect, prompts metabolic reprogramming of the immune cells causing immune suppression. Consequently, cancer cells are able to suppress the anti-tumor immune response by competing for and depleting essential nutrients.15,16 With improved tools for assessing metabolomics, other metabolites like tryptophan and kynurenine have been studied in the context of immune cell reprogramming, with several metabolites in the TME, including lactate and reactive oxygen species also contributing to immune cell differentiation and effector function, leading to cancer progression and immune escape.17–21 Therefore, to fully understand the immune reprogramming that results from chemotherapy resistance, it is necessary to examine the metabolic changes, which may impact both the tumor and tumor microenvironment, including the immune compartment. Further, this will support the development of not only predictive biomarkers of disease progression and chemoresistance but may also highlight new therapeutic targets.
Therefore, we posit that differences in immune response at time of chemotherapeutic resistance may be leveraged for designing rationale drug combinations with immunotherapeutic agents, in the future. Here, our study focuses on revealing immune and metabolic changes induced by resistance to paclitaxel, capecitabine and eribulin in patients with breast cancer. We hypothesized that treatment-induced metabolic changes are associated with chemotherapy resistance as there is paucity of data in this area and our study aims to study these changes. This is a unique study that explores the interaction between three different chemotherapies, their metabolic changes and the subsequent associations with the immune milieu.
Materials and Methods
Study Design
Our study has 2 major components analyzing our hypothesis. First, we retrospectively queried publicly available data from the Gene Expression Omnibus (GSE162187) for transcriptome analysis.22 Then, in accordance with the Declaration of Helsinki after Roswell Park Institutional Review Board (IRB) approval, we prospectively enrolled metastatic breast cancer patients at our institute for conducting immune and metabolic analyses with quality control and standards established for metabolomics and Luminex assay, thereby, integrating the results of both for final results.
Fifteen metastatic breast cancer patients who were about to start treatment with capecitabine, paclitaxel or eribulin were identified. Capecitabine was dosed at 2 weeks on and 1 week off, paclitaxel was given weekly for 2 weeks and then 1 week off, and eribulin was also given weekly for 2 weeks and then 1 week off, in a 3-week cycle. Peripheral blood samples were collected at baseline and then at the time of disease progression, which was determined by the treating investigator using RECIST v1.1. The study protocol was approved by Roswell Park Institutional Review Board.
Transcriptome Analysis
Raw feature counts were downloaded from the Gene Expression Omnibus (GSE16218).22 Data was then normalized, and differential expression gene (DEG) analysis was conducted using DESeq2.23 Differential expression rank order was utilized for subsequent Gene Set Enrichment Analysis (GSEA), performed using the clusterProfiler package in R. Gene sets queried included Hallmarks, Canonical Pathways and GO Biological Processes Ontology, and Immune Signature collections available through the Molecular Signatures Database (MSigDB). These results were subsequently plotted as lollipop plots.24 Further, immune deconvolution using TIMER, which incorporates 6 different deconvolution algorithms, including QUANTISEQ, was performed to assess the predicted immune components of the Sensitive and Resistant patient populations, which were visualized as violin plots. All analysis was conducted using R (v 4.1.1).25 Statistical significance in DESeq2 was determined by adjusted p values (<0.05) and log2 Fold Changes (>0.58). GSEA pathway significance, was determined by the FDR corrected p-values (<0.05). Significance of differences in immune cell populations, from immune deconvolution, were determined by non-parametric U-tests.
Immune Analysis – Luminex Assays
Plasma samples were lavender-top K2-EDTA tubes, and straws were obtained from the Roswell Park Comprehensive Cancer Center Biospecimen and Biorepository. These samples were then prepared and analyzed in the Roswell Park Comprehensive Cancer Center Flow Immune Analysis Shared Resource, in accordance with the user manual. Human plasma samples were tested using commercially available Luminex kits for the following immune factors: sCD40L, EGF, Eotaxin, FGF-2, FLT-3L, Fractalkine, G-CSF, GM-CSF, GROα, IFNα2, IFNγ, IL-1α, IL-1β, IL-1RA, IL-2, IL-3, IL-4, IL-5, IL-6, IL-7, IL-8, IL-9, IL-10, IL-12 (p40), IL-12 (p70), IL-13, IL-15, IL-17A, IL-17E/IL-25, IL-17F, IL-18, IL-22, IL-27, IP-10, MCP-1, MCP-3, M-CSF, MDC, MIG, MIP-1α, MIP-1β, PDGF-AA, PDGF-AB/BB, RANTES, TGFα, TNFα, TNFβ, VEGF-A (Millipore HCYTA-60K-PX48, Millipore Sigma, Burlington, Massachusetts); I-TAC, SDF (Millipore HCYTB-60K-02C); Amylin (active), C-Peptide, Ghrelin (active), GIP (total), GLP-1 (active), Glucagon, Insulin, Leptin, Pancreatic Polypeptide (PP), PYY (total), Secretin (Millipore HMH3-34K-11); Resistin, Adiponectin, PAI-1 (Total), Lipocalin-2/NGAL, Adipsin/ Factor D (Millipore HADK1MAG-61K-05); and NGF (Millipore HADK2MAG-61K-01). The data was acquired on a Luminex 200 instrument (Luminex Corporation, Austin, Texas). The experiment and instrument set-up were performed based on the manufacturer’s kit instructions. In brief, a serial dilution of standards were analyzed in duplicate wells while the experimental samples were tested in single wells. The plate was incubated overnight with the multiplex beads on a plate shaker, in the dark, at 4° C and processed with the reporter reagents the next day as per manufacturer’s instructions. Analyte concentrations were determined by extrapolating individual experimental fluorescence intensity values against each analyte’s standard curve using the BeadView multiplex data analysis software, version 1.0, (Upstate Cell Signaling Solutions, Lake Placid, New York). The analytical performance was checked using high concentration and low concentration quality controls provided with the kit of which the determined concentration for each analyte needs to be within the manufacturer-determined concentration range. Data was analyzed using Limma for differential abundance analysis, adjusting for BMI and age. Multiple test correction via and Benjamini–Hochberg method was used to obtain an adjusted p value, where significance was assessed as an adjusted p-value of <0.1.
Metabolomics Analysis – Biocrates Assay
Plasma samples were prepared and analyzed in the Roswell Park Comprehensive Cancer Center Bioanalytics, Metabolomics and Pharmacokinetics Shared Resource, using the MxP Quant 500 kit (Biocrates Life Sciences AG, Innsbruck, Austria) in accordance with the user manual. Briefly, 10 μL of each supernatant, quality control (QC) samples, blank, zero sample, or calibration standard were added on the filterspot (already containing internal standard) in the appropriate wells of the 96-well plate. The plate was then dried under a gentle stream of nitrogen. The samples were derivatized with phenyl isothiocyanate (PITC) for the amino acids and biogenic amines and dried again. Sample extract elution was performed with 5 mm ammonium acetate in methanol. Sample extracts were diluted with either water for the HPLC-MS/MS analysis (1:1) or kit running solvent (Biocrates Life Sciences AG) for flow injection analysis (FIA)-MS/MS (50:1), using a Sciex 5500 mass spectrometer. Data was processed using the MetIDQ software (Biocrates Life Sciences AG), and Limma in R for differential metabolite analysis, adjusting for BMI and age. Multiple test correction via and Benjamini–Hochberg method was used to obtain an adjusted p value, where significance was assessed as an adjusted p-value of <0.1.
Correlation of Metabolomics and Luminex
As we did not assume normality of the data, simple Spearman correlation R and p values of top differentially abundant metabolites (Biocrates) and immune factors (Luminex), for each of the treatments at time of progression were calculated, using the “corrplot” function in R, and visualized using “pheatmap”. * in the heatmap, indicate a p<0.05 for that particular correlation between a metabolite and immune factor, as well as metabolites and immune factors with clinical factors.
Results
Transcriptional Profiling of Therapeutic Resistance in Breast Cancer Reveals Enrichment of Metabolic and Immune Related Pathways
To begin to understand the molecular mechanisms associated with the development of chemotherapy resistance in breast cancer patients, it was necessary to utilize a dataset with chemotherapy response information, despite not being reflective of the patient population used in our investigations. To this end, transcriptomics data was obtained from a publicly available dataset (GSE162187), consisting of pretreatment specimens from HER2+/PR-/ER- breast cancer patients, who received neoadjuvant chemotherapy.22 According to their pathological response, patients were designated as either sensitive (pathological complete response: pCR; n=9) or resistant (non-pCR; n=13). Comparisons of resistant and sensitive patient populations resulted in the identification of 748 differentially expressed transcripts (p<0.05, and |logFC|>0.58). While a majority of these transcripts (Figure 1A) were down-regulated (n=521, light pink) and associated with sensitivity, a substantial number (n=227, magenta) were up-regulated and associated with therapeutic resistance. The most significantly differentially expressed genes included metabolic genes (eg ACADM, SLC25A10 and SHMT2), immune genes (eg PDCD4, CD81, CD68 and CD24), and motility genes (eg FGFR4). While there was no accompanying survival data for this dataset, using cBioPortal26 and METABRIC,27 we found significant survival differences based on top metabolic gene expression (Supplementary Figure 1). Although no difference in immune cell infiltrates were observed upon deconvolution of gene expression between responsive and resistance tumors (Figure 1B), gene set enrichment analysis (GSEA, Figure 1C) revealed substantial, significant alterations to immune signatures between the resistant and sensitive populations with alterations to T-cell mediated toxicity and natural killer cells enriched in resistant populations, and IL-10 synthesis and B Cell alterations enriched in sensitive populations. Further, many metabolic pathways were associated with therapeutic resistance in this dataset, including oxidative stress, propanoate metabolism, phospholipid metabolism and amino acid alterations. These transcriptomic alterations provide the foundation to investigate the impact of chemotherapeutic resistance, for several therapies, on immune and metabolic pathways.
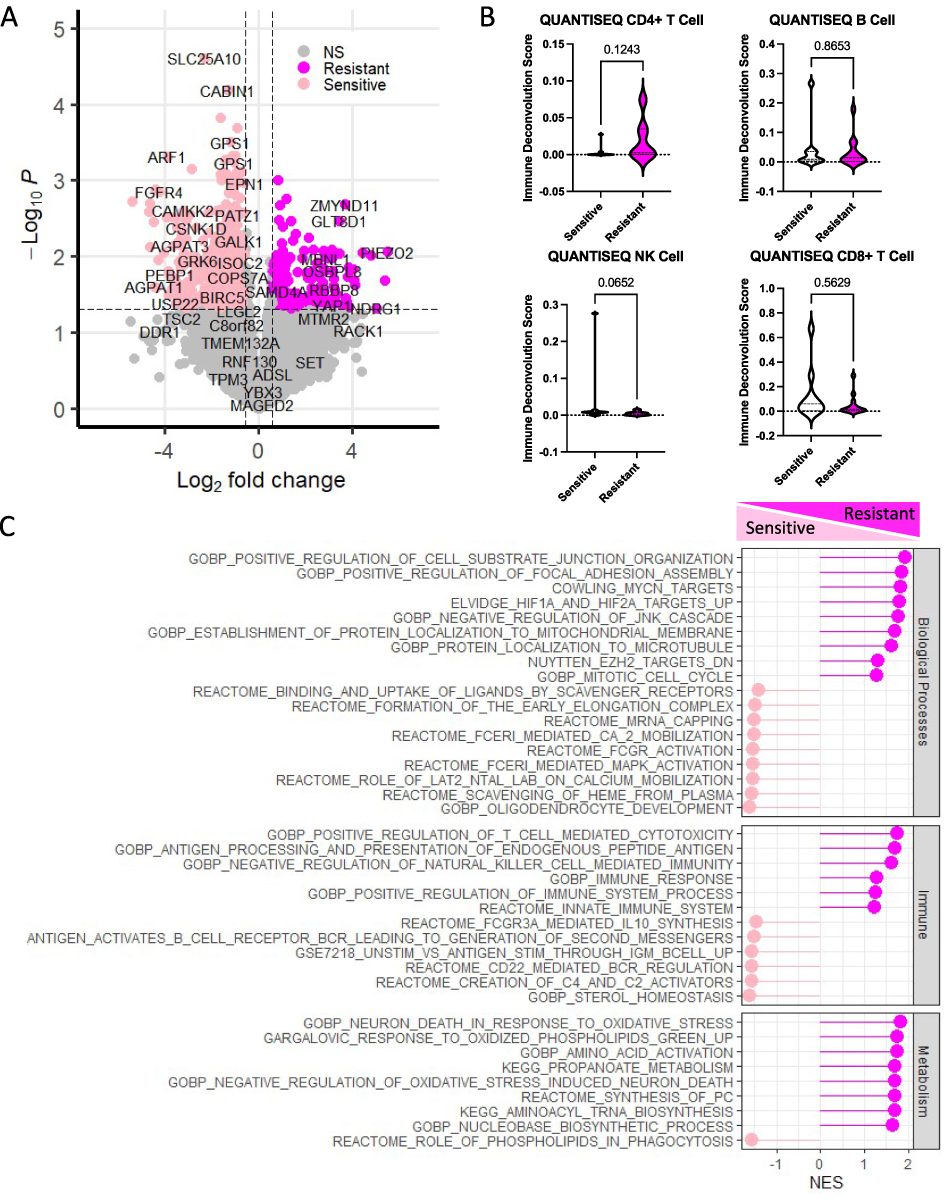 |
Figure 1 Comparison of resistant and sensitive patient tumor samples reveal immune and metabolic transcriptional reprogramming. Using publicly available transcriptomic data for HER2+ breast cancer patients treated with neoadjuvant chemotherapy (GSE162187), the profiles of sensitive and resistant patients were revealed. (A) A large number (n=748) of significantly differentially expressed genes (p<0.05, and |logFC|>0.58) were found between those enriched in the resistant (hot pink) and sensitive (light pink) sample types. (B) Comparison of immune profiles using the QUANTISEQ algorithm, embedded within TIMER, revealed some trends in differences between CD4+ and NK cell population differences between sensitive and resistant cells, as well as non-significant population shifts in a majority of the immune cell populations, including B Cells and CD8+ T-Cells. (C) Gene Set Enrichment Analysis revealed significant enrichment (FDR < 0.05) of several biological processes including mobilization, hypoxia and epigenetic reprogramming, as well as immune factors in both the sensitive and resistant samples. Metabolic dysregulation was more so enriched in the resistant samples, as compared to the sensitive samples. |
Therapeutic Resistance to Eribulin, Capecitabine and Paclitaxel are Associated with Distinct Immune Profiles
To first better understand immune alterations that occur in the context of therapeutic resistance in breast cancer, we identified metastatic ER± or PR± HER2 negative patients with plasma samples at baseline and at time of progression for 3 distinct pharmacologic interventions: eribulin, capecitabine and paclitaxel (Figure 2A). Plasma samples from patients treated with capecitabine at baseline (n=5) and time of progression (n=4), eribulin at baseline (n=7) and time of progression (n=6, and paclitaxel at baseline (n=6) and time of progression (n=2), which were available with the matched clinical information, were analyzed using Luminex and a panel of 49 cytokines, chemokines and immune factors. Principal component analysis was used to assess patient clinical features (Supplementary Table 1), like histology, and tumor subtype which may contribute to the differences in the immune profiles (Supplementary Figure 2), and therefore need to be included in the analysis as a co-variate. This analysis suggested that BMI and age contribute to a large amount of variability in the plasma immune factors, and were therefore adjusted for (Supplementary Figure 2A), whereas interestingly histology did not (Supplementary Figure 2C). Overall, we observed limited separation of treatments (Figure 2B) by their total immune profile. However, differential abundance analysis highlighted unique alterations that occur with progression in each of the treatments (Figure 2C–E). At time of progression on Capecitabine, statistically significant increases over baseline in IL-22 and active Amylin were observed (p<0.05; Figure 2C, dark blue). At progression on Eribulin, statistically significant increases in IL-18 over baseline were observed (p<0.05; Figure 2D, dark green). Conversely, at time of progression on Paclitaxel, increases in IL-6 and decreases in circulating Glucagon compared to baseline were observed (p<0.05; Figure 2E, dark purple and pink, respectively). Not surprisingly, given the different mechanisms of action, of each of these drugs, there was no overlap in differential cytokines (p < 0.1, |logFC| > 0.58) detected in these three treatment groups at time of progression (Figure 2F, red cytokine indicates it was up-regulated with progression, as compared to baseline, and a blue cytokine indicates it was down-regulated with progression, as compared to baseline).
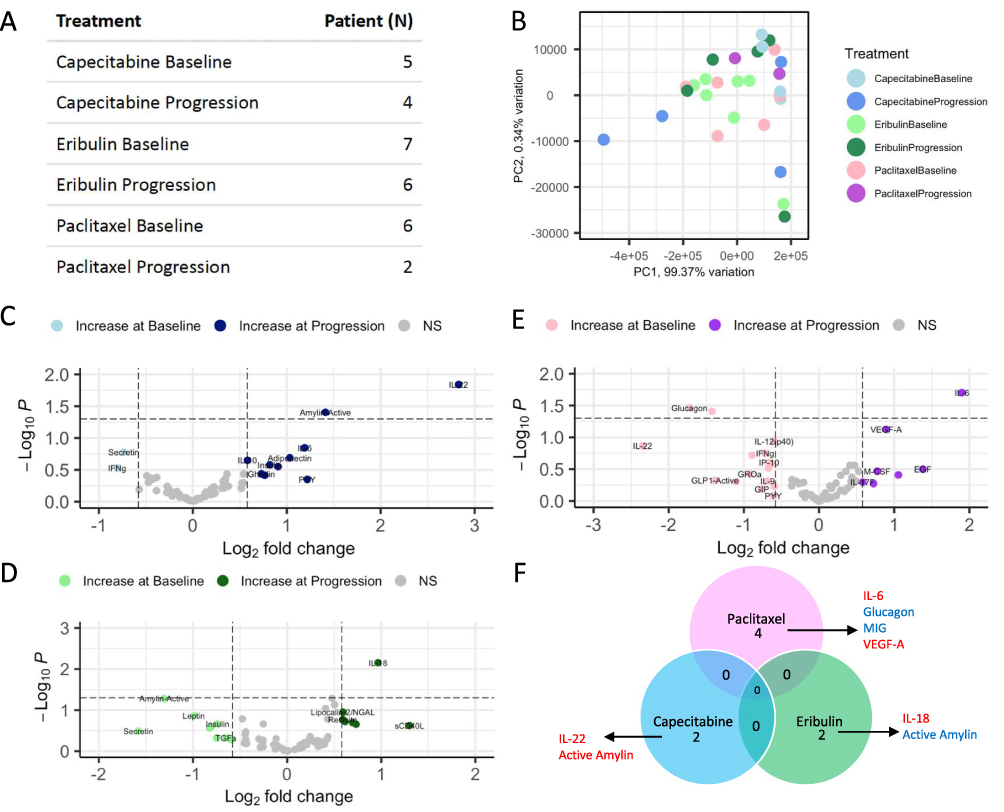 |
Figure 2 Luminex assessment of serum at baseline and time of progression reveals limited immune alterations and overlap of altered immune factors between three different treatment groups at time of progression. Serum samples were obtained from patients at baseline and time of progression on either Capecitabine, Eribulin, or Paclitaxel. (A) Table of the number of patients that fell within each group of either Baseline or Progression are shown. The number of samples available at time of progression on Paclitaxel were limited. (B) Principal component analysis shows limited separation of samples, based on their immune profiles. Volcano plots of differentially abundant immune factors in the (C) Capecitabine, (D) Paclitaxel and (E) Eribulin groups reveal limited significantly differential immune factors (p<0.05, and |logFC|>0.58) between progression and baseline for these 3 treatments, none of which were significant by adjusted p-value. (F) The lack of overlap is further described in the venn diagram which details the few immune factors that were significant, when not adjusted (p val <0.1, |logFC|>0.58), with their direction of change (red=increased at progression, blue=decreased at progression). |
Therapeutic Resistance to Eribulin, Capecitabine and Paclitaxel results in Distinct Metabolic Profiles
Given the enrichment of both immune and metabolic pathways (Figure 1) at the transcriptomic level, and that both immunologic28,29 and metabolic30–33 alterations are associated with therapeutic resistance, it was necessary to also study the metabolic alterations that occur in these patients. However, knowing the immune profiles were unique to each of the chemotherapies, we hypothesized alterations to the metabolic profiles would also be unique to each of the drugs. To this end, plasma samples from each of the same patients explored via Luminex, were used to dissect the metabolic alterations that occur in the context of therapeutic resistance in breast cancer (Figure 2A). Plasma samples were assed via mass spectrometry, where 581 metabolites were detectable in at least one plasma sample (Figure 3A), spanning 20 biochemical classes, including all of the amino acids, a large panel of lipids and metabolites from all the major energy pathways, with the exception of glycolysis and TCA cycle. Unfortunately, given the age of many of these samples, accurately detecting glycolytic and TCA intermediates is diminished, as these metabolites are largely unstable. Once again, principal component analysis (PCA) of clinical factors and histology did not suggest that any of these variables contributed to a large amount of variability in the plasma metabolomics (Supplementary Figure 2B and D). While no clinical factors were found to be associated with the metabolic profiles in patients, adjustment was made for BMI and age to maintain consistency between the way samples were analyzed for both immune and metabolic dysregulation. Consistently, we observed limited separation of treatments (Figure 3B) by their total metabolic profile, and differential abundance of unique alterations that occur with progression in each of the treatments (Figure 3C–E). At time of progression on Capecitabine, statistically significant increases in a large number of triacylglycerides (TGs) and decreases in fatty acids (FA(18:)1)) were observed (p<0.05; Figure 3C, dark blue and light blue, respectively). At progression on Eribulin, statistically significant increases in docosahexaenoic acid (DHA) and decreases in sphingomyelins (SM(OH) C22:1) were observed (p<0.05; Figure 3D, dark green and light green, respectively). Conversely, at time of progression on Paclitaxel, decreases in a wide variety of metabolites including amino acid like compounds glutamic acid (OH-GlutAcid) and lipids (cholesteryl esterases (CE) and phosphatidylcholines (PC)) (p<0.05; Figure 3E, pink) was observed. To better understand which metabolic pathways were altered with each drug, upon progression, metabolites were assessed via metabolite set enrichment analysis (Supplementary Figure 3). Expectedly, the top classes of metabolites being altered were different for all three treatments (Figure 3F, red is increased with progression, blue is decreased at progression) including differential classes of lipids in Paclitaxel (Supplementary Figure 3A) and Capecitabine (Supplementary Figure 3B), and amino acids and lipids in Eribulin (Supplementary Figure 3C), indicating distinct metabolic pathways may be involved in therapeutic resistance, in a chemotherapy-dependent manner.
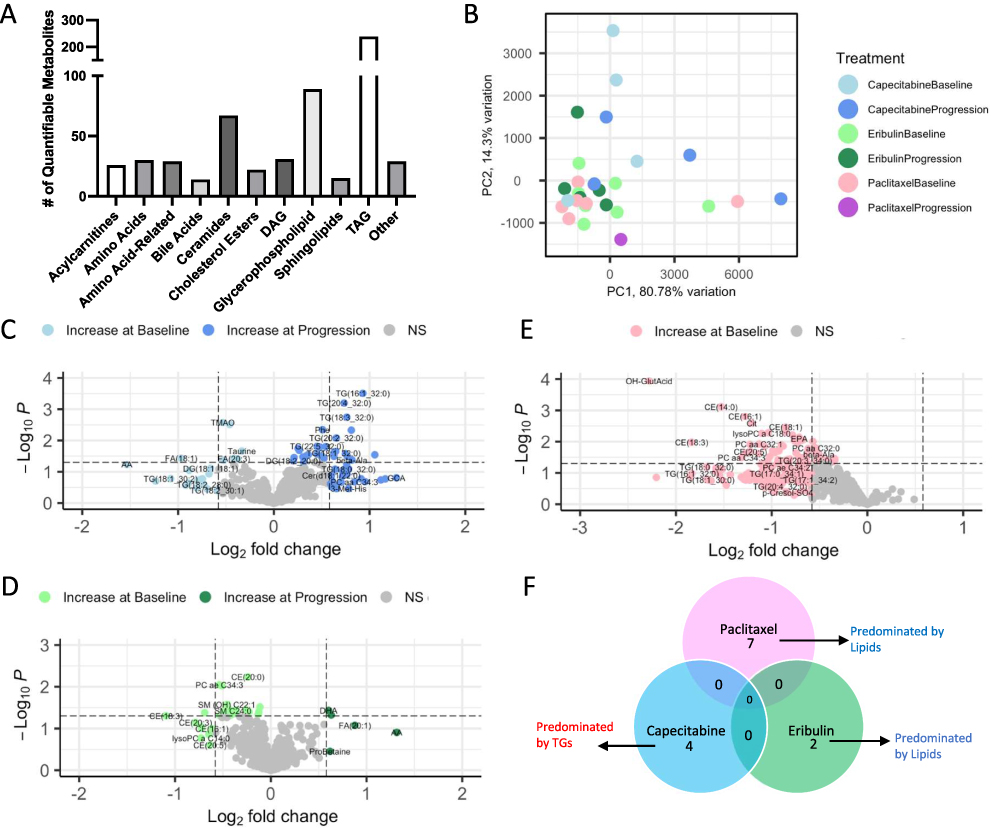 |
Figure 3 Metabolic assessment of serum at baseline and time of progression reveals distinct metabolic alterations between three different treatment groups at time of progression. Matched serum samples from Luminex assays were obtained from patients at baseline and time of progression on either Capecitabine, Eribulin, or Paclitaxel. (A) Bar graph shows the distribution of measurable metabolites (n=581) spanning 20 biochemical classes. (B) Principal component analysis shows some separation of samples, based on their metabolic profiles and drug treatment. Volcano plots of differentially abundant immune factors in the (C) Capecitabine, (D) Eribulin and (E) Paclitaxel groups reveal significantly differential metabolites (p<0.05, and |logFC|>0.58) between progression and baseline for these 3 treatments, some of which were significant by adjusted p-value, however p<0.05 is being shown. However, many of these metabolites did not overlap between the groups. (F) Metabolite set enrichment analysis was implemented on the differential metabolites, to highlight the pathways associated with differentially abundant metabolites (Supplementary Figure 2). The lack of overlap is further described in the venn diagram which details the few metabolic pathways that were significant (p val <0.1), with their direction of change (red=increased at progression, blue=decreased at progression). |
Metabolic and Immune Integration Reveals Relationship Between Circulating Metabolites and Cytokines
The unique alterations in both the metabolic profile and immune milieu necessitates understanding the potential associations between them, especially given the known relationship between immune and metabolic factors.34–39 Therefore, to identify associations between immune and metabolic factors, in our data set, we looked specifically at Spearman correlations in abundance between the top plasma metabolic and immune factors, associated with therapeutic resistance to eribulin (Figure 4A), capecitabine (Figure 4B) and paclitaxel (Figure 4C). Some of the relationships highlighted highly unique biology at the time of resistance with each of these therapies. For example, we uncovered a positive correlation between FA (20:1) and GROa with Eribulin treatment (Figure 4A, * indicate Spearman p < 0.05), only. Additionally, we found statistically significant positive correlations between several triacylglycerides with secretin and phosphatidylcholines with IL-8, IL-22 and IL-6 with Capecitabine treatment (Figure 4B), only. Finally, we observed a highly significant positive correlation between Ghrelin and IFNγ with a wide variety of lipids like cholesterylesterases and phosphatidylcholines with Paclitaxel treatment (Figure 4C), only. Taken together, this data suggests that the abundance of circulating immune and metabolic factors is unique to each chemotherapeutic agent, and may be tied to the development of resistance, and subsequent strategies for overcoming resistance. To this end, additional assessment of correlations between immune factors and clinical factors (Supplementary Figure 4) suggested, not surprisingly, that differences in immune factors are associated with different clinical factors, which may also contribute to therapeutic resistance. For example, in our small patient population, IL-9 is uniquely correlated with histology in patients receiving Paclitaxel treatment, Ghrelin is uniquely correlated with histology in patients receiving Capecitabine treatment, and GROa is uniquely correlated with histology in patients receiving Eribulin treatment. Similar analysis of metabolites in relation to clinical factors revealed unique correlations (Supplementary Figure 5) between metabolic profiles and clinical factors, which may contribute to the development of therapeutic resistance. While all three drugs resulted in correlations between lipids and histology, as well as lipids and BMI, different classes of lipids were associated with each of the chemotherapeutic agents (Supplementary Figure 6). Taken together, this research provides evidence that alterations to the metabolic and immune milieu are associated with the onset of chemotherapeutic resistance in breast cancer patients, and these alterations are highly specific to the drug being utilized, necessitating larger studies on the downstream metabolic and immune impacts of therapeutic resistance, and overcoming resistance to these drugs.
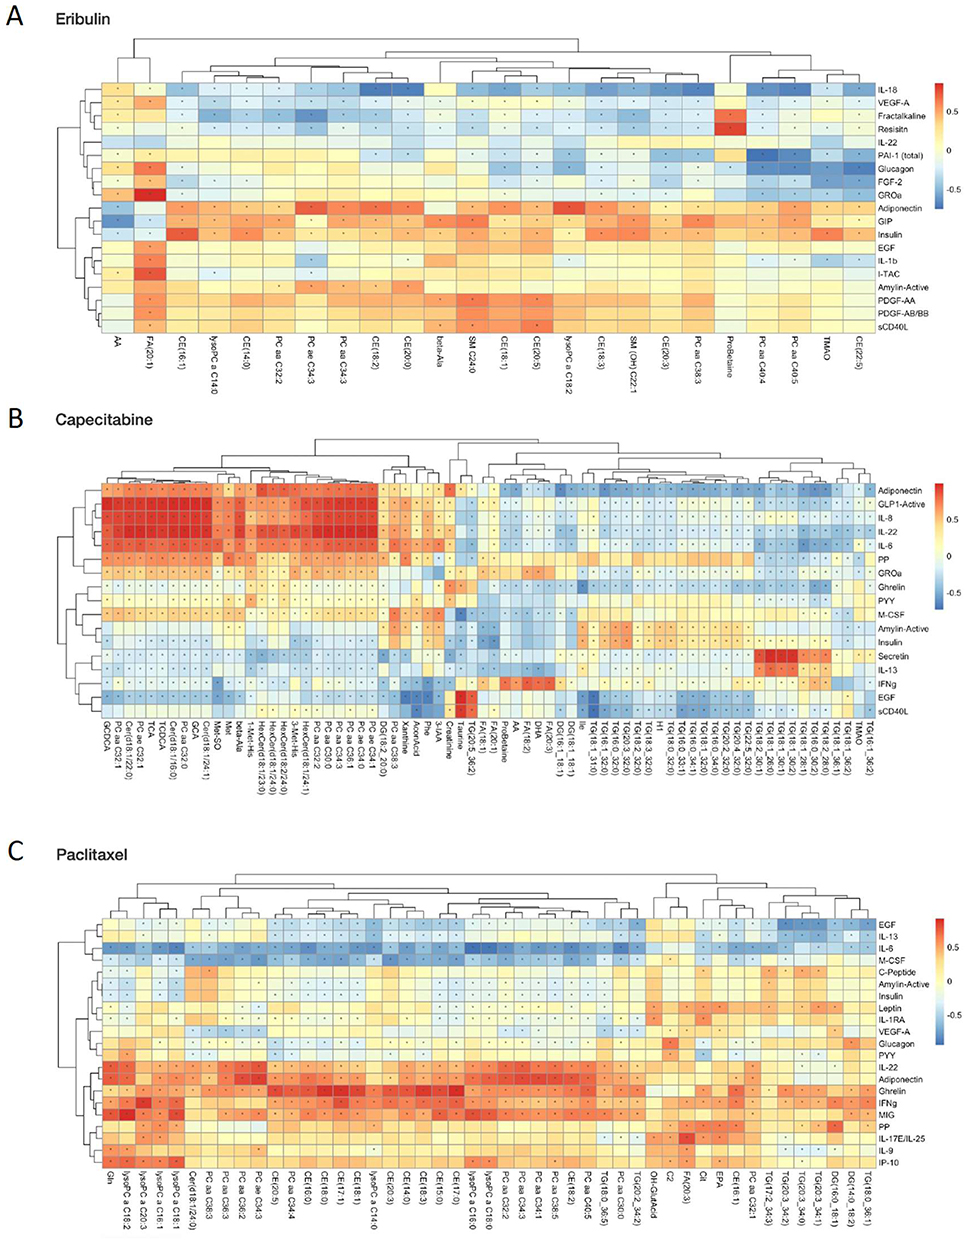 |
Figure 4 Correlation of metabolites with immune factors, at time of progression, in patients treated with eribulin, capecitabine or paclitaxel. Spearman correlation R and p-values were calculated for the top differential metabolites and top variable immune factors for (A) Eribulin, (B) Capecitabine and (C) Paclitaxel. Significant positive (red) and negative (blue) correlations between metabolite abundance and immune factors are indicated by a * (p < 0.05) in the heatmaps. |
Discussion
Our data indicate the existence of unique metabolic and immune signatures associated with the development of therapeutic resistance using orthogonal approaches of transcriptome analysis to reveal the molecular underpinnings of therapeutic resistance (Figure 1), and drug-dependent differential induction of metabolic and immune plasma levels at time of progression (Figures 2–4). In this study, we have demonstrated each of the three drugs (eribulin, paclitaxel, and capecitabine), display unique immune dysregulation (Figure 2), and a unique metabolic dysregulation (Figure 3), at the time of therapeutic resistance, as indicated by disease progression. The fundamental integration of both the metabolic and immune milieu (Figure 4), allows for a better biological understanding of the alterations associated with disease progression while on these 3 commonly used chemotherapies, and may offer novel points of intersection between metabolism and immune regulation leading to strategies which may impact therapeutic efficacy, and guide novel intervention strategies. For example, therapeutic strategies aimed at the reduction of triacylglycerides, with capecitabine, which are all increased in circulation at time of progression, may prove to be an effective treatment strategy. However, this requires more in-depth study and larger sample sizes. While this study provides a framework for future studies to uncover the relationship between the immune milieu and metabolic dysregulation in the context of chemotherapeutic resistance in breast cancer, the findings are limited by the sample size available for this study. Therefore, this work should be used to guide future, more in-depth studies of this relationship.
This work is highly important because it highlights the unique alterations that occur as a result of different chemotherapies. It is well-known phenomenon that metabolic pathway alterations underlie development of chemoresistance, which was further highlighted by the analysis of publicly available dataset (Figure 1) for HER2+ breast cancer patients treated with neoadjuvant chemotherapy with residual disease. In this context, patients with resistant disease showed upregulation of several metabolic transcripts including medium-chain acyl-CoA dehydrogenase (ACADM), which prevents peroxidation of cancer cells, resulting in reduced generation of cytotoxic reactive oxygen species, and increased resilience to chemotherapy. This makes sense in the context of breast cancer chemotherapeutic resistance, given ACADM has been shown to promote the epithelial to mesenchymal transition in breast cancer cells, promoting cancer migration and invasion.40 Conversely, two transcripts associated with chemotherapy sensitivity were: SLC25A10 which regulates redox homeostasis to protect cells against oxidative stress, and SHMT2 which promotes breast cancer proliferation through upregulation of the MAPK pathway.41,42 These changes in metabolic gene signatures were accompanied by changes in immune gene signatures. For example, we observed increases in EOMES and CD68 in the sensitive group, which are critical for T-cell-mediated-immune response and macrophages, respectively. Research in the area of chemotherapeutic resistance has demonstrated a role for metabolic reprogramming at the level of the circulating microenvironment, and also supports the targeting of metabolic reprogramming in cancer.6,43–46 Importantly, it is accepted that transcriptional metabolic and immune gene alteration, does not always dictate functional or phenotypic change, given susceptibility to post-transcriptional and post-translational modifications, amongst other molecular modifications. Therefore, it is necessary to look at the metabolic and immune alterations that occur at the metabolite and protein level, respectively.
To this end, we obtained plasma samples from late-stage metastatic breast cancer patients at baseline (prior to treatment) and at time of progression, we studied the role of these immune (Figure 2) and metabolic (Figure 3) changes in the circulating microenvironment, which encompasses the metabolites and immune factors available for sequestration by both the tumor and circulating immune cells, which would eventually be trafficked to the tumor. This study revealed increases in proinflammatory cytokines in all the three chemotherapy groups (Figure 2), including paclitaxel, capecitabine and eribulin at time of progression, as compared to baseline samples. Notably, in the paclitaxel group, increased IL-6 was observed, similar to previous studies.47 Additionally, previous studies have shown associations of IL-22 and paclitaxel resistance in triple negative breast cancer cells through activation of JAK-STAT3/MAPKs/AKT signaling pathways.48 Emergence of paclitaxel resistance was also associated with increases in VEGF49 and M-CSF,50 as well as EGF and IL-17F, which are involved in stimulating cellular proliferation. Progression on capecitabine was associated with increases in pro-inflammatory, immunosuppressive cytokines, such as, IL-22, IL-6 and IL-10. Coincidentally, progression on capecitabine was also accompanied by an increase in plasma amylin, which inhibits food intake, delays gastric emptying and decreases blood glucose levels, leading to reduction in body weight, and may be associated with cachexia, which often coincides with chemotherapeutic resistance.51 Interestingly, at the time of disease progression on eribulin, upregulation of IL-18 was observed, which is known to promote Th1 cell activation and enhance the cytotoxic activity of CD8+ T cells and natural killer cells, and induces IFN-γ. The variable impacts of chemotherapy on circulating immune factors at time of progression, dependent upon the therapy in question, suggested alterations to the circulating metabolome may also be varied, dependent on the chemotherapy.
We observed that metabolite changes were observed at the time of progression, but also these changes were unique to the specific chemotherapy. For example, with paclitaxel resistance, we observed that coincident increases in pro-inflammatory cytokines were associated with decreases in plasma lipids, including fatty acids, phosphatidylcholines, and sphingomyelins. The role of de novo fatty acid synthesis activation in cancer is known, and recent reports have shown that tumors absorb fatty acids from the tumor microenvironment, suggesting that exogenous uptake of fatty acids could be as important as de novo synthesis, for tumor progression. Further, phosphatidylcholines, which were altered with chemotherapy at time of progression.52 Alterations to lipids like sphingomyelins, have been associated with immune evasion from host effector cells, allowing for tumor growth,53 which may explain the decrease in plasma sphingomyelin level at the time of disease progression. Conversely, at the time of disease progression on eribulin, there was an increase in docosahexaenoic acid (DHA) in circulation, which is also known as omega-3 polyunsaturated fatty acid, and has demonstrated pharmacological efficacy combatting malignancy,54 which may represent a compensatory biological mechanism for overcoming tumor proliferation, as it mediates induction of apoptosis. Each of the metabolic and immune changes present potential points of therapeutic leverage in the context of chemotherapy resistance, in a drug-specific manner. Drugs already exist for targeting several of these proposed pathways. For instance, Dimethylsphingosine (DMS), a methylated version of sphingosine, has been shown to promote apoptosis in cancer cells, and may present a novel therapeutic option at the time of paclitaxel resistance.
This pilot study attempts to study changes in the metabolites and correlate those with immune alterations in patients treated with 3 distinct and commonly used chemotherapeutic options for metastatic breast cancer. However, a major limitation for this study was the number of samples available with matched clinical data, as well as both baseline and time of progression samples. While this data is provocative and suggests there are alterations to both the immune and metabolic compartments, more in depth assessment of their molecular mechanisms at time of progression must be studied. Thus, there is a need for larger studies to establish these associations noted in our study. Further validation with animal models could be used to verify the results and investigate molecular mechanisms underlying these changes. Identification and integration of these interactions can provide valuable insights for the development of new therapeutic strategies and predictive markers of response to these chemotherapies.
Conclusion
To our knowledge, this is the first study that has examined the immune and metabolic interplay among metastatic breast cancer patients who developed resistance to eribulin, paclitaxel and capecitabine. Our study demonstrates that regulation of key metabolic and immune components is unique to different chemotherapy agents, at time of disease progression. Increases in IL-18; IL-22, amylin, and IL-6 were observed at the time of disease progression on eribulin, capecitabine and paclitaxel, respectively. Metabolically, increases in docosahexaenoic acid and decreases in sphingomyelins; increases in triacylglycerides and decreases in fatty acids, and decreases in glutamic acid, lipids and phosphatidylcholines were observed on disease progression on eribulin, capecitabine and paclitaxel, respectively. While we are highly encouraged by the results of this study, we are limited by our small study size, and the lack of tumor samples, where these immune and metabolic changes may be more informative. Therefore, these studies require follow-up with expansion of the number of patients in each group. Additionally, our study included both hormone receptor positive and triple negative metastatic breast cancer patients, and the mechanism of chemoresistance could vary by subtype. Therefore, future studies should incorporate larger patient sample subsets, with matched tumor, and plasma samples. These future studies should correlate these plasma samples with intratumoral changes, as a means of investigating the role of metabolic changes in the plasma, as early biomarkers of chemotherapy resistance, and novel pharmacological targets. Ultimately, this work can help guide personalized treatment options, upon emergence of chemotherapy resistance.
Data Sharing Statement
Data for GEO is publicly available at https://www.ncbi.nlm.nih.gov/geo/query/acc.cgi?acc=GSE162187. Additional data will be made available upon request.
Informed Consent Statement
Informed consent was obtained from all subjects involved in the study.
Institutional Review Board Statement
The study was conducted under an approved Institutional Review Board (IRB) of Roswell Park Comprehensive Cancer Center (BDR 122619 and date of approval: December 18, 2019).
Acknowledgments
We would like to thank staff scientists Krystin Mantione, M.S., and Sarah Burke at the Roswell Park Comprehensive Cancer Center (RP) Bioanalytics, Metabolomics and Pharmacokinetics (BMPK) Shared Resource for guidance and assistance with our metabolomics studies. We would also like to thank the RP Flow Cytometry Shared Resource. This work was supported by the IOTN: Data Management and Resource-Sharing Center (U24CA232979, S.R.R.), ARTNet: Coordinating and Data Management Center (U24CA274159, S.R.R.), the TREC Fellowship Training Workshop (R25CA203650 (PI: Melinda Irwin); S.R.R.). The content is solely the responsibility of the authors and does not necessarily represent the official views of the National Institutes of Health. Computational resources were maintained by the Center for Computational Research at the University at Buffalo.
Author Contributions
All authors made a significant contribution to the work reported, whether that is in the conception, study design, execution, acquisition of data, analysis and interpretation, or in all these areas; took part in drafting, revising or critically reviewing the article; gave final approval of the version to be published; have agreed on the journal to which the article has been submitted; and agree to be accountable for all aspects of the work.
Funding
Research reported in this publication was supported by the National Center for Advancing Translational Sciences of the National Institutes of Health under award numbers KL2TR001413, UL1TR001412, R03TR004607-01 and National Cancer Institute under award number 1K08CA279766-01A1. The content is solely the responsibility of the authors and does not necessarily represent the official views of the NIH.
Disclosure
Hua-Hsin Hsiao and Riya Patel are co-first authors for this study. The authors report no conflicts of interest in this work.
References
1. Goto W, Kashiwagi S, Asano Y, et al. Eribulin promotes antitumor immune responses in patients with locally advanced or metastatic breast cancer. Anticancer Res. 2018;38(5):2929–2938. doi:10.21873/anticanres.12541
2. Peereboom DM, Alban TJ, Grabowski MM, et al. Metronomic capecitabine as an immune modulator in glioblastoma patients reduces myeloid-derived suppressor cells. JCI Insight. 2019;4(22). doi:10.1172/jci.insight.130748
3. Tsavaris N, Kosmas C, Vadiaka M, Kanelopoulos P, Boulamatsis D. Immune changes in patients with advanced breast cancer undergoing chemotherapy with taxanes. Br J Cancer. 2002;87(1):21–27. doi:10.1038/sj.bjc.6600347
4. Tonorezos ES, Jones LW. Energy balance and metabolism after cancer treatment. Semin Oncol. 2013;40(6):745–756. doi:10.1053/j.seminoncol.2013.09.011
5. Van Soom T, El Bakkali S, Gebruers N, Verbelen H, Tjalma W, van Breda E. The effects of chemotherapy on energy metabolic aspects in cancer patients: a systematic review. Clin Nutr. 2020;39(6):1863–1877. doi:10.1016/j.clnu.2019.07.028
6. Sharma A, Jasrotia S, Kumar A. Effects of Chemotherapy on the Immune System: implications for Cancer Treatment and Patient Outcomes. Naunyn Schmiedebergs Arch Pharmacol. 2024;397(5):2551–2566. doi:10.1007/s00210-023-02781-2
7. Noonepalle SKR, Karabon L, Chiappinelli KB, Villagra A. Editorial: genetic and epigenetic control of immune responses. Front Immunol. 2021;12:775101. doi:10.3389/fimmu.2021.775101
8. Orozco JIJ, Grumley JG, Matsuba C, et al. Clinical implications of transcriptomic changes after neoadjuvant chemotherapy in patients with triple-negative breast cancer. Ann Surg Oncol. 2019;26(10):3185–3193. doi:10.1245/s10434-019-07567-6
9. Cortes J, Rugo HS, Cescon DW, et al. Pembrolizumab plus chemotherapy in advanced triple-negative breast cancer. N Engl J Med. 2022;387(3):217–226. doi:10.1056/NEJMoa2202809
10. Tolaney SM, Barroso-Sousa R, Keenan T, et al. Effect of eribulin with or without pembrolizumab on progression-free survival for patients with hormone receptor-positive, erbb2-negative metastatic breast cancer: a randomized clinical trial. JAMA Oncol. 2020;6(10):1598–1605. doi:10.1001/jamaoncol.2020.3524
11. Han J, Li Q, Chen Y, Yang Y. Recent metabolomics analysis in tumor metabolism reprogramming. Front Mol Biosci. 2021;8:763902. doi:10.3389/fmolb.2021.763902
12. Hanahan D, Weinberg RA. Hallmarks of cancer: the next generation. Cell. 2011;144(5):646–674. doi:10.1016/j.cell.2011.02.013
13. Vander Heiden MG, Cantley LC, Thompson CB. Understanding the Warburg effect: the metabolic requirements of cell proliferation. Science. 2009;324(5930):1029–1033. doi:10.1126/science.1160809
14. Liang L, Li W, Li X, et al. ‘reverse Warburg effect’ of cancer‑associated fibroblasts (Review). Int J Oncol. 2022;60(6). doi:10.3892/ijo.2022.5357
15. Guerra L, Bonetti L, Brenner D. Metabolic modulation of immunity: a new concept in cancer immunotherapy. Cell Rep. 2020;32(1):107848. doi:10.1016/j.celrep.2020.107848
16. Hurley HJ, Dewald H, Rothkopf ZS, et al. Frontline science: AMPK regulates metabolic reprogramming necessary for interferon production in human plasmacytoid dendritic cells. J Leukoc Biol. 2021;109(2):299–308. doi:10.1002/JLB.3HI0220-130
17. Fiore A, Murray PJ. Tryptophan and indole metabolism in immune regulation. Curr Opin Immunol. 2021;70:7–14. doi:10.1016/j.coi.2020.12.001
18. Mellor AL, Munn DH. Tryptophan catabolism and regulation of adaptive immunity. J Immunol. 2003;170(12):5809–5813. doi:10.4049/jimmunol.170.12.5809
19. Gu J, Zhou J, Chen Q, et al. Tumor metabolite lactate promotes tumorigenesis by modulating MOESIN lactylation and enhancing TGF-beta signaling in regulatory T cells. Cell Rep. 2022;40(3):111122. doi:10.1016/j.celrep.2022.111122
20. Karayama M, Masuda J, Mori K, et al. Comprehensive assessment of multiple tryptophan metabolites as potential biomarkers for immune checkpoint inhibitors in patients with non-small cell lung cancer. Clin Transl Oncol. 2021;23(2):418–423. doi:10.1007/s12094-020-02421-8
21. Yan Y, Chang L, Tian H, et al. 1-pyrroline-5-carboxylate released by prostate cancer cell inhibit T cell proliferation and function by targeting SHP1/cytochrome c oxidoreductase/ROS axis. J Immunother Cancer. 2018;6(1):148. doi:10.1186/s40425-018-0466-z
22. Barrón-Gallardo CA, Garcia-Chagollán M, Morán-Mendoza AJ, et al. A gene expression signature in HER2+ breast cancer patients related to neoadjuvant chemotherapy resistance, overall survival, and disease-free survival. Front Genet. 2022;13:991706. doi:10.3389/fgene.2022.991706
23. Love MI, Huber W, Anders S. Moderated estimation of fold change and dispersion for RNA-seq data with DESeq2. Genome Biol. 2014;15(12):550. doi:10.1186/s13059-014-0550-8
24. Liberzon A, Subramanian A, Pinchback R, Thorvaldsdottir H, Tamayo P, Mesirov JP. Molecular signatures database (MSigDB) 3.0. Bioinformatics. 2011;27(12):1739–1740. doi:10.1093/bioinformatics/btr260
25. Li T, Fan J, Wang B, et al. TIMER: a web server for comprehensive analysis of tumor-infiltrating immune cells. Cancer Res. 2017;77(21):e108–e110. doi:10.1158/0008-5472.CAN-17-0307
26. Gao J, Aksoy BA, Dogrusoz U, et al. Integrative analysis of complex cancer genomics and clinical profiles using the cBioPortal. Sci Signal. 2013;6(269):pl1. doi:10.1126/scisignal.2004088
27. Curtis C, Shah SP, Chin SF, et al. The genomic and transcriptomic architecture of 2000 breast tumours reveals novel subgroups. Nature. 2012;486(7403):346–352. doi:10.1038/nature10983
28. Repp R, von Horsten B, Csecke A, et al. Clinical and immunological aspects of hepatitis B virus infection in children receiving multidrug cancer chemotherapy. Arch Virol Suppl. 1993;8:103–111. doi:10.1007/978-3-7091-9312-9_11
29. Zitvogel L, Apetoh L, Ghiringhelli F, Kroemer G. Immunological aspects of cancer chemotherapy. Nat Rev Immunol. 2008;8(1):59–73. doi:10.1038/nri2216
30. Dasgupta B, Hirota Y, Fujii Y, et al. Targeting energy metabolism to overcome therapeutic resistance of glioblastoma and tumor-associated edema. In: Debinski W, editor. Gliomas. 2021.
31. Kuo CY, Ann DK. When fats commit crimes: fatty acid metabolism, cancer stemness and therapeutic resistance. Cancer Commun. 2018;38(1):47. doi:10.1186/s40880-018-0317-9
32. Pi M, Kuang H, Yue C, et al. Targeting metabolism to overcome cancer drug resistance: a promising therapeutic strategy for diffuse large B cell lymphoma. Drug Resist Updat. 2022;61:100822. doi:10.1016/j.drup.2022.100822
33. Ying L, Cheng M, Lu Y, et al. Glutamine metabolism scoring predicts prognosis and therapeutic resistance in hepatocellular carcinoma. Pathol Oncol Res. 2021;27:1610075. doi:10.3389/pore.2021.1610075
34. Assi E, Cervia D, Bizzozero L, et al. Modulation of acid sphingomyelinase in melanoma reprogrammes the tumour immune microenvironment. Mediators Inflamm. 2015;2015:370482. doi:10.1155/2015/370482
35. Bag S, Oetjen J, Shaikh S, Chaudhary A, Arun P, Mukherjee G. Impact of spatial metabolomics on immune-microenvironment in oral cancer prognosis: a clinical report. mol Cell Biochem. 2023;479(1):41–49. doi:10.1007/s11010-023-04713-3
36. Bleve A, Durante B, Sica A, Consonni FM. Lipid metabolism and cancer immunotherapy: immunosuppressive myeloid cells at the crossroad. Int J mol Sci. 2020;21(16):5845. doi:10.3390/ijms21165845
37. Chapman NM, Boothby MR, Chi H. Metabolic coordination of T cell quiescence and activation. Nat Rev Immunol. 2020;20(1):55–70. doi:10.1038/s41577-019-0203-y
38. Chapman NM, Chi H. Metabolic adaptation of lymphocytes in immunity and disease. Immunity. 2022;55(1):14–30. doi:10.1016/j.immuni.2021.12.012
39. Chavakis T. Immunometabolism: where immunology and metabolism meet. J Innate Immun. 2022;14(1):1–3. doi:10.1159/000521305
40. Yu Y, Zhao L, Li R. Medium-chain acyl-CoA dehydrogenase enhances invasion and metastasis ability of breast cancer cells. Nan Fang Yi Ke Da Xue Xue Bao. 2019;39(6):650–656. doi:10.12122/j.issn.1673-4254.2019.06.04
41. Zhou X, Paredes JA, Krishnan S, Curbo S, Karlsson A. The mitochondrial carrier SLC25A10 regulates cancer cell growth. Oncotarget. 2015;6(11):9271–9283. doi:10.18632/oncotarget.3375
42. Xie SY, Shi DB, Ouyang Y, et al. SHMT2 promotes tumor growth through VEGF and MAPK signaling pathway in breast cancer. Am J Cancer Res. 2022;12(7):3405–3421.
43. Zhi S, Chen C, Huang H, Zhang Z, Zeng F, Zhang S. Hypoxia-inducible factor in breast cancer: role and target for breast cancer treatment. Front Immunol. 2024;15:1370800. doi:10.3389/fimmu.2024.1370800
44. Nandi I, Ji L, Smith HW, et al. Targeting fatty acid oxidation enhances response to HER2-targeted therapy. Nat Commun. 2024;15(1):6587. doi:10.1038/s41467-024-50998-3
45. Gupta MK, Gouda G, Vadde R. Role of the tumor microenvironment in mediating resistance to anti-HER2 antibodies. Crit Rev Oncog. 2024;29(4):43–54. doi:10.1615/CritRevOncog.2024053419
46. Altrawy A, Khalifa MM, Abdelmaksoud A, et al. Metabolites in the dance: deciphering gut-microbiota-mediated metabolic reprogramming of the breast tumor microenvironment. Cancers. 2024;16(24):4132. doi:10.3390/cancers16244132
47. Pusztai L, Mendoza TR, Reuben JM, et al. Changes in plasma levels of inflammatory cytokines in response to paclitaxel chemotherapy. Cytokine. 2004;25(3):94–102. doi:10.1016/j.cyto.2003.10.004
48. Wang S, Yao Y, Yao M, Fu P, Wang W. Interleukin-22 promotes triple negative breast cancer cells migration and paclitaxel resistance through JAK-STAT3/MAPKs/AKT signaling pathways. Biochem Biophys Res Commun. 2018;503(3):1605–1609. doi:10.1016/j.bbrc.2018.07.088
49. Kim HS, Oh JM, Jin DH, Yang KH, Moon EY. Paclitaxel induces vascular endothelial growth factor expression through reactive oxygen species production. Pharmacology. 2008;81(4):317–324. doi:10.1159/000119756
50. Patysheva M, Frolova A, Larionova I, et al. Monocyte programming by cancer therapy. Front Immunol. 2022;13:994319. doi:10.3389/fimmu.2022.994319
51. Harris K, Boland C, Meade L, Battise D. Adjunctive therapy for glucose control in patients with type 1 diabetes. Diabetes Metab Syndr Obes. 2018;11:159–173. doi:10.2147/DMSO.S141700
52. Saito RF, Andrade LNS, Bustos SO, Chammas R. Phosphatidylcholine-derived lipid mediators: the crosstalk between cancer cells and immune cells. Front Immunol. 2022;13:768606. doi:10.3389/fimmu.2022.768606
53. Tallima H, Azzazy HME, El Ridi R. Cell surface sphingomyelin: key role in cancer initiation, progression, and immune evasion. Lipids Health Dis. 2021;20(1):150. doi:10.1186/s12944-021-01581-y
54. de Freitas Rodrigues J, Philippsen HK, Dolabela MF, Nagamachi CY, Pieczarka JC. The potential of DHA as cancer therapy strategies: a narrative review of in vitro cytotoxicity trials. Nutrients. 2023;15(8):2006. doi:10.3390/nu15082006
 © 2025 The Author(s). This work is published and licensed by Dove Medical Press Limited. The
full terms of this license are available at https://www.dovepress.com/terms
and incorporate the Creative Commons Attribution
- Non Commercial (unported, 4.0) License.
By accessing the work you hereby accept the Terms. Non-commercial uses of the work are permitted
without any further permission from Dove Medical Press Limited, provided the work is properly
attributed. For permission for commercial use of this work, please see paragraphs 4.2 and 5 of our Terms.
© 2025 The Author(s). This work is published and licensed by Dove Medical Press Limited. The
full terms of this license are available at https://www.dovepress.com/terms
and incorporate the Creative Commons Attribution
- Non Commercial (unported, 4.0) License.
By accessing the work you hereby accept the Terms. Non-commercial uses of the work are permitted
without any further permission from Dove Medical Press Limited, provided the work is properly
attributed. For permission for commercial use of this work, please see paragraphs 4.2 and 5 of our Terms.