Back to Journals » Infection and Drug Resistance » Volume 16
Imaging Progression Under Low Respiratory Viral Load of SARS-CoV-2 Omicron Variant Infection: A Retrospective Study in China
Authors Li Q, Wang Y, Liu H, Peng H ![]() , Xiang J, Guo S
, Xiang J, Guo S
Received 25 May 2023
Accepted for publication 21 September 2023
Published 25 October 2023 Volume 2023:16 Pages 6795—6806
DOI https://doi.org/10.2147/IDR.S417062
Checked for plagiarism Yes
Review by Single anonymous peer review
Peer reviewer comments 2
Editor who approved publication: Professor Suresh Antony
Qi Li,1 Yongli Wang,2,* Huawen Liu,3 Hailang Peng,4 Jianglin Xiang,2,* Shuliang Guo4,*
1Department of Radiology, The First Affiliated Hospital of Chongqing Medical University, Chongqing, 400016, People’s Republic of China; 2Department of Infectious Disease, Chongqing University Three Gorges Hospital, Chongqing, 404000, People’s Republic of China; 3Department of Oncology, Chongqing University Three Gorges Hospital, Chongqing, 404000, People’s Republic of China; 4Department of Respiratory and Critical Care Medicine, The First Affiliated Hospital of Chongqing Medical University, Chongqing, 400016, People’s Republic of China
*These authors contributed equally to this work
Correspondence: Shuliang Guo, Department of Respiratory and Critical Care Medicine, The First Affiliated Hospital of Chongqing Medical University, Chongqing, 400016, People’s Republic of China, Tel +86-23-89012097, Email [email protected] Jianglin Xiang; Yongli Wang, Tel +86 13896328822; +86 15213571077, Email [email protected]; [email protected]
Purpose: To investigate the computed tomography (CT) findings of SARs-CoV-2 Omicron variant in relation to respiratory viral loads determined by cycle threshold values in reverse-transcription polymerase chain reaction (RT-PCR).
Materials and Methods: From October 2022 to November 2022, 74 hospitalized patients with Omicron were included in this retrospective study. The radiological features, CT involvement scores in relation to the respiratory viral load, and factors associated with imaging progression (IP) after the RT-PCR results turned negative were analyzed.
Results: The most common CT patterns of Omicron were multiple round-like or patchy ground-glass opacity (GGO) or mixed GGO in the peripheral or diffuse areas. The grading of CT involvement scores exhibited an inverse pattern compared to viral loads from day 1 to day 8 and from day 13 to day 20 after diagnosis. Among the 65 patients with complete imaging data, 45 (69.23%) showed IP with clinical warning indicators of disease exacerbation negative in 34 and positive in 11. Patients with IP were older than those with non-IP (NIP); the erythrocyte sedimentation rates, procalcitonin levels, and D-dimer levels on admission of patients with IP were significantly higher than those of patients with NIP, whereas the immunoglobulin (Ig) G antibody level on admission and CT involvement score on initial CT of patients with IP were significantly lower than those of patients with NIP (all P < 0.05).
Conclusion: For patients with Omicron, the IP of lung abnormalities is common when the viral load decreases. Under these circumstances, paying attention to clinical warming indicators of disease progression may contribute to better patient management and the mitigation of severe pneumonia.
Keywords: severe acute respiratory syndrome coronavirus-2, Omicron, pneumonia, computed tomography, viral load
Introduction
Since severe acute respiratory syndrome coronavirus-2 (SARS-CoV-2) was first reported in 2019, it has spread rapidly around the world via some common routes, such as aerosol transmission, and direct transmission.1 The pandemic posed a serious threat to human health, and many people suffered from post-COVID-19 syndrome.2 SARS-CoV-2 constantly evolves during replication, and many variants have appeared through the pandemic. Omicron, a SARS-CoV-2 variant that was first detected in South Africa’s Gauteng province in mid-November 2021, became the dominant SARS-CoV-2 strain (after the Delta variant) in most countries by 2022.3,4 This variant, which is characterized by multiple mutations, rapid spread, and the ability to infect people with naturally acquired or vaccine-induced immunity against previous variants, causes significant increments in infection rates.5–7
According to the current diagnostic criteria, reverse-transcription polymerase chain reaction (RT-PCR) has become a standard and routine assessment for the diagnosis of the SARS-CoV-2 infection. Different viral target genes have been used for the detection of SARS-CoV-2, including spike (S), nucleocapsid (N), RNA-dependent RNA polymerase (RdRp), open reading frame 1ab (ORF1ab), and envelope (E). Cycle threshold (Ct) values in RT-PCR have been used to determine the dynamics of the SARS-CoV-2 viral load by measuring the amplification required for the target viral gene to cross the threshold and are inversely related to the viral load.8
Chest computed tomography (CT) plays a key role in the diagnosis and management of hospitalized patients with SARS-CoV-2 infection. Multiple studies have indicated a correlation between disease severity and the degree of parenchymal involvement on CT scans.9–12 Several semiquantitative CT scores have been developed to evaluate the extent of pulmonary involvement and objectively monitor the disease course.9–12 In our clinical practice, we found that many patients infected with Omicron demonstrated imaging progression (IP) even after their RT-PCR results had become negative for SARS-CoV-2. In particular, a few patients progressed to severe disease because of inadequate attention to symptom aggravation. However, this topic is poorly reported.
Therefore, we aimed to investigate the chest CT findings of the SARS-CoV-2 Omicron variant infection in relation to respiratory viral loads determined by Ct values in RT-PCR.
Materials and Methods
Patients
This study was conducted according to the principles of the Declaration of Helsinki and posed no risks to patients. It was approved by the Ethics Committee of Chongqing University Three Gorges Hospital, and informed consent was obtained from all individual participants included in the study. We included all consecutive patients with SARS-CoV-2 infection admitted to a large referral center in Chongqing, China, from October 2022 to November 2022, when the Omicron variant was predominant in this city. Our inclusion criteria were as follows: 1) positive RT-PCR results for SARS-CoV-2 from respiratory samples (pharyngeal swab) on admission; 2) sequential RT-PCR tests for SARS-CoV-2 nucleic acid once every 1–3 days during hospitalization; 3) two or more available CT scans, with at least one of them showing positive results for viral pneumonia; and 4) negative RT-PCR results for influenza virus pneumonia, prevalent in the current season, from respiratory samples. Exclusion criteria were as follows: 1) poor imaging quality due to obvious respiratory motion artifacts and 2) the presence of diffused lesions that would influence the evaluation of pneumonia on CT images.
CT Protocols
All chest CT examinations were performed on a uCT960+ scanner (United Imaging Healthcare). All patients underwent noncontrast-enhanced scanning in the supine position. The imaging parameters were as follows: tube voltage: 110–120 kVp; tube current: 50–250 mAs (automatic tube current modulation technology); and scanning slice thickness/interval: 5 mm/5 mm. All images were reconstructed with a section thickness and slice interval of 1 mm each for analysis.
CT Image Analysis
Axial images with a 1-mm slice thickness were interpreted by two radiologists with >10 years of experience with chest imaging. These radiologists were blinded to the related clinical data and used workstations and multiplanar reconstruction images to aid their analysis. Any disagreement was resolved via discussions to reach a consensus. The lung and mediastinal windows were set as follows: window width: 1600 HU, window level: −600 HU and window width: 400 HU, window level: 40 HU, respectively. For patients with SARS-CoV-2 infection, the following data were carefully analyzed: lobar involvement (single lobe/unilateral multiple lobes/bilateral multiple lobes), distribution (peripheral/central/both central and peripheral), density (GGO/mixed GGO [GGO mixed with consolidation]/consolidation) and shapes of lung opacities (round-like/patchy/linear), and other findings (crazy-paving pattern/vascular enlargement pattern/bronchodilation/interlobular septal thickening/tree-in-bud pattern/pleural effusion/thoracic lymphadenopathy). A semiquantitative scoring method was designed to assess the degree of involvement of each lung lobe:9 score 0, no involvement; score 1, less than 5% involvement; score 2, 5% to less than 25% involvement; score 3, 25% to less than 50% involvement; score 4, 50% to less than 75% involvement; and score 5, at least 75% involvement. The total involvement score was obtained by summing the individual scores of five lung lobes, which ranged from 0 to 25 points. According to CT involvement scores, the degree of lung involvement was divided into four grades: grade I (low degree: scores ≤ 5), grade II (mild degree: 5 < scores ≤ 10), grade III (moderate degree: 10 < scores ≤ 15), or grade IV (severe degree: 15 < scores ≤ 25). IP was defined as an increase in the total involvement score of follow-up CT relative to the previous score.
RT-PCR and Variant Status
Virological tests for SARS-CoV-2 RNA detection were performed via pharyngeal sampling using swabs. A single sample was obtained per patient. Viral RNA was extracted using the SARS-CoV-2 nucleic acid detection kit (BioGerm, Shanghai, China and Medeasy, Wuhan, China). The ORF1ab and N genes were simultaneously amplified and tested using RT-PCR. A positive result was observed when both targets showed positive amplification (Ct value < 40), whereas a negative result was observed when both targets showed negative amplification (Ct value ≥ 40). Based on the Ct values of both N and ORF1ab genes, the viral load was classified into four grades: grade I (low viral load: CT values > 35), grade II (mild viral load: 30 < CT values ≤ 35), grade III (moderate viral load: 25 < CT values ≤ 30), or grade IV (high viral load: CT values ≤ 25).
Clinical Classification for Disease Severity
Disease severity was divided into four categories according to the Guidelines for the Diagnosis and Treatment of SARS-CoV-2 issued by the National Health Commission (7th edition; China):13 1) mild type: mild clinical symptoms without pneumonia on CT imaging; 2) moderate type: fever and respiratory infection symptoms, among others (note: a miniscule number of patients may be asymptomatic) with pneumonia on CT imaging; 3) severe type: a. respiratory distress with a respiratory rate ≥30/min, b. oxygen saturation ≤93% in a resting state, c. arterial partial pressure of oxygen/oxygen concentration ≤300 mmHg (1 mmHg = 0.133 kPa), and/or d. patients with >50% lesion progression within 48 hours in lung imaging; and 4) critical type: a. respiratory failure requiring mechanical ventilation, b. shock, and/or c. the patient required intensive care unit monitoring and treatment because of other organ failure.
Clinical Warning Indicators of Severe-Critical Type
The disease might worsen from mild-moderate type to severe-critical type when patients met any of the following criteria:13 1) peripheral blood lymphocytes progressively decreased; 2) peripheral inflammatory factors such as interleukin-6 and C-reactive protein progressively increased; 3) lactic acid progressively increased; and 4) clinical symptoms such as fever and respiratory tract symptoms progressively aggravated.
Statistical Analysis
Statistical analyses were performed using IBM SPSS Statistics for Windows (version 19.0; IBM Corp., Armonk, NY). Quantitative data were expressed as medians (25 and 75% quartiles). The two independent-samples Student’s t-test or the Mann–Whitney U-test was used to determine differences in variables between groups. Categorical data were expressed as counts and percentages, and the Chi-square test was used to determine differences in these variables between groups. A two-tailed P < 0.05 indicated statistical significance.
Results
Demographics and Clinical Characteristics of Patients
After excluding 3 patients with poor imaging and 8 patients with diffused lesions, 74 patients (median age, 54 [49, 62]; range, 23–92 years) infected with SARS-CoV-2 were included in this study. Figure 1 shows the flowchart of the patient inclusion process. The demographics and clinical characteristics of our study participants are summarized in Table 1. Forty-nine (66.22%) patients were women and 25 (33.78%) were men. Sixty-seven (90.54%) patients had clinical symptoms and seven patients (9.46%) were asymptomatic during hospitalization. Thirty-one (41.89%) patients had comorbidities, whereas 43 (58.11%) did not have them. For laboratory test results, the most common abnormalities included decreased lymphocyte counts as well as elevated interleukin-6 levels, highly sensitive C-reactive protein levels, erythrocyte sedimentation rates, procalcitonin levels, and immunoglobulin (Ig) G and Ig M antibody titers. In our cohort, 72 (97.30%) patients were vaccinated and only 2 (2.70%) were unvaccinated. The infection duration at the time of the initial CT scan was 1.00 (1.00, 2.00) days, ranging from one day to 13 days. For the clinical classification for disease severity on initial CT, 59 (79.73%) patients were divided into mild type, 10 (13.51%) were moderate type, three (4.05%) were severe type, and two (2.70%) were critical type.
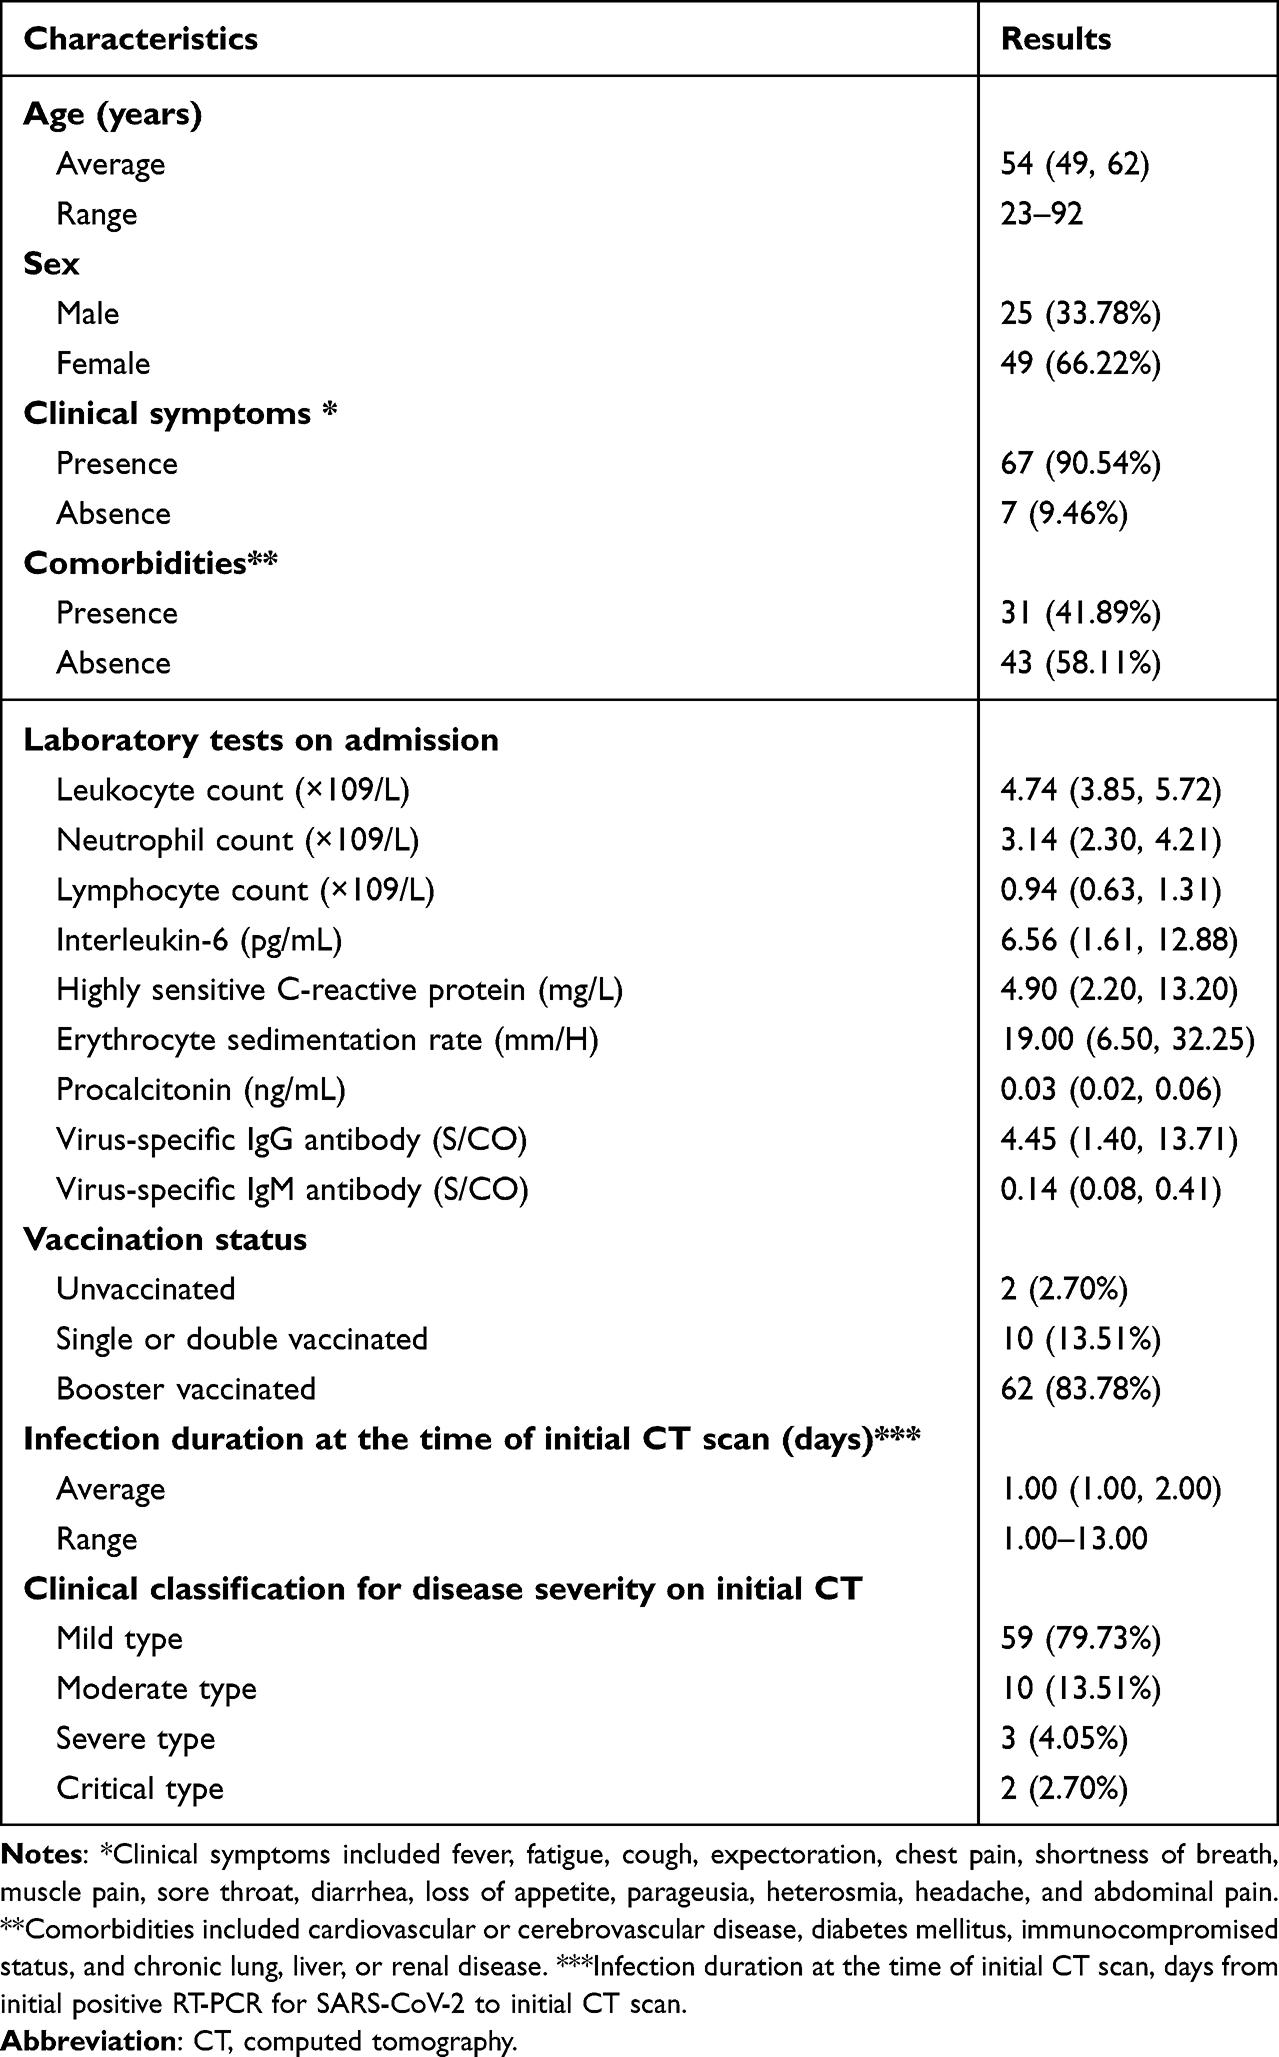 |
Table 1 Demographics and Clinical Characteristics of the Patients Infected with Omicron |
 |
Figure 1 Flowchart of the patient inclusion process. |
Chest CT Findings with Lung Abnormalities Upon Initial Presentation
Of all 74 patients, the CT findings with high suspicion of SARS-CoV-2 pneumonia upon initial presentation are shown in Table 2. The most frequent CT patterns were round-like or patchy ground-glass opacity (GGO) or mixed GGO in the peripheral or diffuse areas of both lungs, usually accompanied by vascular enlargement patterns, crazy-paving patterns, and interlobular septal thickening (Figure 2). Seven (9.46%) patients were asymptomatic during hospitalization but displayed abnormal chest CT results, revealing multifocal GGO or mixed GGO, which resolved rapidly during follow-up CT.
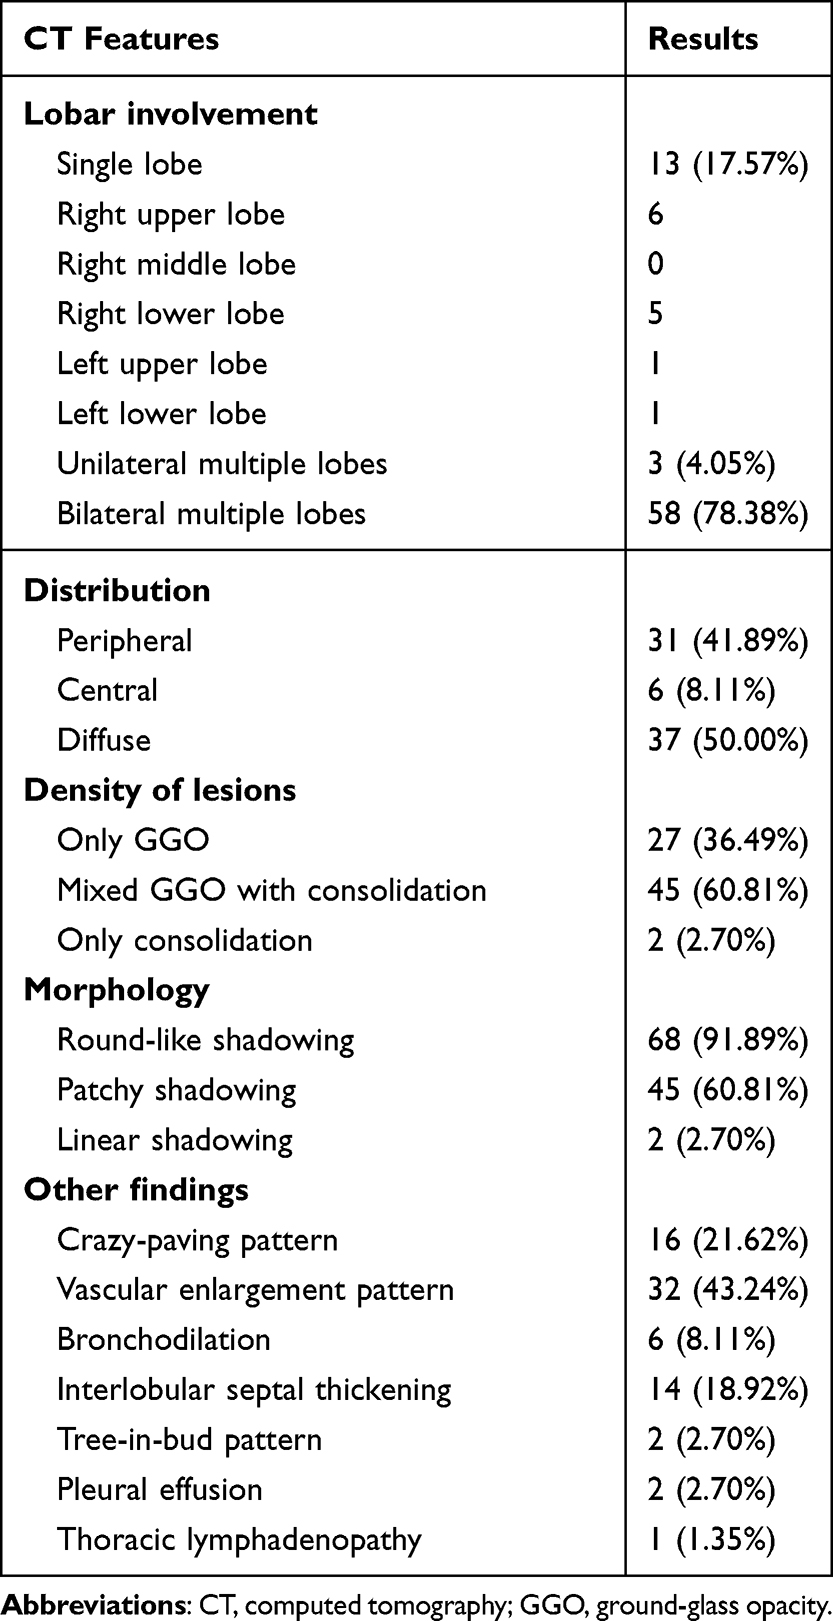 |
Table 2 CT Findings of Omicron Pneumonia at Initial Present |
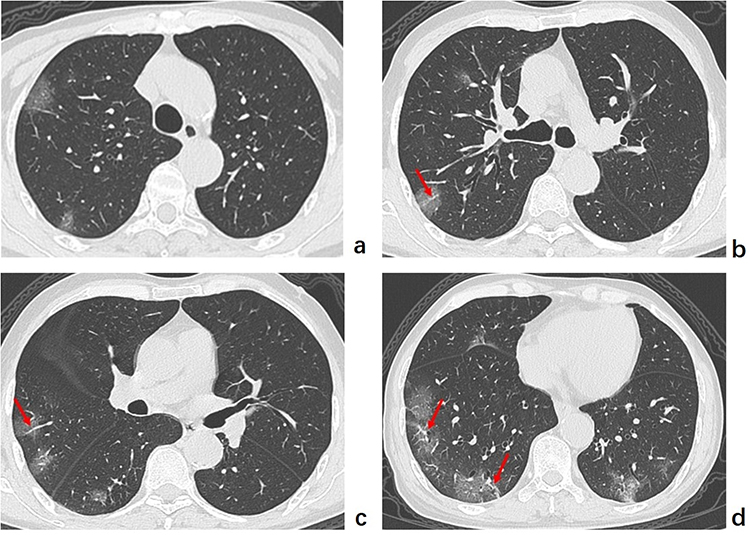 |
Figure 2 Typical chest computed tomography manifestations of a 67-year-old man infected with the Omicron variant. (a–d) Axial computed tomography images show round-like and patchy ground-glass opacity in the peripheral areas of both lungs accompanied by vascular enlargement patterns (red arrow). |
CT Involvement Scores in Relation to Respiratory Viral Loads
Out of 74 patients, 18 underwent two CT scans, 39 underwent three CT scans, 12 underwent four CT scans, and 5 underwent five CT scans to monitor their condition. In total, 226 CT examinations were performed at an interval of 3–14 days. For all CT scans, the median CT involvement score of both lungs was 3.00 (0.00, 6.00) (range: 0.00–20.00); the median scores in the right upper, right middle, right lower, left upper, and left lower lobes were 0.00 (0.00, 2.00), 0.00 (0.00, 1.00), 1.00 (0.00, 2.00), 0.00 (0.00, 1.00), 1.00 (0.00, 2.00), respectively. For the grading of lung involvement degrees, the number of CT scans in grades I, II, III, and IV were 166, 49, 6, and 5, respectively. In total, 684 RT-PCR tests for all patients were performed at an interval of 1–3 days. All patients had positive RT-PCR results for SARS-CoV-2 on admission. For the grading of N gene Ct values (ranging from 13.69 to ≥40), the number of RT-PCR tests in grades I, II, III, and IV was 246, 171, 156, and 111, respectively. For the grading of ORF1ab gene Ct values (ranging from 13.82 to ≥40), the number of RT-PCR tests in grades I, II, III, and IV was 272, 177, 137, and 98, respectively. The dynamics of the grading of CT involvement scores and respiratory viral loads according to the time from diagnosis (ie, the initial positive result of RT-PCR) (0–20 days) are shown in Figure 3. The grading of lung involvement degrees on CT exhibited a reversed tendency compared with that of viral loads from the 1st day to the 8th day and from the 13th day to the 20th day, respectively.
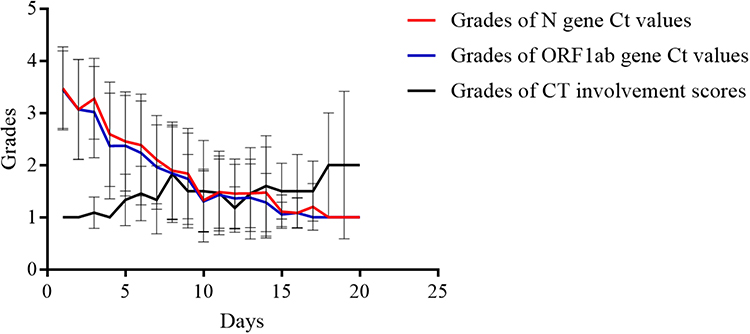 |
Figure 3 Dynamics of the grades of computed tomography involvement scores and respiratory viral loads according to the time from the initial positive reverse-transcription polymerase chain reaction. From the 1st to the 8th day, the grade of the viral load decreases gradually, whereas the grade of the computed tomography involvement scores increases. From the 8th to 13th day, the grade of the computed tomography involvement scores and respiratory viral loads are maintained at similar levels. From the 13th to 20th day, the grade of the computed tomography involvement scores increases continuously, whereas that of the viral loads declines to a low level. |
Associated Factors with IP After RT-PCR Results Negative for SARS-CoV-2
Sixty-five of our study participants underwent multiple CT scans on admission and after obtaining two consecutive negative RT-PCR results, with an interval of >24 hours. The average interval from initial positive RT-PCR results to the time of two consecutive negative results at an interval of >24 hours was 11 days (range: 5–18 days). Among the 65 patients, 20 (30.77%) showed imaging absorption or stabilization after the negative RT-PCR results for SARS-CoV-2, whereas 45 (69.23%) showed IP (Figure 4). Of the 45 patients with IP, 11 had positive clinical warning indicators of severe-critical type and 3 of the 11 patients with IP transformed from mild-moderate type to severe-critical type on the 10th, 14th, and 15th days, respectively, after their diagnosis, despite their PT-PCR results being negative (Figure 4). Meanwhile, significant increments in virus-specific immunoglobulin (Ig) G levels (76.03, 111.14, and 240.43[S/CO], respectively) in the three patients were observed after disease aggravation. After corticosteroids and immunoglobulin therapy, their condition improved and they were subsequently discharged from the hospital.
 |
Figure 4 Sequential chest computed tomographic images of an 87-year-old woman infected with the Omicron variant. (a–c) Initial computed tomography images show a few peripheral ground-glass opacities (GGOs) and linear shadows in both lungs on the 2nd day after diagnosis. (d–f) Twelve days later when the reverse-transcription polymerase chain reaction results became negative, the follow-up computed tomography images revealed imaging progress with bilateral multi-patchy GGO displaying crazy-paving patterns, intralobular lines, vascular enlargement patterns, and pleural effusion. (g–i) After another seven days, follow-up computed tomography images demonstrated an obvious absorption of lung abnormalities after corticosteroids and immunoglobulin therapy. |
As shown in Table 3, patients in the IP group were older than those in the non-IP (NIP) group (P < 0.05). The erythrocyte sedimentation rate, procalcitonin level, and D-dimer level of the patients in the IP group were significantly higher than those of the patients in the NIP group, whereas the IgG antibody levels and CT involvement scores on initial CT in the IP group were significantly lower than those in the NIP group (all P < 0.05).
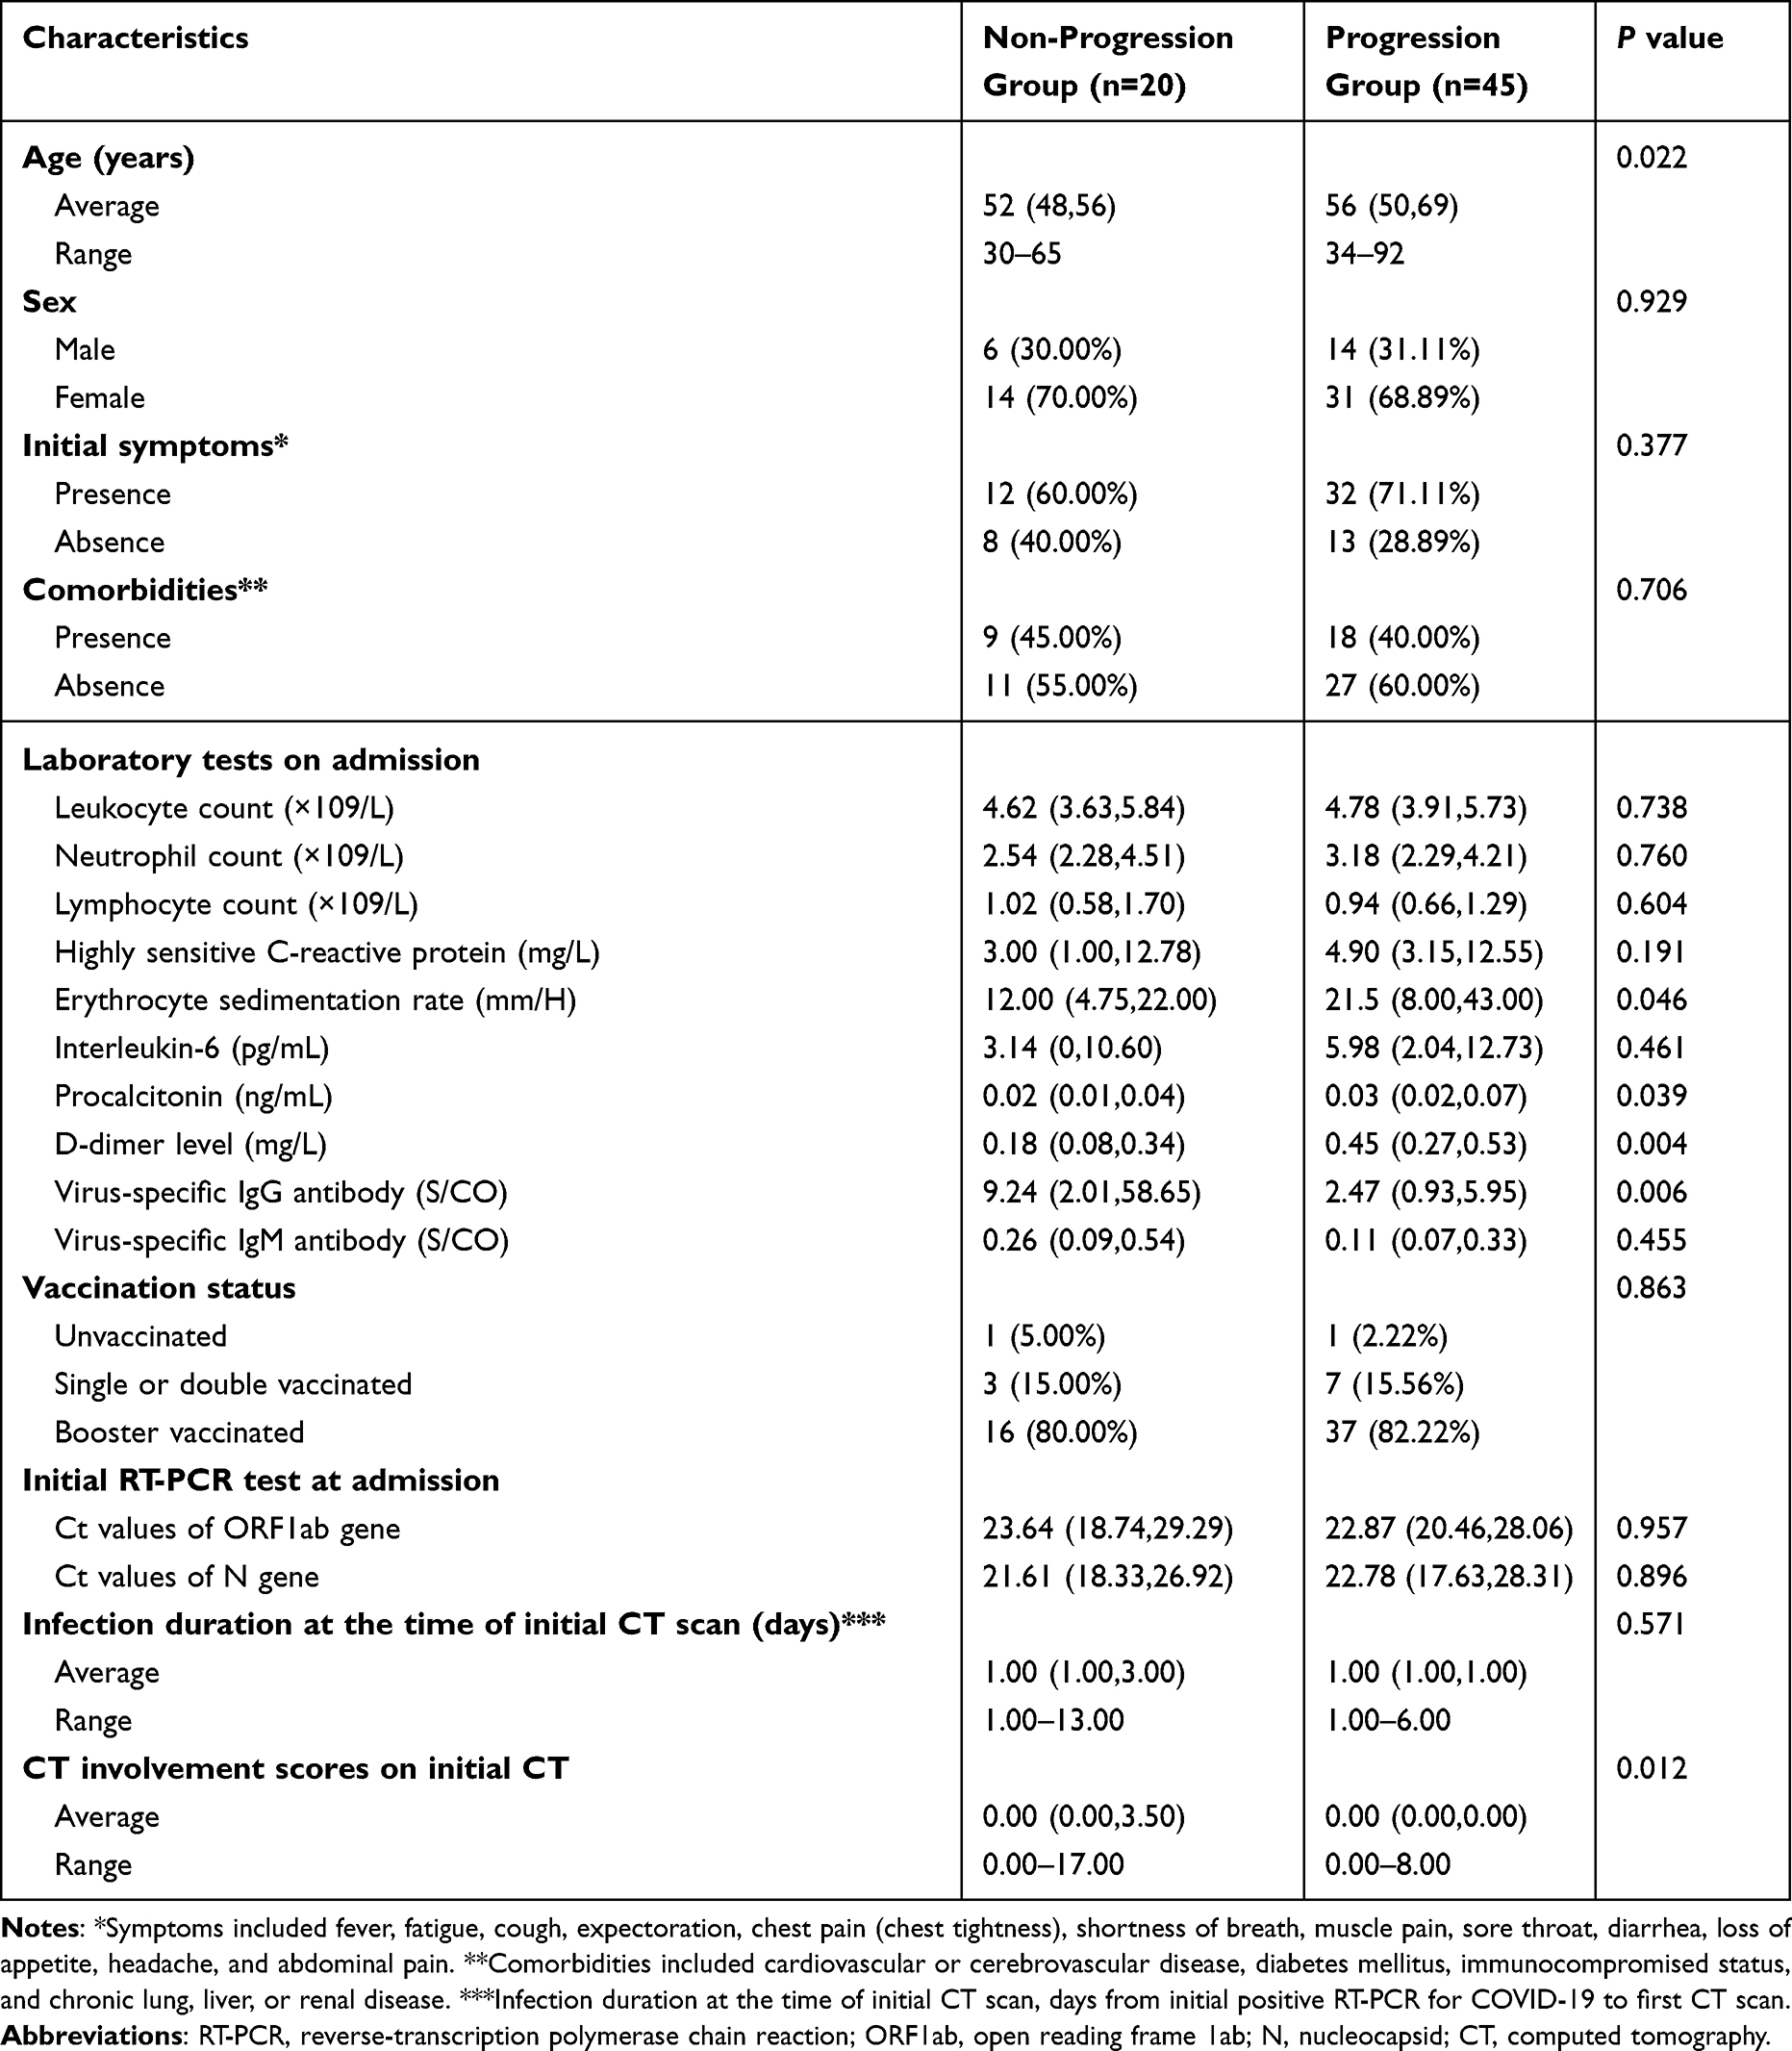 |
Table 3 Factors Related to Imaging Progression at Minimal Viral Load Condition |
Discussion
During the last few months of 2022, when the Omicron variant was predominant in our country, frequent PCR and CT examinations were routinely performed to closely assess the changes in the condition of the patients after short-term treatment in most referral centers. In the current study, we retrospectively observed a group of 74 hospitalized patients with laboratory-confirmed SARS-CoV-2 pneumonia during the Omicron pandemic and analyzed the radiological changes, the lung involvement degree on CT in relation to the respiratory viral load, and factors associated with IP after the viral load decreased to a low level.
In terms of CT features, this study revealed that the most common CT manifestations were round-like/patchy GGO or mixed GGO involving the peripheral or diffuse regions of both lungs. These manifestations were usually accompanied by vascular enlargement patterns, crazy-paving patterns, and interlobular septal thickening. These results are similar to those of some previous reports.14,15 An interesting observation was that asymptomatic patients could also present with pneumonia on CT, and lung severity was generally mild. Our results showed that patients with Omicron infection had a low median CT involvement score, with the lower lobes predominantly involved; this finding is consistent with the reduced severity of Omicron, probably due to its lower replication competence in human lungs.7,16,17
This study found that the grading of CT involvement scores and viral loads exhibited opposite trends from the 1st day to the 8th day and from the 13th day to the 20th day after diagnosis, while both were maintained at similar grades from the 8th day to the 13th day. After SARS-CoV-2 infection, a series of immune changes against viruses are induced, including innate immune responses, T- and B-cell immunity, and antiviral-neutralizing antibody responses.18,19 Some previous studies have shown an increase in virus-specific IgM and IgA in the acute phase (usually within the first week after symptom onset), followed by an increase in virus-specific IgG titers at later phases (about two weeks following symptoms) in the course of the SARS-CoV-2 infection.20,21 We speculated that the direct damage caused by viral invasion plays a key role in lung injury and elevated CT scores at the early stage, particularly when the viral load is high. As the virus-specific IgM is developed against the virus, a gradual decline in viral load occurs, resulting in similar grades to CT scores. Later, with the increase in virus-specific IgG levels, the viral load decreases further or becomes negative, but the CT scores continuously increased during this period. For patients with IP under conditions of low viral load, our results showed that most patients were absent of clinical warning indication of severe and critical cases. This finding might be related to a slow absorption rate of pneumonia caused by Omicron or a longer duration of follow-up CTs, thereby suggesting that the imaging changes were not carefully evaluated. Therefore, IP with negative clinical warning indicators might not be associated with an exacerbation of patients’ condition. Furthermore, a few patients with clinical warning indicators positive at low viral loads were also observed in this study. We hypothesize that such aggravation might stem from an immune-mediated lung injury due to immune dysregulation.18,22,23 Notably, the conditions of three patients in our cohort progressed to severe disease with remarkable increments in virus-specific IgG titers when their PT-PCR results turned negative. Fortunately, their conditions improved after timely immune regulation therapy. Therefore, although the nucleic acid test results could be negative, it is also important for the affected individuals to pay attention to these warning indicators of disease progression. For example, if the symptoms are aggravated or new symptoms occur (eg, persistent cough, shortness of breath, and fever), follow-up CTs might be necessary. For patients with IP, immunotherapeutic strategies targeting dysfunctional immune responses should be considered to prevent the development of severe disease.24–27 Moreover, some complications such as lung embolism or secondary infection may be alternative explanations for the clinical worsening under low viral load.
Furthermore, this study indicated that patients with IP who tested negative in nucleic acid test were older than those without IP. This suggests that age is a risk factor for progression in imaging. Some laboratory parameters, including higher erythrocyte sedimentation rates, procalcitonin levels, and D-dimer levels as well as lower virus-specific IgG titers on admission, were noted in patients with IP, which is similar to the findings of some studies.28,29 As a result, abnormalities in the aforementioned indicators were suggested as predictive biomarkers for potential disease progression; thus, such abnormalities should alert physicians to identify patients with exacerbations in a timely manner. In addition, the present study found that patients in the IP group had lower CT involvement scores on initial CT than those in the NIP group, indicating that patients with less lung involvement on admission may tend to exhibit IP at a later stage and that imaging monitoring should be performed for patients with worse clinical symptoms.
This study has several limitations. First, this study only evaluated the lung involvement degrees in relation to respiratory viral loads of Omicron due to insufficient data on other SARS-Cov-2 variants. We wonder if the finding that IP under low respiratory viral load is specific to Omicron; therefore, we are planning to compare this characteristic between Omicron variants and non-Omicron variants. Second, the present study lacked pathological evidence for possible immune-mediated lung diseases after exacerbation with a low viral load. Third, some clinical indicators such as oxygen saturation, treatment methods and complications of patients were not evaluated in this study due to the absence of complete data. Future studies are needed to substantiate our findings.
Overall, for patients with the Omicron variant, the IP of lung abnormalities is frequently observed when the viral load declines to a low level. Under these circumstances, focusing on clinical warning indicators of disease exacerbation may enhance the management of infected patients and mitigate severe pneumonia.
Abbreviations
Ct, cycle threshold; E, envelope; GGO, ground-glass opacity; Ig, immunoglobulin; IP, imaging progression; N, nucleocapsid; ORF1ab, open reading frame 1ab; RdRp, RNA-dependent RNA polymerase; RT-PCR, reverse-transcription polymerase chain reaction; S, pike; SARS-CoV-2, severe acute respiratory syndrome coronavirus-2.
Data Sharing Statement
Data supporting the results reported in the manuscript can be found by contacting the correspondence author with email ([email protected]).
Ethics Approval and Informed Consent
Chongqing University Three Gorges Hospital’s institutional review board approved this study, and informed consent was obtained from all individual participants included in the study. This retrospective study complies with the Declaration of Helsinki and abides by the principle of confidentiality, ensuring non-disclosure of patient information.
Consent for Publication
The details of any images, recordings, and figures can be published, and the persons providing consent have been shown the article contents to be published.
Funding
This study was supported by Chongqing medical scientific research project (Joint project of Chongqing Health Commission and Science and Technology Bureau) (2022MSXM147) and Chongqing Health Commission (Chongqing Talent Program-Innovation leading Talent Research Project) (CQYC20210303348) of China.
Disclosure
The authors report no conflicts of interest in this work.
References
1. Umakanthan S, Sahu P, Ranade AV, et al. Origin, transmission, diagnosis and management of coronavirus disease 2019 (COVID-19). Postgrad Med J. 2020;96(1142):753–758. doi:10.1136/postgradmedj-2020-138234
2. Umakanthan S, Monice M, Mehboob S, Jones CL, Lawrence S. Post-acute (long) COVID-19 quality of life: validation of the German version of (PAC19QoL) instrument. Front Public Health. 2023;11:1163360. doi:10.3389/fpubh.2023.1163360
3. Thakur V, Ratho RK. OMICRON (B.1.1.529): a new SARS-CoV-2 variant of concern mounting worldwide fear. J Med Virol. 2022;94(5):1821–1824. doi:10.1002/jmv.27541
4. Nori W, Ghani Zghair MA. Omicron targets upper airways in pediatrics, elderly and unvaccinated population. World J Clin Cases. 2022;10(32):12062–12065. doi:10.12998/wjcc.v10.i32.12062
5. Gao Y, Cai C, Grifoni A, et al. Ancestral SARS-CoV-2-specific T cells cross-recognize the Omicron variant. Nat Med. 2022;28(3):472–476. doi:10.1038/s41591-022-01700-x
6. Kuhlmann C, Mayer CK, Claassen M, et al. Breakthrough infections with SARS-CoV-2 omicron despite mRNA vaccine booster dose. Lancet. 2022;399(10325):625–626. doi:10.1016/S0140-6736(22)00090-3
7. Hui KP, Ho JC, Cheung MC, et al. SARS-CoV-2 Omicron variant replication in human bronchus and lung ex vivo. Nature. 2022;603(7902):715–720. doi:10.1038/s41586-022-04479-6
8. Aranha C, Patel V, Bhor V, Gogoi D. Cycle threshold values in RT-PCR to determine dynamics of SARS-CoV-2 viral load: an approach to reduce the isolation period for COVID-19 patients. J Med Virol. 2021;93(12):6794–6797. doi:10.1002/jmv.27206
9. Pan F, Ye T, Sun P, et al. Time course of lung changes at chest CT during recovery from coronavirus disease 2019 (COVID-19). Radiology. 2020;295(3):715–721. doi:10.1148/radiol.2020200370
10. Pan Y, Guan H, Zhou S, et al. Initial CT findings and temporal changes in patients with the novel coronavirus pneumonia (2019-nCoV): a study of 63 patients in Wuhan, China. Eur Radiol. 2020;30(6):3306–3309. doi:10.1007/s00330-020-06731-x
11. Zhou Z, Guo D, Li C, et al. Coronavirus disease 2019: initial chest CT findings. Eur Radiol. 2020;30(8):4398–4406. doi:10.1007/s00330-020-06816-7
12. Yang R, Li X, Liu H, et al. Chest CT severity score: an imaging tool for assessing severe COVID-19. Radiol Cardiothorac Imaging. 2020;2(2):e200047. doi:10.1148/ryct.2020200047
13. Xu Y, Chen Y, Tang X. Guidelines for the diagnosis and treatment of coronavirus disease 2019 (COVID-19) in China. Glob Health Med. 2020;2(2):66–72. doi:10.35772/ghm.2020.01015
14. Yoon SH, Lee JH, Kim BN. Chest CT findings in hospitalized patients with SARS-CoV-2: Delta versus Omicron variants. Radiology. 2023;306(1):252–260. doi:10.1148/radiol.220676
15. Tsakok MT, Watson RA, Saujani SJ, et al. Reduction in chest CT severity and improved hospital outcomes in SARS-CoV-2 Omicron compared with Delta variant infection. Radiology. 2023;306(1):261–269. doi:10.1148/radiol.220533
16. Sievers C, Zacher B, Ullrich A, et al. SARS-CoV-2 Omicron variants BA.1 and BA.2 both show similarly reduced disease severity of COVID-19 compared to Delta, Germany, 2021 to 2022. Euro Surveill. 2022;27(22):2200396. doi:10.2807/1560-7917.ES.2022.27.22.2200396
17. Wolter N, Jassat W, Walaza S, et al. Early assessment of the clinical severity of the SARS-CoV-2 omicron variant in South Africa: a data linkage study. Lancet. 2022;399(10323):437–446. doi:10.1016/S0140-6736(22)00017-4
18. Azkur AK, Akdis M, Azkur D, et al. Immune response to SARS-CoV-2 and mechanisms of immunopathological changes in COVID-19. Allergy. 2020;75(7):1564–1581. doi:10.1111/all.14364
19. Paces J, Strizova Z, Smrz D, Cerny J. COVID-19 and the immune system. Physiol Res. 2020;69(3):379–388. doi:10.33549/physiolres.934492
20. Guo L, Ren L, Yang S, et al. Profiling early humoral response to diagnose novel coronavirus disease (COVID-19). Clin Infect Dis. 2020;71(15):778–785. doi:10.1093/cid/ciaa310
21. Long QX, Liu BZ, Deng HJ, et al. Antibody responses to SARS-CoV-2 in patients with COVID-19. Nat Med. 2020;26(6):845–848. doi:10.1038/s41591-020-0897-1
22. Luo XH, Zhu Y, Mao J, Du RC. T cell immunobiology and cytokine storm of COVID-19. Scand J Immunol. 2021;93(3):e12989. doi:10.1111/sji.12989
23. Hu B, Huang S, Yin L. The cytokine storm and COVID-19. J Med Virol. 2021;93(1):250–256. doi:10.1002/jmv.26232
24. Yang L, Liu S, Liu J, et al. COVID-19: immunopathogenesis and immunotherapeutics. Signal Transduct Target Ther. 2020;5(1):128. doi:10.1038/s41392-020-00243-2
25. Strohl WR, Ku Z, An Z, Carroll SF, Keyt BA, Strohl LM. Passive immunotherapy against SARS-CoV-2: from plasma-based therapy to single potent antibodies in the race to stay ahead of the variants. BioDrugs. 2022;36(3):231–323. doi:10.1007/s40259-022-00529-7
26. Cheng ZJ, Li B, Zhan Z, et al. Clinical application of antibody immunity against SARS-CoV-2: comprehensive review on immunoassay and immunotherapy. Clin Rev Allergy Immunol. 2023;64(1):17–32. doi:10.1007/s12016-021-08912-y
27. Monzavi SM, Naderi M, Ahmadbeigi N, Kajbafzadeh AM, Muhammadnejad S. An outlook on antigen-specific adoptive immunotherapy for viral infections with a focus on COVID-19. Cell Immunol. 2021;367:104398. doi:10.1016/j.cellimm.2021.104398
28. Elshazli RM, Toraih EA, Elgaml A, et al. Diagnostic and prognostic value of hematological and immunological markers in COVID-19 infection: a meta-analysis of 6320 patients. PLoS One. 2020;15(8):e0238160. doi:10.1371/journal.pone.0238160
29. Ghahramani S, Tabrizi R, Lankarani KB, et al. Laboratory features of severe vs. non-severe COVID-19 patients in Asian populations: a systematic review and meta-analysis. Eur J Med Res. 2020;25(1):30. doi:10.1186/s40001-020-00432-3
 © 2023 The Author(s). This work is published and licensed by Dove Medical Press Limited. The
full terms of this license are available at https://www.dovepress.com/terms
and incorporate the Creative Commons Attribution
- Non Commercial (unported, 3.0) License.
By accessing the work you hereby accept the Terms. Non-commercial uses of the work are permitted
without any further permission from Dove Medical Press Limited, provided the work is properly
attributed. For permission for commercial use of this work, please see paragraphs 4.2 and 5 of our Terms.
© 2023 The Author(s). This work is published and licensed by Dove Medical Press Limited. The
full terms of this license are available at https://www.dovepress.com/terms
and incorporate the Creative Commons Attribution
- Non Commercial (unported, 3.0) License.
By accessing the work you hereby accept the Terms. Non-commercial uses of the work are permitted
without any further permission from Dove Medical Press Limited, provided the work is properly
attributed. For permission for commercial use of this work, please see paragraphs 4.2 and 5 of our Terms.
Recommended articles
Old Age is an Independent Risk Factor for Pneumonia Development in Patients with SARS-CoV-2 Omicron Variant Infection and a History of Inactivated Vaccine Injection
Tong X, Huang Z, Zhang X, Si G, Lu H, Zhang W, Xue Y, Xie W
Infection and Drug Resistance 2022, 15:5567-5573
Published Date: 21 September 2022
Risk Factors for Radiological Progression Within Admissive One Week in the Hospitalized COVID-19 Omicron Variant-Infected Patients
Zhu FF, Gu BB, Jin YJ, Yao L, Zhou L, Zou D, Ding J, Zhou T, Shen XH, Chen C
Infection and Drug Resistance 2022, 15:7127-7137
Published Date: 6 December 2022
Value of Laboratory Indicators in Predicting Pneumonia in Symptomatic COVID-19 Patients Infected with the SARS-CoV-2 Omicron Variant
Zhu K, Ma S, Chen H, Xie J, Huang D, Fu C, Ma G, Huang Y
Infection and Drug Resistance 2023, 16:1159-1170
Published Date: 28 February 2023
A Nomogram for Predicting Survival in Patients with SARS-CoV-2 Omicron Variant Pneumonia Based on Admission Data
Yang Y, Li D, Nie J, Wang J, Huang H, Hang X
Infection and Drug Resistance 2025, 18:2093-2104
Published Date: 25 April 2025
Assessing Invasiveness of Ground-Glass Nodules Using Ternary-Class CT Radiomics Models: A Multi-Center Study with SHAP Explanations
Zhao P, Chen H, Gu H, Lin Y, Ma Y
Cancer Management and Research 2026, 18:602730
Published Date: 5 June 2026