Back to Journals » Journal of Pain Research » Volume 14
Imaging Analysis of the High-Intensity Zone on Lumbar Spine Magnetic Resonance Images: Classification, Features and Correlation with Low Back Pain
Received 3 August 2021
Accepted for publication 10 September 2021
Published 21 September 2021 Volume 2021:14 Pages 2981—2989
DOI https://doi.org/10.2147/JPR.S332509
Checked for plagiarism Yes
Review by Single anonymous peer review
Peer reviewer comments 2
Editor who approved publication: Professor Michael Überall
Zi-Xuan Wang,1 You-Gu Hu2
1Department of Interventional Radiology, Qingdao Municipal Hospital, Qingdao, People’s Republic of China; 2Department of Spinal Surgery, Affiliated Hospital of Qingdao University, Qingdao, People’s Republic of China
Correspondence: Zi-Xuan Wang
Department of Interventional Radiology, Qingdao Municipal Hospital, 1 Jiao-Zhou Road, Qingdao, Shandong, 266000, People’s Republic of China
Tel/Fax +86 532 82827158
Email [email protected]
Aim: Early studies suggested that the high-intensity zone (HIZ) on lumbar MRI was a diagnostic sign of painful internal disc disruption (IDD). However, recent studies have questioned its diagnostic value. This study is conducted to explore imaging features of HIZ and to investigate the correlation between these characteristics and low back pain (LBP), further studying the predictive value of HIZ.
Methods: A retrospective study of 1188 cases was performed. MR images were read and analyzed by two experienced, blinded radiologists.
Results: A total of 575 (48.4%) individuals exhibited HIZ. The prevalence of posterior HIZ (32.3%) was significantly higher than that of anterior HIZ (23.6%; P < 0.01). Round type was the most common shape (61.0%) on sagittal view. Only 37 HIZs (4.6%) were identified on axial views. A total of 263 HIZ discs (32.5%) were found to have additional diagnostic signs of IDD, which is difficult to distinguish from the annulus fibrosus. In subjects with consecutive slides showing HIZ, the incidence of LBP was significantly higher than in single-slide HIZ individuals (58.0% vs 48.6%, P < 0.05).
Conclusion: MRI-visualized HIZ is a highly valuable method of screening for lumbar IDD. It is demonstrated that consecutive-slide HIZ was a more reliable indicator for discogenic LBP than single-slide HIZ.
Keywords: lumbar spine, intervertebral disc, MRI, high-intensity zone, low back pain
Graphical Abstract:

Introduction
Direct videoendoscopic visualization is the only surgical method that directly shows internal disc disruption (IDD) structural changes. Computed tomography/discography (CTD), including morphologic assessment and a pain provocation test, is recognized as the best imaging modality to directly determine the presence of IDD and discogenic low back pain (LBP).1–3 According to prior studies, the role of CTD is crucial in diagnosing painful discs and improves interpretation of case-specific diagnostic value of other methods, eg, high-intensity zone (HIZ) change, as a gold standard.3,4 However, discography is an invasive procedure, and accidental puncture of discs can lead to premature or hastened degeneration.5 Therefore, a noninvasive method to reliably diagnose discogenic LBP would be of enormous clinical value.
HIZ is a sign on lumbar spine T2-weighted magnetic resonance (MR) images and was found a diagnostic sign of painful IDD with a positive predictive value of 86%.6,7 Prior work has reported that the HIZ changes along the endplate margin in the region of Sharpey’s fibers, enhanced on injection of gadolinium-DTPA, indicate inflammation and neovascularization.8 In the past few decades, there has been considerable debate over the predictive value of HIZ on lumbar MR images for LBP.4,9–14 However, increasing evidence suggests that HIZ, the classical sign described by Aprill and Bogduk,6 indicates a part of the natural history of disc degeneration,14,15 but is not a reliable indicator of symptomatic IDD.4,10,11,14 In practice, HIZ signs appear in various forms and can be characterized utilizing spatial location and analysis with lumbar MR imaging sequences.16,17 Generally, the diagnostic utility of HIZ imaging results is still a matter of question. A deep understanding of the cellular pathogenesis underlying these features is of critical necessity for understanding and implementing HIZ-related clinical decision-making frameworks.
In order to explore imaging features of HIZ found in lumbar MR images and investigate the correlation between these characteristics and LBP symptoms, we retrospectively reviewed lumbar MR images from 5940 discs in 1188 cases alongside their corresponding medical records.
Materials and Methods
Study Subjects
Among them, 511 subjects with LBP and 677 without were diagnosed by orthopedic surgeons with a standard clinical evaluation including physical examination and MR imaging, etc. LBP, in this study, was defined as low back pain with or without referred pain in the lower limb, which persisted for at least 6 weeks.18 Criteria for exclusion in this study were as follows: (1) medical records were incomplete; (2) the MR image quality was poor; (3) the structure of spine was disordered; (4) evidence of the presence of diseases, such as infection, trauma, spondylolisthesis, lumbar spinal stenosis syndrome, tumor, metabolic bone disease. If there were two or more records of one patient, the most recent record was included in this study.
MR Imaging
All lumbar MR imaging examinations were performed with a spinal surface coil using a 1.5 Tesla superconducting MR system (Signa, GE Medical System, Milwaukee, Wisconsin, USA). All subjects were examined in the supine position to acquire sagittal T1-weighted spin echo (Repetition Time (TR): 450–500 msec; Echo Time (TE): 15–20 msec; 256×192 Matrix; Section Thickness 3–4 mm; Intersection Gap 0.5–1 mm), sagittal T2-weighted spin echo (TR: 2200–3500 msec; TE: 90–120 msec; 256×192 Matrix; Section Thickness 3–4 mm; Intersection Gap 0.5–1 mm) and Axial T2-weighted spin echo (TR: 2400–3500 msec; TE: 90–120 msec; 256×256 Matrix; Section Thickness 4 mm; Intersection Gap 0.5 mm) MR imaging with a fixed imaging protocol. All MR images were collected and stored in the picture archiving and communication system (PACS; GE Centricity, GE Healthcare).
Outcome Measures
Diagnostic criteria for HIZ were adapted from the descriptions of Aprill and Bogduk,6 Wang et al16,19 and Carragee et al.10 Briefly, a high-intensity signal located in the substance of the posterior, anterior, anterolateral, or posterolateral annulus fibrosus, dissociated from the signal of the nucleus pulposus, was inspected to be approximately the same intensity as the cerebrospinal fluid signal at the same level on lumbar T2-weighted MR images. All lumbar HIZs were classified into dot type, round type, vertical type, or irregular type on the basis of shape on sagittal T2-weighted MR images (Figure 1). Dot type was defined as small dot HIZ. Round type was defined as concentric, oval, or analogous figure Vertical type was defined as a vertical layer to the adjacent endplate, and irregular type was noted as shapes that did not fit into any of these three categories (dot, round, or vertical). The HIZs located in similar position of the same disc on two or more adjacent sagittal images were counted as the same one, ie, consecutive slides HIZ (Figure 2). The number of consecutive slides, which displayed the same HIZ was recorded. Localization method of HIZ followed the process described by Wang and Hu.16
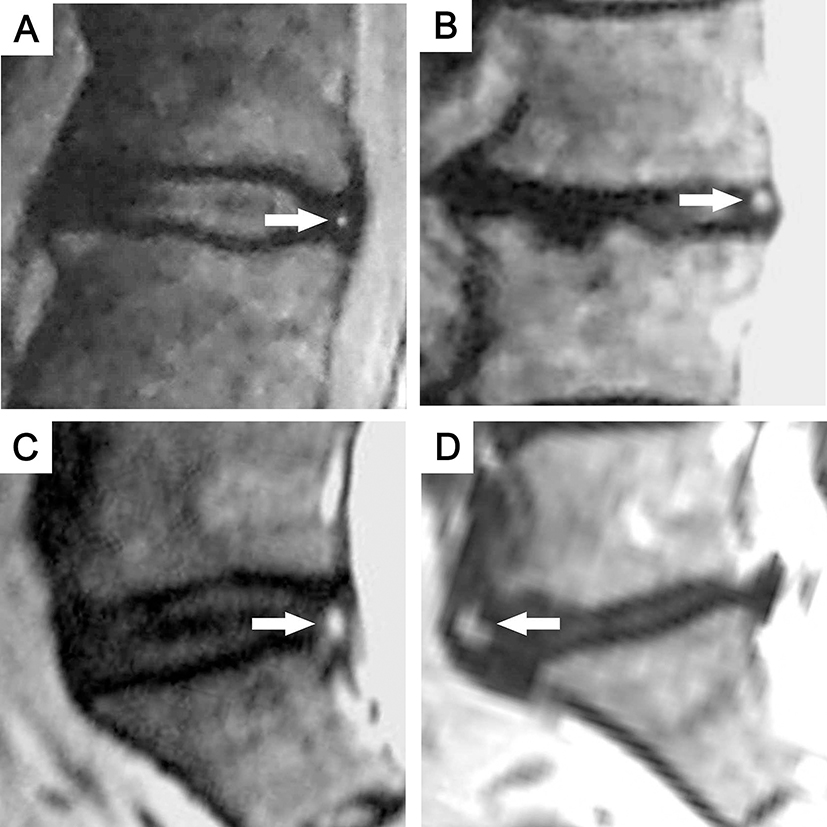 |
Figure 1 Morphological classification of HIZ on sagittal T2-weighted MR images. (A) Dot type; (B) round type; (C) vertical type; (D) irregularity type. |
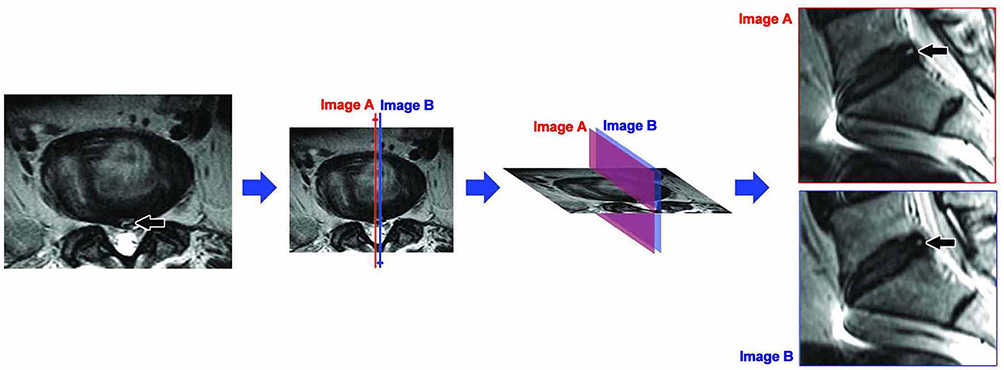 |
Figure 2 Consecutive slides HIZ. Axial T2-weighted MR image of the lumbar spine shows a HIZ in the posterior annulus fibrosus at L5S1 (black arrow). Two adjacent sagittal images, slide A (red) and B (blue), show HIZs in similar position at L5S1 (black arrow), ie Consecutive slides HIZ. It indicates the same HIZ lesion on Axial T2-weighted MR image. |
IDD was evaluated as an intervertebral disc protrusion, extrusion, or other diagnostic signs.17,20–22 Disc protrusion was defined as localized or focal displacement of nucleus pulposus beyond the confines of the annulus fibrosus. Disc extrusion, as defined in this study, was considered to be when the distance between the edges of the disc material beyond the intervertebral disc space was greater than the distance between the edges of the base of the disc material beyond the intervertebral disc space. In addition to HIZ, other diagnostic signs of IDD included “rat tail,” “mallet head,” or other irregular shape signals on sagittal T2-weighted MR images extending from the nucleus pulposus forward or posterior into the signal of the annulus fibrosus (Figure 3).22
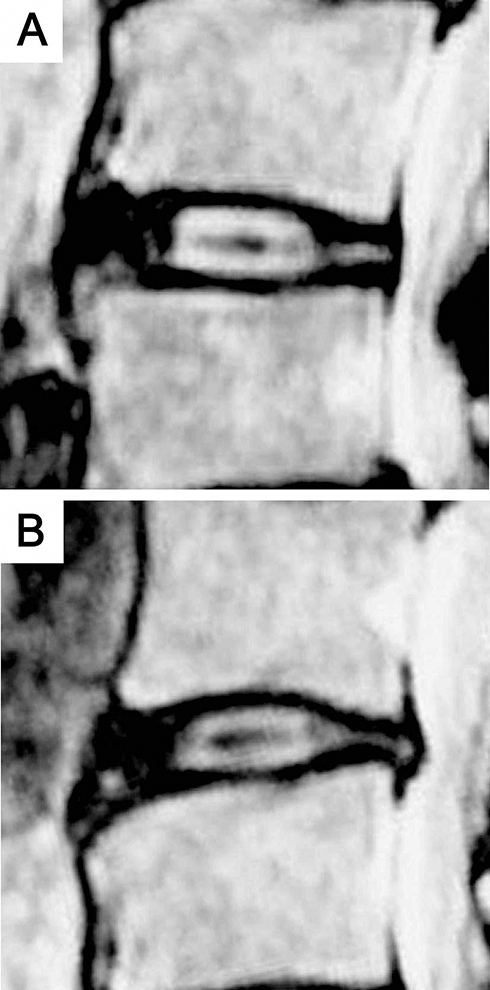 |
Figure 3 Abnormal signals extending from nucleus pulposus forward or posterior into the signal of the annulus fibrous on sagittal T2-weighted MR images. (A) “Rat tail” abnormal signal; (B) “Mallet head” abnormal signal. |
Disc bulge was defined as a disc displacement beyond the contour of the normal disc space, usually greater than 25% (90°) of the circumference of the disc and typically less than 3 mm beyond the edges of the adjacent vertebral body apophyses.21,23
Data Collection
Baseline characteristics, ie, gender and age, were obtained from medical records. LBP symptoms as diagnosed by orthopedic surgeons and physical examination reports were obtained from medical records. The diagnosis and analysis of HIZ were performed by two blinded experienced radiologists, ie, they were unaware of any demographic or clinical characteristics of the subjects. MR image readings and localizations were conducted by the two radiologists independently and separately. If the two results were different, the two radiologists discussed the image until they agreed upon an outcome. If the two radiologists still disagreed on the result, a third reader was invited to perform an independent reading. All data were collected and entered into SPSS software for analysis.
Statistical Analysis
Measurement data were described as the mean, standard deviation (SD), and range. Enumeration data were expressed as a percentage. Differences in ratios were compared using Pearson chi-square tests for categorical variables. Odds ratio (OR), positive predictive value (PPV), negative predictive value (NPV), quotient of positive probability (QPP), quotient of negative probability (QNP), specificity (S), sensibility (E) and kappa coefficient (κ) were calculated to assess diagnostic accuracy. For all the statistical tests, P values less than 0.05 were considered statistically significant. Statistical analysis was performed using Statistical Package for the Social Sciences 22.0 software (IBM SPSS Statistics ver. 22.0 for Windows, IBM Corporation, Armonk, NY, USA).
Ethics Statement
The protocol was reviewed and approved by the clinical trial ethics committee/institutional review board (IRB) of Qingdao Municipal Hospital, Qingdao, China (2021–072). For this anonymous retrospective study, formal consent was not required according to the ethical standards. This study was conducted in accordance with the Declaration of Helsinki.
Results
One thousand one hundred and eighty-eight cases (including 5940 discs) who accepted lumbar spine MR imaging examinations between March, 2010 and October, 2015 were reviewed and included in the study. There were 553 females (46.5%) and 635 males (53.5%) ranging from 16 to 90 years of age (Mean 48.3 years; SD 16.3). A total of 575 (48.4%) individuals out of 1188 subjects exhibited HIZ on T2-weighted MR images. Of the 575 HIZ individuals, 316 were males (55.0%). The mean age was 53.5±13.1 years (range: 16–86 years).
Prevalence and Localization of HIZ
One hundred and eighty-three individuals were found to have multiple discs with HIZ. HIZ was noted in the posterior or anterior annulus fibrosus on MR images, and the prevalence of posterior HIZ (32.3%) was significantly higher than that of anterior HIZ (23.6%; χ2=22.607, P=0.000). All HIZs were located in the outer annulus close to the outer edge of the annulus fibrosus (Figures 1 and 2). Only a part of irregularity-type HIZs extended into middle annulus. Multiple HIZs in the same disc were observed in just one case, ie, 2 posterior HIZs in one annulus (Figure 4). The prevalence and localization of HIZ are illustrated in Table 1.
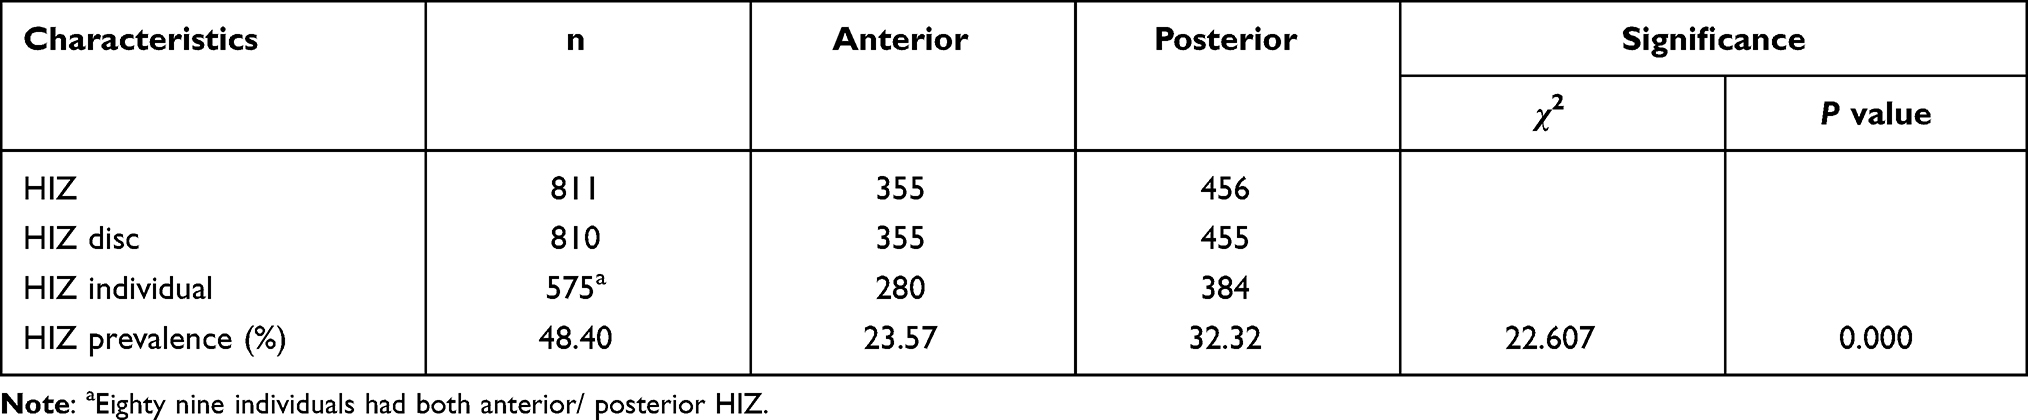 |
Table 1 Prevalence and Localization of HIZ (n=1188) |
 |
Figure 4 Sagittal T2-weighted MR image shows 2 posterior HIZs (black arrow) at L4/5. |
Morphology of HIZ
Morphological classification of HIZ in the posterior/anterior annulus fibrosus on sagittal T2-weighted MR images is illustrated in Table 2. Dot type HIZ was more likely to be missed due to its small area. We found that round type was the most common shape of HIZ in both the posterior and anterior annulus (posterior: 59.2%, anterior: 63.4%, combined: 61.0%). Some vertical type HIZs shaped like a “comma” were more common in cases of bulged disc and were frequently located in the inferior part of the outer annulus. HIZ on axial T2-weighted MR images was frequently recognized as either linear or fusiform bright signal parallel to the adjacent outer edge of disc (Figure 2). However, only 37 HIZs (4.6%) were identified on axial views in this sample.
 |
Table 2 Morphological Classification of HIZ on Sagittal T2-Weighted MR Images (n=811) |
HIZ and the Other Diagnostic Signs of IDD
Of the 810 HIZ discs, 263 (32.5%) were found with diagnostic signs of IDD other than disc herniation. One HIZ (a single HIZ in one disc) was identified in a herniated disk in the inferior part of large disc extrusion (Figure 5). The other diagnostic signs of IDD, ie, “rat tail,” “mallet head,” or other abnormally shaped signals, were relatively brighter than the annulus fibrosus signal, but lower than the signal intensity of normal nucleus pulposus (Figure 3). Indeed, it is sometimes difficult to accurately distinguish abnormal signal from the normal annulus.
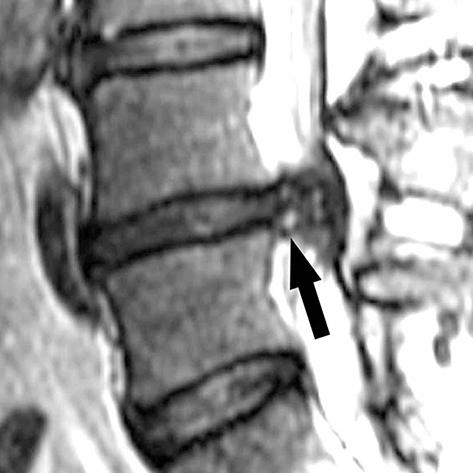 |
Figure 5 Sagittal T2-weighted MR image shows a HIZ (black arrow) in the inferior part of large disc extrusion at L4/5. |
Correlation Between Consecutive Slides HIZ and LBP
One hundred and seventy-five lumbar discs exhibited consecutive HIZ on 2 slides (Figure 2), and 11 discs showed consecutive HIZ on 3 slides. Of the 575 HIZ subjects, 176 (30.6%) had HIZ on consecutive slides (either 2 or 3 consecutive sagittal slides) and 296 (51.5%) experienced LBP. In patients with consecutive-slide HIZ, the incidence of LBP was significantly higher than that in individuals with single-slide HIZ (58.0% vs 48.6%, χ2=4.259, P =0.039). The specificity of consecutive slides HIZ in excluding LBP was 89.1%, which was higher than that of HIZ in general (combined single and consecutive specificity of 58.8%). Consecutive HIZ MRI visualization has a better odds ratio for patients to have discogenic LBP given its better profile of sensibility, specificity and negative and positive predictive values compared to single HIZ MRI given its low specificity despite a better sensibility. These results are reported in Table 3.
 |
Table 3 Correlation Between Consecutive Slides HIZ and LBP (n=1188) |
Discussion
Pathophysiology of HIZ
Since its initial description by Aprill and Bogduk in 1992,6 the prevalence of HIZ in the posterior annulus has been reported in a wide range of symptomatic and asymptomatic subjects.6,7,9,10,14,24–26 In order to avoid the bias caused by sample size in former studies, we examined a relatively large sample of 1188 cases. In this sample, we found a 32.3% prevalence of posterior HIZ. In addition, we found a 23.6% prevalence of anterior annulus HIZ, an extended definition of HIZ sign first analyzed by Wang and Hu in 2009.19 Thus, we found that the prevalence of posterior HIZ was significantly higher than that of anterior HIZ. Prior studies have suggested that the adult lumbar disc is mainly avascular, although tiny collateral vessels were observed in some outer annular lamellae of degenerated discs.27 Peng et al harvested 11 specimens of HIZ discs from LBP patients for histologic examination, and found that the newly formed blood vessels were seen around the tears, suggesting that the HIZ lesion was primarily made up of disorganized, vascularized granulation tissue, possibly formed as a result of the healing response to annular tears.9 Goel et al demonstrated that high interlaminar shear stress, caused by asymmetry in disc structure, was an important contributor to disc degeneration, especially laminae separation.28 Structurally, the weak posterior part of annulus fibrosus is more susceptible to injury,29 thereby increasing the probability of tear and subsequent HIZ formation. In good agreement with these data, we found that posterior HIZ was more common than anterior HIZ in our sample. Moreover, from our observation, all HIZs were located in the outer annulus near the outer edge of the annulus fibrosus. We believe that the HIZ might originate from adjacent outer annular lamellae or tissue outside the annulus fibrosus.
Morphology of HIZ
As the use of advanced MR equipment has gained widespread clinical use, increasing amounts and types of HIZ lesions and shapes have been identified. The classification of HIZ was based on shape, including size and angle between long axis and endplate, etc., in this study. Dot type HIZ is small and difficult to be classified by shape. “Comma” shape, commonly associated with bulged discs, may be related to the folding of annular fibers22 and mechanical effects of surrounding tissue. The shape of HIZ on axial MR images was similar to that of concentric tears in the annulus fibrosus on axial CTD images, confirming the findings of Peng et al,9 ie, HIZ potentially represented the vascularized granulation tissue extending along the tear. During regular axial MR scanning, sections are 3–4 mm in thickness. Therefore, it is crucial to note that many HIZs may not appear on axial T2-weighted MR images if the size of the vascularized granulation tissue is small. We found that only 37 HIZs (4.6%) were identified on axial views in this sample, in stark contrast with our finding of HIZs on sagittal images.
HIZ and Disc Prolapsed/IDD
Clinical studies have suggested that CTD is the most reliable method for direct diagnosis of IDD. However, spinal surgeons and radiologists believe that non-invasive detection methods are more suitable for IDD screening than CTD due to associated risks.5 MR examination is currently considered to be the best imaging instrument for identification of ruptured discs with several features including herniated disc material, HIZ sign, and other abnormal signals in the annulus fibrosus.22,30 Intervertebral disc protrusion and extrusion are defined as displacement of the nucleus pulposus beyond the annulus fibrosus and indicate that the nucleus pulposus has extruded out of a ruptured disc along the annular fissure. This usually occurs within serious IDD and is easily distinguishable in medical imaging. The HIZ sign, to our knowledge, can be an indicator of IDD prior to disc herniation. Hence, we believe that HIZ and disc herniation indicate two different stages of lumbar disc disruption. In this study, only 32.5% of HIZ discs showed “rat tail,” “mallet head,” or other abnormal signals in the annulus fibrosus. In addition, it is difficult to distinguish abnormal signal from the annulus because of the relatively lower signal intensity. Therefore, with the exception of HIZ, we do not believe that abnormal signals in the annulus fibrosus are likely to be a valuable indicator for IDD.
Consecutive-Slide HIZ and Annular Pathologies
The HIZ sign, an imaging result, corresponds to the histologic feature of vascularized granulation tissue in the annular tears of intervertebral discs.9 Therefore, as a solid shape, the HIZ lesion could theoretically be described in any plane. However, in clinical practice, sagittal MR images have been routinely utilized for assessment of HIZ since the first report by Aprill and Bogduk.6 Consecutive-slide HIZ on sagittal MR imaging indicates a slender HIZ parallel to the outer edge of the disc and corresponds to a relatively longer concentric tear. Several former studies have suggested that HIZ associated with pain correlated significantly with Dallas Grade 4 annular disruption,6,11 ie, radial fissure extending to the outer third of the annulus and involving >30 degrees of the disc circumference. We also found that there was a statistically significant association between consecutive-slide HIZ and LBP, and the clinical value of consecutive-slide HIZ was greater than that of single-slide HIZ for diagnosing discogenic LBP.
There were several limitations to this study. First, the study sample biased toward those data which were readily available in hospital records. Indeed, many individuals who may have not accepted MR examinations were excluded. It is likely that these adults would have been different in some characteristics from these study subjects. Another limitation of our study was the potential bias associated with the clinical diagnosis of LBP; provocation discography was not utilized for assessment of LBP. Finally, we found several unexpected results that have still not been explained. For example, we do not know what factors might lead to such a high prevalence of anterior HIZ, or what causes the formation of HIZ in the inferior part of the large disc extrusion.
Conclusion
MRI-visualized HIZ is a highly valuable method of screening for lumbar IDD. It is demonstrated that consecutive-slide HIZ was a more reliable indicator for LBP than single-slide HIZ.
Disclosure
The authors report no conflicts of interest in this work.
References
1. McCormick ZL, DeFrancesch F, Loomba V, Moradian M, Bathina R, Rappard G. Diagnostic value, prognostic value, and safety of provocation discography. Pain Med. 2018;19(1):3–8. doi:10.1093/pm/pnx034
2. Bogduk N, Aprill C, Derby R. Lumbar discogenic pain: state-of-the-art review. Pain Med. 2013;14(6):813–836. doi:10.1111/pme.12082
3. Derby R, Kim BJ, Lee SH, Chen Y, Seo KS, Aprill C. Comparison of discographic findings in asymptomatic subject discs and the negative discs of chronic LBP patients: can discography distinguish asymptomatic discs among morphologically abnormal discs? Spine J. 2005;5(4):389–394. doi:10.1016/j.spinee.2005.01.007
4. Wang H, Li Z, Zhang C, et al. Correlation between high-intensity zone on MRI and discography in patients with low back pain. Medicine. 2017;96(30):e7222. doi:10.1097/MD.0000000000007222
5. Cuellar JM, Stauff MP, Herzog RJ, Carrino JA, Baker GA, Carragee EJ. Does provocative discography cause clinically important injury to the lumbar intervertebral disc? A 10-year matched cohort study. Spine J. 2016;16(3):273–280. doi:10.1016/j.spinee.2015.06.051
6. Aprill C, Bogduk N. High-intensity zone: a diagnostic sign of painful lumbar disc on magnetic resonance imaging. Br J Radiol. 1992;65(773):361–369. doi:10.1259/0007-1285-65-773-361
7. Schellhas KP, Pollei SR, Gundry CR, Heithoff KB. Lumbar disc high-intensity zone. Correlation of magnetic resonance imaging and discography. Spine. 1996;21(1):79–86. doi:10.1097/00007632-199601010-00018
8. Ross JS, Modic MT, Masaryk TJ. Tears of the anulus fibrosus: assessment with Gd-DTPA- enhanced MR imaging. AJR Am J Roentgenol. 1990;154(1):159–162. doi:10.2214/ajr.154.1.2136783
9. Peng B, Hou S, Wu W, Zhang C, Yang Y. The pathogenesis and clinical significance of a high intensity zone (HIZ) of lumbar intervertebral disc on MR imaging in the patient with discogenic low back pain. Eur Spine J. 2006;15(5):583–587. doi:10.1007/s00586-005-0892-8
10. Carragee EJ, Paragioudakis SJ, Khurana S. 2000 Volvo award winner in clinical studies: lumbar high-intensity zone and discography in subjects without low back problems. Spine. 2000;25(23):2987–2992. doi:10.1097/00007632-200012010-00005
11. Wang ZX, Hu YG, Chen XM. Significance of the high-intensity zone located in the posterior annulus fibrosus for diagnosing discogenic low back pain. Zhonghua Yi Xue Za Zhi. 2008;88(35):2478–2481. doi:10.3321/j.issn:0376-2491.2008.35.008
12. Kang CH, Kim YH, Lee SH, et al. Can magnetic resonance imaging accurately predict concordant pain provocation during provocative disc injection? Skeletal Radiol. 2009;38(9):877–885. doi:10.1007/s00256-009-0709-7
13. Chen JY, Ding Y, Lv RY, et al. Correlation between MR imaging and discography with provocative concordant pain in patients with low back pain. Clin J Pain. 2011;27(2):125–130. doi:10.1097/AJP.0b013e3181fb2203
14. Wang ZX, Hu YG. Factors associated with lumbar disc high-intensity zone (HIZ) on T2-weighted magnetic resonance image: a retrospective study of 3185 discs in 637 patients. J Orthop Surg Res. 2018;13(1):307. doi:10.1186/s13018-018-1010-z
15. Jha SC, Takata Y, Abe M, et al. High intensity zone in lumbar spine and its correlation with disc degeneration. J Med Invest. 2017;64(1.2):39–42. doi:10.2152/jmi.64.39
16. Wang ZX, Hu YG. High-intensity zone (HIZ) of lumbar intervertebral disc on T2-weighted magnetic resonance images: spatial distribution, and correlation of distribution with low back pain (LBP). Eur Spine J. 2012;21(7):1311–1315. doi:10.1007/s00586-012-2240-0
17. Teraguchi M, Samartzis D, Hashizume H, et al. Classification of high intensity zones of the lumbar spine and their association with other spinal MRI phenotypes: the Wakayama spine study. PLoS One. 2016;11(9):e0160111. doi:10.1371/journal.pone.0160111
18. Wang ZX, Hou ZT, Hu YG. Anterior high-intensity zone in lumbar discs: prevalence and association with low back pain. Pain Med. 2020;21(10):2111–2116. doi:10.1093/pm/pnaa236
19. Wang ZX, Hu YG. Clinical investigation of high-intensity zone in anterior annulus fibrosus of lumbar disc: compared with high-intensity zone in posterior annulus fibrosus. Zhonghua Wai Ke Za Zhi. 2009;47(9):689–692. doi:10.3760/cma.j.issn.0529-5815.2009.09.015
20. Samartzis D, Karppinen J, Mok F, Fong DY, Luk KD, Cheung KM. A population-based study of juvenile disc degeneration and its association with overweight and obesity, low back pain, and diminished functional status. J Bone Joint Surg Am. 2011;93(7):662–670. doi:10.2106/JBJS.I.01568
21. Fardon DF, Williams AL, Dohring EJ, Murtagh FR, Gabriel Rothman SL, Sze GK. Lumbar disc nomenclature: version 2.0: recommendations of the combined task forces of the North American Spine Society, the American Society of Spine Radiology, and the American Society of Neuroradiology. Spine. 2014;39(24):E1448–1465. doi:10.1097/BRS.0b013e3182a8866d
22. Shang TS, Wang YZ. The comparative study of radiograph, MRI and pathology in degeneration of lumbar intervertebral disc. Chin J Radiol. 2002;36(9):828–832.
23. Jiang X, Chen D. Magnetic resonance imaging analysis of work-related chronic low back pain: comparisons of different lumbar disc patterns. J Pain Res. 2018;11:2687–2698. doi:10.2147/JPR.S162988
24. Liu C, Cai HX, Zhang JF, Ma JJ, Lu YJ, Fan SW. Quantitative estimation of the high-intensity zone in the lumbar spine: comparison between the symptomatic and asymptomatic population. Spine J. 2014;14(3):391–396. doi:10.1016/j.spinee.2013.06.078
25. Lam KS, Carlin D, Mulholland RC. Lumbar disc high-intensity zone: the value and significance of provocative discography in the determination of the discogenic pain source. Eur Spine J. 2000;9(1):36–41. doi:10.1007/s005860050006
26. Takatalo J, Karppinen J, Niinimäki J, et al. Association of modic changes, Schmorl’s nodes, spondylolytic defects, high-intensity zone lesions, disc herniations, and radial tears with low back symptom severity among young Finnish adults. Spine. 2012;37(14):1231–1239. doi:10.1097/BRS.0b013e3182443855
27. Kauppila LI. Prevalence of stenotic changes in arteries supplying the lumbar spine. A postmortem angiographic study on 140 subjects. Ann Rheum Dis. 1997;56(10):591–595. doi:10.1136/ard.56.10.591
28. Goel VK, Monroe BT, Gilbertson LG, Brinckmann P. Interlaminar shear stresses and laminae separation in a disc. Finite element analysis of the L3-L4 motion segment subjected to axial compressive loads. Spine. 1995;20(6):689–698. doi:10.1097/00007632-199503150-00010
29. Tsuji H, Hirano N, Ohshima H, Ishihara H, Terahata N, Motoe T. Structural variation of the anterior and posterior anulus fibrosus in the development of human lumbar intervertebral disc. A risk factor for intervertebral disc rupture. Spine (Phila Pa 1976). 1993;18(2):204–210. doi:10.1097/00007632-199302000-00006
30. Urrutia J, Besa P, Campos M, et al. The Pfirrmann classification of lumbar intervertebral disc degeneration: an independent inter- and intra- observer agreement assessment. Eur Spine J. 2016;25(9):2728–2733. doi:10.1007/s00586-016-4438-z
 © 2021 The Author(s). This work is published and licensed by Dove Medical Press Limited. The
full terms of this license are available at https://www.dovepress.com/terms
and incorporate the Creative Commons Attribution
- Non Commercial (unported, 3.0) License.
By accessing the work you hereby accept the Terms. Non-commercial uses of the work are permitted
without any further permission from Dove Medical Press Limited, provided the work is properly
attributed. For permission for commercial use of this work, please see paragraphs 4.2 and 5 of our Terms.
© 2021 The Author(s). This work is published and licensed by Dove Medical Press Limited. The
full terms of this license are available at https://www.dovepress.com/terms
and incorporate the Creative Commons Attribution
- Non Commercial (unported, 3.0) License.
By accessing the work you hereby accept the Terms. Non-commercial uses of the work are permitted
without any further permission from Dove Medical Press Limited, provided the work is properly
attributed. For permission for commercial use of this work, please see paragraphs 4.2 and 5 of our Terms.