")
Back to Journals » International Journal of General Medicine » Volume 16
IDO1 Promotes the Progression of NSCLC by Regulating the Polarization of M2 Macrophages
Authors Chen X, Yao J, Zhang MY, Li R, Liu X , Qu YQ
Received 1 December 2022
Accepted for publication 2 May 2023
Published 8 May 2023 Volume 2023:16 Pages 1713—1733
DOI https://doi.org/10.2147/IJGM.S398908
Checked for plagiarism Yes
Review by Single anonymous peer review
Peer reviewer comments 3
Editor who approved publication: Dr Scott Fraser
Xiao Chen,1,2 Jie Yao,1 Meng-Yu Zhang,1 Rui Li,1 Xiao Liu,1 Yi-Qing Qu1
1Department of Pulmonary and Critical Care Medicine, Qilu Hospital of Shandong University, Jinan, People’s Republic of China; 2Department of Respiratory Medicine, Tai’an City Central Hospital, Tai’an, People’s Republic of China
Correspondence: Yi-Qing Qu, Department of Pulmonary and Critical Care Medicine, Qilu Hospital of Shandong University, Wenhuaxi Road 107#, Jinan, 250012, People’s Republic of China, Tel +86 531 8216 9335, Fax +86 531 8296 7544, Email [email protected]
Purpose: Non-small cell lung cancer (NSCLC) is currently a problem in the clinic and in society. Tumor-related macrophages (TAMs) in the tumor microenvironment (TME) play a vital role in the development of NSCLC.
Patients and Methods: Bioinformatics was used to analyze the role of Indoleamine 2,3-dioxygenase 1 (IDO1) in NSCLC and the correlation of its expression with CD163 expression. The expression of CD163 and IDO1 was measured by immunohistochemistry, and their colocalization was assessed by immunofluorescence. M2 macrophage polarization was induced, and a coculture model of NSCLC cells and macrophages was established.
Results: Bioinformatics analysis showed that IDO1 promoted the metastasis and differentiation of NSCLC and inhibited DNA repair. Moreover, the expression of IDO1 was positively correlated with CD163 expression. We discovered that IDO1 expression was related to M2 macrophage differentiation. In vitro, we showed that increased IDO1 expression promoted the invasion, proliferation, and metastasis of NSCLC cells.
Conclusion: In conclusion, we determined that IDO1 can regulate the M2 polarization of TAMs and promote the progression of NSCLC, which provides partial theoretical evidence for the use of IDO1 inhibitors in the treatment of NSCLC.
Keywords: IDO1, NSCLC, M2 macrophage, TAM, bioinformatics
Introduction
Lung cancer is the leading cause of cancer-related death in men and women worldwide.1 Non-small cell lung cancer (NSCLC) accounts for ~85% of all lung cancer cases.1 NSCLC is a tumor with poor chemotherapy sensitivity, which is only applicable to about 15% of patients with EGFR, ALK, and ROS mutations and can be targeted for treatment.2 Accordingly, NSCLC, which has a high risk of progression and recurrence, requires neoadjuvant treatment. Despite the reported success of immune checkpoint inhibitors in treating various cancers, the response rate is very limited, and less than 20% of patients respond to these agents.3 The microenvironment has been increasingly recognized as a key regulator of cancer progression. Du et al found that hypothermia can activate adipocytes to stimulate tumor development and play a crucial determining role in malignant progression.4 Due to the complex TME and the interaction between various tumor components, the development of new combinations of treatments that target different mechanisms of tumor progression may initiate a new era of NSCLC treatment.
Macrophages are innate immune cells that play an important role in maintaining the homeostasis of the TME.5 Macrophages have different phenotypes in response to challenges in the microenvironment.6 Different macrophage polarization phenotypes are characterized by different profiles of enzyme, cytokine, and cell surface marker expression. Generally, macrophages are divided into two subgroups: classical M1 macrophages and alternative M2 macrophages.7 The M1 phenotype is induced by IFN-γ and lipopolysaccharide (LPS). IL-4 and IL-13 can stimulate macrophages to polarize into the M2 phenotype.8 Many studies have shown that TAMs are mostly polarized toward the M2 phenotype.9 TAM infiltration is associated with poor prognosis in most human tumors.10 This suggests that TAMs may be an attractive target for anticancer therapy. Therefore, understanding how macrophage polarization is regulated is of great importance for developing novel treatments for NSCLC.
Indoleamine 2.3-dioxygenase 1 (IDO1) can reduce local tryptophan concentrations and produce immunomodulatory tryptophan metabolites, thus exerting an immune-suppressive effect.11–13 IDO1 is expressed by many different types of tumor cells and tumor draining lymph nodes. Studies have shown that IDO1 expression is associated with poor prognosis in patients with several types of cancer, such as endometrial cancer, ovarian cancer, and colon cancer.14–16 Wang et al showed that IDO1 overexpression increased the expression of M2-specific markers. In contrast, downregulation of IDO1 expression mediated by small interfering RNA (siRNA) upregulation M1-specific marker expression.17 Therefore, IDO1 may be a therapeutic target for reverse immunosuppression.18 Currently, several IDO1 inhibitors are under clinical evaluation, and many of them are in Phase II or III clinical trials.19 Epacadostat (INCB024360) is the most common IDO1 inhibitor that is well tolerated by patients, and it exerts a significant beneficial effect in cancer treatment.20 Phase I and phase II studies have shown that Epacadostat is well tolerated in patients with advanced cancer.21,22 In the Phase 1/2 ECHO-202/KEYNOTE-037 clinical trial (NCT02178722) targeting multiple tumor types, it was found that the combination of Epacadostat and anti-PD-1 antibody pembrolizumab was safer; and the effective rate of combined treatment for 54 patients with advanced melanoma was 56%.23 Epacadostat reduces tryptophan metabolism by inhibiting IDO1, enhances the proliferation of effector T cells and natural killer cells, increases the activation of CD86 and reduces apoptosis.24 Therefore, we hypothesize that Epacadostat may affect the polarization of macrophages. However, the interplay between NSCLC cells, macrophages and IDO1 has never been addressed.
In this study, we studied the effect of IDO1 expression on the phenotype of macrophages. We used an in vitro M2 macrophage and NSCLC cell coculture system to simulate the tumor microenvironment of NSCLC and explored the effect of IDO1 inhibitors on NSCLC cells, as well as the underlying mechanism, to provide a possible mechanism by which IDO1 inhibitors function for treating NSCLC.
Materials and Methods
Bioinformatics Analysis Based on a Public Database
CancerSEA (http://biocc.hrbmu.edu.cn/CancerSEA/) was the first database established to analyze distinct functional states of cancer cells at the single-cell level. CancerSEA provides an atlas of cancer functional states at the single-cell level, and it includes 14 functional states of 41,900 single cancer cells from 25 cancer types (including stem cells, invasion, apoptosis, cell cycle, differentiation, metastasis, proliferation, EMT, angiogenesis, DNA damage, DNA repair, hypoxia, inflammation and quiescence).25 In this study, the CancerSEA database was used for the functional analysis of IDO1. We downloaded The Cancer Genome Atlas (TCGA) data from UCSC (http://xena.ucsc.edu/)26 and data about IDO1 and CD163 mRNA expression in cell lines from the Cancer Cell Line Encyclopedia (CCLE) (https://sites.broadinstitute.org/ccle),27 and we analyzed the correlation of IDO1 and CD163 expression in cancer samples and cell lines with R language (R 4.1.0).
Cell Culture and Differentiation
THP-1 human monocytes were purchased from Wuhan Procell Life Science & Technology Co., Ltd. (Hubei, China). NSCLC cell lines (A549 and H1299) were purchased from the Institute of Life Sciences, Chinese Academy of Sciences Cell Bank (Shanghai, China). The THP-1, H1299 and A549 cells were cultured in RPMI 1640 medium supplemented with 10% fetal bovine serum (FBS) and penicillin 20 μg/mL and streptomycin 20 μg/mL (Sigma, USA). All the cells were cultured in a humid environment at 37 °C and 5% CO2. In this experiment, THP-1 cells were seeded in 6-well plates, and 100 ng/mL phorbol 12-myristate 13-acetate (PMA, Abcam) was added and incubated for 48 h to differentiate the cells into M0 macrophages. LPS (100 pg/mL) and IFN-γ (20 ng/mL) or IL-4 and IL-13 (20 ng/mL) (Novoprotein, Shanghai, China) were added and incubated to differentiate the cells into M1 or M2 macrophages, respectively, for subsequent experiments. Then, Epacadostat (INCB024360, Selleck, USA) was used to treat the M2 macrophages.
Clinical Information and Tissue Samples
This study was approved by the ethics committee of Qilu Hospital of Shandong University (ethics batch number: KYLL-2018-341). Patients or their relatives were informed that paraffin sections of excised specimens would be used for scientific research and all patients gave written informed consent. The experiment was carried out in accordance with the Declaration of Helsinki. The expression of CD163 and IDO1 in pneumonectomy tissue samples from 89 patients with NSCLC was measured by immunohistochemistry. The clinical data, which included basic information, tumor lymph node metastasis (TNM) stage (according to the eighth edition), pathological type, tumor location, and prognosis, were analyzed.
Immunohistochemistry
Immunohistochemistry (IHC) was performed on paraffin-embedded sections. Before staining, the paraffin sections were incubated at 65 °C for 60 minutes. Then, the paraffin sections were immersed in fresh xylene twice for 10 minutes. Tissue sections were rehydrated by immersion in a series of ethanol solutions with decreasing concentrations (100%, 100%, 95%, 80% and 70%) for 5 minutes. After washing with distilled water for 2 minutes, the antigens were repaired by microwaving in citrate solution. After incubation for 15 minutes with an endogenous peroxidase inhibitor and 20 minutes with goat serum working solution (SP-9000, Zhongshan Golden Bridge Biotechnology, Beijing, China), the sections were incubated with anti-IDO1 antibody and anti-CD163 antibody overnight at 4 °C. Biotin-labeled goat anti-rabbit IgG polymer was added and incubated at 37 °C for 30 minutes. A DAB Kit (ZLI9017, Zhongshan Golden Bridge Biotechnology, Beijing, China) was used for chromogen development. The sections were stained with hematoxylin and covered with a neutral balm.
The scores were independently assessed by two independent investigators. The tumor cell intensity was scored on a scale of 0–3 points (0=none; 1=weak; 2=mild; 3=strong). The proportion score was obtained by estimating the percentage of positive tumor cells (0=none; 1=less than 25%; 2=25–75%; 3=greater than 75%). To evaluate the average degree of staining of the sections, multiple regions were randomly selected and analyzed, and at least 100 tumor cells were evaluated. The cytoplasmic expression levels were calculated by the H-score system as follows: H-score = ∑ (Pi) ×I) = (percentage of weak cells) × 1) + (medium intensity cell percentage) × 2) + (percentage of high intensity cells) × 3). In this equation, Pi represents the percentage of stained tumor cells, and I represent the staining intensity. The tumor samples were divided into a high-expression group or a low-expression group according to whether their H-scores were above or below the median.
Immunofluorescence and Immunofluorescent Colocalization
THP-1-derived macrophages were fixed with 4% paraformaldehyde for 15 minutes and washed with PBS 3 times. The macrophages were permeabilized with 0.5% Triton X-100 in PBS for 15 minutes. After washing, they were blocked with 5% BSA for 1 h at room temperature and incubated with anti-CD86 (ab239075, Abcam, USA), anti-CD163 (ab182422, Abcam, USA), and anti-IDO1 (ab156787, Abcam, USA) antibodies at 4 °C overnight. Coimmunofluorescence staining was performed with anti-CD163 (ab182422, Abcam, USA) and anti-IDO1 (ab156787, Abcam, USA) antibodies. After removing the slides from a 4 °C environment, the slides were rewarmed at room temperature for 1 h. After extensive washing, the slides were incubated with fluorescent secondary antibodies (ab150077 and ab150115, Abcam, USA) and then restained with DAPI for 5 minutes. Then, the climbing pieces were placed on glass slides, and a fluorescent quenching inhibitor was added to seal the slides. The slides were observed under a laser confocal microscope.
Coculture Experiment
H1299 and A549 cells were seeded in 6-well plates (1×10⁶ cells per well). THP-1-derived M2 macrophages (1×10⁶ cells per chamber) were directly seeded in the upper chamber (0.4 μm, Corning, USA), while the H1299/A549 cells were seeded in the lower chamber. Before coculture, NSCLC cells and macrophages were washed with RPMI 1640 supplemented with 0.1% bovine serum albumin (BSA). After the last wash, M2 macrophages were added to the upper chambers with the appropriate basic medium alone or basic medium supplemented with Epacadostat, and then, the upper chambers containing the M2 macrophages were placed in each well. NSCLC cells were collected for subsequent experiments after being cocultured for 48 hours.
Flow Cytometry
Macrophages were stained with PE-conjugated anti-human CD163, FITC-conjugated anti-human CD86, PE/Cy-conjugated anti-human CD11b, and APC-conjugated anti-human CD68 (BioLegend, USA) according to the manufacturers’ instructions. Flow cytometry was performed using a flow cytometer (FACSCalibur, USA), and the results were analyzed with ImageJ. For each sample, at least 1×10⁴ cells were analyzed. Annexin fluorescein isothiocyanate isomer V-(FITC) (E-CK-A211, Elabscience, China) and propidium iodide (E-CK-A211, Elabscience, China) were used to stain the cells for 20 minutes, and cell apoptosis was detected using flow cytometry.
Western Blotting
Cellular proteins were extracted with RIPA buffer (Beyotime, Shanghai, China) and the protease inhibitor phenylmethylsulfonyl fluoride (PMSF) (Beyotime, Shanghai, China). The proteins were separated by SDS–PAGE and transferred to PVDF membranes (Millipore, USA). After blocking with 5% nonfat milk, the membranes were incubated with primary antibodies at 4 °C overnight and then labeled with horseradish peroxidase (HRP)-conjugated secondary antibodies at room temperature for 1 hour. The primary antibodies were as follows: anti-CD163 (ab182422, Abcam, USA), anti-CD86 (ab239075, Abcam, USA), anti-JAK2 (ab108596, Abcam, USA), anti-pJAK2 (ab32101, Abcam, USA), anti-STAT3 (ab68153, Abcam, USA), anti-STAT3 (ab76315, Abcam, USA), anti-IDO1 (13268-1-AP, Proteintech, USA), anti-Vimentin (Servicebio, Wuhan, China), anti-Ecadherin (Servicebio, Wuhan, China), anti-GAPDH (5174, Cell Signaling Technology, USA), anti-Bcl2 (15071, Cell Signaling Technology, USA), anti-Bax (5023, Cell Signaling Technology, USA), and β-Tubulin (2128, Cell Signaling Technology, USA). The proteins on the membranes were detected by Tanon 5200 (Shanghai, China), and the membranes were further probed for GAPDH or β-Tubulin as a loading control.
Reverse Transcription-Quantitative Polymerase Chain Reaction (RT-qPCR)
Total RNA was extracted using TRIzol Reagent (Thermo Fisher Scientific, USA) according to the manufacturer’s instructions. OligodT primers were used to synthesize cDNA from total RNA using PrimeScript RT Reagent Kit (RR037A, TaKaRa, Japan). The expression of mRNA was determined using RT–PCR using TB Green Premix Ex Taq II (RR820A, TaKaRa, Japan). The forward and reverse primer sequences are shown in Table 1. The relative mRNA expression levels were normalized to the GAPDH expression level in the same sample. The gene expression of RT–qPCR was calculated as the change compared with the control (2- ΔΔ Ct).
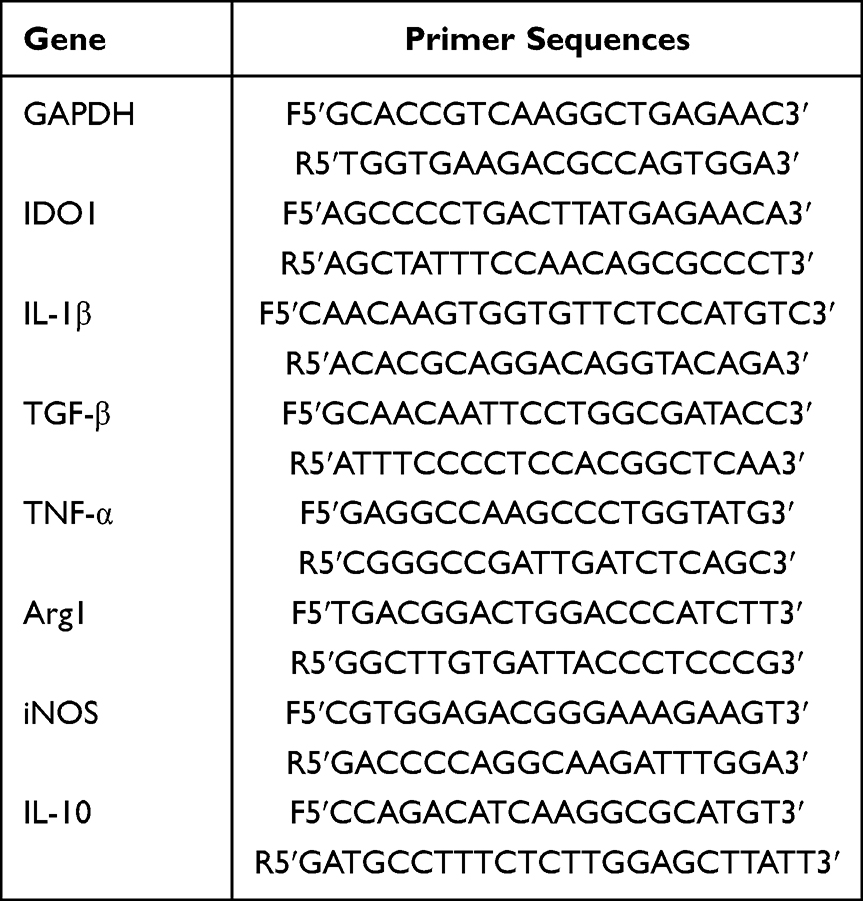 |
Table 1 The Primer Sequences of the Genes Investigated in RT-qPCR Analysis |
Cell Colony Formation and Proliferation Assays
Cell colony formation assays were performed as described previously.2 To conduct colony formation experiments, approximately 1×10³ NSCLC cells were seeded into 6-well plates. After incubation at 37 °C for 2 weeks, the cells were washed twice with PBS. Then, the cells were fixed with methanol for 20 min and stained with 0.1% crystal violet at room temperature for 15 min. The number of colonies with more than 50 cells was counted under a microscope. The experiment was repeated thrice.
Cell proliferation was detected by the Cell Counting Kit-8 assay (CCK-8). The cocultured NSCLC cells were plated in 96-well culture plates at 5×10³ cells per well. After incubation for 0 h, 24 h, 48 h and 72 h, 10 µL of CCK-8 solution was added to each well and incubated at 37 °C for 1 h. The absorbance was measured using a microplate reader at 450 nm. The experiment was repeated at least thrice.
Wound-Healing Assay
The cells were seeded in 6-well plates at a density of 1×10³ cells/mL and cultured to 90% density. Then, a sterile 200 μL pipette tip was used to generate a scratch in the center of the cell monolayer in each well. Then, the plates were incubated in CO2 incubator for 24 hours. Images of the cells that migrated into the wounded area were captured, and the migration distance was measured under an inverted microscope. The degree of wound healing was determined by calculating the relative width of the wound compared to that in the control group.
Cell Migration and Invasion Assay
The upper inserts of the Transwell migration chambers (3422, Corning, USA) were incubated at 37 °C in serum-free medium for 1 h. After the medium was removed, cells were suspended in serum-free medium (4× 10⁴ cells/well) and seeded into the inserts. A medium supplemented with 20% FBS was added to the lower chamber. The cells (H1299/A549, H1299/A549+Epacadostat, H1299/A549+M2 macrophages, H1299/A549+M2 macrophages+Epacadostat) were incubated in a humidified incubator at 37 °C for 24 h. After incubation, the culture medium was removed, and the residual cells on the membrane surface were removed with cotton swabs. The migrated cells were fixed with methanol for 20 min and stained with 0.1% crystal violet at room temperature for 15 min. Images of the migrated cells were captured by confocal microscopy. Three visual fields of each chamber were randomly selected, and the number of cells in each field was counted. The results were analyzed by ImageJ, and t tests were performed to determine statistical significance.
For the invasion assay, the inserts were precoated with 50 μL Matrigel (BD Bioscience) for 30 min at 37 °C. After the medium was removed, the upper inserts were seeded with cell suspensions in serum-free medium (6 × 10⁴ cells/well). A medium supplemented with 20% FBS was added to the lower chamber. The cells were cultured at 37 °C for 48 hours. The invasive cells were fixed with methanol for 20 min and stained with 0.1% crystal violet at room temperature for 15 min. Three microscope fields were chosen from each chamber, and the number of cells in each field was counted. A t-test was used to analyze the data to determine the statistical significance.
Statistical Analysis
All the data are presented as the mean ± standard deviation (SD). The cell experiments were repeated at least three independent times. The statistical significance of the differences was evaluated using GraphPad Prism and SPSS. A t-test was used to analyze the data of the cell and animal experiments. The Mann–Whitney U-test was used to compare differences between two groups of measurement variables with nonnormal distributions. Differences with a P value <0.05 were considered statistically significant.
Results
The Functions of IDO1 in Single NSCLC Cells and the Correlation of Its Expression with CD163 Expression Based on Data in Public Databases
The functions of IDO1 in single NSCLC cells were explored using CancerSEA. IDO1 function was mainly related to angiogenesis, DNA repair and metastasis (Figure 1a and b). Lam (EXP0068) showed that high IDO1 expression was negatively correlated with DNA repair (Spearman’s coefficients, −0.35; p<0.001) (Figure 1c). 28 Correlation analysis also revealed a positive between correlation of IDO1 expression and differentiation and metastasis (Spearman’s coefficient, 0.43 and 0.89, respectively; p<0.001) (Figure 1d and e). The distribution of IDO1 expression in EXP0068 is shown in the box plot, and the expression levels of IDO1 in single cells are shown in the t-SNE plot (Figure 1f). Moreover, IDO1 expression was positively correlated with CD163 expression in cancer tissues (LUAD and LUSC) and cell lines (Figure 1g–i). Correlation analysis also revealed a positive correlation of IDO1 expression with “HALLMARK_IL6_JAK_STAT3_SIGNALING” in LUAD and LUSC (R=0.52 and 0.526, respectively; p<0.001) (Figure 1j and k).
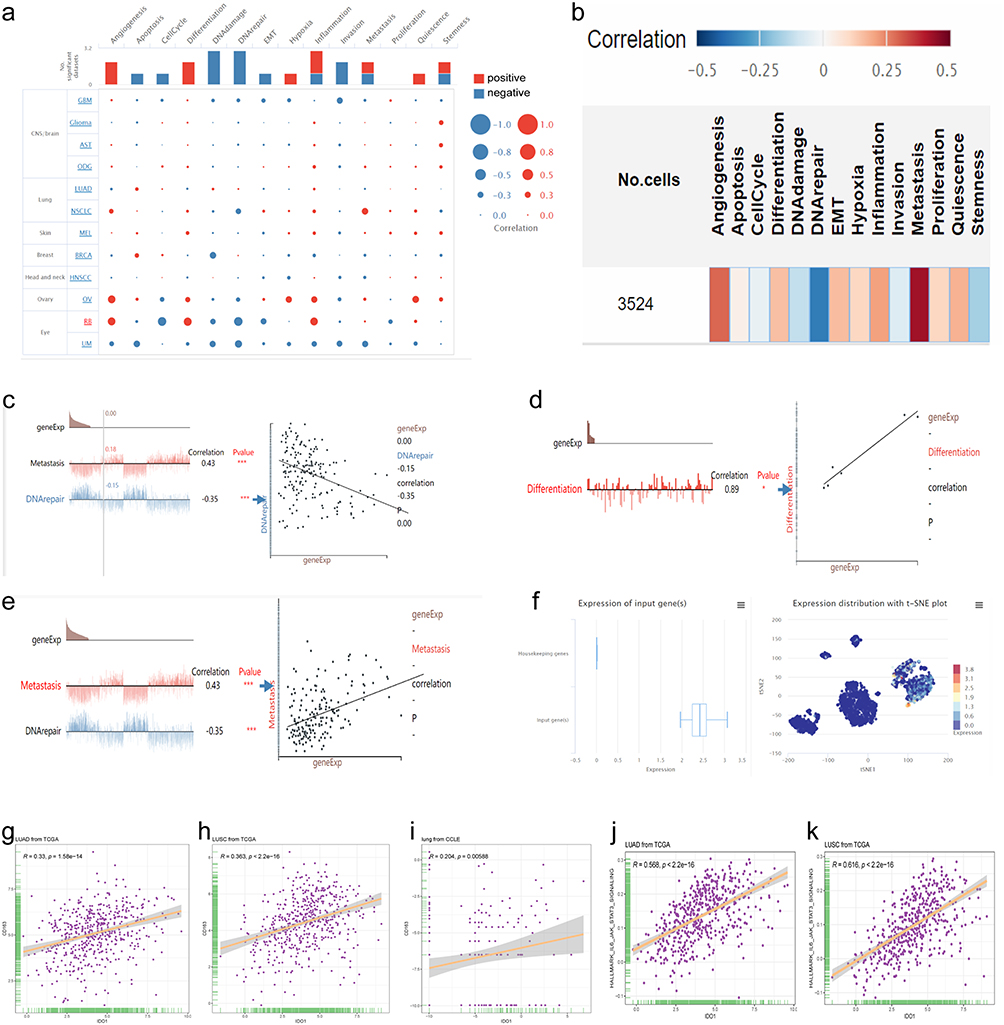 |
Figure 1 Bioinformatics analysis of IDO1 expression in single NSCLC cells and correlation with CD163 expression based on data in a public database. (a and b) Functional relevance of IDO1 expression in patients with NSCLC. Red and blue indicate a positive correlation and a negative correlation, respectively. (a) The size of the dot and (b) The depth of the color represent the average correlation strength. (c) Correlation between IDO1 expression and DNA repair. (d) Correlation between IDO1 expression and differentiation. (e) Correlation between IDO1 expression and metastasis. (f) The distribution and expression level of IDO1 in EXP0068 are shown in a box plot and a t-SNE plot. (g-i), Correlation of IDO1 expression with CD163 expression in LUAD (g), LUSC (h) and cell lines (i) based on data from The Cancer Genome Atlas (TCGA) and Cancer Cell Line Encyclopedia (CCLE) databases. Correlation of IDO1 expression with HALLMARK_IL6_JAK_STAT3_SIGNALING in LUAD (j) and LUSC (k). (***p<0.001; *p<0.05). |
THP-1 Cells Were Induced to Differentiate into Macrophages
TAMs play a key role in cancer progression and angiogenesis. To study the effect of M2-type TAMs on NSCLC, we first induced THP-1 cells to polarize into M2 macrophages in vitro according to the previously published methods.9 In brief, THP-1 cells can be induced to differentiate into M0, M1 and M2 macrophages and undergo the corresponding morphological changes. After PMA treatment, THP-1 cells changed from suspension cells to adherent M0 macrophages (Figure 2a). M0 macrophages were induced to differentiate into M1 macrophages by stimulation with LPS and IFN-γ; then, the cells exhibited morphologies that resembled long spindles, and the volumes increased (Figure 2b). Additionally, the M0 macrophages were induced to differentiate into M2 macrophages by stimulation with IL-4 and IL-13; the cells developed dendritic processes, and the cell volume increased (Figure 2c).
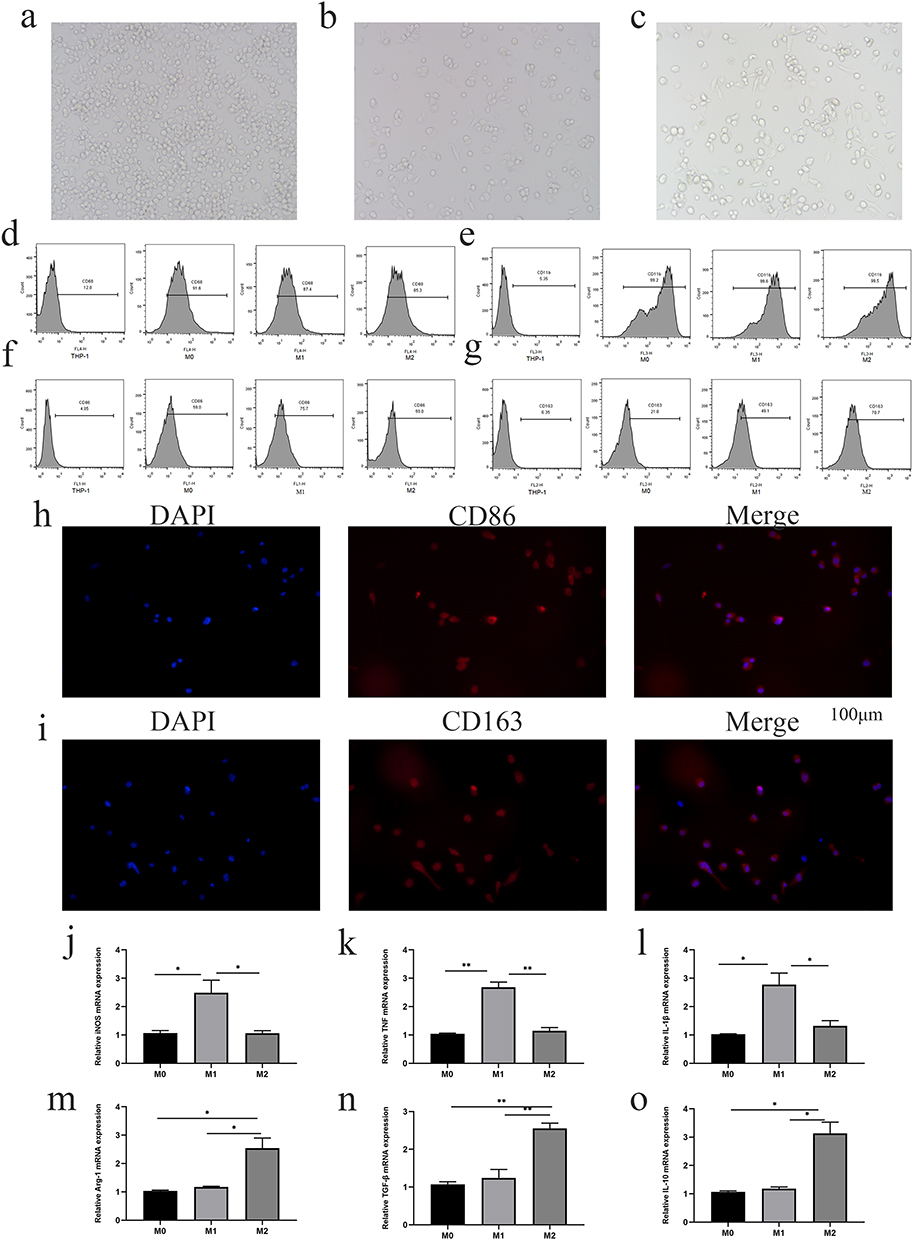 |
Figure 2 THP-1 cells were induced to differentiate into macrophages. (a) After PMA induction, THP-1 cells changed from suspension cells to adherent M0 macrophages. (b) M0 macrophages were induced to differentiate into M1 macrophages by LPS and IFN-γ treatment; the cell morphology was long and spindle-like, and the volume increased. (c) M2 macrophages induced by IL-4 and IL-13 showed dendritic processes and increased cell volume (magnification, 20x). (d and e) Flow cytometry showed high expression of CD68 and CD11b in M0, M1 and M2 macrophages. (f) M1 macrophages showed significant upregulation of CD86 expression. (g) M2 macrophages displayed higher expression of CD163. (h and i) Immunofluorescence showed that the expression of CD86 was higher in M1 macrophages and that of CD163 was higher in M2 macrophages. (j–l) Compared with M0 and M2 macrophages, M1 macrophages had significantly upregulated expression of iNOS, TNF-a and IL-1β. (m–o) The mRNA expression of Arg-1, TGF-β, and IL-10 in M2 macrophages was significantly higher than that in M0 and M1 macrophages (*p < 0.05, **p < 0.01). |
The surface marker expression of macrophages with different phenotypes was analyzed by flow cytometry. The high expression of CD68 and CD11b by M0, M1, and M2 macrophages suggested that macrophage induction was successful (Figure 2d and e). The expression of CD86 (an M1 macrophage-specific surface marker) was clearly increased in M1 macrophages compared with M0 and M2 macrophages (Figure 2f). The expression of CD163 (an M2 macrophage-specific surface marker) was clearly increased in M2 macrophages compared with M0 and M1 macrophages (Figure 2g). The immunofluorescence results also showed that the expression of CD86 was higher in M1 macrophages (Figure 2h) and that the expression of CD163 was higher in M2 macrophages (Figure 2i). RT–qPCR was used to analyze the mRNA expression levels of M1 and M2 marker genes.6 Compared with M0 and M2 macrophages, M1 macrophages exhibited significantly upregulated expression of iNOS, TNF-A and IL-1β (Figure 2j–L; p < 0.05 or 0.01). The levels of Arg-1, TGF-β, and IL-10 in M2 macrophages were significantly higher than those in M0 and M1 macrophages (Figure 2m–o; p< 0.05 or 0.01).
Verification of the Relationship Between the Expression of IDO1 and M2 Macrophages
To verify the correlation between the expression of IDO1 and M2 macrophages, we performed immunofluorescence colocalization assays on M2 macrophages in vitro. The immunofluorescence double-labeling method in M2 macrophages showed that the IDO1 protein labeled with green fluorescence and the CD163 protein (specific surface marker of M2 macrophages) labeled with red fluorescence were colocalized in the M2 cytoplasmic (Figure 3a). Next, we performed coimmunofluorescence staining of CD163 and IDO1 in tissue sections of NSCLC patients (Figure 3b).
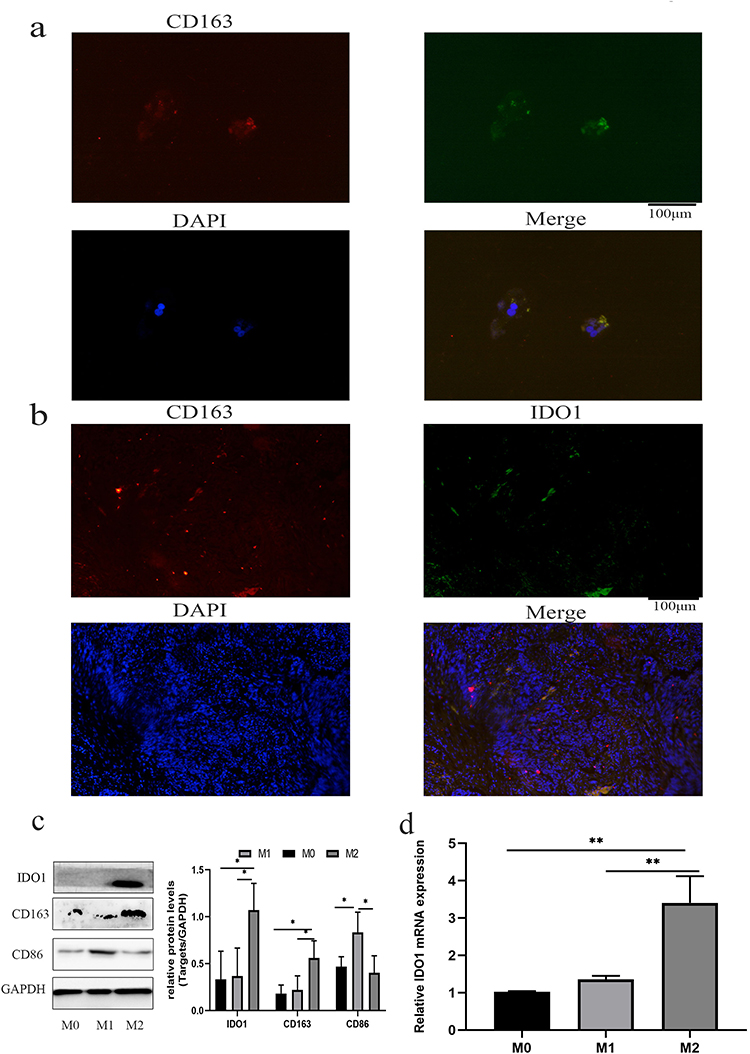 |
Figure 3 Verification of the relationship between the expression of IDO1 and M2 macrophages. (a) The IDO1 protein labeled with green fluorescence and the CD163 protein labeled with red fluorescence colocalized in the cytoplasm of M2 macrophages. (b) The colocalization of IDO1 (green) and CD163 (red) in tissue sections of NSCLC patients as shown by immunofluorescence. (c and d) The protein and mRNA expression levels of IDO1 and CD163 in M2 macrophages were higher than those in M0 macrophages (magnification, 20-x) (**p<0.01; *p<0.05). |
Then, we measured the protein expression of IDO1 and CD163 in M2 macrophages. The results showed that the protein expression levels of IDO1 and CD163 in M2 macrophages were higher than those in M0 macrophages (Figure 3c). Additionally, the mRNA expression of IDO1 and CD163 was upregulated in M2 macrophages (Figure 3d).
Association of IDO1 Expression with M2 Macrophages and the Clinic Pathological Parameters of NSCLC Patients
Immunohistochemistry was used to measure the expression of CD163 in NSCLC samples. The positive expression of the CD163 protein was observed in the presence of brown-yellow to brown granules. The proportion of patients with higher expression of CD163 in NSCLC tissues was 86.5% (77/89), indicating increased M2 macrophage infiltration into tumor tissues than adjacent nontumor tissues (Figure 4a, c and e). To confirm the association between IDO1 and CD163 protein expression in NSCLC patients, we also performed IHC staining of IDO1 expression in NSCLC tissues. The proportion of patients with higher expression of CD163 in NSCLC tissues was 73% (65/89) (Figure 4b, d and f). The expression of IDO1 was positively correlated with CD163 protein expression (p<0.001, R=0.524). Overall, 79.2% (61 of 77) of the tumor samples showed the same staining intensity of IDO1 and CD163 protein (Figure 4g). Table 2 describes the relationship between the expression of IDO1 and clinic pathological features of NSCLC tumor patients. In the NSCLC patients, the high expression of IDO1 was significantly associated with lymph node metastasis (p =0.025) and differentiation grade (p =0.034). Table 3 also shows the relationship between the expression of IDO1 and clinic pathological features of NSCLC patients with high CD163 expression. The results showed that high expression of IDO1 was significantly associated with smoking status (p=0.021), primary tumor location (p =0.019) and lymph node metastasis (p =0.026).
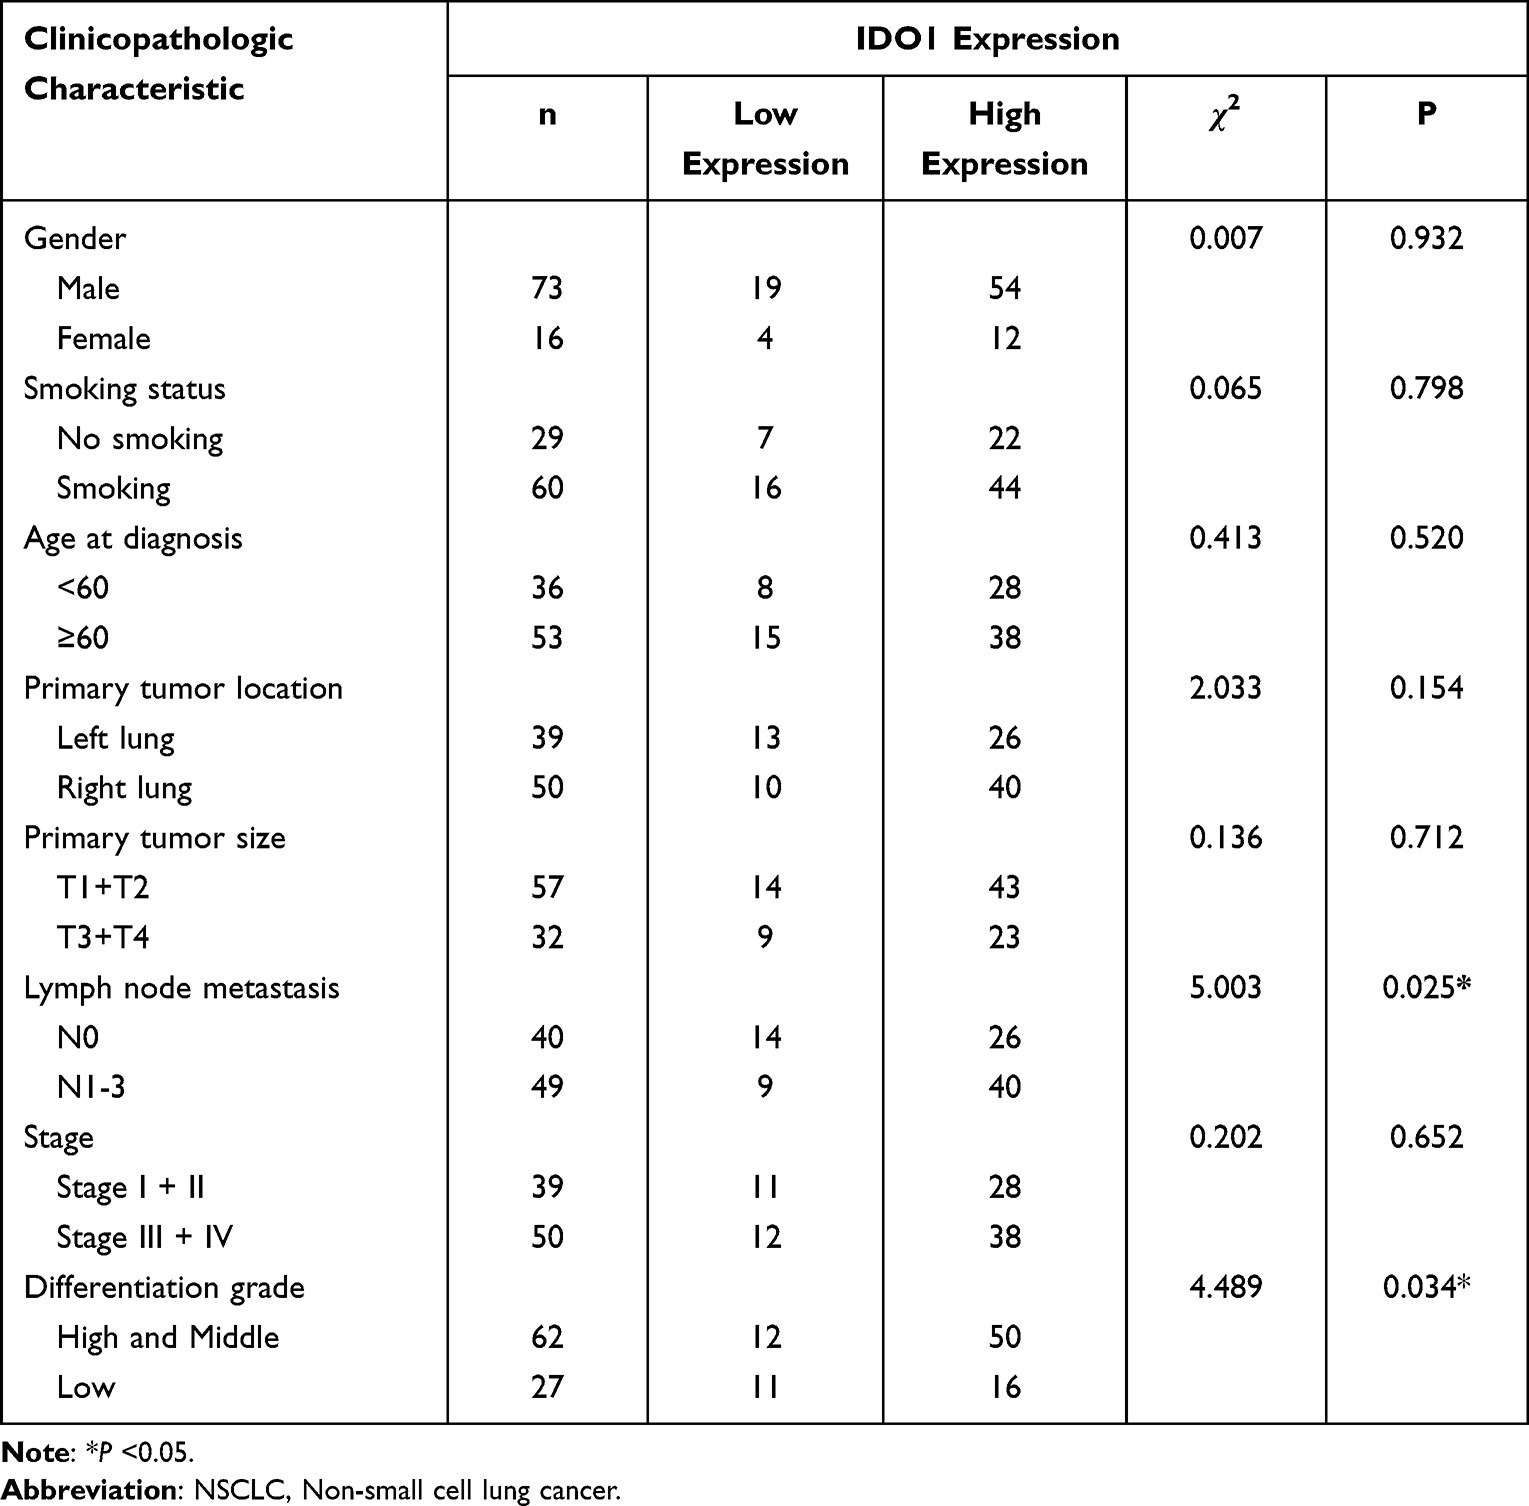 |
Table 2 Correlation of IDO1 Expression in the Tumor Tissues with Clinicopathologic Characteristics in the NSCLC Patients |
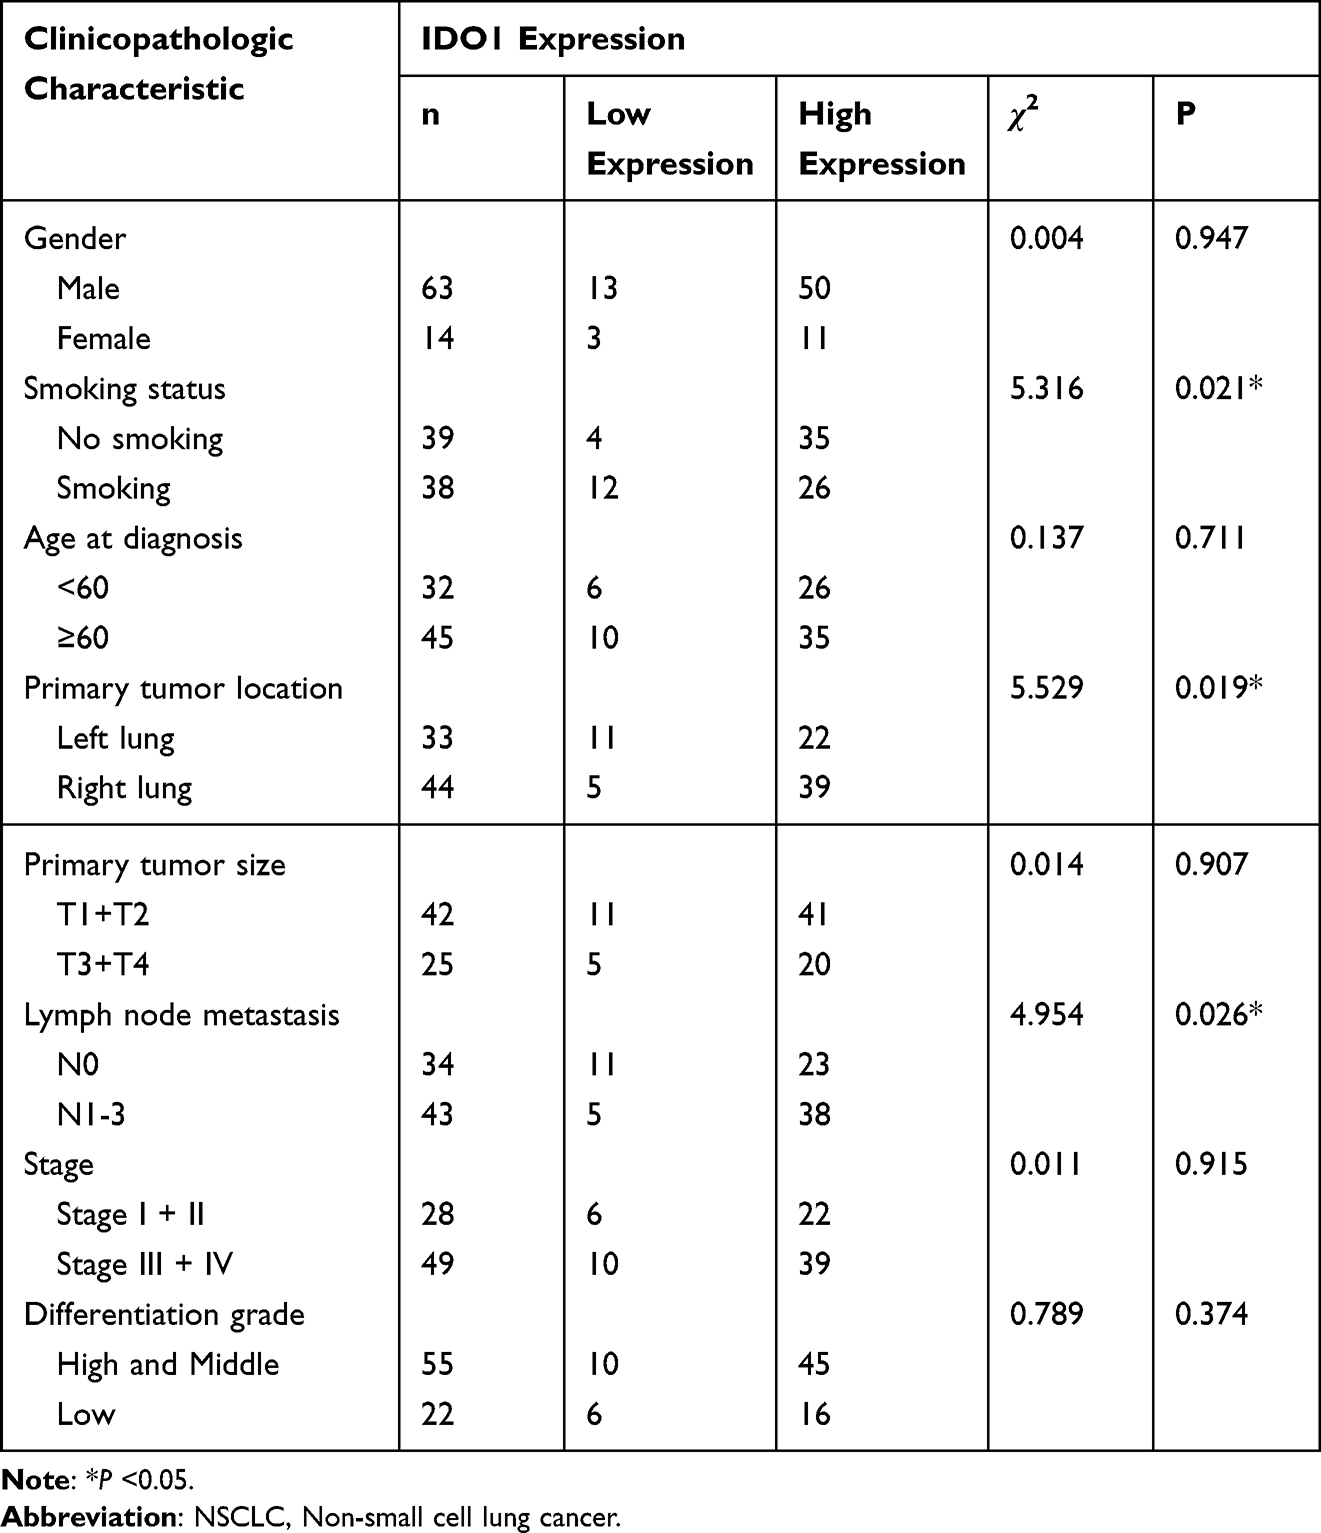 |
Table 3 Correlation of IDO1 Expression in the Tumor Tissues with Clinicopathologic Characteristics in the NSCLC Patients with High M2 Macrophage Infiltration |
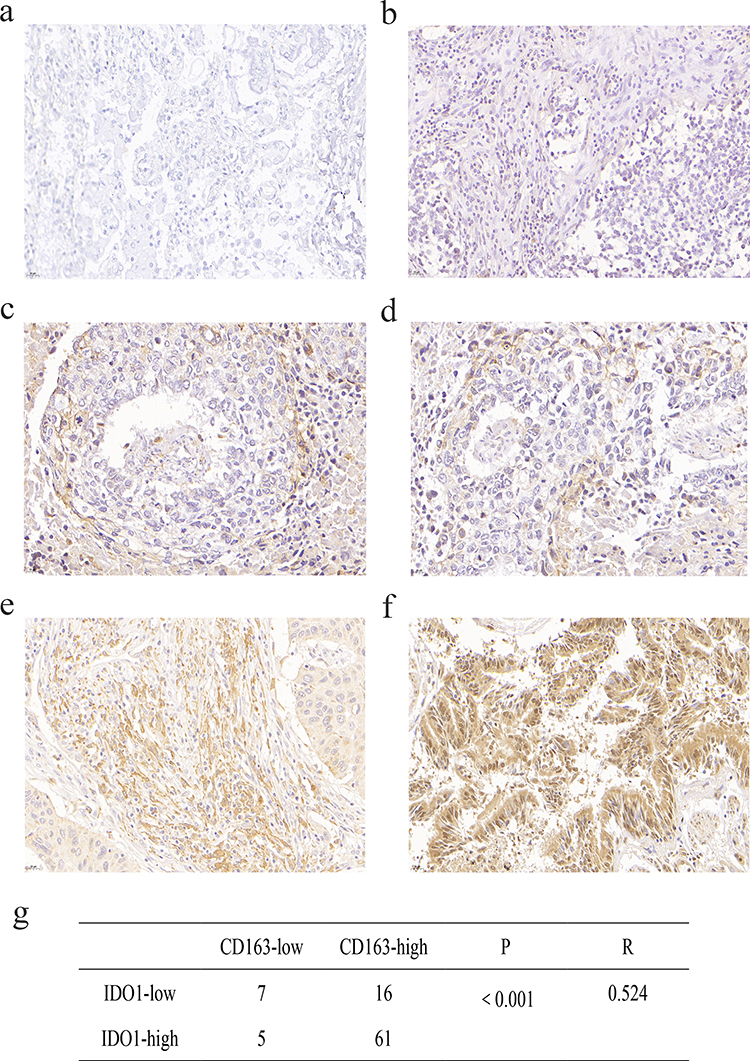 |
Figure 4 Association of IDO1 expression with M2 macrophages and the clinicopathological parameters of NSCLC patients. (a) Negative expression of CD163 in adjacent normal tissue. (b) Protein expression of IDO1 in the adjacent normal tissues shown in a. (c) Low expression of CD163 in NSCLC tissues. (d) Protein expression of IDO1 in the NSCLC tissues shown in c. (e) High expression of CD163 in NSCLC tissue. (f) Protein expression of IDO1 in the NSCLC tissues shown in e. (g) Correlation between IDO1 and CD163 protein expression in NSCLC (p<0.001, R=0.524). |
Effect of IDO1 Expression on Macrophage Polarization
Previous experiments confirmed that the expression level of IDO1 was higher in M2 macrophages. To verify the effect of IDO1 on M2 polarization, we added the IDO1 inhibitor Epacadostat to M2 macrophages. Flow cytometry showed that the expression of CD11b and CD68 did not significantly change after treatment with Epacadostat (Figure 5a and b). However, the expression of CD86 increased (Figure 5c), and the expression of CD163 decreased (Figure 5d), suggesting that after IDO1 was inhibited, M2 macrophages transformed into M1 macrophages. The increase in CD86 protein expression and the decrease in CD163 and IDO1 protein expression also confirmed the above conclusion (Figure 5e). The IDO1 mRNA expression level was decreased (Figure 5F). The RT-qPCR assay showed that the mRNA expression levels of M1-related genes (iNOS, TNF-A and IL-1 β) were markedly increased (Figure 5g–i), while the mRNA expression levels of M2-related genes (Arg-1, TGF-β, and IL-10) were decreased (Figure 5j–L) (p<0.05).
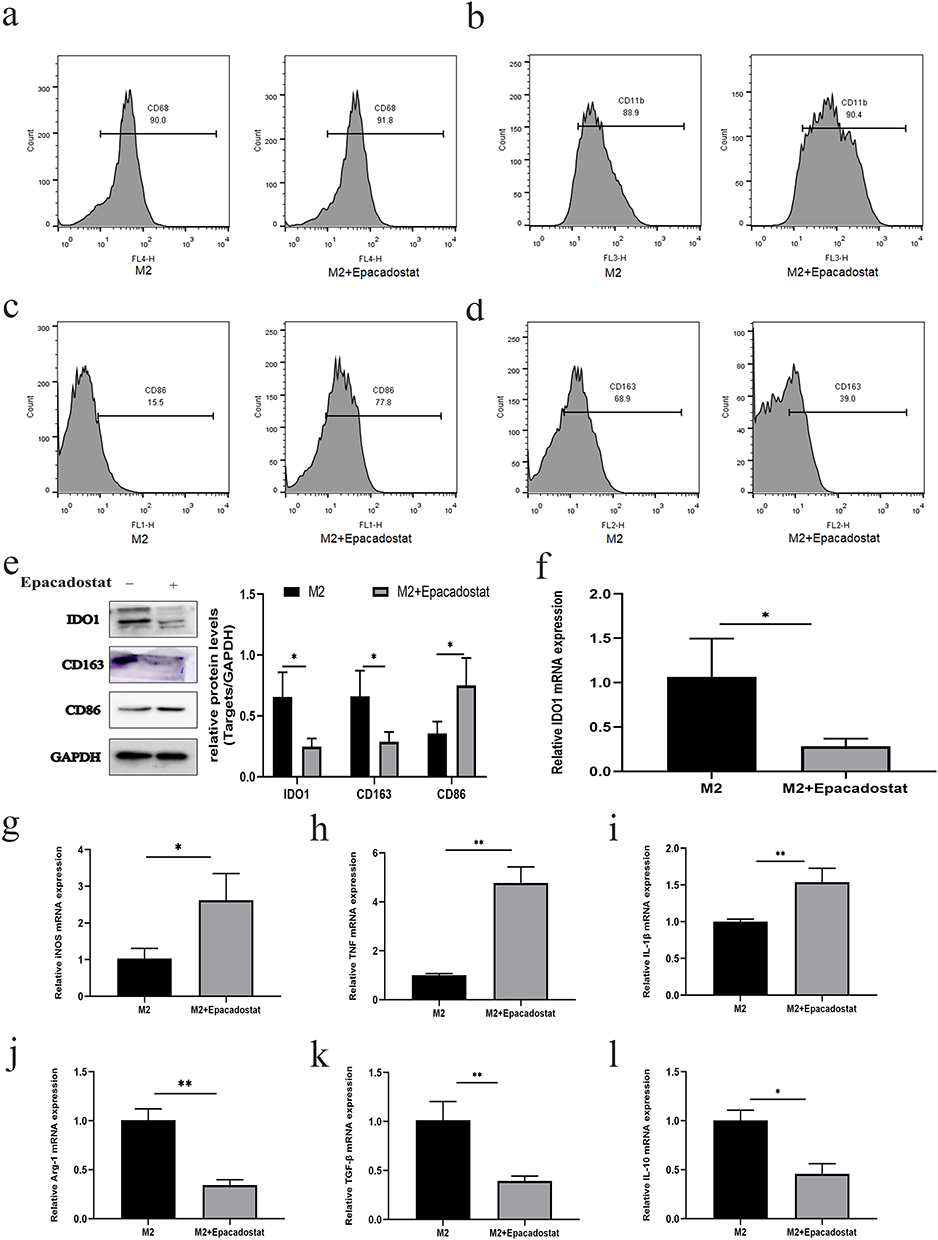 |
Figure 5 The effect of IDO1 expression on macrophage polarization. (a) The expression of CD11b by flow cytometry. (b) The expression of CD68 by flow cytometry. (c) The expression of CD86 by flow cytometry. (d) The expression of CD163 by flow cytometry. (e) The protein expression of CD86, CD163, and IDO1. (f) The IDO1 mRNA expression level. (g–l) The mRNA expression levels of M1-related genes (iNOS, TNF-a and IL-1β) and M2-related genes (Arg-1, TGF-β, and IL-10) (**p<0.01; *p<0.05). |
Effect of IDO1 on NSCLC Cells and M2 Macrophage Cocultures
To investigate the role of IDO1 in NSCLC, we established an in vitro coculture system of NSCLC and M2 macrophages. A549 and H1299 cells were cultured with M2 and M2 macrophages + Epacadostat, respectively. Western blotting was used to measure the expression of CD86, CD163 and IDO1 in H1299/A549 cells in different treatment groups. The expression levels of CD163 and IDO1 increased significantly, whereas the expression level of CD86 decreased in the coculture group. The changes described above could be reversed by adding Epacadostat, and the difference was statistically significant (Figure 6a and b).
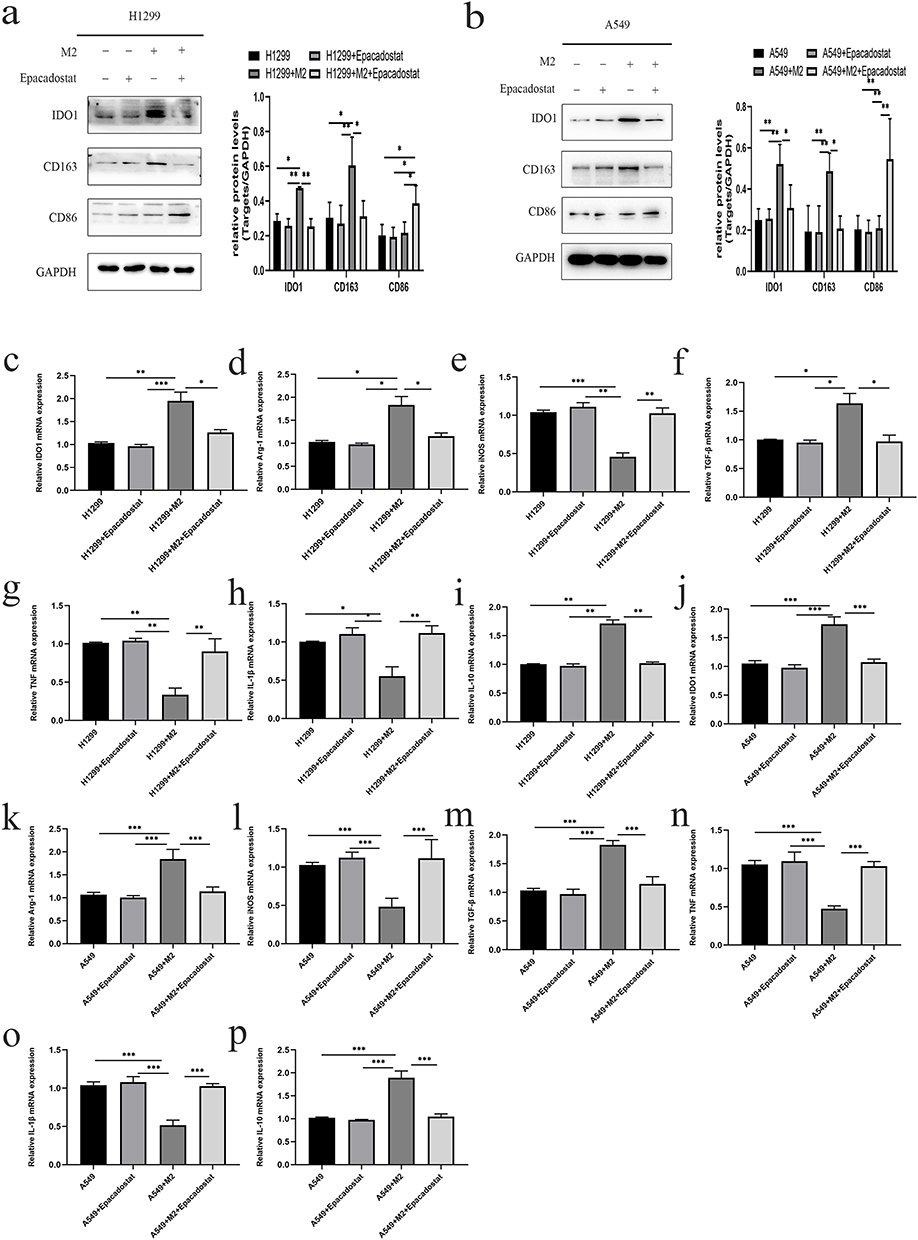 |
Figure 6 Effect of IDO1 expression on NSCLC cells cocultured with M2 macrophages. (a) The expression of CD86, CD163 and IDO1 in H1299 cells in i different treatment groups. (b) The expression of CD86, CD163 and IDO1 in A549 cells in different treatment groups. (c–p) The mRNA expression of IDO1, Arg-1, TGF-β, IL-10, IL-1β, iNOS and TNF-a in H1299/A549 cells in different treatment groups (***p<0.001; **p<0.01; *p<0.05). |
RT–qPCR was used to measure the expression of IDO1, Arg-1, TGF-β, IL-10, IL-1β, iNOS and TNF-A in the H1299/A549 cells in different treatment groups. After coculture with M2 macrophages, the expression levels of IDO1, Arg-1, TGF-β, and IL-10 were significantly increased, and the expression levels of IL-1β, iNOS and TNF-A were significantly decreased. After adding Epacadostat to the coculture system, the expression levels of IL-1β, iNOS and TNF-α were significantly increased, and the expression levels of IDO1, Arg-1, TGF-β, and IL-10 were significantly decreased (Figure 6c–p, p < 0.05).
IDO1 Promoted NSCLC Cell Proliferation, Migration, and Invasion
To evaluate the impact of IDO1 on NSCLC cells, A549 and H1299 cells were cocultured with M2 and M2 macrophages + Epacadostat, respectively. The number of colony-forming cells in the M2 coculture group was significantly higher than that in the H1299/A549 group. The number of colonies decreased after the addition of the inhibitor Epacadostat (Figure 7a and b) (p<0.05). To evaluate the effect of IDO1 on the proliferation of NSCLC cells, a CCK-8 proliferation assay was performed in H1299 and A549 cells. We found that the proliferation of H1299 and A549 cells in the M2 coculture group was higher than that in the H1299/A549 group at different time points. The proliferation decreased after the inhibitor Epacadostat was added (p<0.05), but there was no difference between the H1299/A549+ Epacadostat and H1299/A549 groups (Figure 7c and d) (p>0.05). We further investigated the effect of the inhibitor Epacadostat on the invasion and migration of H1299 and A549 cells. The migration experiment showed that the migration ability of cells cocultured with M2 macrophages was significantly increased (Figure 7e and f) (p<0.05). Similarly, the invasion experiments revealed that the invasion ability of H1299 and A549 cells cocultured with M2 macrophages was significantly elevated. However, the inhibitor Epacadostat reversed these changes (Figure 7g and h) (p<0.05). Wound healing experiments with H1299/A549 cells showed that the most significant cell migration was observed in cells cultured with M2 macrophages, and Epacadostat disrupted this migration (Figure 7i and j) (p<0.05).
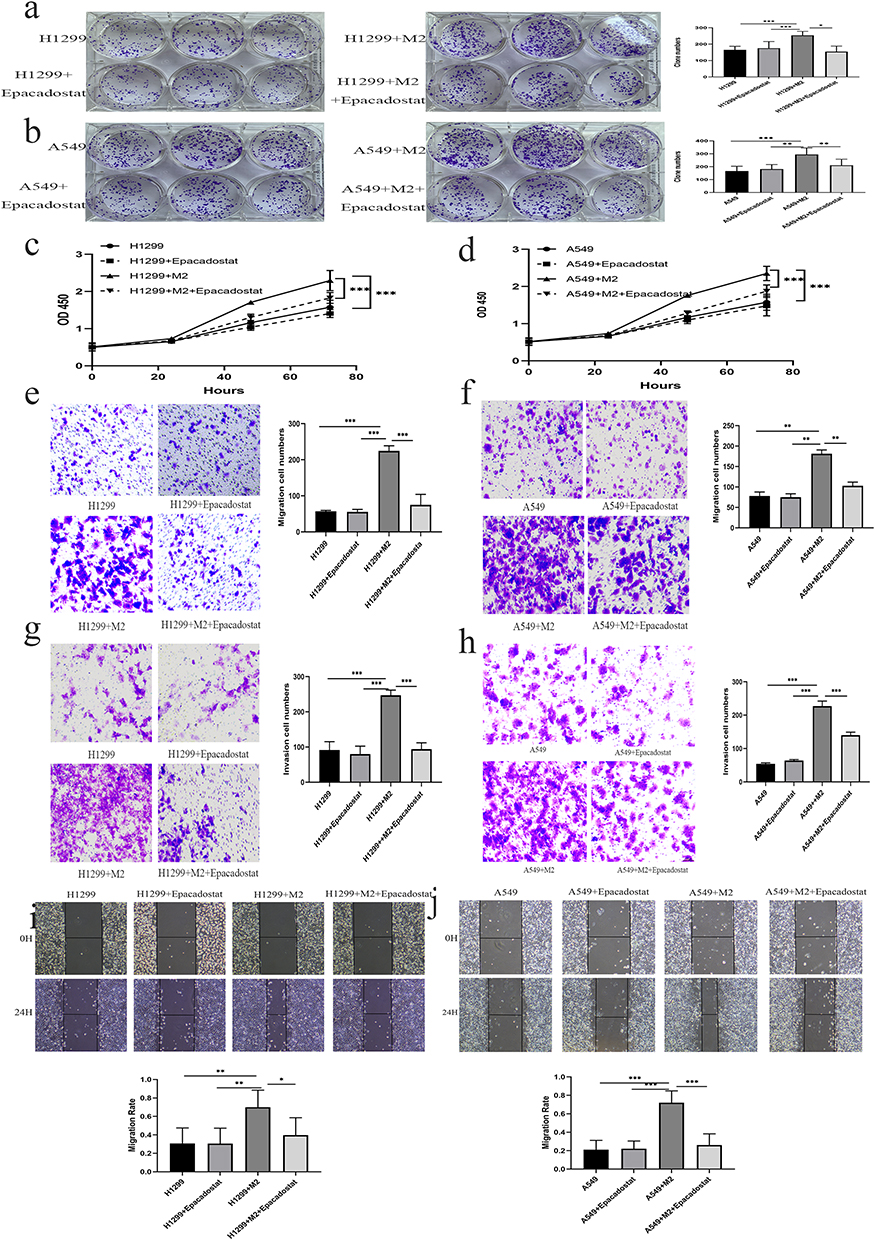 |
Figure 7 Effectiveness of IDO1 in regulating proliferation, migration, and invasion in NSCLC cells. (a and b) The number of colony-forming H1299/A549 cells was significantly increased by M2 macrophage coculture and decreased by Epacadostat, respectively. (c and d) The proliferation of H1299/A549 cells in different groups. (e–h) The metastasis and invasion abilities in H1299 and A549 cells of different groups. (i) and (j), Wound healing experiments with different groups of H1299 and A549 cells (*p < 0.05, **p < 0.01, ***p < 0.01). |
IDO1 Induces EMT and Inhibited the Apoptosis of NSCLC Cells in vitro
We measured the expression of the epithelial phenotype marker E-cadherin and the mesenchymal marker Vimentin. Figure shows that the expression of Vimentin in NSCLC cells cocultured with M2 macrophages was higher than that in NSCLC cells cultured without M2 macrophages, while the expression of E-cadherin was lower, indicating that EMT occurred in NSCLC cells cocultured with M2 macrophages. The expression of Vimentin decreased and that of E-cadherin increased in NSCLC cells cocultured with M2 macrophages and treated with Epacadostat, showing that Epacadostat inhibited EMT (Figure 8a and b).
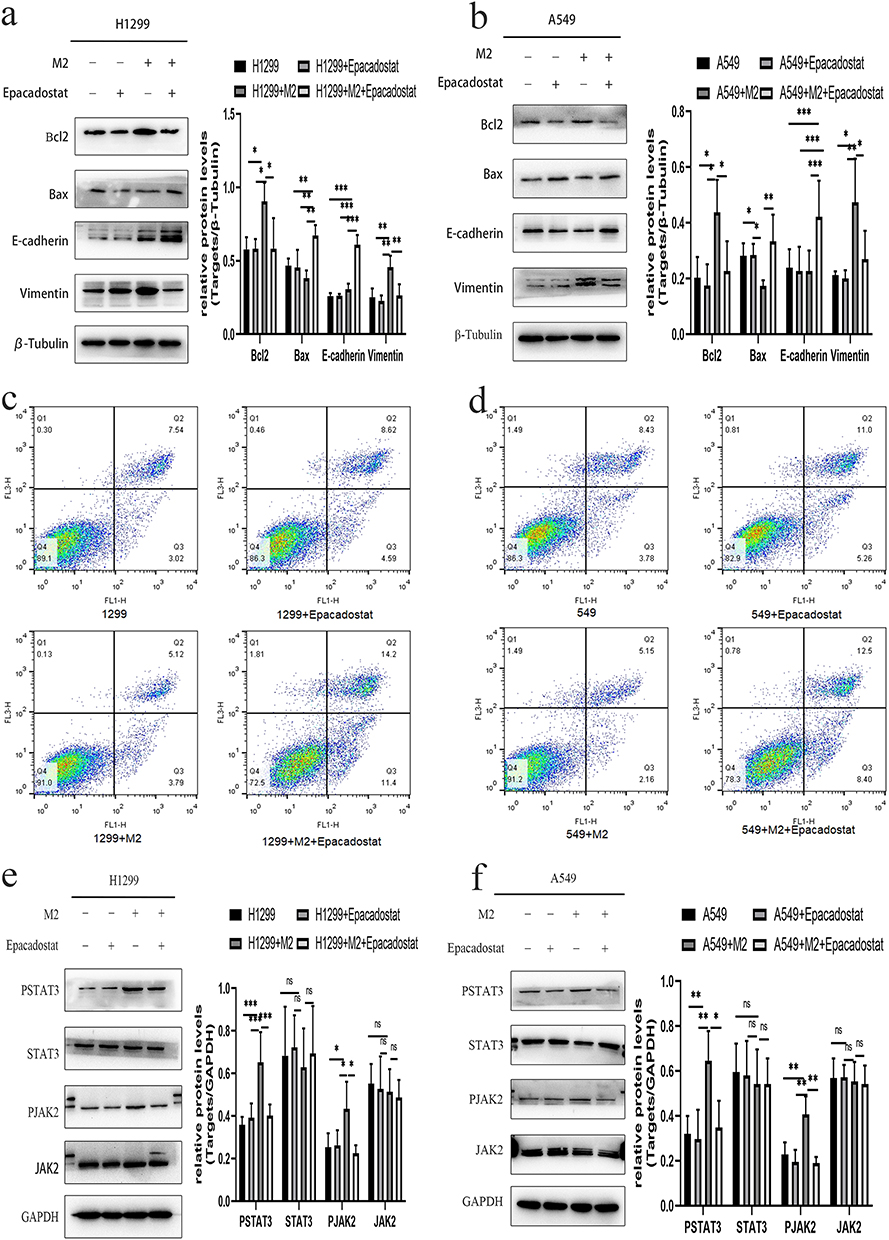 |
Figure 8 Effect of IDO1 in regulating apoptosis and EMT. (a)apoptosis-related and EMT-related marker expression in H1299 cells. (b) Apoptosis-related and EMT-related marker expression in A549 cells. (c) The apoptosis rates of H1299 cells. (d) The apoptosis rates of A549 cells. (e) The protein expression levels of JAK2 and STAT3 in H1299 cells. (f) The protein expression levels of JAK2 and STAT3 in A549 (***p<0.001; **p<0.01; *p<0.05). |
To evaluate the effect of IDO1 on apoptosis, we also verified the expression of apoptosis-related proteins (Bcl2 and Bax). The protein expression of Bcl2 in the M2 group significantly increased, and compared with that in the M2 group, the expression of Bcl2 in the M2+Epacadostat group decreased. However, the protein expression of Bax showed the opposite result (Figure 8a and b). To evaluate the effect of IDO1 on the apoptosis of NSCLC, flow cytometry assays were performed with H1299 and A549 cells. Compared with those of the H1299 and A549 groups, the apoptotic rates of the groups of H1299 and A549 cells cultured with M2 macrophages were significantly increased, and compared with those the M2 coculture group, the apoptotic rates in the M2+Epacadostat group were decreased (Figure 8c and d).
Macrophage IDO1-enhanced NSCLC cell progression was mediated by JAK2/STAT3.
In this experiment, we measured the expression of p-JAK2 and p-STAT3 in H1299/A549 cells after coculture M2 cells with or without Epacadostat by Western blotting. We found that the pattern of JAK2 and STAT3 phosphorylation was similar to the pattern observed for IDO1 expression in NSCLC cells cultured with M2 or M2 macrophages and Epacadostat. The results showed that compared with H1299/A549 cells cultured alone, the levels of p-JAK2 and p-STAT3 in the cells cocultured M2 macrophages were upregulated dramatically, whereas the levels were downregulated in cells cocultured with M2 macrophages and Epacadostat (Figure 8e and f).
Discussion
In recent decades, new treatments, such as minimally invasive surgery and targeted therapy, have been developed to treat lung cancer. However, the overall 5-year survival rate of patients with NSCLC is only 18%, especially for patients with advanced diseases.29 Different types of environmental, genetic, and metabolic factors are involved in the occurrence and spread of lung cancer. Research has shown that both p16 and glucose transporter protein (Glut1) are overexpressed in malignant lung cancer, which are potential prognostic factors and can serve as new targeted therapies.30 The critical role of the TME in regulating tumorigenesis, invasion and metastasis is widely accepted. Due to the lack of sufficient blood supply for the rapid growth of tumor cells, hypoxia is a common condition in tumor environments, and different hypoxia inducible factor (HIF) induction mechanisms can induce the progression and invasion of lung cancer.31 The achievements of immunotherapy in recent years have revealed the importance of immune response in tumor treatment, and demonstrated how TME affects anti-tumor response. Dendritic cells (DCs), macrophages, and B cells are often considered the most important antigen-presenting cells (APC) as they can provide for establishing effective T cell responses.32 TME permeates in different mature stages of DC and different subgroups of DC. Clinical studies have also shown that DCs in tumors can also exhibit functional differentiation and impaired activation, thereby affecting the anti-tumor immune response.33 TAMs, as the main tumor-infiltrating cells in the TME, play an important role in tumor growth, invasion, and metastasis.34 The strategy of M2 macrophage repolarization to the M1 phenotype may can enhance the antitumor response and improve therapeutic effects. Many studies have shown that the high expression of M2-related genes is related to the prognosis of NSCLC.35,36 SLC3A2 acted as a metabolic switch on LUAD cells to induce reprogramming of the macrophage phenotype through arachidonic acid (AA).37 The interaction between TAMs and NSCLC is very complex, so we should better understand the potential mechanism by which TAMs regulate the progression of NSCLC.
The function of TAMs is similar to that of M2 macrophages, and M2 macrophages are usually induced to mimic TAMs in vitro.38,39 The THP-1 cell line can be used as an in vitro cell model to study the functional regulation of monocytes and macrophages, and it can be used to study the effect of IDO1 expressed by macrophages on tumor cell invasion. This study also used PMA, IL-4 and IL-13 to stimulate THP-1 cells to differentiate into M2 macrophages. The frequency of CD163+ cells was detected by flow cytometry. Immunofluorescence also showed that the positive expression of CD163 in M2 macrophages. The results showed that after induction, the growth characteristics of THP-1 cells changed from suspension to adhesion, and the morphology changed from round to spindle-shaped. In addition, we confirmed that the expression of Arg-1, TGF-β, IL-10, and IL-1β in the differentiated cells was significantly increased by RT qPCR. All of these results confirmed the successful establishment of TAMs in vitro in the present study. In addition, to simulate the tumor microenvironment model, M2 macrophages were added to H1299 and A549 cells. The results showed that the proliferation and migration of H1299 and A549 cells were enhanced.
IDO1 is not expressed in most adult tissues under physiological conditions but is expressed in various tumor and immune cells in the tumor microenvironment.40 IDO1 participates in the development of drug resistance to immune checkpoint inhibitors,41 so the combination of IDO1 and checkpoint inhibitors may become a new strategy for cancer immunotherapy.42 A study showed that IDO1 and PD-L1 expression in tumor-infiltrating immune cells could be a prognostic biomarker for patients with MSI-high colon cancer.43 In clinical prostate cancer, the expression of IDO1 is upregulated, and this expression could protect tumors from effective immune control in prostate cancer patients.44 In LUSC, IDO1 expression is related to PD-L1 expression, and coexpression of IDO1 and PD-L1 may be an important target for immunotherapy.45 The functions of IDO1 in single NSCLC cells were explored using CancerSEA in our study. IDO1 function was mainly related to angiogenesis, DNA repair and metastasis. IDO1 expression was positively correlated with CD163 expression in cancer tissues (LUAD and LUSC) or lung cell lines, but the R-correlation was low. First, M2 macrophages have various surface markers (CD 68, CD163, CD206, EGF, Arg1, IL-10, TGF-β, Ym1, CCL20, CCL22), and CD163 is only one of them.46 Second, NSCLC has tumor heterogeneity. Third, IDO-1 activation is related to EMT-induced immunosuppression.47 Della found that tumors with high EMT scores expressed higher levels of IDO-1; similarly, they found that NSCLC cell lines (A549, H1299, H460) with high EMT scores produce higher IDO-1 transcript levels and display activation of PKC protein, a mediator of IDO-1 intracellular activation. These results suggest that the regulation of IDO-1 has a higher correlation in tumors undergoing EMT.48 For preclinical research, we can study co-expression of multiple markers and replicate these results in sub-groups of NSCLC (LUAD and LUSC) samples. Our study confirmed that IDO1 was highly expressed in M2 macrophages. CD163 (a surface marker of M2 macrophages) and IDO1 were coexpressed in the cell membrane and cytoplasm by immunofluorescence colocalization assay. Previous studies have suggested that IDO1 promotes the formation of many types of tumors. Therefore, we hypothesized that IDO1 expressed in macrophages may be involved in promoting NSCLC cell proliferation, migration, and invasion. Most of the studies focused on the effect of IDO1 on cancer cells, but there are few studies about whether it affects macrophages in the TME.
Currently, several IDO1 inhibitors are under clinical evaluation, and many of them are in phase II or III clinical trials.49 In patients with advanced solid tumors, Epacadostat plus pembrolizumab resulted in objective responses in 12 (55%) of 22 patients with melanoma, non–small cell lung cancer, renal cell carcinoma, endometrial adenocarcinoma, urothelial carcinoma, and squamous cell carcinoma of the head and neck. Epacadostat combined with pembrolizumab was generally well tolerated and showed encouraging antitumor activity in patients with multiple advanced solid tumors.23 In our study, we found that Epacadostat could inhibit M2 macrophage-induced proliferation, migration, invasion and EMT and promote apoptosis of NSCLC cells. Since the function of macrophages depends on their activation state (M1 or M2), we further studied the effect of IDO1 on macrophage polarization. We found that Epacadostat could regulate the polarization of macrophages, which could reduce the expression of CD163 (M2 phenotype marker) and increase the expression of CD86 (M1 phenotype marker). IDO1 can regulate and affect many signaling pathways, including the Janus kinase–signal transducer and activator of transcription (JAK–STAT), RAS–protein kinase C (RAS–PKC), nuclear factor kappa-light-chain enhancer of activated B cells (NF-κB), and Kit signaling pathways,13,50–53 but IDO1 specifically activated the JAK2/STAT3 signaling pathway in the present study. In a previous study, we showed that correlation analysis revealed a positive correlation between IDO1 expression and “HALLMARK_IL6_JAK_STAT3_SIGNALING” in LUAD and LUSC through bioinformatics analysis (R=0.52 and 0.526, respectively; p<0.001). Western blotting results showed that the expression of JAK2/STAT3 was increased when IDO1 expression was increased but decreased when Epacadostat was added. These results suggest that IDO1 may regulate macrophage polarization through the JAK2/STAT3 pathway. However, the specific molecular mechanism by which IDO1 regulates macrophage polarization requires further study. For preclinical research, ex-vitro model is a suitable and useful system for studying cancer immune dynamics. Future research should include an in vivo model of complete immunity mouse and other potential targets related to the IDO-1 signal.
In summary, our study suggested that IDO1 exerts a potential tumor-promoting effect in NSCLC with higher M2 macrophage infiltration. We observed that the levels of IDO1 and CD163 were correlated in NSCLC tissues, and they were independent prognostic markers of survival. In vitro coculture experiments showed that IDO1 could promote the proliferation, invasion, and metastasis of NSCLC, inhibit apoptosis, promote EMT, and regulate M2 macrophage polarization, and these effects may be mediated by the JAK2/STAT3 pathway. It was suggested that IDO1 inhibitors would be more effective in patients with M2 macrophage-infiltrated NSCLC, which could provide strong evidence for the future treatment of NSCLC with IDO1 inhibitors.
Conclusion
Taken together, these results show that elevated expression of IDO1 was found in M2-polarized macrophages and facilitated the migration and EMT of NSCLC cells by activating the JAK2/STAT3 signaling pathway. Our study highlights the importance of targeting the tumor microenvironment as a mechanism to inhibit NSCLC recurrence and metastasis.
Abbreviations
AA, arachidonic acid; APC, antigen-presenting cells; CCK8, Cell Counting Kit-8; CCLE, Cancer Cell Line Encyclopedia; DCs, Dendritic cells; FBS, fetal bovine serum; HRP, horseradish peroxidase; HIF, hypoxia inducible factor; IDO1, Indoleamine 2.3-dioxygenase 1; IHC; Immunohistochemistry; LPS, lipopolysaccharide; NSCLC, Non-small cell lung cancer; PMSF, phenylmethylsulfonyl fluoride; SD, standard deviation; siRNA, small interfering RNA; TAMs, Tumor-related macrophages; TCGA, The Cancer Genome Atlas; TME, tumor microenvironment.
Funding
This work was supported by grants from the Major Scientific and Technological Innovation Project of Shandong Province (2018CXGC1212), the CSCO-Qilu Cancer Research Fund (Y-Q201802-014), the Medical and Health Technology Innovation Plan of Jinan City (201805002), the traditional Chinese medicine science and technology project of Shandong Province (2021Q021).
Disclosure
The authors report no conflicts of interest in this work.
References
1. Li R, Yang YE, Yin YH, Zhang MY, Li H, Qu YQ. Methylation and transcriptome analysis reveal lung adenocarcinoma-specific diagnostic biomarkers. J Transl Med. 2019;17(1):324.
2. Caiola E, Frapolli R, Tomanelli M, et al. Wee1 inhibitor MK1775 sensitizes KRAS mutated NSCLC cells to sorafenib. Sci Rep. 2018;8(1):948. doi:10.1038/s41598-017-18900-y
3. Bamodu OA, Kuo KT, Wang CH, et al. Astragalus polysaccharides (PG2) enhances the M1 polarization of macrophages, functional maturation of dendritic cells, and T cell-mediated anticancer immune responses in patients with lung cancer. Nutrients. 2019;11(10). doi:10.3390/nu11102264
4. Du G, Zhao B, Zhang Y, et al. Hypothermia activates adipose tissue to promote malignant lung cancer progression. PLoS One. 2013;8(8):e72044. doi:10.1371/journal.pone.0072044
5. Chanmee T, Ontong P, Konno K, Itano N. Tumor-associated macrophages as major players in the tumor microenvironment. Cancers. 2014;6(3):1670–1690. doi:10.3390/cancers6031670
6. Murray PJ, Wynn TA. Protective and pathogenic functions of macrophage subsets. Nat Rev Immunol. 2011;11(11):723–737. doi:10.1038/nri3073
7. Mantovani A, Sozzani S, Locati M, Allavena P, Sica A. Macrophage polarization: tumor-associated macrophages as a paradigm for polarized M2 mononuclear phagocytes. Trends Immunol. 2002;23(11):549–555. doi:10.1016/S1471-4906(02)02302-5
8. Vitale I, Manic G, Coussens LM, Kroemer G, Galluzzi L. Macrophages and metabolism in the tumor microenvironment. Cell Metab. 2019;30(1):36–50. doi:10.1016/j.cmet.2019.06.001
9. Gabrilovich DI, Ostrand-Rosenberg S, Bronte V. Coordinated regulation of myeloid cells by tumours. Nat Rev Immunol. 2012;12(4):253–268. doi:10.1038/nri3175
10. Steidl C, Lee T, Shah SP, et al. Tumor-associated macrophages and survival in classic Hodgkin’s lymphoma. N Engl J Med. 2010;362(10):875–885. doi:10.1056/NEJMoa0905680
11. Munn DH, Mellor AL. Indoleamine 2,3-dioxygenase and tumor-induced tolerance. J Clin Invest. 2007;117(5):1147–1154. doi:10.1172/JCI31178
12. Katz JB, Muller AJ, Prendergast GC. Indoleamine 2,3-dioxygenase in T-cell tolerance and tumoral immune escape. Immunol Rev. 2008;222:206–221. doi:10.1111/j.1600-065X.2008.00610.x
13. Muller AJ, DuHadaway JB, Donover PS, Sutanto-Ward E, Prendergast GC. Inhibition of indoleamine 2,3-dioxygenase, an immunoregulatory target of the cancer suppression gene Bin1, potentiates cancer chemotherapy. Nat Med. 2005;11(3):312–319. doi:10.1038/nm1196
14. Okamoto A, Nikaido T, Ochiai K, et al. Indoleamine 2,3-dioxygenase serves as a marker of poor prognosis in gene expression profiles of serous ovarian cancer cells. Clin Cancer Res. 2005;11(16):6030–6039. doi:10.1158/1078-0432.CCR-04-2671
15. Ino K, Yoshida N, Kajiyama H, et al. Indoleamine 2,3-dioxygenase is a novel prognostic indicator for endometrial cancer. Br J Cancer. 2006;95(11):1555–1561. doi:10.1038/sj.bjc.6603477
16. Brandacher G, Perathoner A, Ladurner R, et al. Prognostic value of indoleamine 2,3-dioxygenase expression in colorectal cancer: effect on tumor-infiltrating T cells. Clin Cancer Res. 2006;12(4):1144–1151. doi:10.1158/1078-0432.CCR-05-1966
17. Wang XF, Wang HS, Wang H, et al. The role of indoleamine 2,3-dioxygenase (IDO) in immune tolerance: focus on macrophage polarization of THP-1 cells. Cell Immunol. 2014;289(1–2):42–48. doi:10.1016/j.cellimm.2014.02.005
18. Munn DH, Mellor AL. IDO in the tumor microenvironment: inflammation, counter-regulation, and tolerance. Trends Immunol. 2016;37(3):193–207. doi:10.1016/j.it.2016.01.002
19. Routy JP, Routy B, Graziani GM, Mehraj V. The kynurenine pathway is a double-edged sword in immune-privileged sites and in cancer: implications for immunotherapy. Int J Tryptophan Res. 2016;9:67–77. doi:10.4137/IJTR.S38355
20. Hornyak L, Dobos N, Koncz G, et al. The role of indoleamine-2,3-dioxygenase in cancer development, diagnostics, and therapy. Front Immunol. 2018;9:151. doi:10.3389/fimmu.2018.00151
21. Grohmann U, Fallarino F, Bianchi R, et al. A defect in tryptophan catabolism impairs tolerance in nonobese diabetic mice. J Exp Med. 2003;198(1):153–160. doi:10.1084/jem.20030633
22. Schmidt SK, Ebel S, Keil E, et al. Regulation of IDO activity by oxygen supply: inhibitory effects on antimicrobial and immunoregulatory functions. PLoS One. 2013;8(5):e63301. doi:10.1371/journal.pone.0063301
23. Mitchell TC, Hamid O, Smith DC, et al. Epacadostat plus pembrolizumab in patients with advanced solid tumors: phase i results from a multicenter, open-label Phase I/II trial (ECHO-202/KEYNOTE-037). J Clin Oncol. 2018;36(32):3223–3230. doi:10.1200/JCO.2018.78.9602
24. Thomas SR, Salahifar H, Mashima R, Hunt NH, Richardson DR, Stocker R. Antioxidants inhibit indoleamine 2,3-dioxygenase in IFN-gamma-activated human macrophages: posttranslational regulation by pyrrolidine dithiocarbamate. J Immunol. 2001;166(10):6332–6340. doi:10.4049/jimmunol.166.10.6332
25. Yuan H, Yan M, Zhang G, et al. CancerSEA: a cancer single-cell state atlas. Nucleic Acids Res. 2019;47(D1):D900–D908. doi:10.1093/nar/gky939
26. Navarro Gonzalez J, Zweig AS, Speir ML, et al. The UCSC genome browser database: 2021 update. Nucleic Acids Res. 2021;49(D1):D1046–D1057. doi:10.1093/nar/gkaa1070
27. Nusinow DP, Szpyt J, Ghandi M, et al. Quantitative proteomics of the cancer cell line encyclopedia. Cell. 2020;180(2):387–402.e16. doi:10.1016/j.cell.2019.12.023
28. Lambrechts D, Wauters E, Boeckx B, et al. Phenotype molding of stromal cells in the lung tumor microenvironment. Nat Med. 2018;24(8):1277–1289. doi:10.1038/s41591-018-0096-5
29. Liu X, Li C, Yang Y, et al. Synaptotagmin 7 in twist-related protein 1-mediated epithelial - mesenchymal transition of non-small cell lung cancer. EBioMedicine. 2019;46:42–53. doi:10.1016/j.ebiom.2019.07.071
30. Pezzuto A, D’Ascanio M, Ricci A, Pagliuca A, Carico E. Expression and role of p16 and GLUT1 in malignant diseases and lung cancer: a review. Thorac Cancer. 2020;11(11):3060–3070. doi:10.1111/1759-7714.13651
31. Pezzuto A, Carico E. Role of HIF-1 in cancer progression: novel insights. A review. Curr Mol Med. 2018;18(6):343–351. doi:10.2174/1566524018666181109121849
32. Verneau J, Sautés-Fridman C, Sun CM. Dendritic cells in the tumor microenvironment: prognostic and theranostic impact. Semin Immunol. 2020;48:101410. doi:10.1016/j.smim.2020.101410
33. Hargadon KM, Bishop JD, Brandt JP, Hand ZC, Ararso YT, Forrest OA. Melanoma-derived factors alter the maturation and activation of differentiated tissue-resident dendritic cells. Immunol Cell Biol. 2016;94(1):24–38. doi:10.1038/icb.2015.58
34. Wang A, Lu C, Ning Z, et al. Tumor-associated macrophages promote Ezrin phosphorylation-mediated epithelial-mesenchymal transition in lung adenocarcinoma through FUT4/LeY up-regulation. Oncotarget. 2017;8(17):28247–28259. doi:10.18632/oncotarget.16001
35. Jackute J, Zemaitis M, Pranys D, et al. Distribution of M1 and M2 macrophages in tumor islets and stroma in relation to prognosis of non-small cell lung cancer. BMC Immunol. 2018;19(1):3. doi:10.1186/s12865-018-0241-4
36. Ohtaki Y, Ishii G, Nagai K, et al. Stromal macrophage expressing CD204 is associated with tumor aggressiveness in lung adenocarcinoma. J Thorac Oncol. 2010;5(10):1507–1515. doi:10.1097/JTO.0b013e3181eba692
37. Li Z, Chen S, He X, Gong S, Sun L, Weng L. SLC3A2 promotes tumor-associated macrophage polarization through metabolic reprogramming in lung cancer [published online ahead of print, 2023 Feb 15]. Cancer Sci. 2023. doi:10.1111/cas.15760
38. Yuan S, Dong Y, Peng L, et al. Tumor-associated macrophages affect the biological behavior of lung adenocarcinoma A549 cells through the PI3K/AKT signaling pathway. Oncol Lett. 2019;18(2):1840–1846. doi:10.3892/ol.2019.10483
39. Tjiu JW, Chen JS, Shun CT, et al. Tumor-associated macrophage-induced invasion and angiogenesis of human basal cell carcinoma cells by cyclooxygenase-2 induction. J Invest Dermatol. 2009;129(4):1016–1025. doi:10.1038/jid.2008.310
40. Liu M, Wang X, Wang L, et al. Targeting the IDO1 pathway in cancer: from bench to bedside. J Hematol Oncol. 2018;11(1):100. doi:10.1186/s13045-018-0644-y
41. Holmgaard RB, Zamarin D, Munn DH, Wolchok JD, Allison JP. Indoleamine 2,3-dioxygenase is a critical resistance mechanism in antitumor T cell immunotherapy targeting CTLA-4. J Exp Med. 2013;210(7):1389–1402. doi:10.1084/jem.20130066
42. Marin-Acevedo JA, Dholaria B, Soyano AE, Knutson KL, Chumsri S, Lou Y. Next generation of immune checkpoint therapy in cancer: new developments and challenges. J Hematol Oncol. 2018;11(1):39. doi:10.1186/s13045-018-0582-8
43. Lee SJ, Jun SY, Lee IH, et al. CD274, LAG3, and IDO1 expressions in tumor-infiltrating immune cells as prognostic biomarker for patients with MSI-high colon cancer. J Cancer Res Clin Oncol. 2018;144(6):1005–1014. doi:10.1007/s00432-018-2620-x
44. Fischer KR, Durrans A, Lee S, et al. Epithelial-to-mesenchymal transition is not required for lung metastasis but contributes to chemoresistance. Nature. 2015;527(7579):472–476. doi:10.1038/nature15748
45. Takada K, Kohashi K, Shimokawa M, et al. Co-expression of IDO1 and PD-L1 in lung squamous cell carcinoma: potential targets of novel combination therapy. Lung Cancer. 2019;128:26–32. doi:10.1016/j.lungcan.2018.12.008
46. Najafi M, Hashemi Goradel N, Farhood B, et al. Macrophage polarity in cancer: a review. J Cell Biochem. 2019;120(3):2756–2765. doi:10.1002/jcb.27646
47. Kudo-Saito C, Shirako H, Takeuchi T, Kawakami Y. Cancer metastasis is accelerated through immunosuppression during snail-induced EMT of cancer cells. Cancer Cell. 2009;15:195–206. doi:10.1016/j.ccr.2009.01.023
48. Della Corte CM, Ciaramella V, Ramkumar K, et al. Triple blockade of ido-1, PD-L1 and MEK as a potential therapeutic strategy in NSCLC. J Transl Med. 2022;20(1):541. doi:10.1186/s12967-022-03730-y
49. Jung KH, LoRusso P, Burris H, et al. Phase I Study of the Indoleamine 2,3-Dioxygenase 1 (IDO1) Inhibitor Navoximod (GDC-0919) administered with PD-L1 inhibitor (atezolizumab) in advanced solid tumors. Clin Cancer Res. 2019;25(11):3220–3228. doi:10.1158/1078-0432.CCR-18-2740
50. Balachandran VP, Cavnar MJ, Zeng S, et al. Imatinib potentiates antitumor T cell responses in gastrointestinal stromal tumor through the inhibition of ido. Nat Med. 2011;17(9):1094–1100. doi:10.1038/nm.2438
51. Metz R, Rust S, Duhadaway JB, et al. IDO inhibits a tryptophan sufficiency signal that stimulates mTOR: a novel IDO effector pathway targeted by D-1-methyl-tryptophan. Oncoimmunology. 2012;1(9):1460–1468. doi:10.4161/onci.21716
52. Li Q, Harden JL, Anderson CD, Egilmez NK. Tolerogenic phenotype of IFN-gamma-induced IDO+ dendritic cells is maintained via an autocrine IDO-kynurenine/AhR-IDO loop. J Immunol. 2016;197(3):962–970. doi:10.4049/jimmunol.1502615
53. Munn DH, Sharma MD, Baban B, et al. GCN2 kinase in T cells mediates proliferative arrest and anergy induction in response to indoleamine 2,3-dioxygenase. Immunity. 2005;22(5):633–642. doi:10.1016/j.immuni.2005.03.013
 © 2023 The Author(s). This work is published and licensed by Dove Medical Press Limited. The full terms of this license are available at https://www.dovepress.com/terms.php and incorporate the Creative Commons Attribution - Non Commercial (unported, v3.0) License.
By accessing the work you hereby accept the Terms. Non-commercial uses of the work are permitted without any further permission from Dove Medical Press Limited, provided the work is properly attributed. For permission for commercial use of this work, please see paragraphs 4.2 and 5 of our Terms.
© 2023 The Author(s). This work is published and licensed by Dove Medical Press Limited. The full terms of this license are available at https://www.dovepress.com/terms.php and incorporate the Creative Commons Attribution - Non Commercial (unported, v3.0) License.
By accessing the work you hereby accept the Terms. Non-commercial uses of the work are permitted without any further permission from Dove Medical Press Limited, provided the work is properly attributed. For permission for commercial use of this work, please see paragraphs 4.2 and 5 of our Terms.