Back to Journals » Nature and Science of Sleep » Volume 14
Idling for Decades: A European Study on Risk Factors Associated with the Delay Before a Narcolepsy Diagnosis
Authors Zhang Z ![]() , Dauvilliers Y
, Dauvilliers Y ![]() , Plazzi G
, Plazzi G ![]() , Mayer G, Lammers GJ, Santamaria J, Partinen M, Overeem S
, Mayer G, Lammers GJ, Santamaria J, Partinen M, Overeem S ![]() , del Rio Villegas R
, del Rio Villegas R ![]() , Sonka K
, Sonka K ![]() , Peraita-Adrados R
, Peraita-Adrados R ![]() , Heinzer R, Wierzbicka A, Högl B, Manconi M
, Heinzer R, Wierzbicka A, Högl B, Manconi M ![]() , Feketeova E, da Silva AM, Bušková J
, Feketeova E, da Silva AM, Bušková J ![]() , Bassetti CLA, Barateau L, Pizza F
, Bassetti CLA, Barateau L, Pizza F ![]() , Antelmi E, Gool JK, Fronczek R
, Antelmi E, Gool JK, Fronczek R ![]() , Gaig C, Khatami R
, Gaig C, Khatami R ![]()
Received 14 February 2022
Accepted for publication 3 May 2022
Published 31 May 2022 Volume 2022:14 Pages 1031—1047
DOI https://doi.org/10.2147/NSS.S359980
Checked for plagiarism Yes
Review by Single anonymous peer review
Peer reviewer comments 2
Editor who approved publication: Dr Sarah L Appleton
Zhongxing Zhang,1 Yves Dauvilliers,2– 4 Giuseppe Plazzi,5,6 Geert Mayer,7 Gert Jan Lammers,8,9 Joan Santamaria,10 Markku Partinen,11 Sebastiaan Overeem,12,13 Rafael del Rio Villegas,14 Karel Sonka,15 Rosa Peraita-Adrados,16 Raphaël Heinzer,17 Aleksandra Wierzbicka,18 Birgit Högl,19 Mauro Manconi,20 Eva Feketeova,21 Antonio Martins da Silva,22 Jitka Bušková,23 Claudio LA Bassetti,24,25 Lucie Barateau,2– 4 Fabio Pizza,5,26 Elena Antelmi,5,6 Jari K Gool,8,9 Rolf Fronczek,8,9 Carles Gaig,10 Ramin Khatami1,24
1Center for Sleep Medicine, Sleep Research and Epileptology, Klinik Barmelweid AG, Barmelweid, Aargau, Switzerland; 2Sleep-Wake Disorders Unit, Department of Neurology, Gui-de-Chauliac Hospital, CHU Montpellier, Montpellier, France; 3National Reference Centre for Orphan Diseases, Narcolepsy, Idiopathic Hypersomnia, and Kleine-Levin Syndrome, Montpellier, France; 4Institute for Neurosciences of Montpellier INM, Univ Montpellier, INSERM, Montpellier, France; 5Department of Biomedical, Metabolic and Neural Sciences, University of Modena and Reggio Emilia, Modena, Italy; 6IRCCS Istituto delle Scienze Neurologiche di Bologna, Bologna, Italy; 7Neurology Department, Hephata Klinik, Schwalmstadt, Germany; 8Sleep Wake Center SEIN Heemstede, Stichting Epilepsie Instellingen Nederland, Heemstede, the Netherlands; 9Department of Neurology and Clinical Neurophysiology, Leiden University Medical Center, Leiden, the Netherlands; 10Neurology Service, Institut de Neurociències Hospital Clínic, University of Barcelona, Barcelona, Spain; 11Helsinki Sleep Clinic, Vitalmed Research Center, Helsinki, Finland; 12Sleep Medicine Center Kempenhaeghe, Heeze, the Netherlands; 13Eindhoven University of Technology, Eindhoven, the Netherlands; 14Neurophysiology and Sleep Disorders Unit, Hospital Vithas Nuestra Señora de América, Madrid, Spain; 15Neurology Department and Centre of Clinical Neurosciences, First Faculty of Medicine, Charles University and General University Hospital, Prague, Czech Republic; 16Sleep and Epilepsy Unit – Clinical Neurophysiology Service, University General Hospital Gregorio Marañón, Research Institute Gregorio Marañón, University Complutense of Madrid, Madrid, Spain; 17Center for Investigation and Research in Sleep, Lausanne University Hospital, Lausanne, Vaud, Switzerland; 18Department of Clinical Neurophysiology, Institute of Psychiatry and Neurology, Warsaw, Poland; 19Neurology Department, Sleep Disorders Clinic, Innsbruck Medical University, Innsbruck, Austria; 20Neurology Department, EOC, Ospedale Regionale di Lugano, Lugano, Ticino, Switzerland; 21Neurology Department, Medical Faculty of P. J. Safarik University, University Hospital of L. Pasteur Kosice, Kosice, Slovak Republic; 22Serviço de Neurofisiologia, Hospital Santo António/Centro Hospitalar Universitário do Porto and UMIB-Instituto Ciências Biomédicas Abel Salazar, Universidade do Porto, Porto, Portugal; 23Department of Sleep Medicine, National Institute of Mental Health, Klecany, Czech Republic; 24Department of Neurology, Inselspital, Bern University Hospital, University of Bern, Bern, Switzerland; 25Department of Neurology, Sechenov First Moscow State University, Moscow, Russia; 26Department of Biomedical and Neuromotor Sciences, University of Bologna, Bologna, Italy
Correspondence: Yves Dauvilliers, National Reference Network for Narcolepsy, Sleep-Disorders Center, Department of Neurology, Hopital Gui de Chauliac, INSERM U1061, Montpellier, UM1, France, Email [email protected] Ramin Khatami, Center for Sleep Medicine, Sleep Research and Epileptology, Klinik Barmelweid AG, Barmelweid, CH-5017, Switzerland, Email [email protected]
Purpose: Narcolepsy type-1 (NT1) is a rare chronic neurological sleep disorder with excessive daytime sleepiness (EDS) as usual first and cataplexy as pathognomonic symptom. Shortening the NT1 diagnostic delay is the key to reduce disease burden and related low quality of life. Here we investigated the changes of diagnostic delay over the diagnostic years (1990– 2018) and the factors associated with the delay in Europe.
Patients and Methods: We analyzed 580 NT1 patients (male: 325, female: 255) from 12 European countries using the European Narcolepsy Network database. We combined machine learning and linear mixed-effect regression to identify factors associated with the delay.
Results: The mean age at EDS onset and diagnosis of our patients was 20.9± 11.8 (mean ± standard deviation) and 30.5± 14.9 years old, respectively. Their mean and median diagnostic delay was 9.7± 11.5 and 5.3 (interquartile range: 1.7− 13.2 years) years, respectively. We did not find significant differences in the diagnostic delay over years in either the whole dataset or in individual countries, although the delay showed significant differences in various countries. The number of patients with short (≤ 2-year) and long (≥ 13-year) diagnostic delay equally increased over decades, suggesting that subgroups of NT1 patients with variable disease progression may co-exist. Younger age at cataplexy onset, longer interval between EDS and cataplexy onsets, lower cataplexy frequency, shorter duration of irresistible daytime sleep, lower daytime REM sleep propensity, and being female are associated with longer diagnostic delay.
Conclusion: Our findings contrast the results of previous studies reporting shorter delay over time which is confounded by calendar year, because they characterized the changes in diagnostic delay over the symptom onset year. Our study indicates that new strategies such as increasing media attention/awareness and developing new biomarkers are needed to better detect EDS, cataplexy, and changes of nocturnal sleep in narcolepsy, in order to shorten the diagnostic interval.
Keywords: cataplexy, diagnostic delay, misdiagnosis, symptom onset, machine learning
Introduction
Narcolepsy is a chronic neurological sleep disorder and considered a rare disease with an estimated prevalence of 0.02–0.07% worldwide.1,2 Irresistible or imperative excessive daytime sleepiness (EDS) is usually the first noticed symptom of narcolepsy.3 Classic narcolepsy which is now termed narcolepsy type-1 (NT1) according to the International Classification of Sleep Disorders (ICSD-3),4 is characterized by the presence of EDS and either cataplexy and positive multiple sleep latency criteria, or low or absent cerebrospinal fluid hypocretin levels.1,4 Most NT1 patients have a delay up to several years or even decades between symptom onset and correct diagnosis, although few NT1 patients can sometimes have an acute course in which the symptoms develop within weeks after a trigger event like Pandemrix vaccination that may lead to shortening diagnosis delay.1,5,6 The long diagnostic delay in narcolepsy may lead to a substantial medical and socioeconomic burden caused by misdiagnosis, inappropriate medication exposure, multiple clinical visits, reductions in patients’ quality of life and productivity, poor school performance, increased unemployment, absenteeism, and adverse impact on patients’ family, etc.7,8
Shortening the delay of NT1 diagnosis is one of the major goals of awareness campaigns and efforts invested in narcolepsy medicine/research in the past decades. A shorter delay to NT1 diagnosis may improve future diagnostic procedures and disease management, and even impact decision makers in the healthcare system/industry. In Figure 1 we summarized the reported diagnostic delays of previous studies conducted in different countries.9–21 A trend toward a shorter diagnostic delay over time has been suggested.7 However, the data shown in Figure 1 may have been influenced by confounders such as differences among countries, including different diagnostic procedures due to country-specific healthcare systems,3 socio-economic factors such as lifestyles (eg, daytime nap culture in some countries may help to reduce EDS), environmental and genetic factors1 among these countries. Some studies modeled the changes of diagnostic delay over the year of symptom onset using regression models and found a decreasing trend in the diagnostic delay.7,12,17 However, these results are strongly biased by an inappropriate selection of the independent variable, ie, the year of symptom onset. Patients with onset of symptoms in recent years included in the regression analysis could only be those with relatively short diagnostic delays. Patients with relatively longer diagnostic delays were naturally excluded from those studies because they have not yet been diagnosed, ie, these “future patients” will be diagnosed later. Thus, whether the diagnostic delay of NT1 is really getting shorter over time is essentially unknown.
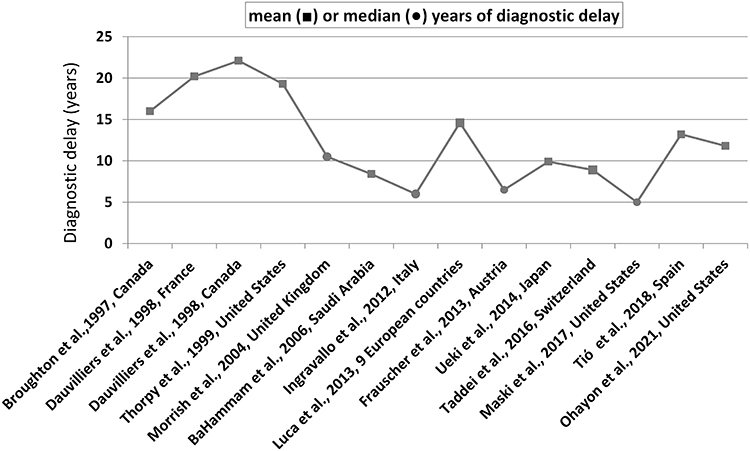 |
Figure 1 The mean or median of diagnostic delay in some reported studies in the last three decades. |
Therefore, in this pan-European study we aimed to investigate 1) the diagnostic delay of NT1 in various countries, 2) the change of diagnostic delay over the past 30 years, and 3) factors associated with the diagnostic delay. We used the database of European Narcolepsy Network (EUNN), an association of 21 leading European sleep centers that launched the first prospective European web-based database for narcolepsy and other central hypersomnolence disorders.3,22,23 The large number of patients across different European countries provided us an appropriate database to consider multiple contributing determinants.
Materials and Methods
The EUNN database accommodates continuous large-scale standardized collection of 317 variables related to clinical symptoms (eg, EDS characteristics, cataplexy features, sleep drunkenness, sleep paralysis, and hypnagogic hallucinations), objective sleep-wake laboratory measures including polysomnography (PSG) and multiple sleep latency test (MSLT), biomarkers (eg, hypocretin-1 levels and HLA-DQB1*0602), subjective measures on sleep-wake patterns and quality, and demographics.3 Each center of EU-NN obtained ethical approval for publishing the patients’ data for scientific purpose by a national Institutional Review Board before entering patients’ data. The scientific review committee of EU-NN approved the study protocol. All patients provided their informed consent for their data to be entered into the EU-NN database and for their data to be used for scientific studies. This study was approved by the ethical committee of canton Aargau, Switzerland.
Selection of Patients
Patients with NT1 were diagnosed according to the ICSD-3.4 We chose the year of EDS onset as disease onset, as EDS in general is the first symptom of narcolepsy to develop. The selection of patients is illustrated in Figure 2. The EU-NN database contains a variable on certainty of clinical diagnosis. The clinicians were asked to rate their diagnostic certainty on a 3-level scale (probable, possible, and definite). Only NT1 patients with definite diagnosis were included in this study. In rare cases patients may have EDS after diagnosis, ie, those patients may have other symptoms and/or low CSF hypocretin-1 concentration without EDS before diagnosis. Those patients were excluded from our analysis. Patients diagnosed before 1990s were also excluded considering the small number. Finally, 580 patients (male: 325, female: 255; mean diagnostic delay 9.7±11.5 years, median delay 5.3 years with interquartile range (IQR) 1.7–13.2 years, minimum 0 year and maximum 29.4 years; BMI: 27±5.8; Epworth Sleepiness Scale [ESS]: 16.7±4.0) diagnosed between 1990 and 2018 from 20 centers were selected. We grouped the patients according to their countries in which the diagnoses were made. They were from 12 countries including Austria (n=11), Poland (n=16), Portugal (n=4), Slovakia (n=8), Czech Republic (n=22), Finland (n=42), France (n=116), Germany (n=70), Italy (n=113), the Netherlands (n=56), Spain (n=86), and Switzerland (n=36).
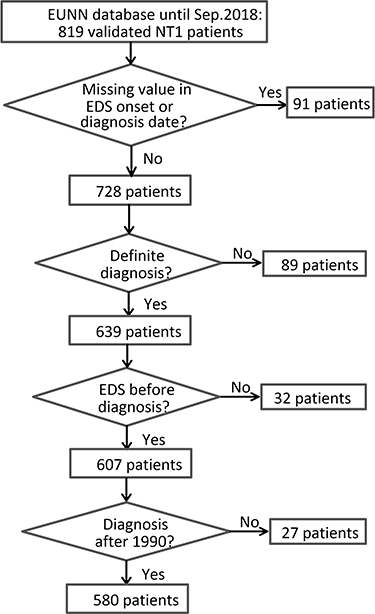 |
Figure 2 The flowchart of the selection of NT1 patients (both children and adults) for analysis. |
We then analyzed 1) whether the diagnostic delay was shortened in the past decades using null hypothesis testing and by comparing the number of patients with short and long delay; and 2) the factors contributing to the delay using machine learning and regression analysis. The cut-offs of short and long delays were decided based on the distribution of the delays, ie, below the 1st quartile and larger than the 3rd quartile.
Null Hypothesis Testing
Unlike the analyses done in previous studies that compared the delays between “patients starting EDS in different years”, we chose to compare the delays between “patients diagnosed in different years”. Such analyses have two advantages:
1) it is less influenced by selection bias because in reality sleep centers usually diagnose patients with different lengths of diagnostic delays in each year. The selection bias in previous studies can be best explained by giving an example. Assuming we aimed to compare the diagnostic delay of all NT1 patients who had symptom onset between 2016 and 2019, in a database of early 2021 the available data can only include those patients diagnosed by the end of 2020. In such a database, patients with symptom onset in 2016 may be diagnosed in any year between 2016 and 2020, resulting in diagnostic delays ranging from 0 to 4 years. In other words, when the data of the independent variable (year of symptom onset) are 2016, 2017, 2018 and 2019, the corresponding values of the dependent variable (diagnostic delay) are limited to respectively zero to four, zero to three, zero to two and zero to one, which obviously inherently supports a decreasing trend.
2) If we assume that the diagnostic delay did not change in the past years, the mean/median of the delays of patients diagnosed in each year should be the same. Thus, this was a null hypothesis for statistical tests.
The data were expressed as means ± standard deviation (std.) unless indicated otherwise. The methods of statistical analysis were chosen based on the distributions of the data. The time-to-event data followed an exponential distribution,24 which was also the case for our data of diagnostic delay (Figure 3). Therefore, the raw diagnostic delays between patients diagnosed in different years were compared using the non-parametric Kruskal–Wallis rank sum test. Post hoc pairwise comparisons were done using the non-parametric Conover’s test with P-values adjusted by Benjamini and Hochberg method. The same tests were also applied to the stratified data, ie, the diagnostic years were stratified to 1990–1999 (n=47), 2000–2009 (n=164), 2010–2013 (n=234) and 2014–2018 (n=135). We stratified the raw data because: 1) it can yield a larger number of patients in each subgroup thus leading to higher statistical power; 2) significantly increased number of acute NT1 post 2009–2010 H1N1 influenza pandemic was widely reported including in European countries.5,6,23 Those patients were characterized by quick disease deterioration and usually diagnosed soon after symptom onset.25 Thus, we could expect that the diagnostic delay in subgroup 2010–2013 was likely to be shortened compared to the other subgroups.
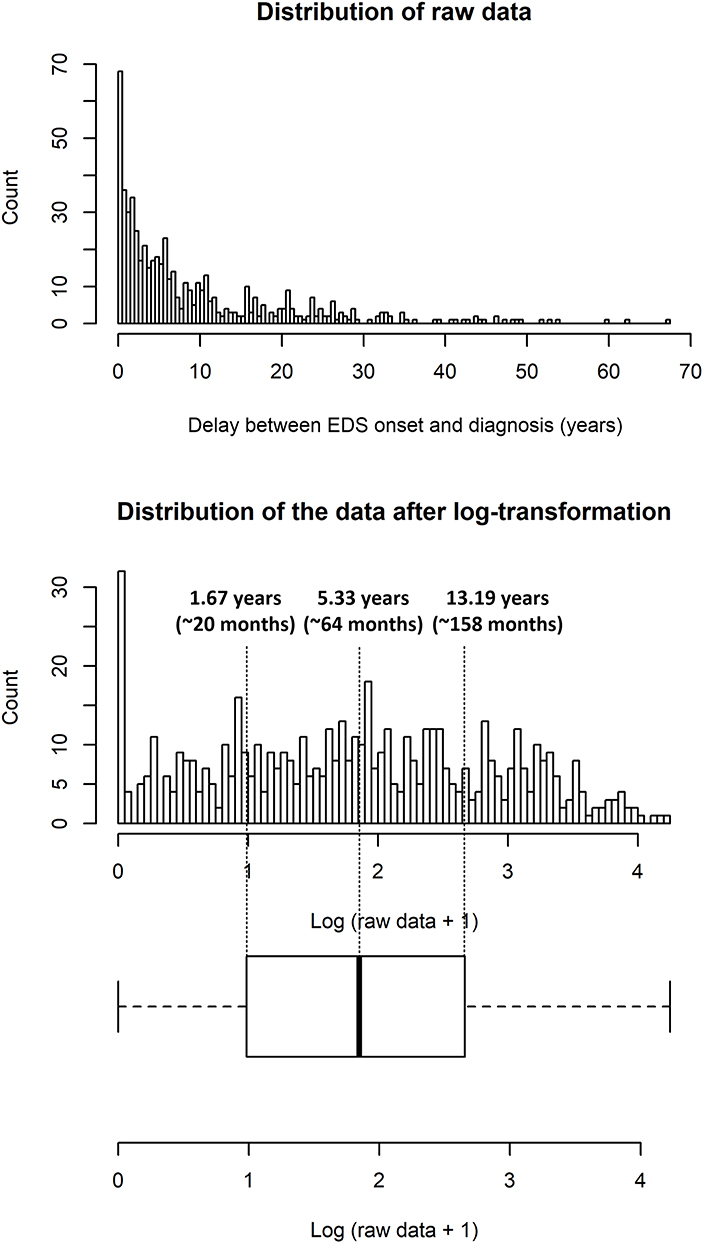 |
Figure 3 The distribution of raw data of diagnostic delay and the log-transformation of the raw data. |
Country difference was first considered using Wilcoxon rank sum test to compare the diagnostic delay between 2000s and 2010s in each country individually, except for Austria, Poland, Portugal, and Slovakia because of the small number of patients. Patients diagnosed in the 1990s were excluded from the pairwise comparison and we did not further divide the patients diagnosed in the 2010s into 2010–2013 and 2014–2018 in each country, also because of the small number of patients. Then Kruskal–Wallis rank sum test was applied to test whether the diagnostic delays were different among all the 12 countries, and post hoc pairwise comparisons were done using Conover’s test with P-values adjusted by Benjamini and Hochberg method.
Age is usually a confounding factor in time-to-event analysis. To assess the contribution of age effect to diagnostic delay we first tested the correlation between the age of EDS onset and the diagnostic delay (Spearman’s rank correlation), and then used a moving cut-off age between 12 and 23 years old to divide our patients into two subgroups and compared their delays using Wilcoxon rank sum test (P-values were adjusted by the false discovery rate method). We chose the cut-off age between 12 and 23 years old because patients with symptom onset younger than 12 years old can be treated as pediatric cases while older than 23 years can be treated as adult patients who most likely finished education and started social obligation (ie, started to work). The moving cut-off age approach also provided us with more detailed comparisons between pediatric/adolescent cases vs adult cases, considering that the end of puberty defined by different criteria is different (eg, the cessation of bone growth is 16 years old while the end of adolescence defined by chronotype is 20 years old).26
Short Delay vs Long Delay
Non-parametric tests are usually less powerful to reject the null hypothesis (ie, higher risk of type II error) because they use less information from the data compared to parametric tests.27 We hypothesized that the increases in the following two indices could indicate a decreasing trend in the diagnostic delay: 1) the proportion of patients with short delay in the whole database increased over years; and 2) the ratio of patients with short delay vs long delay increased over years. We correlated the two indices to the year of diagnosis using both Pearson and Spearman methods. A significant correlation (P-value<0.05) indicated that the index increased over years.
Predictive Factors for Diagnostic Delay Selected by Machine Learning
We applied machine learning to investigate the variables associated with the diagnostic delay. Stochastic gradient boosting (SGB) is a machine learning algorithm that iteratively creates weak single decision tree, and the tree ensemble can achieve the most accurate estimate of the response variable. It was demonstrated to be a suitable algorithm for modeling the EUNN database in our previous study.22
We stratified the raw diagnostic delay into four subgroups in order to run the SGB model, ie, to convert the prediction of a continuous variable into a classification problem. The distribution of the raw data followed an exponential distribution and gave 39 outliers larger than 29.4 years (Figure 3). Thus we did log-transformation to the raw data (ie, log-transformation of raw data +1 as raw data contained zero) and then divided the transformed data into four subgroups using the quartiles of boxplot (Figure 3). The log-transformation also allowed us to quantify the contribution of the predictors to the delays in the following section via fitting a valid regression model with normal distributed residuals.
We excluded the near zero-variance variables (ie, predictors having one unique value, or the ratio of the most frequent to the second most frequent value is large) and the variables with more than 80% missing values, for the sake of model complexity and computing time. The year of EDS onset was included in the predictors, but the year of diagnosis was excluded because the diagnostic delay was calculated as the time interval between these two parameters. Including both parameters would thus result in an overfitting model just simply finding their mathematic relationship. Finally, 84 predictors were selected. The numbers of trees (ie, the number of boosting iterations) were set between 500 and 3000 with a stepwise increment of 50, and the interaction depth (ie, the depth of trees) was set from one to eight. Overfitting problem was controlled by several regularization methods, including shrinkage28 and applying subsampling method.28,29 The shrinkage factor (ie, learning factor) was fixed as 0.001. Ten-fold cross-validation (CV) with ten-repeat was selected as the resampling scheme to estimate the testing error. We used both Kappa and accuracy as metrics to select the optimal model.
To Quantify the Predictors Using Linear Mixed-Effect Model (LMM)
Although SGB model was capable of ranking the relative influence of each predictor to the final classification, it was not able to quantify the influences of the predictors. Therefore, we used linear mixed-effect model (LMM) to quantify how the most influential predictors were associated with the diagnostic delay. The dependent variable was the log-transformed diagnostic delay. The country difference was controlled by setting the country name as a random effect (ie, random intercept) in the LMM, and the fixed effects were the top-ranking predictors suggested by our SGB models. Only the countries with more than 10 patients of complete dataset of fixed effects were included into the LMM. Then stepwise regression using backward elimination was applied to the LMM to select the best predictors. We reported both the conditional R230 and Ω231 to assess the goodness of fit of our final selected models.
All statistical analyses and modeling were performed using R (version 3.5.3). The SGB model was constructed with the R package caret.32 The LMM model was done using the R package lme4 and lmerTest. P-value<0.05 indicated significance in all statistical analyses.
Results
Changes in Diagnostic Delay Over Time
The mean age of EDS onset was 20.9±11.8 years old and the mean age of diagnosis was 30.5±14.9 years old. The peak age of EDS onset in our patients was during the second decade of life, ie, 42.8% (248/580) patients started EDS between 10 and 20 years old (Figure 4).
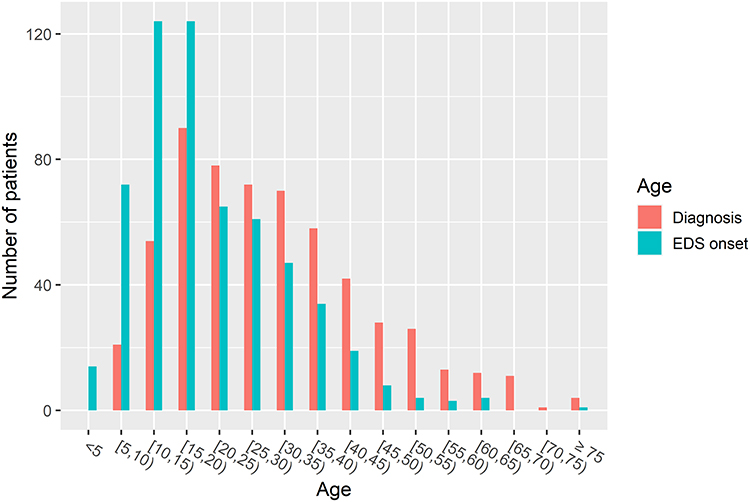 |
Figure 4 Narcolepsy diagnosis relative to the age at EDS onset. |
The diagnostic delays over different EDS onset years (Figure 5A) and over different diagnostic years (Figure 5B) are shown in Figure 5. While a clear decreasing trend can be observed in Figure 5A and the diagnostic delay strongly correlates to the year of EDS onset (Spearman’s rank correlation coefficient=−0.80, P-value<0.0001), the data in Figure 5B do not show a decreasing trend and most of the patients were diagnosed in 2000s and 2010s. Kruskal–Wallis rank sum test suggests no significant difference in the diagnostic delay among those patients (P-value=0.368). There was still no significant difference in the diagnostic delay when patients diagnosed in the 1990s were included (Kruskal–Wallis rank sum test: P-value=0.06). Although P-value=0.06 suggests the trend is significant, this result should be interpreted with caution because of the small number of patients in each year in the 1990s. Therefore, we further showed the changes in stratified diagnostic delay in Figure 5C. There are no significant differences (Kruskal–Wallis rank sum test, P-value=0.263) in the stratified diagnostic delays among 1990s (median: 6.0 years, IQR: 2.0–15.2 years), 2000s (median: 5.9 years, IQR: 2.1–14.3 years), 2010–2013 (median: 4.6 years, IQR: 1.4–11.3 years) and 2014–2018 (median: 5.1 years, IQR: 1.8–12.4 years), or in any post hoc pairwise comparison (see the P-values in Figure 5C).
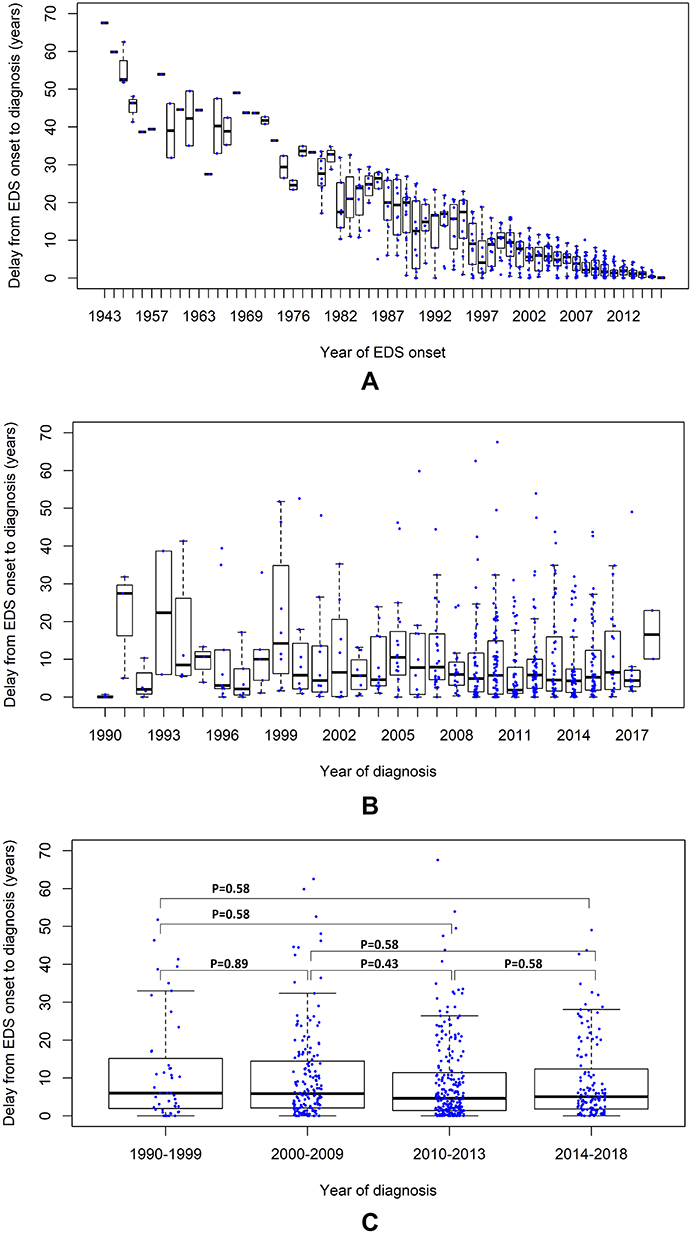 |
Figure 5 The diagnostic delay over different years of EDS onset (A), over the different years of diagnosis (B), and over 1990s, 2000s, 2010–2013 and 2014–2018 (C). The data are shown as boxplots and the data point of each patient is marked in blue. The figures were chosen to illustrate the selection bias in (A) and a more suitable analysis in (B) (details are explained in Discussion section). The P-values of post hoc pairwise comparisons are displayed in (C). |
Country Differences
The Wilcoxon rank sum test suggests no significant difference in the diagnostic delays between patients diagnosed in 2000s and 2010s in each country except for Finland (Table 1). Figure 6A illustrates the delay of these 580 selected patients from 1990 to 2018 in each country and the results of post hoc pairwise comparisons. The diagnostic delay is significantly different among EUNN countries (Kruskal–Wallis rank sum test: P-value<0.0001). Spain has longer delay compared to most of the other countries.
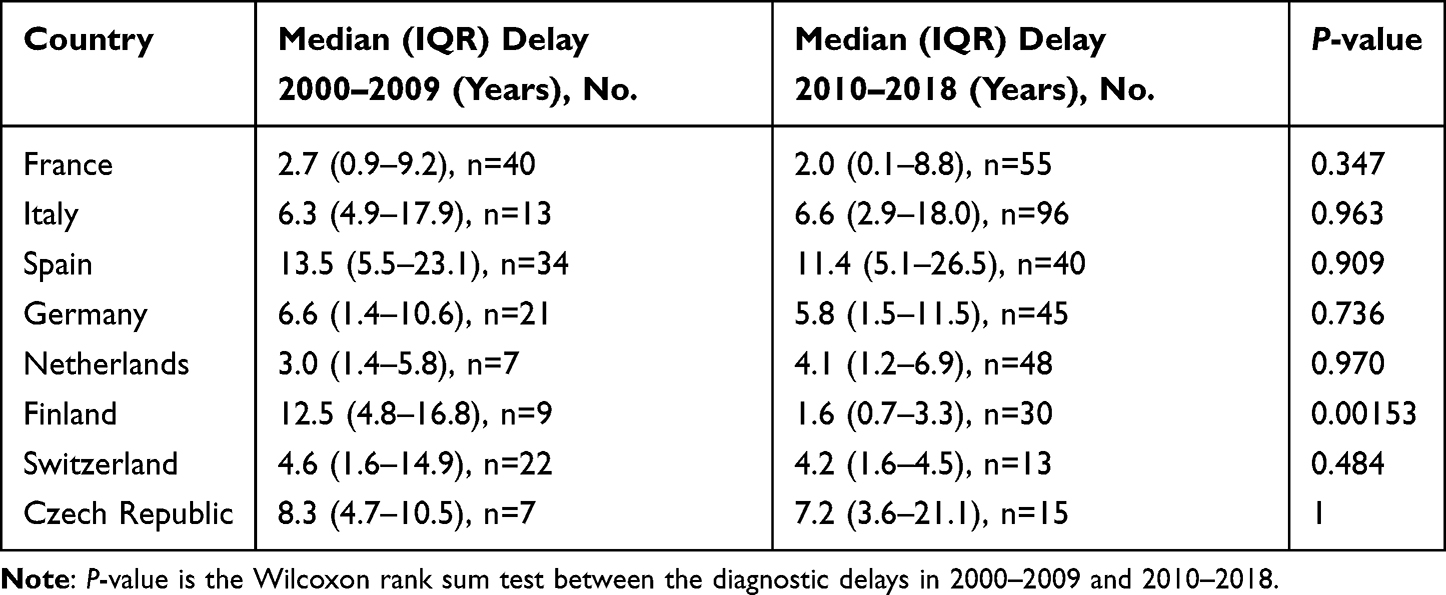 |
Table 1 Wilcoxon Rank Sum Test Between Patients Diagnosed in 2010s and 2000s in Each Country |
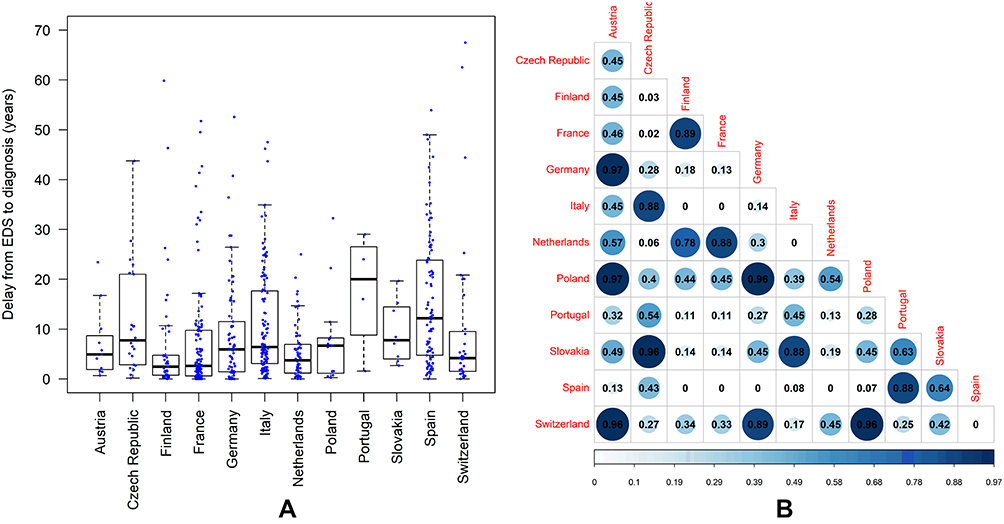 |
Figure 6 The diagnostic delays in each country (A) and the heat map of the pairwise comparison of the delays between the countries (B) in the selected 580 validated patients. The data are shown as boxplots and the data point of each patient is marked in blue. The numbers in the heat maps are the P-values of the pairwise comparisons. The value 0 in (B) means P-value<0.0001. |
The small number of patients in some countries may cause high Type II error in the results shown in Table 1 and Figure 6, ie, low statistical power to reject the null hypothesis, so we did additional analyses using more patients from EUNN database. In these analyses we included non-validated patients, ie, patients with missing value in any of the mandatory fields but without missing data in the dates of EDS onset and diagnosis. In total, 1051 patients were included (Supplementary Table S1). The additional analyses confirmed the results reported in Table 1 (Supplementary Table S2) and in Figure 6 (see Supplementary Figure S1).
Age Effect
There was weak negative correlation between the age of EDS onset and the diagnostic delay (Spearman’s rank correlation coefficient= −0.13, p-value=0.002). The diagnostic delay of the two subgroups that are defined by a moving cut-off age between 12 and 23 years old are shown in Supplementary Figure S2. Wilcoxon rank sum tests confirmed that patients starting EDS at younger age have longer delays than patients who had EDS at relatively older age because P-values are either significant (<0.05) or showed a trend to be significant (P-values approximate to 0.1, see Supplementary Figure S2). In other words, children and adolescents have longer interval from EDS onset to diagnosis compared to adults, no matter how they are defined by the cut-off age.
Results of Short Delay vs Long Delay
The number of patients with short diagnostic delay (ie, delay ≤ 2 years) increased since 2009 as shown in Figure 7A. This trend is however paralleled by the number of patients with moderate (ie, delay between 2 and 13 years) and long diagnostic delay (ie, delay ≥ 13 years) which also increases in Figure 7A. In spite of the fluctuation in the proportion of patients with short delay (Figure 7B), no increasing trend was observed. There was no correlation between this proportion and the year of diagnosis (Pearson’s correlation: P-value= 0.66; Spearman’s rank correlation: P-value=0.72). The ratio between the number of patients with short and long delay over the past two decades was relatively stable (Figure 7C) and no significant correlation (Pearson’s correlation: P-value= 0.80; Spearman’s rank correlation: P-value=0.77) was found between the ratio and diagnostic year either, although a peak was observed in 2011 which could be explained by the 2009–2010 H1N1 pandemic.
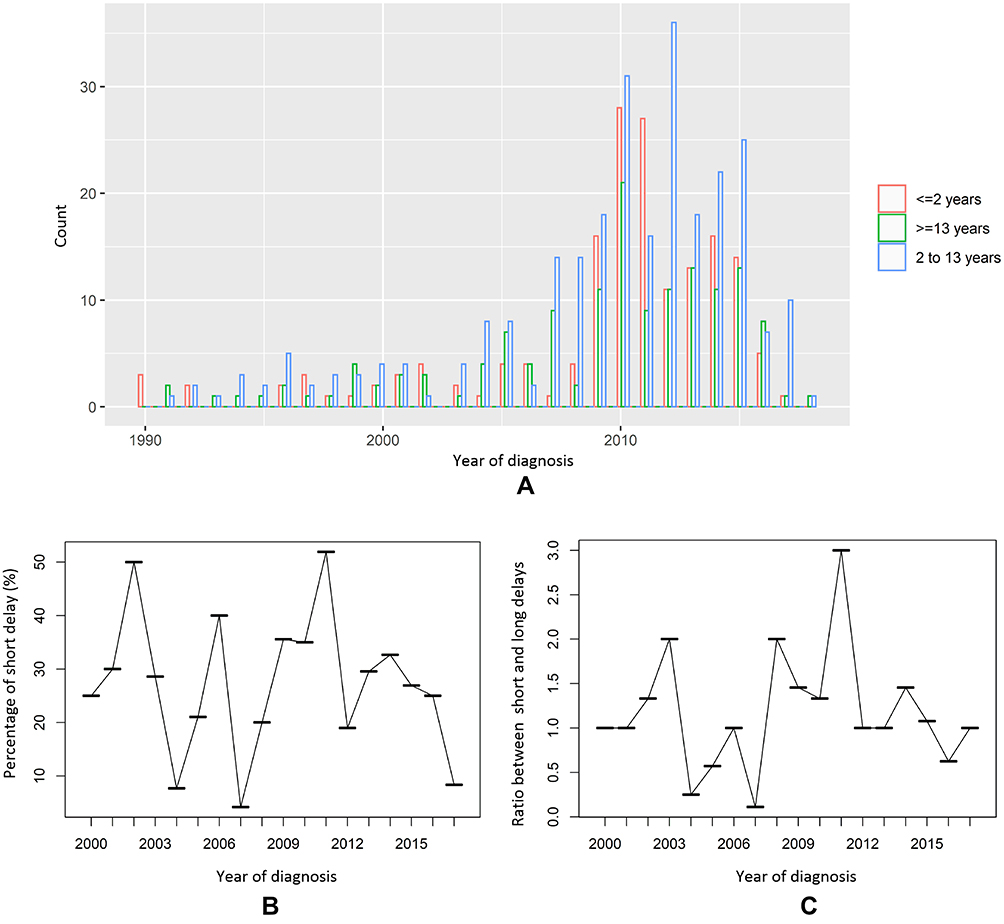 |
Figure 7 The absolute counts of patients with short (≤ 2 years), moderate (2–13 years), and long (≥ 13 years) diagnostic delay (A); the proportion of patients with short delay in all patients (B); and the ratio of the numbers of short delay vs long delay (C). |
Predictors Identified by Machine Learning
The cut-off values stratifying the subgroups for SGB model corresponded to the raw diagnostic delays of 1.67 years, 5.33 years and 13.19 years. The number of patients in the subgroup with diagnostic delay < 1.67 year, 1.67 years ≤ delay <5.33 years, 5.33 years ≤ delay <13.19 years and delay ≥13.19 years was 152 (female: 52, male: 100, median age of EDS onset: 17.3 years with IQR 12.1–26.5 years), 137 (female: 72, male: 65, median age of EDS onset: 20.4 years with IQR 13.8–30.3 years), 146 (female: 71, male: 75, median age of EDS onset: 18.6 years with IQR 14.4–29.8 years) and 145 (female: 60, male: 85, median age of EDS onset: 15.0 years with IQR 9.5–21.6 years), respectively. The SGB model built by 1550 trees with tree depth of 5 gives best Kappa (0.52) and best accuracy (64.2%). The relative influences of the first 20 predictors contributing to the optimal model are shown in Figure 8. The year of EDS onset was the dominating predictor of the diagnostic delay, which can be explained by the aforementioned strong correlation between these two parameters. The second strongest predictor was country, which also confirms our results of country difference mentioned previously. The other important predictors included MSLT parameters, PSG parameters, cataplexy characteristics, daytime and nocturnal sleep, etc.
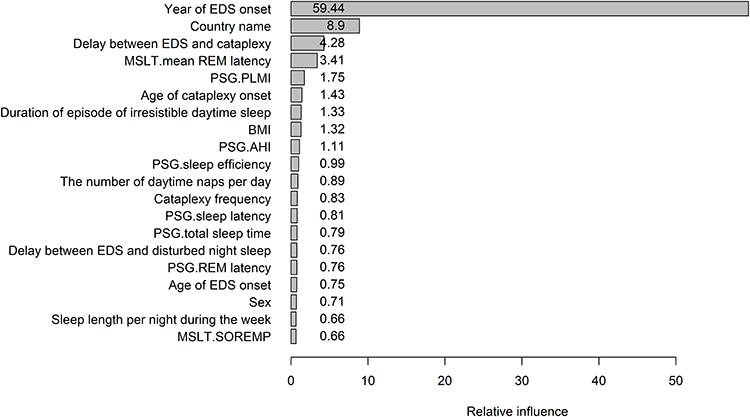 |
Figure 8 The relative influences of the top 20 predictors of the optimal stochastic gradient boosting model. The variables are written on the vertical axis and their relative influences are the numeric values given in the bars. Abbreviations: EDS, excessive daytime sleepiness; MSLT, multiple sleep latency test; PSG, polysomnography; PLMI, periodic limb movement index of PSG; AHI, apnea-hypopnea index of PSG; SOREMP, sleep onset rapid eye movement (REM) period. |
Results of Linear Mixed-Effect Model: Quantifying the Influences of the Predictors
Country was the random effect in the LMM, and the other predictors listed in Figure 8 were fixed effects. The time interval between EDS onset and cataplexy was log-transformed, because as typical time-to-event data it follows exponential distribution, similar to the diagnostic delay. We excluded the year of EDS onset from the predictors because it strongly correlated to the diagnostic delay but had obvious selection bias. We subjected two datasets to LMM analysis, each one with and without PSG/MSLT parameters. The complete dataset including PSG and MSLT parameters contained 173 patients from France (n=16), Italy (n=66), the Netherlands (n=30), Spain (n=40) and Switzerland (n=21). The dataset without PSG and MSLT parameters included 407 patients from Finland (n=37), France (n=86), Germany (n=50), Italy (n=87), the Netherlands (n=45), Spain (n=75) and Switzerland (n=27). The results of the two LMMs after stepwise selection of the best predictors are shown in Table 2. The conditional R2 and Ω2 of the first model including PSG and MSLT data were 0.57 and 0.57, respectively. These two values of the other model without PSG and MSLT variables were 0.41 and 0.43, respectively. These values suggest a good fit of the model.
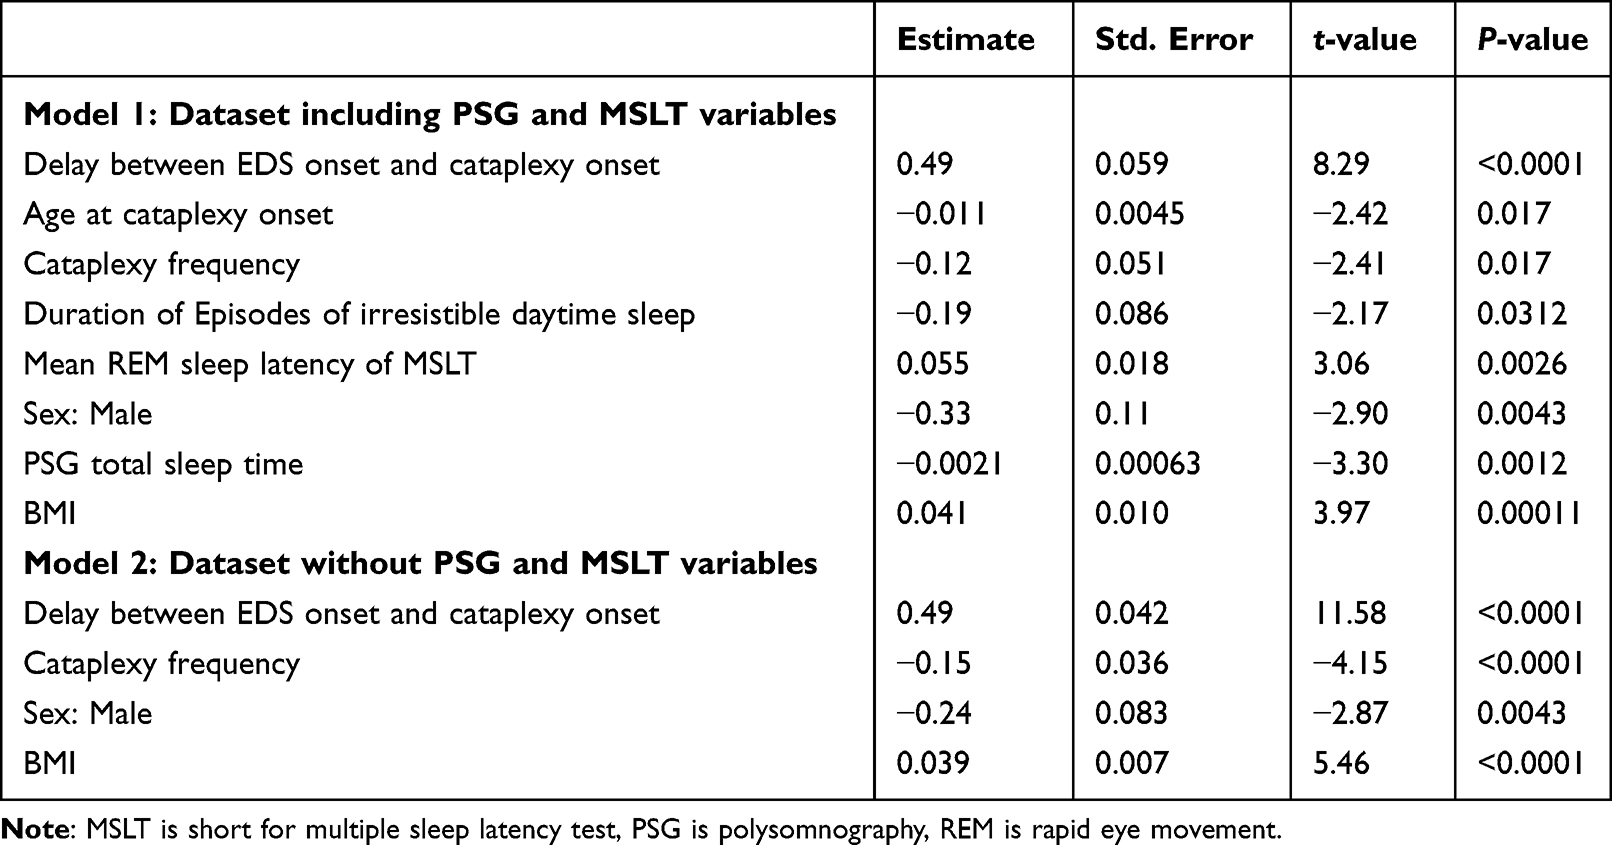 |
Table 2 The Outcomes of the Linear Mixed-Effect Models |
Gender Differences in Diagnosis Delay
The finding of gender as a significant predictor in both models in Table 2 was unexpected since Wilcoxon rank sum test could not find a significant difference (P-value=0.18) in diagnostic delay between males (median 5.2 years, IQR 1.3–13.7 years) and females (median 5.7 years, IQR 2.2–12.4 years). Considering the possibility that the gender difference may be due to age-dependent social roles of males and females in family, such as household roles, raising children, employment, we further compared gender differences in children and adults separately. We chose the cut-off age of EDS onset < 16 years to define the child subgroup (female n=113, male n=128) in which the social factors are most unlikely to play a role, ie, in most countries children of 16 years old are still at secondary school which is compulsory. We chose a moving cut-off age, ie, from 20 years to 30 years, to define the adult group in which the male and female roles start to diverge in households and labor market. Wilcoxon rank sum test showed no significant difference (P-value=0.53) in the delays between males (median 5.8 years, IQR 1.3–20.0 years) and females (median 6.6 years, IQR 2.1–16.8 years) in the child group, whereas adult females showed a trend (P-value=0.1) toward significantly longer diagnostic delay than males (Supplementary Figure S3).
Discussion
In this study we thoroughly applied different analysis methods to investigate the changes in the diagnostic delay of narcolepsy type-1 in different European countries over the past three decades using European Narcolepsy Network database. The mean and median diagnostic delay of our patients was about 9.7 and 5.3 years, respectively. In 42.8% of patients EDS started between the age of 10 and 20 years, consistent with the results of reported studies.33–35 Our results show that the diagnostic delay remained stable in the past decades despite significant country differences. This means that our finding of the non-significant change in diagnostic delay is not due to the insignificance of specific countries that have larger number of patients in the database, but is a common phenomenon in EUNN countries. Combining machine learning (ie, stochastic gradient boosting) and linear mixed-effect regression analyses, we found that the occurrence of cataplexy (eg, age of cataplexy onset, delay between EDS onset and cataplexy onset, cataplexy frequency), severity of symptoms (eg, cataplexy frequency, duration of irresistible daytime sleep), REM sleep propensity, changes in nocturnal sleep duration, BMI and sex are significant predictors of diagnostic delay.
We believe that the results of the shortening of the time to diagnosis over the years reported in previous studies are strongly influenced by a selection bias because diagnostic delay was defined by the year of symptom onset.7,12,17 Their results are confounded by the naturally decreased intervals between consecutive calendar years and the latest diagnostic year in their databases. Our new approach was less biased by choosing the year in which patients are diagnosed with a variation in time to diagnosis that remains stable over time. We illustrated this selection bias in our results in Figure 5A by showing a clear decreasing trend in the diagnostic delay over the year of EDS onset, in which the maximal delay in each year can only stepwise decrease over time because it cannot exceed the time interval between the year of EDS onset and the latest diagnostic year in the database.
The increased number of NT1 patients with short diagnostic delay following 2009–2010 H1N1 pandemic,5,6,23,36 and the recent evidence of immune-mediated NT1 cases1,37–39 are two milestones in narcolepsy in the last decade. The increased number of acute NT1 patients in 2010s may lead to the impression that the diagnostic delay is getting shorter. Also, our result indeed confirms an increased number of patients with short diagnostic delay in 2010–2013. However, the fact that the number of NT1 patients with long diagnostic delay was also increased simultaneously contradicts the notion of shorter diagnostic delay. Likewise, the proportion of patients with short delay and the ratio between short delay and long delay did not show an increasing trend in the past decades. Finally, the comparisons of the stratified diagnostic delay across 3 different decades (1990s, 2000s and 2010s) did not show significant difference in the whole EUNN database either. Even in individual countries we could not find significant difference in the diagnostic delays between 2000s and 2010s, except for Finland. The significance in Finland is likely to be explained by the 2009–2010 H1N1 pandemic, because 23 out of the 30 Finnish patients diagnosed in 2010s started EDS between 2009 and 2011, during which the association between H1N1 vaccine Pandemrix and acute NT1 had been reported in Finland.6 Finland is one of the few countries in Europe that only used Pandemrix and it had a very high vaccination rate among children and adolescents (75%).6 This may explain why we did not see this trend in other included countries. In summary, all of our analyses lead to the same conclusion that the diagnostic delay has not been getting shorter in the past decades.
The increased number of patients with both short and long diagnostic delay since 2010 may be explained by: 1) increased media awareness of narcolepsy because of the public press releases that reported increased numbers of narcolepsy during the 2009–2010 H1N1 pandemic. The peak of short delay is most likely due to the H1N1 virus infection or Pandemrix, because those patients had quick manifestations of symptoms. The peak of long delay may be explained by increased media awareness, ie, some patients may have been suffering from symptoms for years but were not aware of narcolepsy until the relation between Pandemrix/H1N1 virus and narcolepsy was made public; 2) an increased incidence of NT1 in the 2010s; 3) an improved diagnostic capacity of sleep centers in Europe; 4) more sleep centers joined EUNN and more patients’ data were entered; 5) NT1 is naturally a disease including subtypes of acute and gradual courses of disease progression. Recently, experts proposed the multiple hit theory of narcolepsy based on findings in animal studies.40 In this theory
“Narcolepsy is considered to arise from multiple hits including the co-occurrence of genetic predisposition, environmental factors and triggering events eventually leads to the selective, immune-mediated destruction, dysfunction or silencing of orexin-producing neurons”.1 The multiple hits mechanism implies that time interval between disease onset and final diagnosis creates an unavoidable diagnostic delay in some NT1 patients. Our finding of equally co-existing patients with short and long diagnostic delay over decades seems to support this multiple hits theory, assuming that a considerable partition of NT1 patients with chronic disease progression may always exist, even though the other factors limiting quick diagnosis (eg, diagnostic capacity of sleep centers, public awareness of narcolepsy, etc.) have been improved.
In our analysis of factors that contribute to the diagnostic delay it is striking to find male patients compared to female patients having a shorter diagnostic delay. Although sex differences have been well-known in other sleep disorders such as obstructive sleep apnea, restless legs syndrome, and insomnia, the impact of sex in narcolepsy has been less studied. To the best of our knowledge, only two previous studies reported that females have longer diagnostic delay of NT1 compared to males.19,41 Won et al found that females are less likely to report lifestyle impairments in the areas of personal relationships and physical activity compared to males in spite of being objectively sleepier; however both patients with narcolepsy with and without cataplexy were involved in this study.41 Recent studies reported that in narcolepsy mouse models, females have larger number of cataplexy bouts42 and increased wake43 compared to males, with unclear findings in humans with narcolepsy.19,41 Our result of sex differences in narcolepsy diagnostic delay in adults suggest that social factors (eg, different roles of males/females in their households and employment) may play an important role in narcolepsy diagnosis. More studies are needed in future to better study the associations between influence of having narcolepsy and social factors such as family obligations, careers, income, and education.
Results from machine learning combined with classical LMM regression analysis suggest that the best way to shorten the diagnostic delay is to correctly recognize cataplexy as early as possible. Taddei et al found that longer interval between EDS onset and cataplexy onset is associated with longer diagnostic delay.17 Morrish et al reported that age of cataplexy onset has a negative association with the diagnostic delay in UK,12 indicating that cataplexy may be more difficult to correctly diagnose in children. This is probably because child cataplexy often remains unrecognized (eg, atypical cataplexy) or misdiagnosed as epilepsy, attention deficit/problems, aggressive behavior, or seeking attention from parents.44–48 EDS can also be easily mislabeled as laziness and inattention, leading to a misdiagnosis of behavioral conditions, and also to attention deficit hyperactivity disorder (ADHD) in children.48,49 These results are in line with our result that pediatric patients have longer diagnostic delays than patients with EDS onset during adulthood, which has been recently reported in a US narcolepsy cohort.18,20 It is not surprising that the severity of symptoms (eg, the frequency of cataplexy, duration of episodes of irresistible daytime sleep) negatively contributes to the diagnostic delay, because frequent cataplexy attacks and irresistible daytime sleep can interrupt patients’ daytime functioning and lead to accidents.48 Thus, those patients are likely to seek clinical help earlier or be correctly diagnosed more quickly. The narcolepsy severity scales (NSS) for adults50 and children51 have been recently developed. Future studies using adult and child NSS are needed to further investigate the associations between the severity of symptoms and diagnostic delay.
The causal relationship between nocturnal PSG total sleep time and diagnostic delay is hard to interpret because they had a negative association in our regression analysis. We think that the decrease in nocturnal total sleep time and sleep efficiency may be consequences of the diagnostic delay rather than causes, ie, patients with longer diagnostic delay are more likely to have poorer nocturnal sleep because of the deterioration of disease and aging.52 Although disrupted nighttime sleep is a key symptom of narcolepsy, it has received less attention than EDS and cataplexy, and its exact pathophysiology is still unknown.53 In fact, currently most narcolepsy medications (except for Sodium Oxybate) cannot consolidate the patient’s nocturnal sleep, in spite of the improvement of EDS and cataplexy.54 We reported here the association between diagnostic delay and poor nighttime sleep. We recently found that disturbed nocturnal sleep is associated with aging,52 disease severity, and objective daytime sleepiness in NT1.55 Our results also suggest that higher daytime REM sleep propensity (ie, shorter mean REM latency of MSLT) and longer duration of irresistible daytime sleep can shorten the diagnostic delays. These results indicate that undiagnosed NT1 patients may be more aware of changes in daytime sleep, because changes in daytime sleep could directly interrupt their daytime activities. Similarly, higher BMI could be interpreted as a consequence of the delayed diagnosis. It has been well-known that patients with narcolepsy have increased BMI,1,56 which could be explained by the altered energy homeostasis due to the loss of hypocretin,57 or the disease-related behaviors such as decreased motor activity and abnormal eating behaviors.58,59 Unfortunately, in the current EU-NN database we have not asked for the reasons of patient referral to the sleep lab. Future studies should take these reasons into account to better understand the reasoning behind delayed diagnosis of narcolepsy.
The EU-NN database allows us, for the first time, to compare the diagnostic delays of NT1 among 12 European countries. As a multi-center, multi-country study, it has several limitations. First, not all patients have been included from all centers yet, and systematic errors in epidemiological research such as recall bias could also exist in our study. Second, it is hard to match the number of patients between different centers/countries. The numbers of patients from some countries were too small to be included in some of our analyses, eg, the results shown in Table 1. Nevertheless, our results still send key messages to the whole narcolepsy research society that the results of changes in diagnostic delay in previous studies are wrong, and the country/center and gender differences require further studies. Third, the country differences may be explained by various socio-economic and/or biological factors like different healthcare systems (eg, referral to general practitioners or pneumologists instead of specified reference centers), culture and life styles (eg, daytime napping culture in some countries may help to alleviate the daytime EDS), economic levels, genetic factors, etc. Our data currently do not allow us to further study these factors, but our results should remind the whole society to take the country differences into account when designing their study protocols of future studies and interpreting the results.
Conclusion
Our study reports that the diagnostic delay of NT1 has not been shortened in the past decades in European countries, in spite of the progression of narcolepsy research and investment in narcolepsy awareness campaign by societies and industries. Our data suggest that adequate recognition of EDS and cataplexy, and timely measuring of changes in nighttime sleep would be helpful to make an earlier diagnosis of narcolepsy. Therefore, research and industry partners should probably invest more resources in developing new biomarkers60 and new technologies such as wearable sensors61 and mobile narcolepsy app62 that can better detect EDS, cataplexy and changes in nighttime sleep in patients in the near future.
Abbreviations
REM, rapid eye movement; NT1, narcolepsy type-1; EDS, excessive daytime sleepiness; ICSD-3, the International Classification of Sleep Disorders; EUNN, European Narcolepsy Network; PSG, polysomnography; MSLT, multiple sleep latency test; IQR, interquartile range; ESS, Epworth Sleepiness Scale; std., standard deviation; SGB, Stochastic gradient boosting; LMM, linear mixed-effect model; NSS, narcolepsy severity scales.
Acknowledgments
The EU-NN database is financed by the EU-NN. The EU-NN has received financial support from UCB Pharma Brussels for developing the EU-NN database. We thank Teresa Paiva, Peter Young, Johannes Mathis, Michel Lecendreux, Christian R. Baumann, Carole Pesenti, Alex Iranzo, Laura Lillo-Triguero, Pablo Medrano-Martínez, Corina Gorban and José Haba-Rubio who helped to input the patients’ data into EU-NN database.
Disclosure
Prof. Dr. Giuseppe Plazzi reports personal fees from Jazz Pharmaceuticals, Takeda, Idorsia, and Bioprojet, outside the submitted work. Dr Gert Jan Lammers reports grant for investigator initiated study, consultancy, and/or Member Advisory Board from Jazz Pharmaceuticals, UCB Pharma, and Bioprojet Pharma, outside the submitted work. Dr Sebastiaan Overeem reports consulting fees paid to institution from Bioproject, Takeda, Jazz Pharmaceuticals, and UCB Pharma, outside the submitted work. Dr Karel Sonka reports grants from Czech Ministry of Health, during the conduct of the study; personal fees for consulting fees or clinical trial fees from AOP Orphan, Jazz, Flamel-Avadel, and Sanofi, outside the submitted work. Prof. Dr. Birgit Högl reports speaker fees from Abbvie and Jazz, and consulting fees from Lundbeck, outside the submitted work. Dr Lucie Barateau reports funding for seminars from Bioprojet and Jazz, board engagement fees from Takeda, and travel reimbursements for conferences from UCB Pharma, outside the submitted work. Dr Rolf Fronczek reports grants and/or personal fees from Bioprojet for lecture fee and advisory board, research grant (co-applicant), research grants as co-applicant from Jazz Pharma, personal fees from Takeda for advisory board, outside the submitted work. The authors report no other conflicts of interest in this work.
References
1. Bassetti CLA, Adamantidis A, Burdakov D, et al. Narcolepsy - clinical spectrum, aetiopathophysiology, diagnosis and treatment. Nat Rev Neurol. 2019;15:519–539. doi:10.1038/s41582-019-0226-9
2. Ohayon MM. Epidemiology of narcolepsy. In: Bassetti C, Billiard M, Mignot E, editors. Narcolepsy and Hypersomnia. New York: Informa Healthcare; 2007:125–132.
3. Khatami R, Luca G, Baumann CR, et al. The European Narcolepsy Network (EU-NN) database. J Sleep Res. 2016;25(3):356–364. doi:10.1111/jsr.12374
4. American Academy of Sleep Medicine. The International Classification of Sleep Disorders.
5. Dauvilliers Y, Arnulf I, Lecendreux M, et al. Increased risk of narcolepsy in children and adults after pandemic H1N1 vaccination in France. Brain. 2013;136(Pt 8):2486–2496. doi:10.1093/brain/awt187
6. Partinen M, Saarenpaa-Heikkila O, Ilveskoski I, et al. Increased incidence and clinical picture of childhood narcolepsy following the 2009 H1N1 pandemic vaccination campaign in Finland. PLoS One. 2012;7(3):e33723. doi:10.1371/journal.pone.0033723
7. Thorpy MJ, Krieger AC. Delayed diagnosis of narcolepsy: characterization and impact. Sleep Med. 2014;15(5):502–507. doi:10.1016/j.sleep.2014.01.015
8. Jennum P, Ibsen R, Petersen ER, Knudsen S, Kjellberg J. Health, social, and economic consequences of narcolepsy: a controlled national study evaluating the societal effect on patients and their partners. Sleep Med. 2012;13(8):1086–1093. doi:10.1016/j.sleep.2012.06.006
9. Broughton RJ, Fleming JA, George CF, et al. Randomized, double-blind, placebo-controlled crossover trial of modafinil in the treatment of excessive daytime sleepiness in narcolepsy. Neurology. 1997;49(2):444–451. doi:10.1212/WNL.49.2.444
10. Dauvilliers Y, Molinari N, Espa F, et al. Delay of diagnosis of narcolepsy in a European and in a North American population. J Sleep Res. 1998;7(Suppl 2):56.
11. Thorpy M, Cronin S, Temple H. Age of onset and time to diagnosis of narcolepsy. Neurology. 1999;52:6.
12. Morrish E, King MA, Smith IE, Shneerson JM. Factors associated with a delay in the diagnosis of narcolepsy. Sleep Med. 2004;5(1):37–41. doi:10.1016/j.sleep.2003.06.002
13. BaHammam AS, Alenezi AM. Narcolepsy in Saudi Arabia. Demographic and clinical perspective of an under-recognized disorder. Saudi Med J. 2006;27(9):1352–1357.
14. Ingravallo F, Gnucci V, Pizza F, et al. The burden of narcolepsy with cataplexy: how disease history and clinical features influence socio-economic outcomes. Sleep Med. 2012;13(10):1293–1300. doi:10.1016/j.sleep.2012.08.002
15. Frauscher B, Ehrmann L, Mitterling T, et al. Delayed diagnosis, range of severity, and multiple sleep comorbidities: a clinical and polysomnographic analysis of 100 patients of the innsbruck narcolepsy cohort. J Clin Sleep Med. 2013;9(8):805–812. doi:10.5664/jcsm.2926
16. Ueki Y, Hayashida K, Komada Y, et al. Factors associated with duration before receiving definitive diagnosis of narcolepsy among Japanese patients affected with the disorder. Int J Behav Med. 2014;21(6):966–970. doi:10.1007/s12529-013-9371-5
17. Taddei RN, Werth E, Poryazova R, Baumann CR, Valko PO. Diagnostic delay in narcolepsy type 1: combining the patients’ and the doctors’ perspectives. J Sleep Res. 2016;25(6):709–715. doi:10.1111/jsr.12420
18. Maski K, Steinhart E, Williams D, et al. Listening to the patient voice in narcolepsy: diagnostic delay, disease burden, and treatment efficacy. J Clin Sleep Med. 2017;13(3):419–425. doi:10.5664/jcsm.6494
19. Luca G, Haba-Rubio J, Dauvilliers Y, et al. Clinical, polysomnographic and genome-wide association analyses of narcolepsy with cataplexy: a European Narcolepsy Network study. J Sleep Res. 2013;22(5):482–495. doi:10.1111/jsr.12044
20. Ohayon MM, Thorpy MJ, Carls G, et al. The nexus narcolepsy registry: methodology, study population characteristics, and patterns and predictors of narcolepsy diagnosis. Sleep Med. 2021;84:405–414. doi:10.1016/j.sleep.2021.06.008
21. Tio E, Gaig C, Giner-Soriano M, et al. The prevalence of narcolepsy in Catalunya (Spain). J Sleep Res. 2018;27(5):e12640. doi:10.1111/jsr.12640
22. Zhang Z, Mayer G, Dauvilliers Y, et al. Exploring the clinical features of narcolepsy type 1 versus narcolepsy type 2 from European narcolepsy network database with machine learning. Sci Rep. 2018;8(1):10628. doi:10.1038/s41598-018-28840-w
23. Zhang Z, Gool JK, Fronczek R, et al. New 2013 incidence peak in childhood narcolepsy: more than vaccination? Sleep. 2021;44:2. doi:10.1093/sleep/zsaa172
24. Nadarajah S, Haghighi F. An extension of the exponential distribution. Statistics. 2011;45(6):543–558. doi:10.1080/02331881003678678
25. Sarkanen TO, Alakuijala APE, Dauvilliers YA, Partinen MM. Incidence of narcolepsy after H1N1 influenza and vaccinations: systematic review and meta-analysis. Sleep Med Rev. 2018;38:177–186. doi:10.1016/j.smrv.2017.06.006
26. Roenneberg T, Kuehnle T, Pramstaller PP, et al. A marker for the end of adolescence. Curr Biol. 2004;14(24):R1038–1039. doi:10.1016/j.cub.2004.11.039
27. Obremski TE. Practical nonparametric statistics. Technometrics. 1981;23(4):415–416.
28. Hastie T, Tibshirani R, Friedman J. Boosting and Additive Trees the Elements of Statistical Learning: data Mining, Inference, and Prediction. New York, NY: Springer New York; 2009.
29. Friedman JH. Stochastic gradient boosting. Comput Stat Data Anal. 2002;38(4):367–378. doi:10.1016/S0167-9473(01)00065-2
30. Nakagawa S, Schielzeth H. A general and simple method for obtaining R2 from generalized linear mixed-effects models. Methods Ecol Evol. 2013;4(2):133–142. doi:10.1111/j.2041-210x.2012.00261.x
31. Xu R. Measuring explained variation in linear mixed effects models. Stat Med. 2003;22(22):3527–3541. doi:10.1002/sim.1572
32. Kuhn M. Building predictive models in R using the caret package. J Stat Softw. 2008;28(5):26. doi:10.18637/jss.v028.i05
33. Okun ML, Lin L, Pelin Z, Hong S, Mignot E. Clinical aspects of narcolepsy-cataplexy across ethnic groups. Sleep. 2002;25(1):27–35. doi:10.1093/sleep/25.1.27
34. Ohayon MM, Ferini-Strambi L, Plazzi G, Smirne S, Castronovo V. How age influences the expression of narcolepsy. J Psychosom Res. 2005;59(6):399–405. doi:10.1016/j.jpsychores.2005.06.065
35. Dauvilliers Y, Montplaisir J, Molinari N, et al. Age at onset of narcolepsy in two large populations of patients in France and Quebec. Neurology. 2001;57(11):2029–2033. doi:10.1212/WNL.57.11.2029
36. Han F, Lin L, Warby SC, et al. Narcolepsy onset is seasonal and increased following the 2009 H1N1 pandemic in China. Ann Neurol. 2011;70(3):410–417. doi:10.1002/ana.22587
37. Latorre D, Kallweit U, Armentani E, et al. T cells in patients with narcolepsy target self-antigens of hypocretin neurons. Nature. 2018;562(7725):63–68. doi:10.1038/s41586-018-0540-1
38. Partinen M, Kornum BR, Plazzi G, Jennum P, Julkunen I, Vaarala O. Narcolepsy as an autoimmune disease: the role of H1N1 infection and vaccination. Lancet Neurol. 2014;13(6):600–613. doi:10.1016/S1474-4422(14)70075-4
39. Pedersen NW, Holm A, Kristensen NP, et al. CD8(+) T cells from patients with narcolepsy and healthy controls recognize hypocretin neuron-specific antigens. Nat Commun. 2019;10(1):837. doi:10.1038/s41467-019-08774-1
40. Bernard-Valnet R, Yshii L, Queriault C, et al. CD8 T cell-mediated killing of orexinergic neurons induces a narcolepsy-like phenotype in mice. Proc Natl Acad Sci U S A. 2016;113(39):10956–10961. doi:10.1073/pnas.1603325113
41. Won C, Mahmoudi M, Qin L, Purvis T, Mathur A, Mohsenin V. The impact of gender on timeliness of narcolepsy diagnosis. J Clin Sleep Med. 2014;10(1):89–95. doi:10.5664/jcsm.3370
42. Coffey AA, Joyal AA, Yamanaka A, Scammell TE. The impacts of age and sex in a mouse model of childhood narcolepsy. Front Neurosci. 2021;15:644757. doi:10.3389/fnins.2021.644757
43. Piilgaard L, Rose L, Hviid CG, Kohlmeier KA, Kornum BR. Sex-related differences within sleep-wake dynamics, cataplexy, and EEG fast-delta power in a narcolepsy mouse model. Sleep. 2022. doi:10.1093/sleep/zsac058
44. Macleod S, Ferrie C, Zuberi SM. Symptoms of narcolepsy in children misinterpreted as epilepsy. Epileptic Disord. 2005;7(1):13–17.
45. Rocca FL, Finotti E, Pizza F, et al. Psychosocial profile and quality of life in children with type 1 narcolepsy: a case-control study. Sleep. 2016;39(7):1389–1398. doi:10.5665/sleep.5970
46. Oosterloo M, Lammers GJ, Overeem S, de Noord I, Kooij JJ. Possible confusion between primary hypersomnia and adult attention-deficit/hyperactivity disorder. Psychiatry Res. 2006;143(2–3):293–297. doi:10.1016/j.psychres.2006.02.009
47. Plazzi G, Pizza F, Palaia V, et al. Complex movement disorders at disease onset in childhood narcolepsy with cataplexy. Brain. 2011;134(Pt 12):3477–3489. doi:10.1093/brain/awr244
48. Quaedackers L, Pillen S, Overeem S. Recognizing the symptom spectrum of narcolepsy to improve timely diagnosis: a narrative review. Nat Sci Sleep. 2021;13:1083–1096. doi:10.2147/NSS.S278046
49. Lecendreux M, Lavault S, Lopez R, et al. Attention-Deficit/Hyperactivity Disorder (ADHD) symptoms in pediatric narcolepsy: a cross-sectional study. Sleep. 2015;38(8):1285–1295. doi:10.5665/sleep.4910
50. Dauvilliers Y, Beziat S, Pesenti C, et al. Measurement of narcolepsy symptoms: the narcolepsy severity scale. Neurology. 2017;88(14):1358–1365. doi:10.1212/WNL.0000000000003787
51. Barateau L, Lecendreux M, Chenini S, et al. Measurement of narcolepsy symptoms in school-aged children and adolescents: the pediatric narcolepsy severity scale. Neurology. 2021;97(5):e476–e488. doi:10.1212/WNL.0000000000012272
52. Lividini A, Pizza F, Filardi M, et al. Narcolepsy type 1 features across the life span: age impact on clinical and polysomnographic phenotype. J Clin Sleep Med. 2021;17(7):1363–1370. doi:10.5664/jcsm.9198
53. Maski K, Mignot E, Plazzi G, Dauvilliers Y. Disrupted nighttime sleep and sleep instability in narcolepsy. J Clin Sleep Med. 2022;18(1):289–304. doi:10.5664/jcsm.9638
54. Bassetti CLA, Kallweit U, Vignatelli L, et al. European guideline and expert statements on the management of narcolepsy in adults and children. Eur J Neurol. 2021;28(9):2815–2830. doi:10.1111/ene.14888
55. Barateau L, Lopez R, Chenini S, et al. Linking clinical complaints and objective measures of disrupted nighttime sleep in narcolepsy type 1. Sleep. 2022. doi:10.1093/sleep/zsac054
56. Schuld A, Hebebrand J, Geller F, Pollmacher T. Increased body-mass index in patients with narcolepsy. Lancet. 2000;355(9211):1274–1275. doi:10.1016/S0140-6736(05)74704-8
57. Nishino S, Ripley B, Overeem S, et al. Low cerebrospinal fluid hypocretin (orexin) and altered energy homeostasis in human narcolepsy. Ann Neurol. 2001;50(3):381–388. doi:10.1002/ana.1130
58. Fortuyn HA, Swinkels S, Buitelaar J, et al. High prevalence of eating disorders in narcolepsy with cataplexy: a case-control study. Sleep. 2008;31(3):335–341. doi:10.1093/sleep/31.3.335
59. van Holst RJ, van der Cruijsen L, van Mierlo P, et al. Aberrant food choices after satiation in human orexin-deficient narcolepsy type 1. Sleep. 2016;39(11):1951–1959. doi:10.5665/sleep.6222
60. Dietmann A, Wenz E, van der Meer J, et al. The Swiss Primary Hypersomnolence and Narcolepsy Cohort study (SPHYNCS): study protocol for a prospective, multicentre cohort observational study. J Sleep Res Apr. 2021;30:e13296.
61. Cook JD, Prairie ML, Plante DT. Ability of the multisensory jawbone UP3 to quantify and classify sleep in patients with suspected central disorders of hypersomnolence: a comparison against polysomnography and actigraphy. J Clin Sleep Med. 2018;14(5):841–848. doi:10.5664/jcsm.7120
62. Quaedackers L, De Wit J, Pillen S, et al. A mobile app for longterm monitoring of narcolepsy symptoms: design, development, and evaluation. JMIR Mhealth Uhealth. 2020;8(1):e14939. doi:10.2196/14939
 © 2022 The Author(s). This work is published and licensed by Dove Medical Press Limited. The
full terms of this license are available at https://www.dovepress.com/terms
and incorporate the Creative Commons Attribution
- Non Commercial (unported, 3.0) License.
By accessing the work you hereby accept the Terms. Non-commercial uses of the work are permitted
without any further permission from Dove Medical Press Limited, provided the work is properly
attributed. For permission for commercial use of this work, please see paragraphs 4.2 and 5 of our Terms.
© 2022 The Author(s). This work is published and licensed by Dove Medical Press Limited. The
full terms of this license are available at https://www.dovepress.com/terms
and incorporate the Creative Commons Attribution
- Non Commercial (unported, 3.0) License.
By accessing the work you hereby accept the Terms. Non-commercial uses of the work are permitted
without any further permission from Dove Medical Press Limited, provided the work is properly
attributed. For permission for commercial use of this work, please see paragraphs 4.2 and 5 of our Terms.