Back to Journals » Patient Preference and Adherence » Volume 16
Identifying Patterns of Self-Reported Nonadherence Using Network Analysis in a Mixed German Cohort
Authors Prell T, Franke GH ![]() , Jagla-Franke M, Schönenberg A
, Jagla-Franke M, Schönenberg A ![]()
Received 14 February 2022
Accepted for publication 14 April 2022
Published 3 May 2022 Volume 2022:16 Pages 1153—1162
DOI https://doi.org/10.2147/PPA.S362464
Checked for plagiarism Yes
Review by Single anonymous peer review
Peer reviewer comments 2
Editor who approved publication: Dr Johnny Chen
Tino Prell,1 Gabriele Helga Franke,2 Melanie Jagla-Franke,2,3 Aline Schönenberg1
1Department of Geriatrics, Halle University Hospital, Halle, Germany; 2Department of Psychology of Rehabilitation, University of Applied Sciences Magdeburg-Stendal, Magdeburg-Stendal, Germany; 3Department of Psychology in Health Promotion and Prevention, University of Applied Sciences Neubrandenburg, Neubrandenburg, Germany
Correspondence: Aline Schönenberg, Department of Geriatrics, Halle University Hospital, Halle, Germany, Tel +49 345 5574071, Email [email protected]
Purpose: Nonadherence is a complex behaviour that contributes to poor health outcomes; therefore, it is necessary to understand its underlying structure. Network analysis is a novel approach to explore the relationship between multiple variables.
Patients and Methods: Patients from four different studies (N = 1.746) using the self-reported Stendal Adherence to Medication Score (SAMS) were pooled. Network analysis using EBICglasso followed by confirmatory factor analysis were performed to understand how different types of nonadherence covered in the SAMS items are related to each other.
Results: Network analysis revealed different categories of nonadherence: lack of knowledge about medication, forgetting to take medication, and intentional modification of medication. The intentional modification can further be sub-categorized into two groups, with one group modifying medication based on changes in health (improvement of health or adverse effects), whereas the second group adjusts medication based on overall medication beliefs and concerns. Adverse effects and taking too many medications were further identified as most influential variables in the network.
Conclusion: The differentiation between modification due to health changes and modification due to overall medication beliefs is crucial for intervention studies. Network analysis is a promising tool for further exploratory studies of adherence.
Keywords: medication adherence, older adults, polypharmacy, Stendal adherence to medication score, network analysis
Introduction
Adherence describes the degree to which a person complies with recommendations agreed with healthcare providers. These recommendations may contain medical recommendations, such as medication, diet, or physical activity.1–3 Especially in older adults or in patients with chronic disorders, adherence to medication is crucial, because it has a direct influence on (adverse) health outcomes, readmissions to hospital, length of stay, and overall quality of life.3–5 However, nonadherence to medication is common,3 and the reasons for this nonadherence can be divided into patient characteristics, disease-related factors, financial and health-care system barriers, patient–provider relationship factors, and treatment-related factors.2 Patient-related factors are especially important for adherence and can roughly be categorized as intentional (when the patient purposefully decides not to adhere to the recommended treatment) or unintentional (when the patient cannot follow the recommendations, eg due to cognitive problems).2,3,6 Reasons for nonadherence are complex, and often a combination of several factors influence a person’s medication adherence.3,7,8 To fully understand and improve nonadherence, it is crucial to comprehend the different types and reasons of nonadherence. Measuring adherence, however, remains challenging as numerous objective and subjective measurement methods exist, such as self-report questionnaires, pill counting, prescription refill data from pharmacies, or electronic pill monitoring. All those measures vary in terms of their reliability, validity, and sensitivity to change.9–11 Thus, no gold standard exists to measure adherence.
Self-reports are an economically feasible method and are commonly used to estimate adherence and the personal reasons for nonadherence.11 The Stendal Adherence to Medication Score (SAMS) is a German self-report questionnaire that measures various aspects of medication adherence. The 18 SAMS items can be assigned to three different factors: 1) modification of medication, ie intentionally changing dosages or leaving medications out, 2) lack of knowledge about medication, and 3) forgetting to take medication.7,12,13 Modification refers to intentional changes in medication made without consulting the treating physicians. Lack of knowledge refers to missing knowledge about one’s own medication (eg reasons for prescription and effect, time-point, dosage). Forgetfulness includes forgetting to take the medication properly. This three-factor structure of the SAMS was previously demonstrated with exploratory and confirmatory factor analyses in patients with Parkinson's disease, chronic pain, kidney transplantation, and neurogeriatric patients.7,12–14
Network analysis is a relatively new and promising method for modeling interactions between large numbers of variables. Instead of trying to reduce the structure of the variables to their shared information, as is done in classical regression modeling, network analysis estimates the relation between all variables directly.15,16 With this approach, network analysis can visualize the association between different variables without assuming a direction of effects. In this study, we used network analysis as an exploratory approach to describe the complex interactive relationship among the SAMS items. We first aimed to confirm the previously described factor structure. Secondly, we aimed to gain deeper insight into the underlying SAMS structure to understand the different clusters of nonadherence in a large group of patients.
Materials and Methods
Samples
As a base for the network analysis, four large datasets using the SAMS were combined:
- The NeuroGerAdh study, a longitudinal, observational study of hospitalized older adults with neurological disorders (mainly movement disorders, cerebro-vascular disorders, and neurodegenerative disorders) was conducted from 2019–2021 and contains data on 910 patients regarding quality of life, cognition, depression, adherence and overall health behaviour.17,18
- Between 2007 and 2008, medication adherence, coping and the transplantation-specific distress were examined in 418 kidney transplanted patients at the Essen University Hospital, Germany in the NTX Study.19
- In an observational, cross-sectional study of 260 chronic pain patients from three pain and orthopedic facilities in Germany between 2017 and 2018, adherence, psychological distress and personality traits were assessed.20
- The association between health locus of control (HLC) and the SAMS was assessed in an observational, cross-sectional study of 160 patients recruited from three primary care practices in Germany comprising a wide spectrum of common illnesses, including hypertension, diabetes and thyroid diseases.21
Across all datasets, we used the following data for the network analysis: age (metric, years), gender (binominal, female/male), SAMS items 1 to 18 (ordinal, Likert-scale), SAMS total score.
The descriptives of the entire study cohort and the single studies are given in Table 1, Supplement Figure 1 and Supplement Tables 1–4.
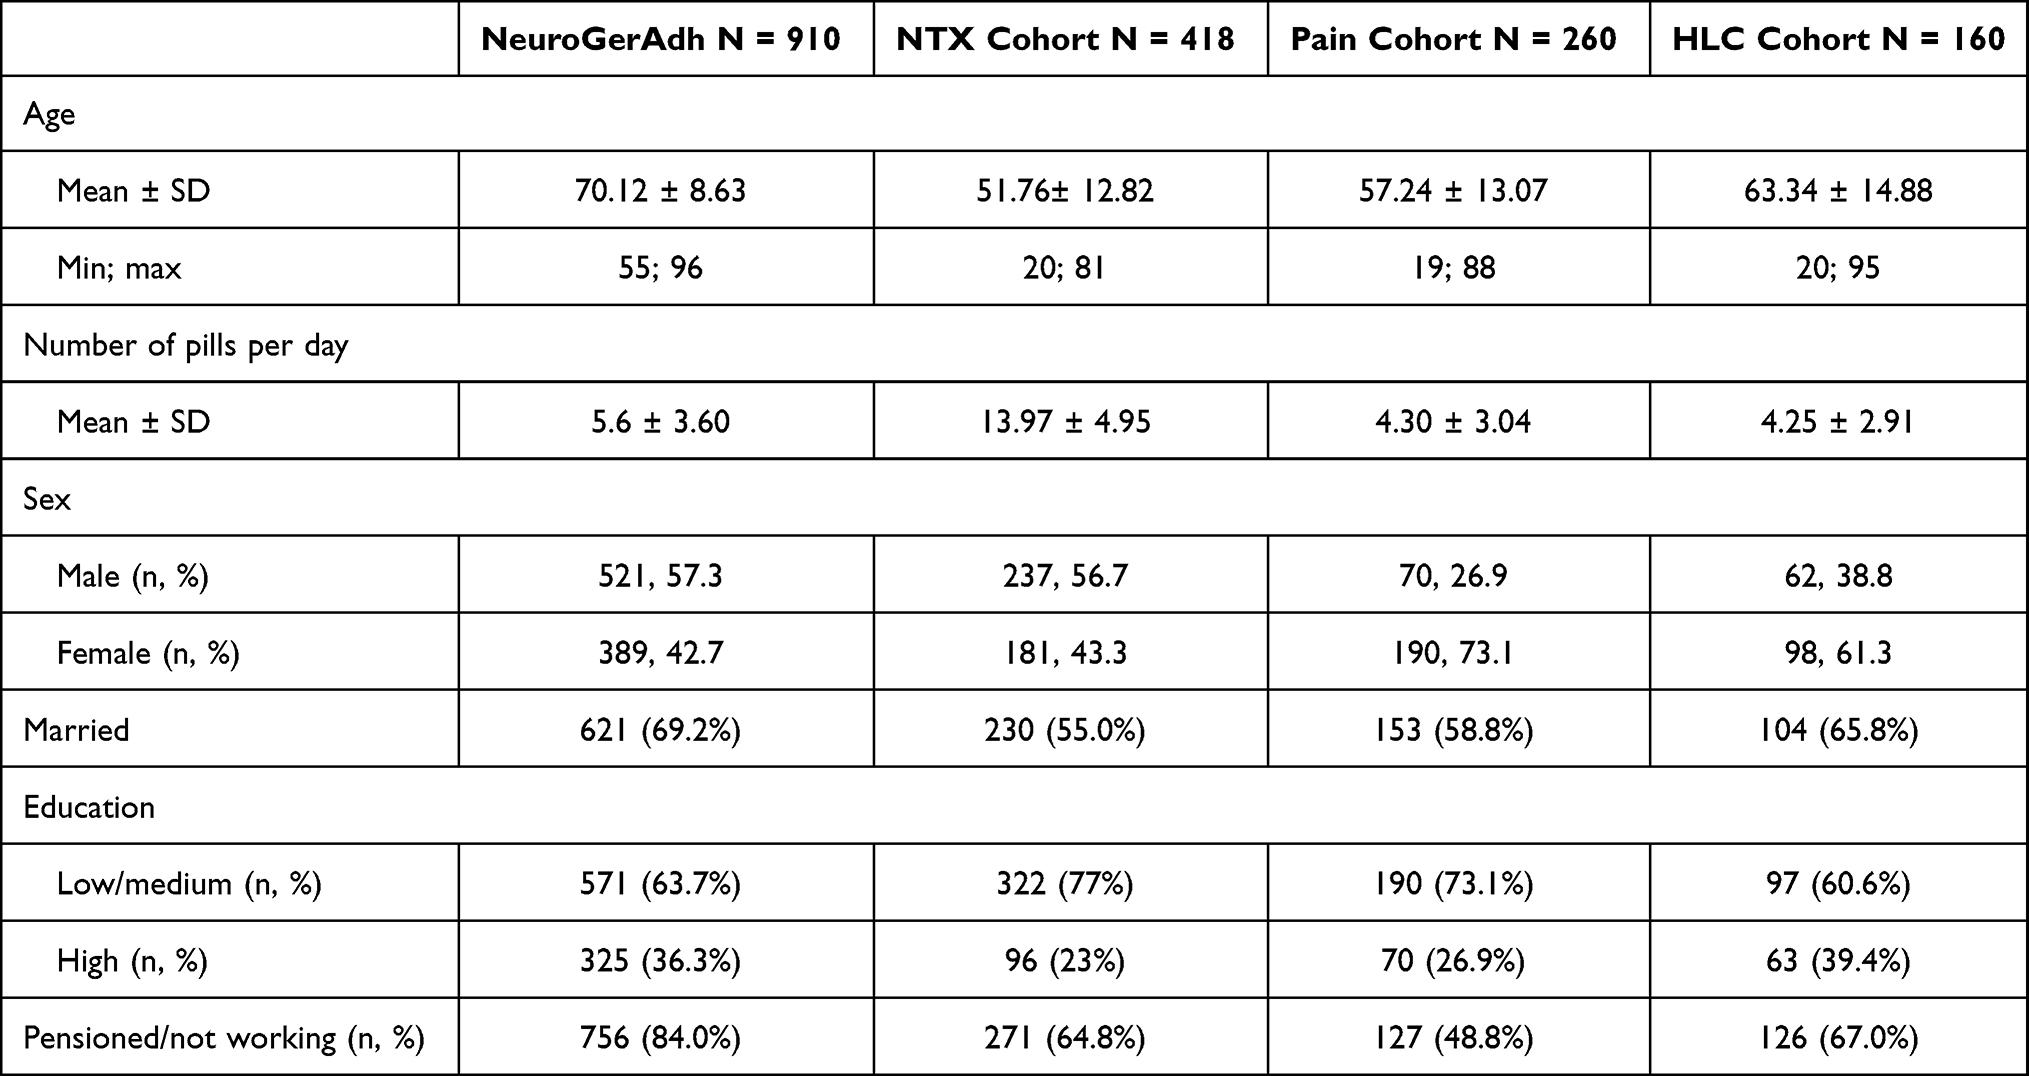 |
Table 1 Summary Descriptive Statistics of the Study Cohorts |
Measuring Adherence – SAMS
The SAMS is a self-report questionnaire constructed for measurement of adherence independent of the underlying disease. The SAMS includes 18 questions forming a cumulative score (0 = complete adherence to 72 = complete non-adherence). For all items, a higher value indicates higher nonadherence. The SAMS covers aspects of intentional and non-intentional nonadherence. The development and psychometric properties of the SAMS are detailed in the SAMS manual, but in brief, its construction was inspired by the Morisky Score, of which four items were included. Additional items were added from a study by Rottlaender et al (2007) on polymedication and agreed upon in expert meetings.12,22,23 The SAMS has previously been validated in three different cohorts (N = 418, N = 779 and N = 260, total N = 1457) and showed good psychometric properties (overall internal consistency a = 0.83). Floor effects are expected for this instrument, as it includes the value 0 as a measure of total adherence for each item.12 Previous factor analysis12 and principal component analysis14 suggested a three-factor solution: intentional modification of medication (items 4, 7–13, 17), lack of knowledge about reasons/dosage/timing of medication (items 1–3, 5), forgetting to take medication (items 6, 14–16, 18).12 An overview of all SAMS items is given in Figure 1.
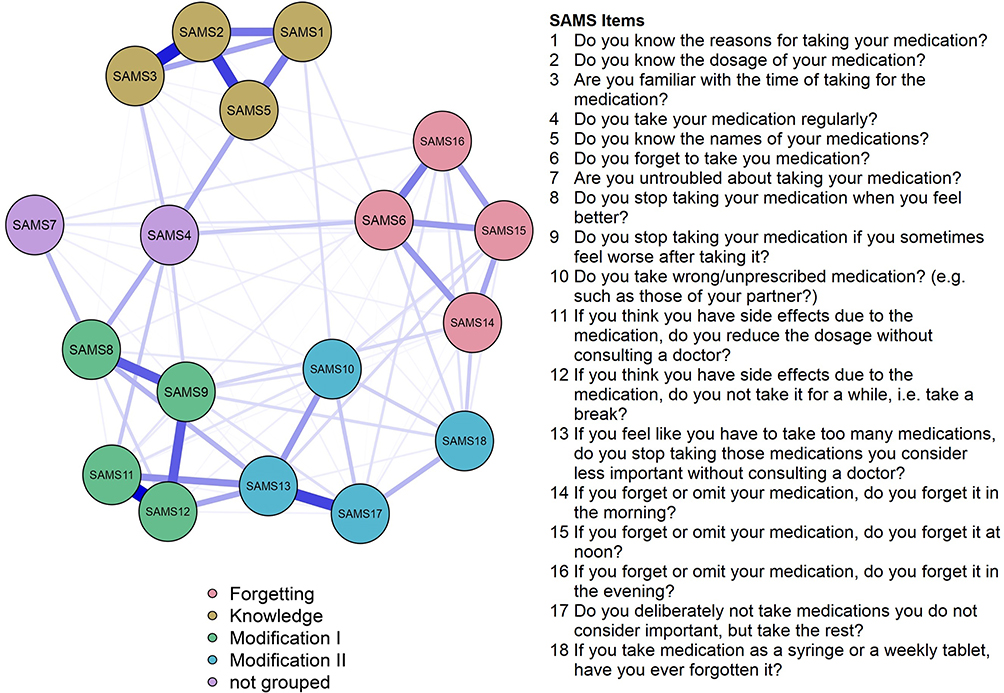 |
Figure 1 Network plot and SAMS items. |
Statistical Analyses
All analyses were conducted using IBM SPSS statistics (Version 25), JASP (Version 0.16), and R version 4.1.1, in particular the R packages bootnet (Version 1.5)15 and qgraph (Version 1.9).24 Descriptive statistics were used to describe the cohort. For the network analysis, the SAMS items were used to understand how different aspects of nonadherence relate to each other.25
Network Construction
A network presents variables as nodes, connected to each other via lines (edges). In a simple correlation network, all significant and non-significant edges are shown, causing much noise (Supplement Figure 2). Therefore, instead of using correlations, we used a regularized estimation method called the Extended Bayesian Information Criterion Graphical Least Absolute Shrinkage and Selection Operator (EBICglasso).15 It estimates the partial correlations between all variables and shrinks the absolute weights towards zero. Hence, edge weights which were shrunken to exactly zero do not have to be tested against zero anymore, alleviating the problem of multiple testing. The extended Bayesian Information Criteria (EBIC) was used as an information criterion that takes both model complexity and model fit into account.26 Missing values in EBIClasso were pairwise treated.
Network Visualization
The nodes are positioned using the Fruchterman-Reingold algorithm. It organizes the network based on the strength of the connections between nodes. Blue edges referred to positive associations, while red edges indicated negative ones. The thicker the edge, the stronger the association between two nodes.24
We used the following centrality parameters to describe nodes and edges in the network:
- Strength, which quantifies how well a node is directly connected to other nodes.27
- Edge betweenness centrality score, defined as the number of the shortest paths that go through an edge in a network. It refers to the edges that are most “between” domains, representing a bridge-like connector between two parts of a network.28 The removal of this edge may affect the communication between many pairs of nodes through the shortest paths between them.
Network Stability and Accuracy
A case-dropping bootstrap procedure was used to examine the node strength stability. A network is stable if a large proportion of the sample can be excluded from the dataset without observing significant changes in the indices. For a stable network, the Correlation Stability Coefficient (CS-C) is preferably above 0.5. A nonparametric bootstrap procedure based on 95% confidence intervals (95% CIs) was used to assess the edge weights stability, with narrower 95% CIs indicating a more trustworthy network. Bootstrap stability difference test was used to test between edge-weights that were non-zero, and to assess whether the nodes in the network differed significantly in terms of strength centrality edge-weights.15
Confirmatory factor analyses (CFA) using JASP (Version 0.16) were conducted with a diagonally weighted least square (DWLS) estimator. Goodness-of-fit was evaluated using the χ2 statistic of exact fit, comparative fit index (CFI), Tucker–Lewis index (TLI), and root mean square error of approximation (RMSEA). TLI and CFI should be >0.90, and RMSEA <0.08 for an acceptable fit.29
Results
Network Structure
The network of SAMS items is shown in Figure 1. Strength as a centrality measure is summarized in Figure 2. On a global level, the network can visually be divided into four domains: items about forgetting to take medication (SAMS 6, 14, 15, 16), items covering lack of knowledge about medication (SAMS 1, 2, 3, 5), and items about modification of medication, which can be further divided into two subdomains containing SAMS items 8, 9, 11, 12 and items 10, 13, 17, and 18. Two items (4, 7) cannot be categorized into one of these domains (see Figure 1 for a description of the SAMS items).
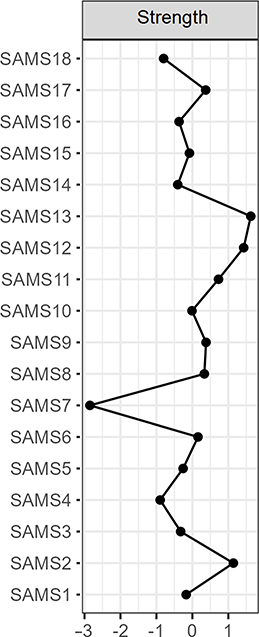 |
Figure 2 Centrality plot. |
Various cross-domain associations bridge the borders between these domains. Within-domain associations were stronger than between-domain associations. The edge SAMS 11–12 (dose change or stop intake due to side effects) shows the strongest association, followed by the edge SAMS 2–3 (knowledge about dose and timing of medication), and SAMS 2–5 (knowledge about dose and names of medication) (see Supplement Table 5 for the weights matrix). As provided in Supplement Table 6, highest edge betweenness centrality was observed for SAMS 4–5 (regular medication intake, knowing names of medication), SAMS 4–6 (regular medication intake – forgetting medication), and SAMS 4–8 (regular medication intake – stop medication intake when feeling better).
As shown in Figure 2, the SAMS item 13 (change of medication when feeling that one takes too many drugs) has the highest node strength in the network, followed by SAMS 12 (change of medication due to side effects) and SAMS 2 (knowing doses). The values for expected influence were equal to strength.
Network Stability
Supplement Figures 3–6 show the results of the accuracy and stability checks. Overall, the network model is stable, many of the identified edges and centrality measures are significantly different from each other. All findings are interpretable The case-dropping bootstrap procedure shows that CS-Cs of both node strength and edge were 0.75. Network plots for each of the individual datasets are given in Supplement Figure 7A-D. As expected, certain edges differ slightly between the datasets, although the overall structure of the network and the subcategorization of the modification domain is comparable.
Various CFAs were calculated to assess the model fit of a four-factor solution (with two factors for modification) with and without the items 4 and 7. The best model fit was reached when item 4 and 7 were excluded from the four factors and when the modification domain was separated into a factor with items 8, 9, 11, 12 and a factor with items 10, 13, 17 and 18 (Table 2 and Supplement Table 7 for all analyses).
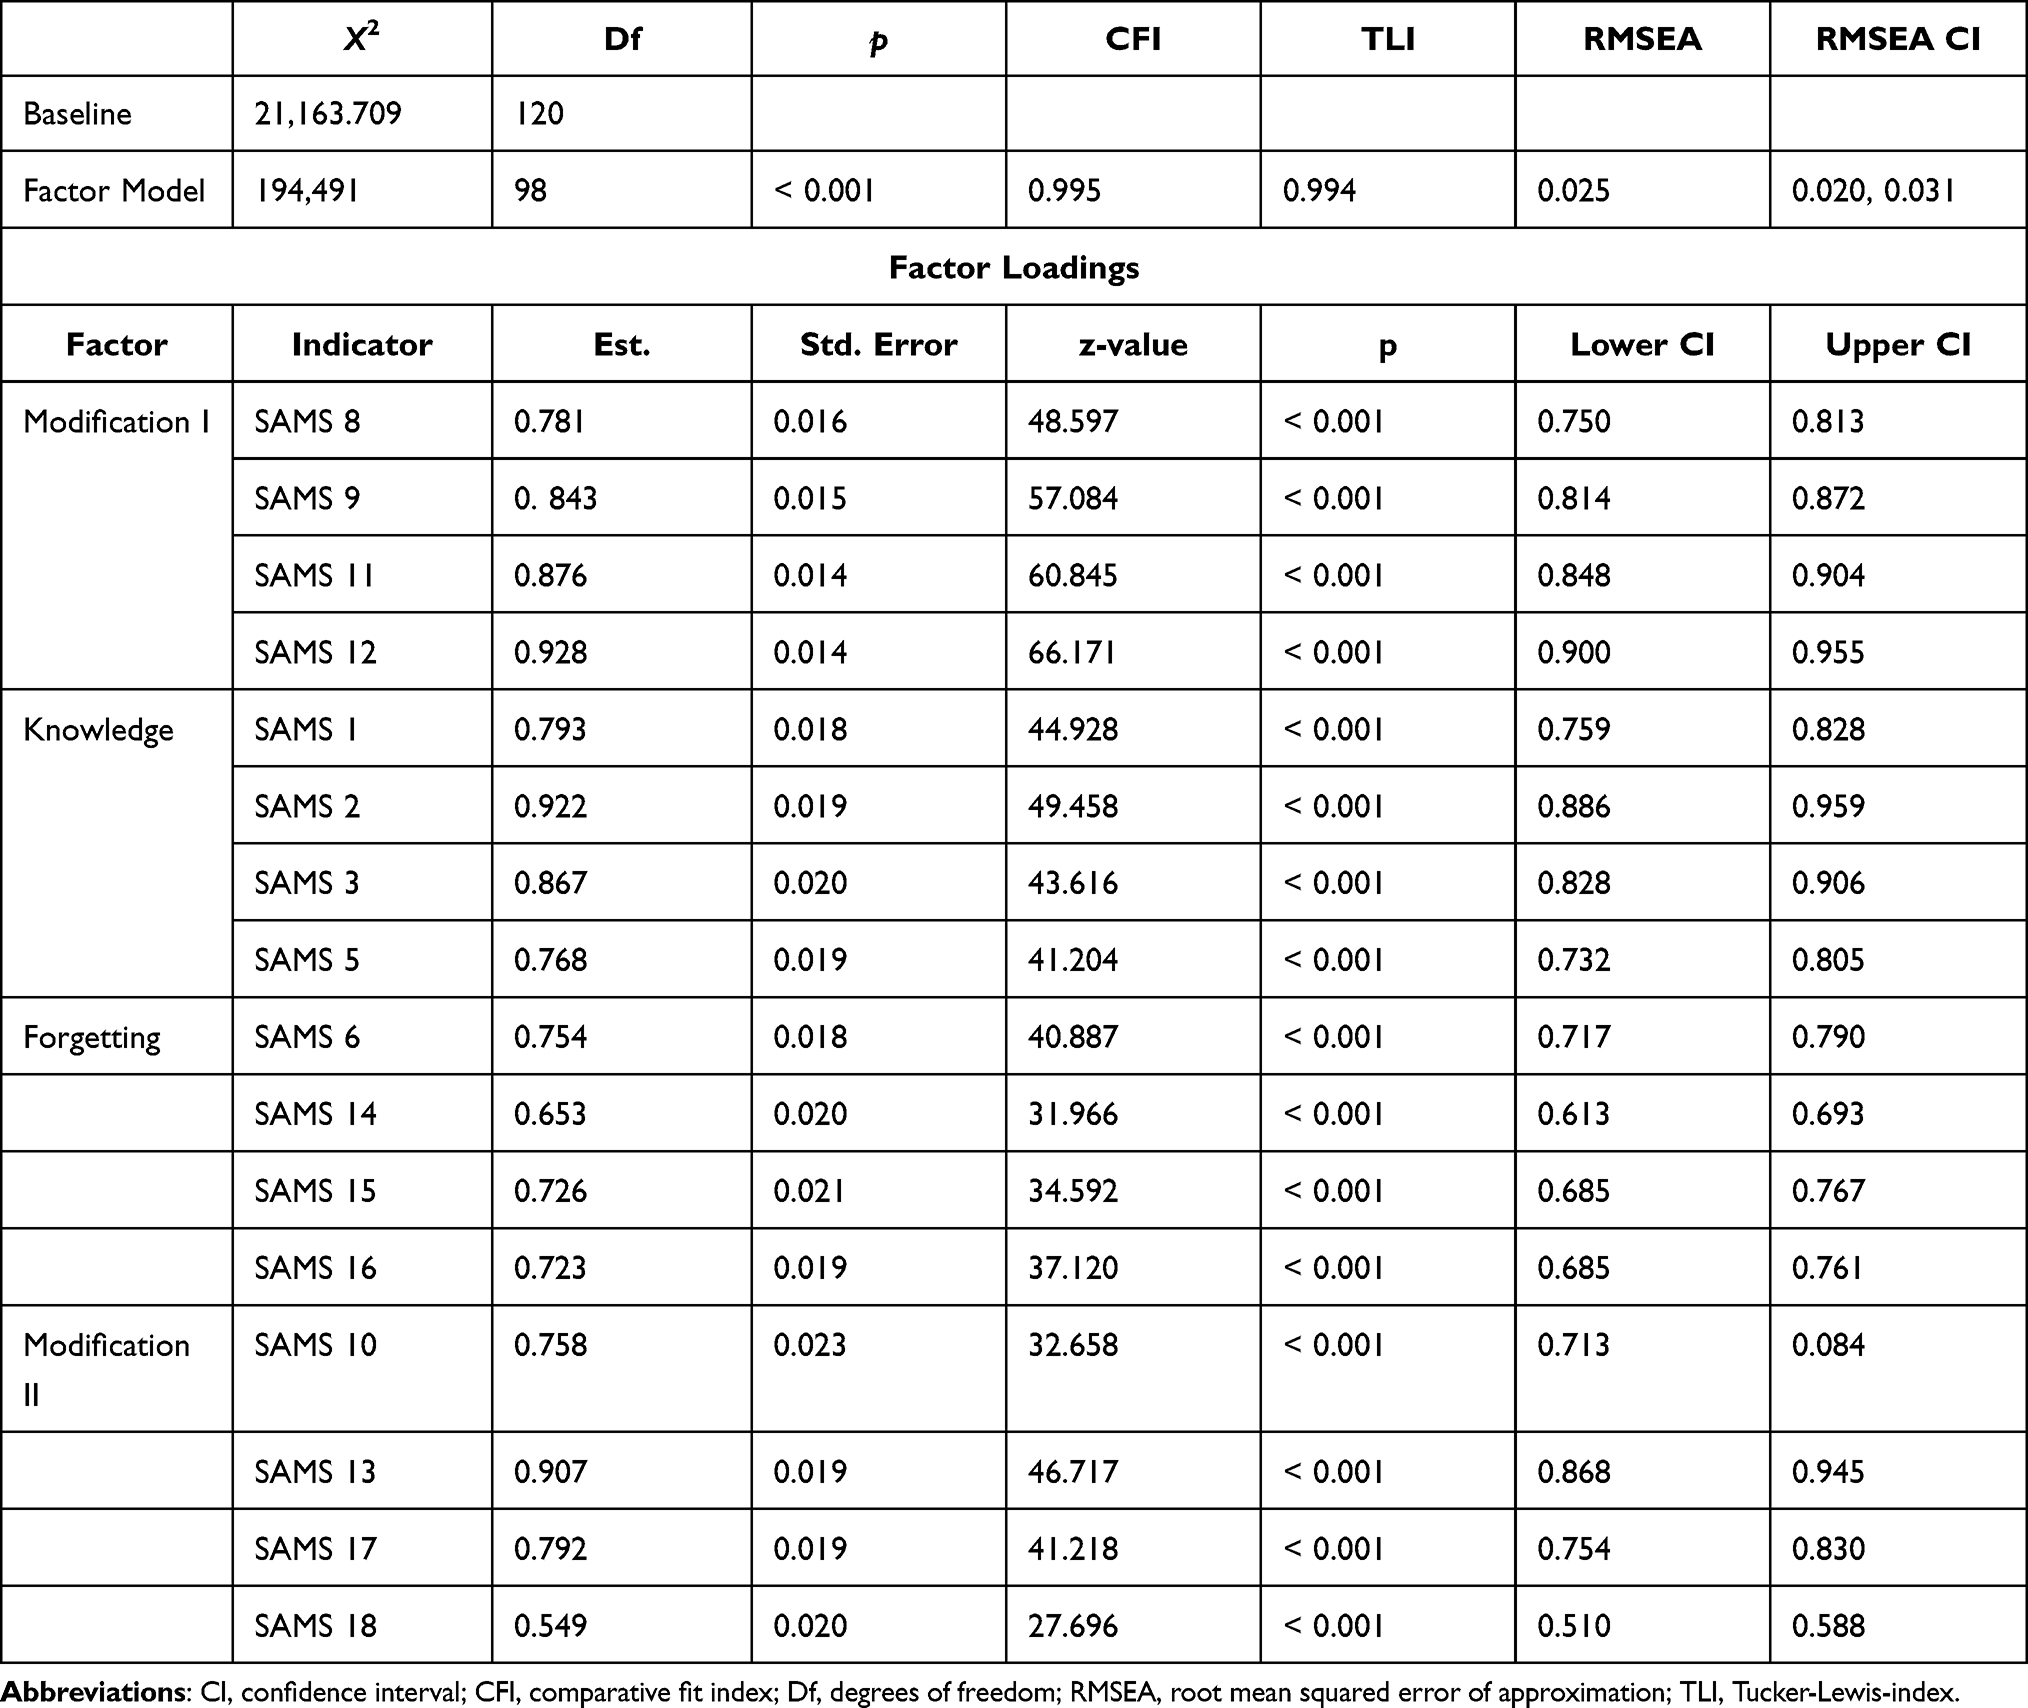 |
Table 2 Confirmatory Factor Analysis |
Discussion
To the best of our knowledge, this was the first study that characterized a self-reported adherence questionnaire using network analysis.
One property of a node in a network is its strength, which refers to the number of connections it has with other nodes. Network analysis revealed that SAMS items 13 (change of medication when feeling that one’s takes too many drugs), 12 (change of medication due to side effects), and 2 (knowing medication dose) had the highest node strength in the network. This identifies the listed items as putative network hubs, which is in line with previous research as both high number of drugs (eg, polypharmacy) and adverse effects have been repeatedly identified as influential factors contributing to nonadherence.2,5,30,31 Additionally, the expected influence, which assesses the cumulative influence within the network, indicates that items 13, 12 and 2 are highly influential nodes in the network.32 Therefore, our network analysis was able to detect commonly identified influential factors for nonadherence, namely taking too many medications, adverse effects and lack of knowledge.2 The edge betweenness centrality refers to the edges that represent a bridge-like connector between two parts of a network. The edge between item 4 (taking medication regularly) and item 5 (knowing names of medication), between item 4 and item 6 (forgetting to take medication), and between item 4 and 8 (stop taking medication when feeling better) may affect the communication between many pairs of nodes through the shortest paths between them.
In line with previous studies, the network revealed that the SAMS consists of different domains: non-intentional nonadherence (forgetting), lack of knowledge about medication, and intentional nonadherence (modification of medication).7,12,14 The present network analyses, however, showed that intentional nonadherence (modification of medication) can be further categorized into two different domains, which was also confirmed by CFA. Persons in the group modification I modify their medication due to adverse effects (items 9, 11, 12) or when they believe that medication is no longer necessary (item 8). These modifications seem reasonable to the patient and can be interpreted as a behavior to regain control.33 As stated in previous research, nonadherence is closely related to health beliefs and concerns,34,35 and it seems that as health either improves or worsens due to sudden adverse effects, patients modify their medication accordingly.30,31 In contrast, people in the modification II group deliberately do not take medication (item 17), consider medication to be less important (item 13), or take wrong or other/unprescribed medications (item 10). Unlike modification group I, this behavior suggests that medication is not adjusted as a response to recent changes in health such as improvement after a hospital stay or sudden adverse effects, but rather based on overall mistrust and concerns regarding medication.34,36
The subcategorization of the factor modification of medication underlines the complex nature of self-reported intentional nonadherence. This distinction is crucial for clinical practice, because it has different implications for health outcomes and requires different treatments in intervention studies. Previous intervention studies to improve medication adherence only have weak or modest effect sizes, partially because the complexity of adherence is not fully taken into account.2,37 Our results again highlight the need to identify the underlying reasons for nonadherence, as different aspects of nonadherence may differentially influence patient behavior and require different interventional approaches. For example, while forgetting may require habit-building interventions and constant reminders, a patient with high scores in modification factor II may instead benefit from motivational interviewing and interventions targeted at cognitive/belief changes.37 In contrast, patients with intentional nonadherence according to the modification factor I may profit from education approaches (ie, how to proceed correctly in case of adverse effects). Patient-centeredness is an often-cited but often lacking approach for adherence interventions,2,3,37 and the results of our network analysis once more imply that a closer look at the individual composition of each patients’ nonadherence profile is required for optimal intervention design. Further studies are necessary to explore which parameters (eg, psychological, socio-economic) are relevant for the two subcategories of intentional adherence.
Interestingly, item 18 (forgetting medication which has to be taken as a syringe or a weekly tablet) was closer related to the modification domain than to forgetting domain, which may be rooted in patients perceiving medication as less important if it has to be taken less frequently. However, the estimate of item 18 in the CFA was lower, indicating that this item is less strongly correlated with the modification II factor.
Limitations
Although a broad spectrum of patients with varying diseases was represented in the data, patterns of adherence may vary depending on diagnosis and age.2 We therefore calculated the stability of the network by using a case-dropping bootstrap procedure.15 This re-estimates strength and edge with an increasingly higher percentage of dropped-out cases. Afterwards, the correlation between the original index and those from the subsamples were calculated. These analyses showed that the network model is stable Of note, to incorporate disease-specific differences between the merged datasets, a network was calculated for each individual dataset. However, due to small sample sizes, these network analyses cannot be considered stable and only serve as an initial overview to show that the structure of the SAMS does not differ significantly between the samples included in the respective datasets.
Since the study was limited to the SAMS and therefore German samples, the findings cannot be generalized to other adherence questionnaires or patient groups. Although self-reported questionnaires have been shown to be comparable to objective measures of adherence,11 no other measures of adherence were employed in this study. Thus, the SAMS scores should be interpreted with caution, as self-reports may be subject to biases.38 However, as this analysis merely describes categories of nonadherence and does not aim to predict its relationship with health outcomes, we believe that a statement on the structure of the SAMS can be made on the basis of our data. Further studies using different self-report adherence questionnaires are required to confirm the subcategorization of intentional nonadherence. This is necessary, because patterns and subdomains may vary depending on diagnoses and other cohort characteristics.39–41 Of note, network analysis is an exploratory approach and causal statements cannot be drawn from cross-sectional datasets.
Conclusion
Using network analysis followed by CFA, we were able to show that nonadherence can be grouped into different categories: forgetting to take medication, lack of knowledge about medication, and intentional modification of medication. Of note, the last category can be further divided into modification group I and II, with the first group adjusting medication based on changes in health and the second group modifying medication due to mistrust in or concerns about medication. In addition to those categories, taking too many medications, lack of basic knowledge of medication (such as dosage) and having adverse effects were identified as particularly influential variables for nonadherence in the network. Network analysis proved to be a valuable tool for gaining a deeper insight into the complex interplay between elements of nonadherence, especially as it is able to visualize the bidirectional relationships between different items and hidden subdomains of adherence measures. The datasets analyzed in the present manuscript serve as an example of how subcomponents of adherence can be detected. This is essential to fully understand patient barriers and resources, as patients may differ in the individual constellation of these subcomponents. Taking a closer look at the interplay between different facets of adherence might help to pave the way toward individualized interventions.
Data Sharing Statement
The dataset used in Study 1 (NeuroGerAdh Study) is freely accessible for scientific purposes at: Prell, T., & Schönenberg, A. (2022). Data on medication adherence in adults with neurological disorders: The NeuroGerAd study. doi: 10.17605/OSF.IO/KUAPH. Retrieved from osf.io/kuaph. All other datasets can be requested from the corresponding author upon reasonable request.
Ethics Approval and Informed Consent
All datasets included in the present analysis were approved by the respective ethics committee and all patients gave written informed consent.Study 1 and 4 were approved by the local ethics committee of Jena University Hospital, Germany, approval number 5290-10/17.Study 2 and 3 were approved by the local ethics committee of the Department of Applied Human Sciences of the University of Applied Science Magdeburg-Stendal, approval number AZ 4973-8.
Funding
As the analysis is based on previously collected data, no funding was used for this manuscript.
Disclosure
The authors report no conflicts of interest in this work.
References
1. Haynes RB, Yao X, Degani A, Kripalani S, Garg A, McDonald HP. Interventions for enhancing medication adherence. Cochrane Database Syst Rev. 2005;(4). doi:10.1002/14651858.CD000011.pub2
2. Yap AF, Thirumoorthy T, Kwan YH. Systematic review of the barriers affecting medication adherence in older adults. Geriatr Gerontol Int. 2016;16(10):1093–1101. doi:10.1111/ggi.12616
3. Brown MT, Bussell J, Dutta S, Davis K, Strong S, Mathew S. Medication Adherence: truth and Consequences. Am J Med Sci. 2016;351(4):387–399. doi:10.1016/j.amjms.2016.01.010
4. Brown MT, Bussell JK. Medication adherence: WHO cares? Mayo Clinic Proc. 2011;86(4):304–314. doi:10.4065/mcp.2010.0575
5. Tsai KT, Chen JH, Wen CJ, et al. Medication adherence among geriatric outpatients prescribed multiple medications. Am J Geriatr Pharmacother. 2012;10(1):61–68. doi:10.1016/j.amjopharm.2011.11.005
6. Mukhtar O, Weinman J, Jackson SH. Intentional non-adherence to medications by older adults. Drugs Aging. 2014;31(3):149–157. doi:10.1007/s40266-014-0153-9
7. Prell T, Grosskreutz J, Mendorf S, Franke GH, Witte OW, Kunze A. Clusters of non-adherence to medication in neurological patients. Res Social Adm Pharm. 2019;15(12):1419–1424. doi:10.1016/j.sapharm.2019.01.001
8. Gadkari AS, McHorney CA. Unintentional non-adherence to chronic prescription medications: how unintentional is it really? BMC Health Serv Res. 2012;12(1):98. doi:10.1186/1472-6963-12-98
9. Richardson K, Kenny RA, Peklar J, Bennett K. Agreement between patient interview data on prescription medication use and pharmacy records in those aged older than 50 years varied by therapeutic group and reporting of indicated health conditions. J Clin Epidemiol. 2013;66(11):1308–1316. doi:10.1016/j.jclinepi.2013.02.016
10. Nguyen TM, La Caze A, Cottrell N. What are validated self-report adherence scales really measuring?: a systematic review. Br J Clin Pharmacol. 2014;77(3):427–445. doi:10.1111/bcp.12194
11. Shi L, Liu J, Koleva Y, Fonseca V, Kalsekar A, Pawaskar M. Concordance of adherence measurement using self-reported adherence questionnaires and medication monitoring devices. PharmacoEconomics. 2010;28(12):1097–1107. doi:10.2165/11537400-000000000-00000
12. Franke GH, Nentzl J, Jagla-Franke M. SAMS. Stendal Adherence to Medication Score. Testmanual. Psychometrikon; 2020. Available from: www.psychometrikon.de.
13. Franke GH, Nentzl J, Jagla-Franke M, Prell T. Medication Adherence and Coping with Disease in Patients from a Neurological Clinic: an Observational Study. Patient Prefer Adherence. 2021;15:1439–1449. doi:10.2147/ppa.S311946
14. Mendorf S, Witte OW, Grosskreutz J, Zipprich HM, Prell T. What Predicts Different Kinds of Nonadherent Behavior in Elderly People With Parkinson’s Disease? Front Med. 2020;7:103. doi:10.3389/fmed.2020.00103
15. Epskamp S, Borsboom D, Fried EI. Estimating psychological networks and their accuracy: a tutorial paper. Behav Res Methods. 2018;50(1):195–212. doi:10.3758/s13428-017-0862-1
16. Borsboom D, Cramer AO. Network analysis: an integrative approach to the structure of psychopathology. Annu Rev Clin Psychol. 2013;9:91–121. doi:10.1146/annurev-clinpsy-050212-185608
17. Prell T. Adherence to medication in neurogeriatric patients: an observational cross-sectional study. BMC Public Health. 2019;19(1):1012. doi:10.1186/s12889-019-7353-5
18. Prell T, Schönenberg A. Data on medication adherence in adults with neurological disorders: The NeuroGerAd study. OSF. 2022. Available from osf.io/kuaph. Accessed April 29, 2022. doi:10.17605/OSF.IO/KUAPH.
19. Türk H, Franke GH, Jagla M, et al. Development of the Essen Compliance Score – measurement of adherence in kidney transplant patients. Am J Transplant. 2009;9(Supplement 2);43.
20. Franke GH, Nentzl J, Küch D, Jagla-Franke M. Die Erfassung der Medikamenten-Adhärenz bei Schmerzpatientinnen und -patienten. Praxis Klinische Verhaltensmedizin und Rehabilitation. 2020;33(2):146–158.
21. Gerland HE, Prell T. Association Between the Health Locus of Control and Medication Adherence: an Observational, Cross-Sectional Study in Primary Care. Front Med. 2021;8:705202. doi:10.3389/fmed.2021.705202
22. DE M, LW G, Levine DM. Concurrent and predictive validity of a self-reported measure of medication adherence. Med Care. 1986;24(1):67–74. doi:10.1097/00005650-198601000-00007
23. Rottlaender D, Scherner M, Schneider T, Erdmann E. Multimedikation, Compliance und Zusatzmedikation bei Patienten mit kardiovaskulären Erkrankungen. Polypharmacy, compliance and non-prescription medication in patients with cardiovascular disease in Germany. Dtsch Med Wochenschr. 2007;132(04):139–144. doi:10.1055/s-2007-959300
24. Epskamp S, Cramer AOJ, Waldorp LJ, Schmittmann VD, Borsboom D. qgraph: network visualizations of relationships in psychometric data. J Stat Software. 2012;48(4):1–18. doi:10.18637/jss.v048.i04
25. Askar M, Cañadas RN, Svendsen K. An introduction to network analysis for studies of medication use. Res Social Adm Pharm. 2021;17(12):2054–2061. doi:10.1016/j.sapharm.2021.06.021
26. Foygel R, Drton M. Extended Bayesian Information Criteria for Gaussian Graphical Models. Adv Neural Inf Process Syst. 2010;23;2654.
27. Opsahl T, Agneessens F, Skvoretz J. Node centrality in weighted networks: generalizing degree and shortest paths. Soc Networks. 2010;32(3):245–251. doi:10.1016/j.socnet.2010.03.006
28. Girvan M, Newman MEJ. Community structure in social and biological networks. Proc Natl Acad Sci. 2002;99(12):7821–7826. doi:10.1073/pnas.122653799
29. Rosseel Y. lavaan: an R Package for Structural Equation Modeling. J Stat Softw. 2012;48(2):36. doi:10.18637/jss.v048.i02
30. Jarab AS, Mukattash TL. Exploring variables associated with medication non-adherence in patients with COPD. Int J Clin Pharm. 2019;41(5):1202–1209. doi:10.1007/s11096-019-00895-3
31. Elsayed MA, El-Sayed NM, Badi S, Ahmed MH. Factors affecting adherence to antiepileptic medications among Sudanese individuals with epilepsy: a cross-sectional survey. J Family Med Prim Care. 2019;8(7):2312–2317. doi:10.4103/jfmpc.jfmpc_405_19
32. Robinaugh DJ, Millner AJ, McNally RJ. Identifying highly influential nodes in the complicated grief network. J Abnorm Psychol. 2016;125(6):747–757. doi:10.1037/abn0000181
33. Huyard C, Derijks L, Haak H, Lieverse L. Intentional Nonadherence as a Means to Exert Control. Qual Health Res. 2017;27(8):1215–1224. doi:10.1177/1049732316688882
34. Schüz B, Wurm S, Ziegelmann JP, Warner LM, Tesch-Römer C, Schwarzer R. Changes in functional health, changes in medication beliefs, and medication adherence. Health Psychol. 2011;30(1):31–39. doi:10.1037/a0021881
35. Schüz B, Marx C, Wurm S, et al. Medication beliefs predict medication adherence in older adults with multiple illnesses. J Psychosom Res. 2011;70(2):179–187. doi:10.1016/j.jpsychores.2010.07.014
36. Cea-Calvo L, Marín-Jiménez I, de Toro J, et al. Different Associations of Intentional and Non-Intentional Non-Adherence Behaviors with Patient Experience with Healthcare and Patient Beliefs in Medications: a Survey of Patients with Chronic Conditions. Patient Prefer Adherence. 2020;14:2439–2450. doi:10.2147/ppa.S281985
37. Conn VS, Ruppar TM. Medication adherence outcomes of 771 intervention trials: systematic review and meta-analysis. Prev Med. 2017;99:269–276. doi:10.1016/j.ypmed.2017.03.008
38. Stirratt MJ, Dunbar-Jacob J, Crane HM, et al. Self-report measures of medication adherence behavior: recommendations on optimal use. Transl Behav Med. 2015;5(4):470–482. doi:10.1007/s13142-015-0315-2
39. Seng JJB, Tan JY, Yeam CT, Htay H, Foo WYM. Factors affecting medication adherence among pre-dialysis chronic kidney disease patients: a systematic review and meta-analysis of literature. Int Urol Nephrol. 2020;52(5):903–916. doi:10.1007/s11255-020-02452-8
40. Yeam CT, Chia S, Tan HCC, Kwan YH, Fong W, Seng JJB. A systematic review of factors affecting medication adherence among patients with osteoporosis. Osteoporos Int. 2018;29(12):2623–2637. doi:10.1007/s00198-018-4759-3
41. Capoccia K, Odegard PS, Letassy N. Medication Adherence With Diabetes Medication: a Systematic Review of the Literature. Diabetes Educ. 2016;42(1):34–71. doi:10.1177/0145721715619038
 © 2022 The Author(s). This work is published and licensed by Dove Medical Press Limited. The
full terms of this license are available at https://www.dovepress.com/terms
and incorporate the Creative Commons Attribution
- Non Commercial (unported, 3.0) License.
By accessing the work you hereby accept the Terms. Non-commercial uses of the work are permitted
without any further permission from Dove Medical Press Limited, provided the work is properly
attributed. For permission for commercial use of this work, please see paragraphs 4.2 and 5 of our Terms.
© 2022 The Author(s). This work is published and licensed by Dove Medical Press Limited. The
full terms of this license are available at https://www.dovepress.com/terms
and incorporate the Creative Commons Attribution
- Non Commercial (unported, 3.0) License.
By accessing the work you hereby accept the Terms. Non-commercial uses of the work are permitted
without any further permission from Dove Medical Press Limited, provided the work is properly
attributed. For permission for commercial use of this work, please see paragraphs 4.2 and 5 of our Terms.