Back to Journals » Risk Management and Healthcare Policy » Volume 15
Identifying Patient Profiles for Developing Tailored Diabetes Self-Management Interventions: A Latent Class Cluster Analysis
Authors Qu H ![]() , Shewchuk RM, Richman J, Andreae LJ, Safford MM
, Shewchuk RM, Richman J, Andreae LJ, Safford MM
Received 1 March 2022
Accepted for publication 6 May 2022
Published 13 May 2022 Volume 2022:15 Pages 1055—1063
DOI https://doi.org/10.2147/RMHP.S355470
Checked for plagiarism Yes
Review by Single anonymous peer review
Peer reviewer comments 2
Editor who approved publication: Dr Jongwha Chang
Haiyan Qu,1 Richard M Shewchuk,1 Joshua Richman,2 Lynn J Andreae,3 Monika M Safford4
1Department of Health Services Administration, School of Health Professions, University of Alabama at Birmingham (UAB), Birmingham, AL, USA; 2Department of Surgery, School of Medicine, UAB, Birmingham, AL, USA; 3Department of Medicine, School of Medicine, UAB, Birmingham, AL, USA; 4Department of Medicine, Weill Cornell Medical College, New York, NY, USA
Correspondence: Haiyan Qu, Department of Health Services Administration, School of Health Professions, University of Alabama at Birmingham, SHPB 580D, 1716 9th Ave. South, Birmingham, AL, 35294-1212, USA, Email [email protected]
Purpose: Interventions that are tailored to the specific psychosocial needs of people with diabetes may be more effective than a “one size fits all” approach. The purpose of this study is to identify patient profiles with distinct characteristics to inform the development of tailored interventions.
Methods: A latent class cluster analysis was conducted with data from the ENCOURAGE trial based on participant responses to 6 baseline psychosocial measures, including trust in physicians, perceived discrimination, perceived efficacy in patient–physician interactions, social support, patient activation, and diabetes distress. The trial’s primary outcomes were hemoglobin A1c, body mass index, systolic blood pressure, low-density lipoprotein cholesterol, and quality of life; secondary outcomes were diabetes distress and patient engagement.
Results: Three classes of participants were identified: Class 1 (n = 72) had high trust, activation, perceived efficacy and social support; low diabetes distress; and good glycemic control (7.1 ± 1.3%). Class 2 (n = 178) had moderate values in all measures with higher baseline A1c (8.1 ± 2.1%). Class 3 (n = 155) had high diabetes distress; low trust, patient engagement, and perceived efficacy; with similar baseline A1c (8.2 ± 2.1%) as Class 2. Intervention effects differed for these 3 classes.
Conclusion: Three distinct subpopulations, which exhibited different responses to the ENCOURAGE intervention, were identified based on baseline characteristics. These groups could be used as intervention targets. Future studies can determine whether these approaches can be used to target scarce resources efficiently and effectively in real-world settings to maximize the impact of interventions on population health, especially in impoverished communities.
Keywords: latent class cluster analysis, patient-centered care, diabetes, self-management, trust in physicians
Introduction
The chronic nature of diabetes requires long-term adherence to medications and lifestyle adjustments (diet, physical activity, blood glucose monitoring), but adherence to these recommendations is variable, especially among minority low-income patients living in rural areas.1–6 Patient engagement in their own care has been shown to lead to better outcomes, and an important first step in achieving engagement is education.7 However, education alone has been shown to yield only modest improvements in glycemic control, suggesting that more intensive interventions may be needed.8 In resource-constrained settings, an understanding of which patients are at greatest need and providing them with the most effective services can maximize the efficient use of resources. Unfortunately, approaches to achieving this goal are not well established.
The concept of tailoring interventions is gaining traction. A recent meta-analysis examined the effects of culturally tailored diabetes education on diabetes control for ethnic minorities with type 2 diabetes.9 The authors found that the magnitude of the effect varied based on intervention settings and baseline hemoglobin A1c (A1c) level, and concluded that more randomized controlled trials are needed.9 Indeed, other than the lack of glycemic control, it is not clear which specific characteristics are best targeted for tailored interventions, especially for rural populations. In addition to knowledge deficits, many rural dwellers with diabetes face economic constraints and limited social supports due to their relative isolation. For many minorities, trust in health care providers and perceived discrimination pose additional challenges. These characteristics may be present in varying degrees in subgroups of a population, and unless they are specifically targeted and overcome, these barriers could prevent a culturally adapted but generic intervention from being effective in the given subgroup, limiting the overall impact of the intervention.
An analytic method that can help to define groups of patients with distinct patterns of characteristics is latent class cluster analysis (LCCA), a person-based rather than a variable-based analytic method used widely in consumer-oriented industries to differentiate people into subgroups based on a set of defined measures.10 LCCA can be used to identify distinct clusters of individuals so that members of the same class have similarly response patterns that are in turn very different from the patterns found among individuals in the other classes. Specific to diabetes self-care, LCCA can differentiate subgroups of patients based on measures, such as diabetes distress, trust, confidence, engagement, social support, and perceived discrimination. Interventions could then be tailored to the specific needs of each subgroup. LCCA was conducted to identify subgroups of patients in a community-based intervention trial with the ultimate goal of describing subgroups that may warrant different intervention approaches.
Methods
Sample and Setting
Data used in this study were obtained from the community-based cluster-randomized ENCOURAGE trial conducted in rural Alabama from 2010 to 2012.11 The trial tested the effectiveness of brief diabetes education plus a peer coaching intervention compared with brief education alone in improving diabetes outcomes among diabetic residents of underserved, rural, mostly African American communities. Recruitment, intervention development, and data collection are described in detail elsewhere.12,13 Briefly, 424 adults who wanted help with their diabetes were enrolled and received a 60-minute in-person diabetes group education class and personalized report card at baseline. Intervention participants were paired with a volunteer peer coach who resided in the same community and worked with them for at least 10 months primarily via telephone using a patient-driven approach to goal setting and monitoring, problem solving and social support. Because 19 patients had incomplete baseline information on the domains used in LCCA, the current study included a final sample of 405 participants with 187 in the intervention group and 218 in the control group. All participants provided written informed consent in accordance with the Declaration of Helsinki. The institutional review board of the University of Alabama at Birmingham approved the study protocol.
Measures
All measures used in the analyses described below were assessed through an in-person interview conducted by trained personnel using standardized and quality controlled protocols. Participants’ body weight and height, and blood pressure were measured and recorded by trained research assistants at both baseline and 12-month follow-up. A1c and low-density lipoprotein (LDL) cholesterol were measured using point-of-service equipment in capillary fingerstick blood. All questionnaires were administered by trained, certified, and quality-controlled community members using structured interviews.
Variables Used to Determine Class Membership – Indicator Variables
Class membership was determined using baseline participant attitudes and perceptions about diabetes treatment, including trust in physicians, patient activation, perceived efficacy of patient–physician interactions, social support, diabetes distress, and perceived discrimination. Cronbach's alpha was calculated and reported in parentheses in the study sample to show the reliability of each measurement scale. General trust in physicians was assessed using the sum score of the validated 11-item Wake Forest Trust in Physicians Scale with reverse coding for negatively worded items (ie, item 2 and item 7) (α= 0.86), with larger values indicating more trust.14 Patient engagement was assessed using the sum score of the validated 13-item Patient Activation Measure (α= 0.89), with higher scores indicating more engagement.15,16 Perceived efficacy was assessed using the sum score of the 5-item Perceived Efficacy in Patient–Physician Interaction (PEPPI) (α=0.89); higher scores reflect higher self-efficacy.17 Social Support was measured using the sum score of the 5-item Diabetes Social Support Questionnaire-Family Version with reverse coding for negatively worded items (ie, item 4 and 5 (α= 0.68), the larger values indicating more family support.18 Diabetes distress was assessed using the sum score of the validated 17-item Diabetes Distress Scale (α= 0.92), with higher scores indicating greater distress.19 Perceived discrimination was assessed with the 7-item Everyday Discrimination Scale (α= 0.82), using a dichotomized coding with any “yes” response to the 7 items indicating perceived discrimination (yes/no).20
Descriptive Variables
Age, race/ethnicity, sex, educational attainment, and household annual income were self-reported. Physiologic parameters included A1c, blood pressure, low-density lipoprotein (LDL) cholesterol, and body mass index (BMI); these measures correlate directly with longer term outcomes.21 The trial had only one 12-month follow-up. All change scores of the physiologic parameters were calculated between the 12-month follow-up and baseline. Depression was measured using the Patient Health Questionnaire 8 (PHQ-8) (α= 0.85);5 this variable was dichotomized with the sum score of the 8 items greater or equal to 10 as depressive. Quality of life was assessed using a single item assessing overall health from the Short Form-12, dichotomized as fair or poor vs good health,22 as well as the EuroQol-5D self-reported health state (range 0–100).23,24 Delay in seeking healthcare during the past 12 months was assessed using 9 yes/no questions (α= 0.69) (Appendix Table 1); this variable was dichotomized with a “yes” response to any of the 9 questions categorized as “delayed seeking care”.
Statistical Analysis Methods
LCCA, also known as mixture-model clustering, is a specific case of a finite mixture model. LCCA is a probabilistic model-based clustering approach that can be used to identify mutually exclusive homogeneous classes of individuals within a larger population.10 The identification of classes is based on common patterns of how patients/participants responded to each of a set of measures. The fundamental assumption is that class membership is unobserved (ie, latent) but can be inferred from individual characteristics generated by a mixture of underlying response probability distributions. The parameters of the LCCA models can be treated as representing the class membership probability and the conditional response probability is estimated using a maximum likelihood criterion based on the expectation maximization algorithm.25 The pattern of conditional response probabilities within each class provides an interpretational framework for understanding derived classes.10 Generally, the conditional response probability pattern is relatively homogeneous/similar for the participants within a given class but heterogeneous/different from the patterns of participants who are members of the other classes. The class membership probability parameter indicates the proportional membership (relative frequency of participants) assigned to each derived class. The number of classes was based on several goodness-of-fit measures, including the log-likelihood ratio χ2, akaike information criteria (AIC), and Bayesian information criterion (BIC).25 The smaller AIC and/or BIC indicates a better model. The final classification was selected based on the BIC values, number of parameters, size of classification errors, and interpretability.
To understand the different identified classes, we examined participant characteristics within and across classes, including baseline demographics, physiologic variables, and health behaviors. We examined the relationship between qualitative variables and class membership using Chi-square test, and compared the means of quantitative variables across classes using a one-way analysis of variance (ANOVA). Data were analyzed using SPSS 27.0 (Armonk, NY: IBM Corp) and Latent GOLD 4.5 ® (Arlington, MA: Statistical Innovations) software. A p-value of 0.05 was used to indicate statistical significance.
To examine whether the intervention tested in the ENCOURAGE trial had differing effects on the classes that emerged from the LCCA, which would support the need for tailoring in this population. Generalized Additive Models (GAM) were used so that differences between the intervention and control groups could change non-linearly with the participants’ time from baseline to follow-up with adjustment for temporal factors and imbalances in sociodemographics.11 This analytic strategy was used by team members for the overall trial data. Details are available elsewhere.26 We repeated the same analyses for each class. These analyses were carried out using the package mgcv in the R statistical programming language version 3.0.1.27–29
Results
Characteristics of the participants are given in Table 1, overall and by class. In total, 405 participants were included in the study, with an average age of 60 ± 13 years old. Among them, 76% were female, 87% were African American, 30% did not complete high-school education, 84% reported annual household income less than $30,000, and 50% self-reported fair or poor general health (Table 1).
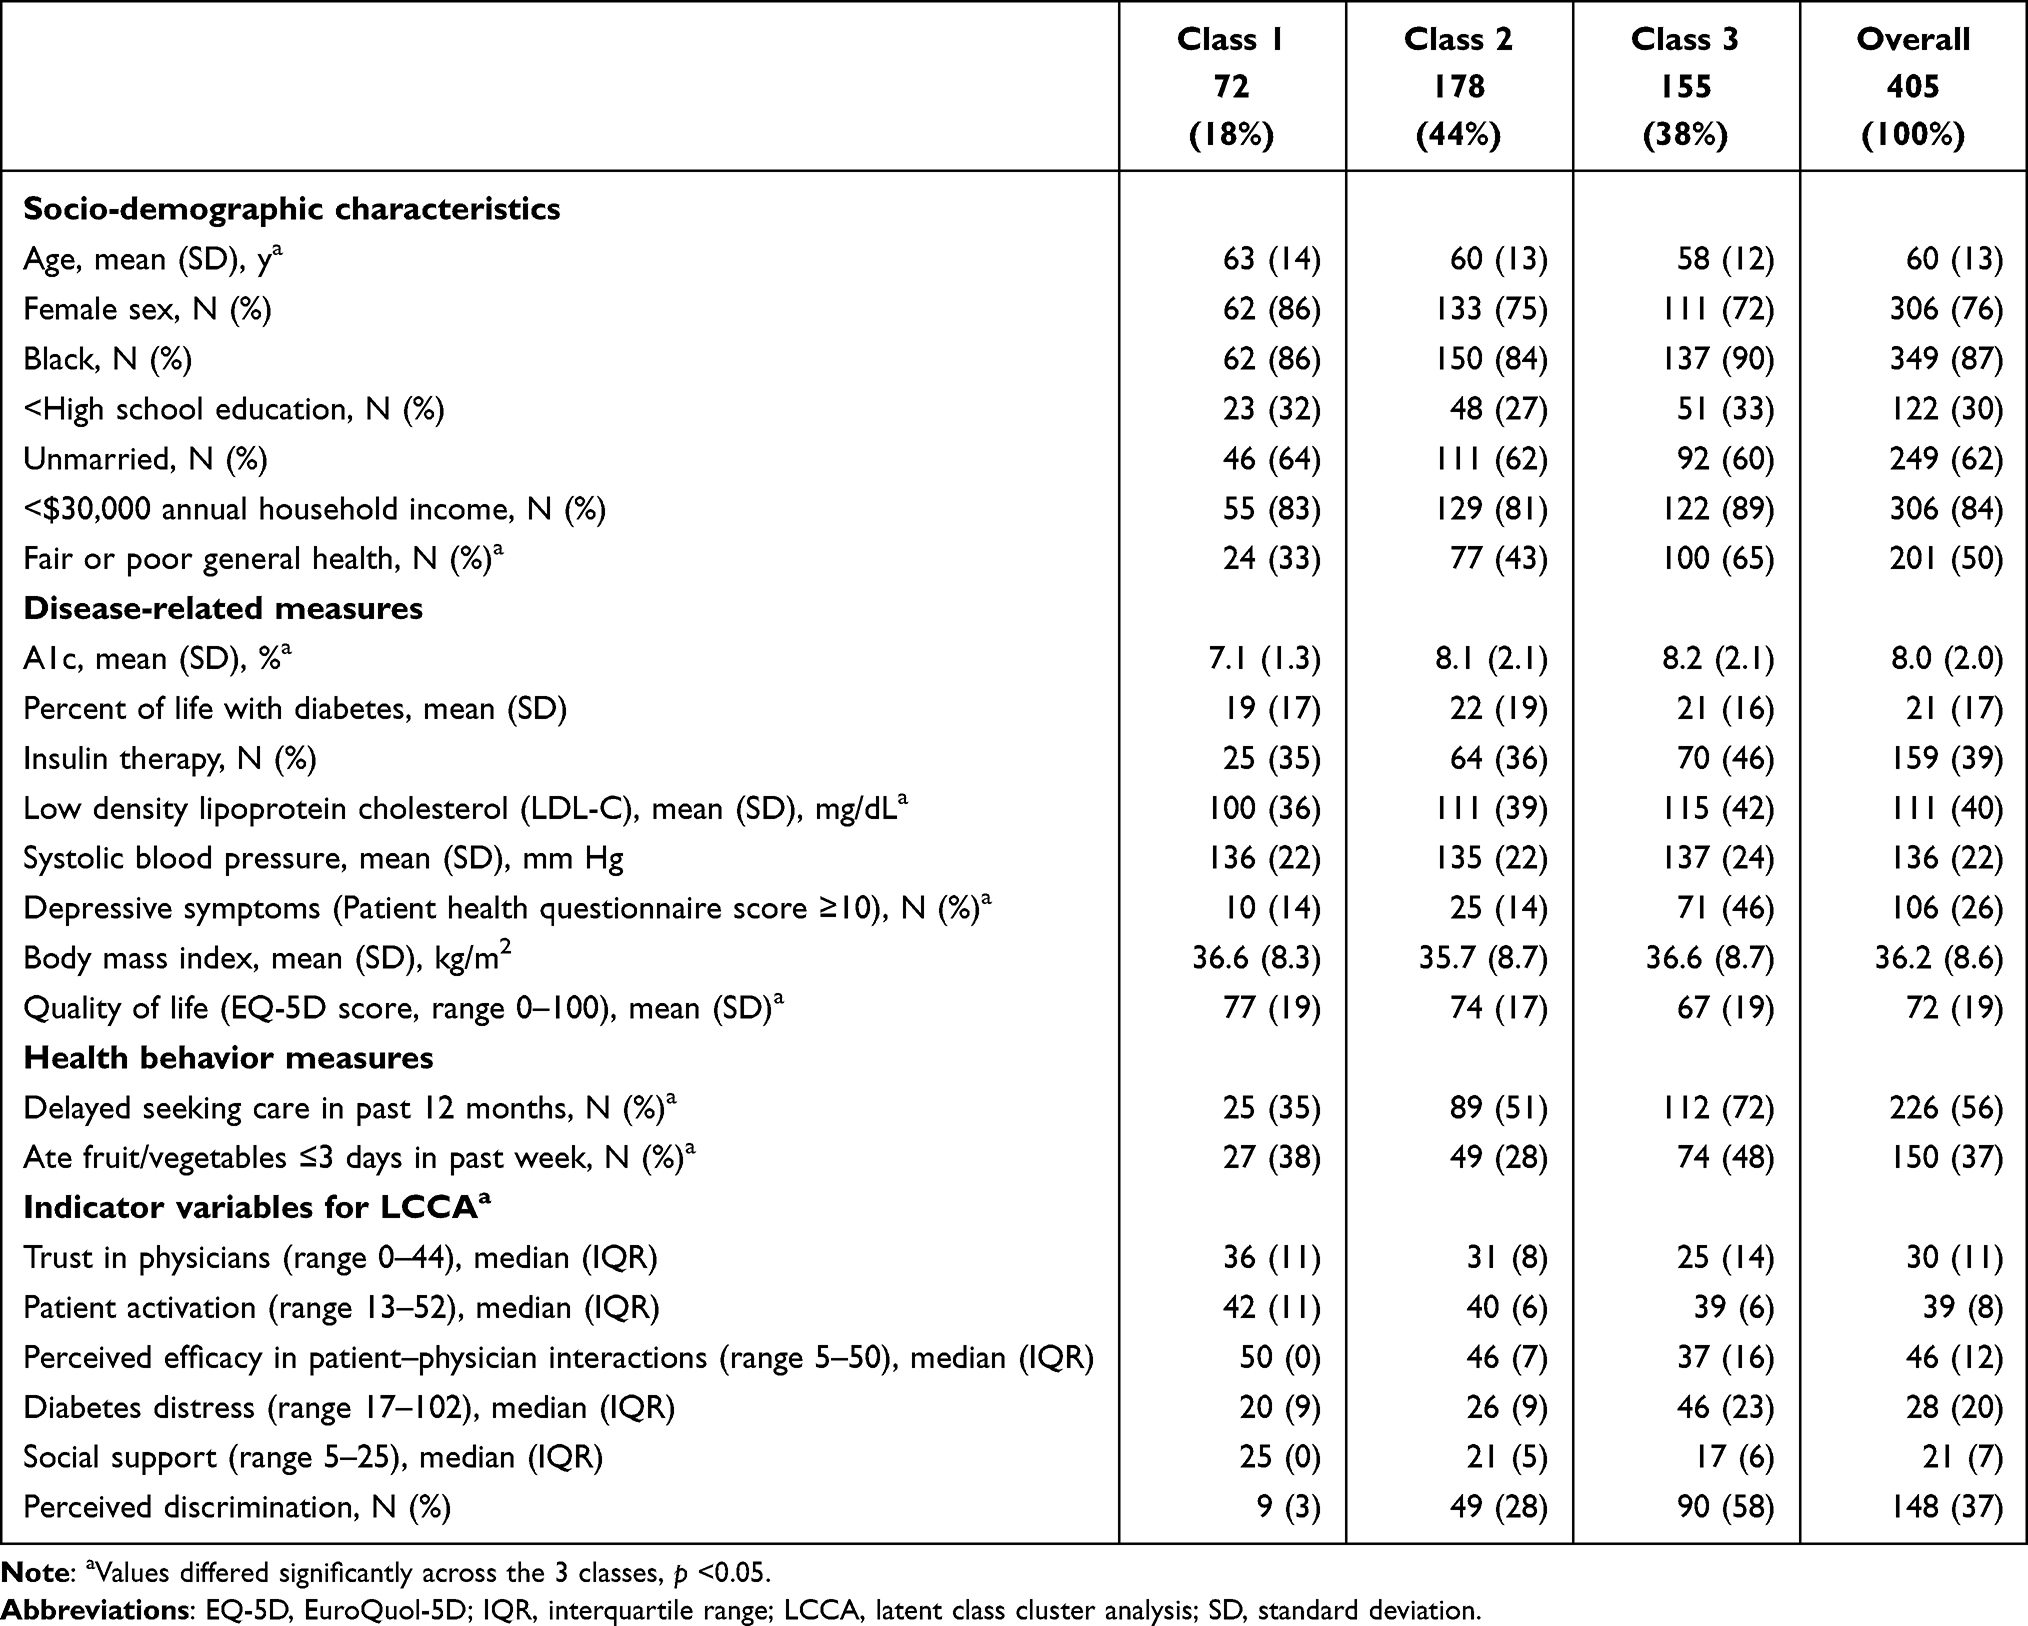 |
Table 1 ENCOURAGE Trial Participant Baseline Characteristics, Across 3 Classes Defined Using LCCA (n = 405) |
The LCCA revealed 3 classes of patients/participants who were distinct in terms of how they perceived their diabetes treatment (Figure 1). The BIC values for the classifications with 1, 2, 3, and 4 groups are shown in the Appendix Table 2. Although the BIC value for the 3-class model was not the smallest, the 3-class solution was selected as the final model because of its interpretability and the relatively small size of classfication errors. All indicator variables in the model (baseline trust in physicians, patient activation, perceived efficacy of patient–physician interactions, social support, diabetes distress, and perceived discrimination) were statistically significant differentiators of at least 2 classes (p < 0.05).
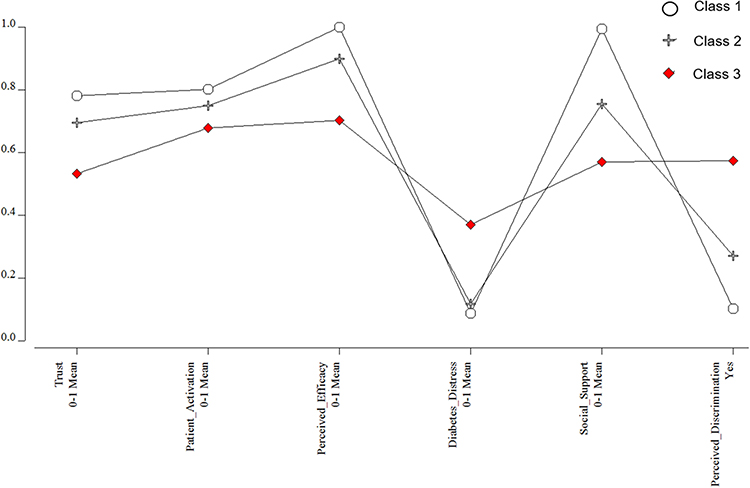 |
Figure 1 Item probabilities in the three latent classes. |
There were 72 participants identified as members of Class 1 (18% of the total sample). For the indicator variables, participants in this class reported high trust in physicians, patient engagement, perceived efficacy in patient–physician interactions, and social support; they also had low diabetes distress and few reported perceiving discrimination. Among the classes, they had the fewest participants with fair or poor general health, reporting depressive symptoms, or reporting having delayed seeking care. Of the 3 classes, they had the best glycemic control at baseline.
There were 178 individuals in Class 2 (44% of the total sample). For the indicator variables, compared to Class 1, they had slightly less trust in physicians and were slightly less engaged, with slightly lower perceived efficacy in patient–physician interactions, slightly greater diabetes distress, slightly less social support and considerably more perceived discrimination, and reported less depressive symptoms that are similar to participants in Class 1.
Class 3 included 155 participants (38% of the total sample). Relative to the other classes, members of this class had the lowest values in trust in physicians, patient engagement, self-efficacy in patient–physician interactions, and social support and the highest values in diabetes distress and perceived discrimination. Class 3 also had the most participants having depressive symptoms than the other two classes (ie, 46% in Class 3 vs 14% in Class 1 and 2). Notably, glycemic control was remarkably similar in Classes 2 and 3.
The figures (A–G) depict the results of the GAMs showing the estimated intervention effect within each class (intervention vs control) as a function of time between baseline and follow-up data collection (Figure 2). In these graphs, the class-specific p-values indicate statistically significant control-intervention differences. Significant changes in BMI were observed for Classes 1 and 2 but not Class 3 (A). Only Class 1 intervention participants had improved A1c relative to controls (B). LDL-cholesterol and systolic blood pressure did not improve for any intervention vs control participants regardless of class membership (C & D). Quality of life differed for Class 3 intervention vs control participants, but not for those in other classes, although there was a borderline statistically significant control-intervention difference in Class 1 (p = 0.06) (E). Diabetes distress differed for Class 3 intervention vs control participants, but not intervention vs control participants in the other classes (F). Patient engagement declined over time but differed significantly between intervention and control participants only for Class 2 (G).
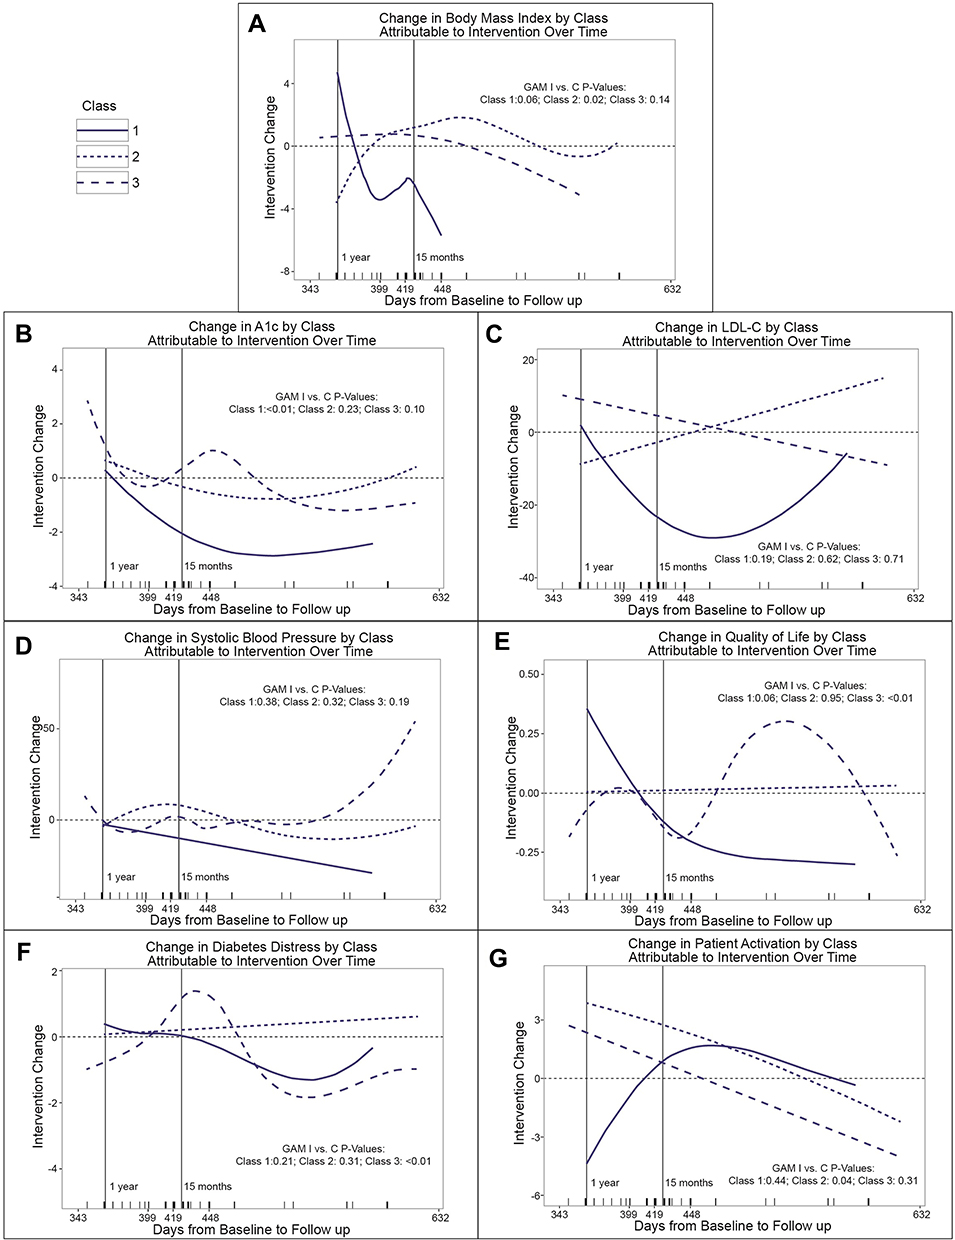 |
Figure 2 Control-intervention differences in change in outcome variables between baseline and follow-up across 3 classes of participants in the ENCOURAGE trial defined based on LCCA (A–G). |
Discussion
This study identified 3 distinct groups, or latent classes, using LCCA based on heterogeneity in the perceptions and attitudes of diabetes treatment among the ENCOURAGE trial population. The GAM analysis demonstrated that the intervention, which was culturally adapted and highly individualized but not tailored to characteristics of patients in the different classes, had differing effects across the 3 classes. Particularly noteworthy is the fact that Class 2 and Class 3 had similarly elevated A1c at baseline, yet the intervention acted quite differently on members of these two classes. This suggests that among individuals with uncontrolled diabetes in this population, there are distinct groups that may have benefitted from different intervention approaches. For example, an intervention for Class 3 members could have included specific support for depressive symptoms and distress, and specific strategies aimed at improving confidence by interacting with healthcare providers; Class 2 characteristics suggest that its members would not have required as much emphasis on these domains, allowing them to focus on other issues. Furthermore, although everyone in the trial expressed the desire for help with their diabetes, members of Class 1 may only have required education and minimal additional intervention. LCCA could provide guidance on where the most intensive resources are needed, creating a greater impact on the population at lower cost.
Individually tailored interventions have been shown to be effective in some studies, but tailoring has typically focused on specific behaviors or risk factors rather than psychosocial attitudes or beliefs. Heise et al conducted a latent class analysis (LCA) based on self-management behaviors in German population-based data. They found that the typology from the study provides important insights for prevention strategies within diabetes health care.30 A recent study identified three latent classes based on subtypes of dietary behavior and examined the association between class membership and cardiometabolic risk factors. The authors suggested the LCA-driven obesity phenotypes are helpful in assessing and managing obesity and metabolic syndrome by providing interventions tailored to the needs of participants in each class.31 Andrade et al identified latent classes using baseline behaviors and examined the relationship between class membership and adherence to weight loss program in a randomized controlled trial. They found that the classification might be a useful guide to improve long-term adherence and assign interventions to individual users.32 One Dutch study identified subgroups of chronically ill patients with high needs and high costs based mainly on demographic and socioeconomic characteristics to tailor primary care for patients with different needs.33 Another Dutch study tailored cardiovascular risk reduction based on which risk factors were uncontrolled; this intervention was also designed to detect and treat depression, but no tailoring based on other psychosocial determinants was included.34 On the other hand, a Swiss physical activity intervention reported no differences between an on-line tailored vs untailored intervention; tailoring was not targeted at psychosocial factors.35 It is currently unknown whether tailoring an intervention to attitudes and beliefs, such as trust in healthcare providers or confidence in engaging healthcare providers’ results in better diabetes outcomes, but such tailoring would be feasible in the context of a peer coaching intervention.
This study’s limitations include the relatively small sample size, which limits the ability to discern differences in intervention effects across the 3 classes. It is therefore noteworthy that, despite the modest sample, statistically significant differences were in fact observed; a larger sample might have permitted even more differences to emerge. Plots of the GAM results did not include confidence regions to avoid visual confusion. Given the small sample size, there is considerable overlap, and we expect differences among classes may have appeared less extreme if the samples had been larger. The analysis of the intervention effects shares limitations with the overall study as discussed in detail elsewhere.26 The generalizability of the 3 classes that we described may also be limited; LCCA in a different population using the same indicator variables may identify different groups of people. Another limitation might be noticed that all questionnaires were administered to participants that might lead to biased responses for some measurement scales that were developed for self-administered, eg, Patient Activation Measure. Other limitations include that the data are 10 years old because the trial was conducted in 2010–2012. The trial sample was limited to “people who wanted help with their diabetes”; therefore, this sample may consist of those who are particularly motivated to manage their diabetes better. Different clusters might be identified with a more representative sample.
Conclusion
In conclusion, using LCCA, 3 distinct classes of participants with different patterns of attitudes and views about diabetes treatment were identified. Individuals in these classes may benefit from distinct approaches to improving diabetes self-care. The evidence indicated that a culturally adapted, highly individualized intervention had different effects across the 3 classes, supporting the possibility that tailoring the intervention based on class membership could have been more effective. If future studies confirm the merits of such an approach, the methods used in this study could guide tailored implementation in communities with scarce resources. In future study, it might be helpful to collect additional information to inform the development of tailored interventions, eg, participant’s zip code that would help to determine rural or urban residence and calculate distance from home to healthcare facilities, use of telemedicine vs in-person healthcare, and access to broadband Internet.
Abbreviations
AIC, Akaike information criterion; BIC, Bayesian Information Criterion; BMI, body mass index; EQ-5D, EuroQuol-5D; GAM, generalized additive model; IQR, interquartile range; LCCA, latent class cluster analysis; LDL, low-density lipoprotein; LL, log-likelihood; PHQ-8, Patient Health Questionnaire-8; SD, standard deviation.
Acknowledgment
We thank Susan Andreae for her help with the figure.
Funding
Support for this study was provided by a grant from Peers for Progress, a program of the American Academy of Family Physicians Foundation supported by the Eli Lilly and Company Foundation, Inc. (Safford, Richman, Qu); the University of Alabama at Birmingham Diabetes Research and Training Center P60 DK079626 from NIDDK (Safford); and K24HL111154 from NHLBI (Safford).
Disclosure
Dr Monika M Safford receives grant from Amgen for investigator-initiated research on large databases to understand patterns of lipid lowering strategies. She is also the founder of the Patient-Activated Learning System, an independent company focusing on providing patient-centered health information. The authors report no other conflicts of interest in this work.
References
1. Rhee MK, Slocum W, Ziemer DC, et al. Patient adherence improves glycemic control. Diabetes Educ. 2005;31(2):240–250. doi:10.1177/0145721705274927
2. Krapek K, King K, Warren SS, et al. Medication adherence and associated hemoglobin A1c in type 2 diabetes. Ann Pharmacother. 2004;38(9):1357–1362. doi:10.1345/aph.1D612
3. Schectman JM, Nadkarni MM, Voss JD. The association between diabetes metabolic control and drug adherence in an indigent population. Diabetes Care. 2002;25(6):1015–1021. doi:10.2337/diacare.25.6.1015
4. Cramer JA. A systematic review of adherence with medications for diabetes. Diabetes Care. 2004;27(5):1218–1224. doi:10.2337/diacare.27.5.1218
5. Kroenke K, Spitzer RL, Williams JB. The PHQ-9: validity of a brief depression severity measure. J Gen Intern Med. 2001;16(9):606–613. doi:10.1046/j.1525-1497.2001.016009606.x
6. Department of Health and Human Services. National healthcare disparities report; 2013. Available from: http://www.ahrq.gov/qual/nhdr11/nhdr11.pdf.
7. Welschen LM, Bloemendal E, Nijpels G, et al. Self-monitoring of blood glucose in patients with type 2 diabetes mellitus who are not using insulin. Cochrane Database Syst Rev. 2005;(2):CD005060. doi: 10.1002/14651858.CD005060
8. Norris SL, Engelgau MM, Narayan KV. Effectiveness of self-management training in type 2 diabetes. A systematic review of randomized controlled trials. Diabetes Care. 2001;24(3):561–587. doi:10.2337/diacare.24.3.561
9. Nam S, Janson SL, Stotts NA, Chesla C, Kroon L. Effect of culturally tailored diabetes education in ethnic minorities with type 2 diabetes: a meta-analysis. J Cardiovasc Nurs. 2012;27(6):505–518. doi:10.1097/JCN.0b013e31822375a5
10. Vermunt JK, Magidson J. Latent class analysis. Encycl Social Sci Res Methods. 2004;2:549–553.
11. Safford MM, Andreae S, Cherrington AL, et al. Peer coaches to improve diabetes outcomes in Rural Alabama: a cluster randomized trial. Ann Fam Med. 2015;13(Suppl 1):S18–S26. doi:10.1370/afm.1798
12. Andreae SJ, Halanych JH, Cherrington A, Safford MM. Recruitment of a rural, southern, predominantly African-American population into a diabetes self-management trial. Contemp Clin Trials. 2012;33(3):499–506. doi:10.1016/j.cct.2012.02.005
13. Cherrington A, Martin MY, Hayes M, et al. Intervention mapping as a guide for the development of a diabetes peer support intervention in rural Alabama. Prev Chronic Dis. 2012;9:E36.
14. Hall MA, Dugan E, Zheng B, Mishra AK. Trust in physicians and medical institutions: what is it, can it be measured, and does it matter? Milbank Q. 2001;79(4):613–639. doi:10.1111/1468-0009.00223
15. Hibbard JH, Mahoney ER, Stock R, Tusler M. Do increases in patient activation result in improved self‐management behaviors? Health Serv Res. 2007;42(4):1443–1463. doi:10.1111/j.1475-6773.2006.00669.x
16. Hibbard JH, Mahoney ER, Stockard J, Tusler M. Development and testing of a short form of the patient activation measure. Health Serv Res. 2005;40(6p1):1918–1930. doi:10.1111/j.1475-6773.2005.00438.x
17. Maly RC, Frank JC, Marshall GN, DiMatteo MR, Reuben DB. Perceived efficacy in patient-physician interactions (PEPPI): validation of an instrument in older persons. J Am Geriatr Soc. 1998;46(7):889–894. doi:10.1111/j.1532-5415.1998.tb02725.x
18. La Greca AM, Bearman KJ. The diabetes social support questionnaire-family version: evaluating adolescents’ diabetes-specific support from family members. J Pediatr Psychol. 2002;27(8):665–676. doi:10.1093/jpepsy/27.8.665
19. Polonsky WH, Fisher L, Earles J, et al. Assessing psychosocial distress in diabetes: development of the diabetes distress scale. Diabetes Care. 2005;28(3):626–631. doi:10.2337/diacare.28.3.626
20. Barbeaud EM. Experiences of discrimination: validity and reliability of a self-report measure for population health research on racism and health. Soc Sci Med. 2005;61:1576–1596. doi:10.1016/j.socscimed.2005.03.006
21. Wang Y, Lammi-Keefe CJ, Hou L, Hu G. Impact of low-density lipoprotein cholesterol on cardiovascular outcomes in people with type 2 diabetes: a meta-analysis of prospective cohort studies. Diabetes Res Clin Pract. 2013;102(1):65–75. doi:10.1016/j.diabres.2013.07.009
22. Luo X, George ML, Kakouras I, et al. Reliability, validity, and responsiveness of the short form 12-item survey (SF-12) in patients with back pain. Spine. 2003;28(15):1739–1745. doi:10.1097/01.BRS.0000083169.58671.96
23. Rabin R, Charro F. EQ-5D: a measure of health status from the EuroQol Group. Ann Med. 2001;33(5):337–343. doi:10.3109/07853890109002087
24. Kind P, Brooks R, Rabin R. EQ-5D Concepts and Methods: A Developmental History. Springer; 2006.
25. Shewchuk RM, Carlson GL, Klosterman M, Cullen S, Qu H. Frictions as barriers to perioperative alignment: results from a latent class analysis. Qual Manage Healthcare. 2014;23(3):188–200.
26. Richman JS, Andreae S, Safford MM. Challenges of prolonged follow-up and temporal imbalance in pragmatic trials: analysis of the ENCOURAGE trial. Ann Fam Med. 2015;13(Suppl 1):S66–S72. doi:10.1370/afm.1790
27. Wood S. Generalized Additive Models: An Introduction with R.
28. Wood S. Fast stable restricted maximum likelihood and marginal likelihood estimation of semiparametric generalized linear models. J Roy Stat Soc B. 2011;73(1):34. doi:10.1111/j.1467-9868.2010.00749.x
29. R Core Team. R: a language and environment for statistical computing. R Foundation for Statistical Computing; 2021. Available from: http://www.R-project.org.
30. Heise M, Fink A, Baumert J, Heidemann C, Du Y, Frese T. Patterns and associated factors of diabetes self-management: results of a latent class analysis in a German population-based study. PLoS One. 2021;16(3):e0248992. doi:10.1371/journal.pone.0248992
31. Park JH, Kim JY, Kim SH, Kim JH, Park YM, Yeom HS. A latent class analysis of dietary behaviours associated with metabolic syndrome: a retrospective observational cross-sectional study. Nutr J. 2020;19(1):116. doi:10.1186/s12937-020-00636-7
32. Andrade AQ, Beleigoli A, Diniz MDF, Ribeiro AL. Influence of baseline user characteristics and early use patterns (24-hour) on long-term adherence and effectiveness of a web-based weight loss randomized controlled trial: latent profile analysis. J Med Internet Res. 2021;23(6):e26421. doi:10.2196/26421
33. Smeets RGM, Elissen AMJ, Kroese M, Hameleers N, Ruwaard D. Identifying subgroups of high-need, high-cost, chronically ill patients in primary care: a latent class analysis. PLoS One. 2020;15(1):e0228103. doi:10.1371/journal.pone.0228103
34. Huntink E, Heijmans N, Wensing M, van Lieshout J. Effectiveness of a tailored intervention to improve cardiovascular risk management in primary care: study protocol for a randomised controlled trial. Trials. 2013;14(1):433. doi:10.1186/1745-6215-14-433
35. Wanner M, Martin-Diener E, Braun-Fahrländer C, Bauer G, Martin BW. Effectiveness of active-online, an individually tailored physical activity intervention, in a real-life setting: randomized controlled trial. J Med Internet Res. 2009;11(3):e23. doi:10.2196/jmir.1179
 © 2022 The Author(s). This work is published and licensed by Dove Medical Press Limited. The
full terms of this license are available at https://www.dovepress.com/terms
and incorporate the Creative Commons Attribution
- Non Commercial (unported, 3.0) License.
By accessing the work you hereby accept the Terms. Non-commercial uses of the work are permitted
without any further permission from Dove Medical Press Limited, provided the work is properly
attributed. For permission for commercial use of this work, please see paragraphs 4.2 and 5 of our Terms.
© 2022 The Author(s). This work is published and licensed by Dove Medical Press Limited. The
full terms of this license are available at https://www.dovepress.com/terms
and incorporate the Creative Commons Attribution
- Non Commercial (unported, 3.0) License.
By accessing the work you hereby accept the Terms. Non-commercial uses of the work are permitted
without any further permission from Dove Medical Press Limited, provided the work is properly
attributed. For permission for commercial use of this work, please see paragraphs 4.2 and 5 of our Terms.
Recommended articles
The Importance of Patient and Family Engagement, the Needs for Self-Monitoring of Blood Glucose (SMBG) – Our Perspectives Learned Through a Story of SMBG Assistive Devices Made by a Husband of the Patient with Diabetes

Kimura M, Toyoda M, Saito N, Takahashi M, Isozumi K, Kato E, Kawanami D, Fukagawa M
Diabetes, Metabolic Syndrome and Obesity 2022, 15:1627-1638
Published Date: 25 May 2022
A Patient-Centered Self-Management Intervention to Improve Glycemic Control, Self-Efficacy and Self-Care Behaviors in Adults with Type 2 Diabetes Mellitus: A SPIRIT Compliant Study Protocol for Randomized Controlled Trial
Asmat K, Dhamani K, Froelicher ES, Gul R
Diabetes, Metabolic Syndrome and Obesity 2023, 16:225-236
Published Date: 26 January 2023
Mediating Effect of Coping Style Between Risk Perception of Complications and Self-Management in Patients with Type 2 Diabetes Mellitus
Xiong C, Wang Y, Xie X, Huang Y, Liu M, Zou X
Diabetes, Metabolic Syndrome and Obesity 2024, 17:4367-4376
Published Date: 20 November 2024