Back to Journals » International Journal of General Medicine » Volume 15
Identifying of miRNA–mRNA Regulatory Networks Associated with Acute Kidney Injury by Weighted Gene Co-Expression Network Analysis
Received 16 December 2021
Accepted for publication 10 February 2022
Published 19 February 2022 Volume 2022:15 Pages 1853—1864
DOI https://doi.org/10.2147/IJGM.S353484
Checked for plagiarism Yes
Review by Single anonymous peer review
Peer reviewer comments 2
Editor who approved publication: Dr Scott Fraser
Jie Xu,1 Yunfei Xu2
1Department of Urology, Pudong New Area People’s Hospital, Shanghai, 201299, People’s Republic of China; 2Department of Urology, Shanghai Tenth People’s Hospital, School of Medicine, Tongji University, Shanghai, 200072, People’s Republic of China
Correspondence: Jie Xu, Department of Urology, Pudong New Area People’s Hospital, No. 490, Chuanhuan South Road, Pudong New Area, Shanghai, 201299, People’s Republic of China, Tel/Fax +86-13816833210, Email [email protected] Yunfei Xu, Department of Urology, Shanghai Tenth People’s Hospital, School of Medicine, Tongji University, No. 301, Yanchang Road, Jing’an District, Shanghai, 200072, People’s Republic of China, Email [email protected]
Background: Acute kidney injury (AKI) is a clinical emergency characterized by a dramatic decline in renal function and the accumulation of metabolic waste products in the body, with a high morbidity and mortality rate. The pathogenesis of AKI remains unclear and there are no effective treatment options.
Methods: We aimed to identify critical genes involved in the pathogenesis of AKI and construct a miRNA–mRNA regulatory network using gene expression data downloaded from Gene Expression Omnibus (GSE85957) for 38 kidneys of AKI and 19 control rats and cisplatin treated kidneys of 3 AKI and 3 control rats. Data in GSE85957 were processed using weighted gene co-expression network analysis (WGCNA), and biological function analysis and Kyoto Encyclopedia of Genes and Genomes (KEGG) analysis were used to analyze the functions associated with critical genes.
Results: Twenty-eight modules in the GSE85957 dataset were identified by WGCNA, of which 103 genes in the orange module and 30 genes in the black module were closely associated with AKI and dose. Biological function analysis of genes in the orange and black modules revealed that skeletal muscle cell differentiation, tissue development and organ development were involved in the pathological changes of AKI. Combining with our experimentally processed AKI rat kidney data, eight genes (Atf3, Egr1, Egr2, Fos, Fosb, Gdf15, Serpine1 and Nr1d1) were identified as potential biomarkers of AKI, and miRNA–mRNA regulatory networks were constructed based on the above eight critical genes. Further tissue validation revealed that Egr1 and Fos were highly expressed in AKI.
Conclusion: Our study identified potential biomarkers of AKI and constructed an associated miRNA–mRNA regulatory network, which may provide new insights into the molecular pathogenesis of AKI.
Keywords: acute kidney injury, critical genes, WGCNA analysis, miRNA–mRNA regulatory networks
Introduction
Acute kidney injury (AKI) is a clinical syndrome of rapidly declining kidney function caused by multiple etiologies and manifested by rapid increase in serum creatinine, decrease in urine output, or both.1 The incidence of AKI in Hospitalized adult patients ranged from 3.0% to 18.3% globally.2 These differences may result from factors such as different backgrounds of patients and the different criteria used to define AKI. However, even the low end of the AKI incidence range makes it abundantly clear that AKI affects a very large number of people worldwide. AKI causes approximately 1.7 million deaths worldwide each year, and this approximation may even be underestimated in view of the silent nature of AKI.3,4
AKI has become a worldwide health concern, but its diagnosis and treatment remain challenging. The current diagnosis of AKI still relies on serum creatinine and urine output.5 Unfortunately, owing to the lag time between the onset of injury and changes in serum creatinine and urine output, the diagnosis is often not clarified until after the initiation and extension phases of kidney injury have transitioned to the maintenance phase of injury.6 The available evidence suggests that even mild AKI is associated with increased mortality.3,4 No interventions to improve established AKI outcomes have yet been developed, and its therapeutic strategy is limited to supportive care, in which renal replacement therapy (RRT) plays an important role.7 However, clinicians also lack effective decision-making tools on whether and when RRT should be commenced to improve the outcome of these patients with AKI, considering that AKI is usually a continuum of kidney injury rather than a single-hit, freestanding condition.7,8
Early diagnosis and timely intervention can minimize kidney injury and promote kidney function recovery.9 Although several novel AKI biomarkers, including kidney injury molecule 1 (KIM-1), IL-18, cystatin C, and neutrophil gelatinase-associated lipocalin (NGAL) have been intensively studied in the last decades, there is still a lack of recognized biomarkers for clinical applications.10 Therefore, in this study, we searched for potential biomarkers of AKI with the aim of guiding clinical interventions and providing valuable insights into the complex molecular mechanisms of AKI.
Materials and Methods
Microarray Data Processing
The GSE85957 microarray dataset was concluded and downloaded from the Gene Expression Omnibus (GEO) (https://www.ncbi.nlm.nih.gov/geo/) through the GEO query package in the R environment (Version 4.2.0). The GSE85957 dataset (platform: GPL1355; Rat230_2; Affymetrix Rat Genome 230 2.0 Array) compared gene expression profiles of kidney tissues from male Han Wistar rats (8 weeks old) with intraperitoneal injection of cisplatin (0, 1 or 3 mg/kg) for 3, 5, 8 and 26 days induced AKI model (n = 38) and controls (n = 19). The corresponding annotation file-GPL1355 matrix containing more than 31,000 probe sets and more than 28,000 annotated rat genes were obtained for conversion of probes to target genes. If two or more probes were annotated in a gene, the mean was calculated for further analysis. The matrix was preprocessed and normalized by using the bead array software package. Outlier microarray samples were identified using a sample network approach based on Euclidean distance and a cutoff value of −5 for Z.ku was calculated as ku-mean(k)/sqrt(var[k]).11
Weighted Gene Co-Expression Network Analysis (WGCNA) Construction
WGCNA was performed to identify clusters with high correlation using the WGCNA package.11 The soft threshold β was evaluated by the R function pickSoft Threshold for scale-free topology. A β value of 5 (R2 > 0.8) was chosen to construct the gene network by applying the default WGCNA method. The topology matrix was obtained based on the β value, and the topology matrix was clustered and analyzed, and then the tree was cut into different modules using the dynamic cut method, and the modules with correlation higher than 0.8 were merged, and finally a total of 28 modules were obtained.
Identification of Significant Modules
For detection of module which were significantly associated with AKI and dose, we performed Pearson correlation analysis to assess the associations. Modules with P-value <0.01 were considered to be significantly associated with AKI. In the co-expression network, the module eigengene (ME) as the summary of the gene expression profiles was correlated with these characteristics to find the most important associations. Gene significance (GS) is used to determine the connective degree between the gene and the specific trait in the association quantification of individual genes with AKI, which was further measured by quantification of module membership (MM) in the correlation of ME and the gene expression profile.
Conduction of AKI Models and mRNA Sequencing
In this study, mRNA sequencing was performed by intraperitoneal injection of cisplatin to induce AKI model to detect differentially expressed genes. All SD rats (male, 6 weeks, n = 6) were purchased from Shanghai Slac Laboratory Animal Co. Ltd and housed in the Experimental Animal Center of Tongji University. Rats were raised in a 2-hour dark-light cycle with free access to feed and water. And the room temperature was maintained in 20–24 °C with relative humidity of 45 ~ 55%. Cisplatin at 3 mg/kg was diluted in 0.9% saline and then administered intraperitoneally. One week later rat kidneys were collected for further mRNA sequencing. The total RNA was extracted using the TRIzol (Invitrogen, USA) and quantified by NanoDrop 2000 spectrophotometer (Thermo, USA) and the high-quality RNA sample (OD260/280 = 1.8~2.2, OD260/230 ≥ 2.0, RIN ≥ 6.5, 28S:18S ≥ 1.0, > 1μg) was further applied in the sequencing. RNA-seq transcriptome library was prepared using 1μg RNA by TruSeqTM RNA sample preparation Kit from Illumina (San Diego, CA) and the expression of mRNA was profiled using HiSeq xten/NovaSeq 6000 sequencer (Illumina, Inc.).
Identification of Critical Genes
The identification of critical genes was conducted based on significant differential expression between AKI and control samples. The limma package was separately applied to identify differential expressed genes (DEGs) in the two traits with the cut-off criteria |log2 fold change (FC)| ≥ 1 and P value < 0.05. And the critical genes were subsequently visualized among the DEGs and MEs through the Venn diagrams package. Additionally, the diagnostic performance of critical genes was also verified by receiver operating characteristic (ROC) curves in this study, and the results were presented as the area under the curve (AUC).
Functional Enrichment Analysis of Critical Genes
Gene Ontology (GO) and KEGG enrichment analysis were applied in the exploration of the related biological function in critical genes through Metascape (http://metascape.org/). The visualization of top 10 GO and Kyoto Encyclopedia of Genes and Genomes (KEGG) terms were established by using ggplot2 package.
Construction of miRNA–mRNA Regulatory Network
TargetScan was used to predict miRNAs interacting with eight critical genes, and the relevant miRNAs were screened using score.percentile > 95 as criteria, and the miRNA–mRNA network was visualized in Cytoscape 3.5.1. The workflow of this study is shown in Figure 1.
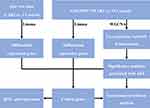 |
Figure 1 The workflow of this study. |
Quantitative Real-Time Polymerase Chain Reaction (qRT-PCR)
Total RNA was extracted from tissue specimens using Trizol reagent (TaKaRa, China). cDNA was obtained by reverse transcription and qRT-PCR reactions were performed according to the previous study steps.12 The relative expression of each gene was calculated using the 2−ΔΔCt method. All primer sequences are shown in Table S1.
Results
Data Processing
The GSE85957 matrix data file was downloaded and 15323 gene expression data were annotated using the GPL1355 platform annotation file. The dataset contained 38 AKI samples and 19 control samples, and all samples had Z.ku higher than the standard Z.ku (−5) in the Euclidean distance-based sample network analysis. Therefore, expression data from all 57 samples were applied in the WGCNA.
WGCNA Construction
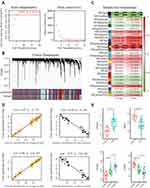
In WGCNA, the R function pickSoft Threshold was used to evaluate the soft threshold β. We chose a β value of 5 (R2>0.8) and constructed the gene network by applying the default WGCNA method (Figure 2A). Based on the β values to the topology matrix and further analysis, a total of 28 modules were finally obtained (Figure 2B). We then evaluated the association between modules eigengenes and AKI and dose using Pearson correlation analysis. Among the modules, black (AKI: P = 2e-08; Dose: P = 1e-09), royalblue (AKI: P = 0.007; Dose: P = 4e-05), steelblue (AKI: P = 0.004; Dose: P = 3e-05), darkgrey (AKI: P = 8e-05; Dose: P = 1e-10), blue (AKI: P = 9e-04; Dose: P = 5e-07), midnightblue (AKI: P = 0.003; Dose: P = 2e-06), orange (AKI: P = 0.004; Dose: P = 1e-11), salmon (AKI: P = 0.005; Dose: P = 3e-04), and paleturquoise (AKI: P = 4e-04; Dose: P = 3e-06) were strongly correlated with AKI and dose (P < 0.01) (Figure 2C). Correlation line analysis of the modules with AKI and dose revealed that the MEorange module (103 genes) had the highest positive correlation with AKI (cor = 0.97, p = 1e-73) and dose (cor = 0.98, p = 6.9e-84), and the MEblack module (30 genes) had the highest positive correlation of genes with AKI (cor = −0.98, p = 1e-24) and dose (cor = −0.97, p = 7.6e-22) had the highest negative correlations (Figure 2D). In addition, gene expression in the orange module was positively correlated with AKI and dose, while the opposite result was observed for the black module (Figure 2E).
Module Genes and Functional Enrichment Analysis
We uploaded 103 genes from the MEorange module and 30 genes from the MEblack module to Metascape to explore gene related biological functions. Figure S1 shows the top 10 biological processes (BPs) and KEGG pathways annotated with genes in the orange and black modules. The BP annotations show that genes in the orange and black modules are significantly enriched in skeletal muscle cell differentiation, skeletal muscle tissue development, skeletal muscle organ development, muscle structure development, striated muscle tissue development, muscle tissue development, muscle organ development, rhythmic process, regulation of neurogenesis and fat cell differentiation (Table 1). The KEGG pathway enrichment analysis shows that genes in the orange and black modules are mainly involved in circadian rhythm, bladder cancer, MAPK signaling pathway, p53 signaling pathway, bell cycle, HTLV-I infection, apelin signaling pathway, hepatitis B, IL-17 signaling pathway and endocrine resistance (Table 1).
 |
Table 1 Top 10 GO Biological Processes and KEGG Pathway for Orange and Black Modules |
Identification and Validation of Critical Genes
To screen for critical genes, we analyzed gene expression between AKI and controls in the GSE85957 dataset and our own experimentally processed data (raw count) using the limma software package. The screening criteria were |log2 fold change (FC)| ≥ 1 and P value < 0.05. The DEGs in the GSE85957 dataset and raw count are shown in Figure 3A. In the GSE85957 dataset, 74 differentially expressed genes (65 up-regulated and 9 down-regulated) were obtained and raw count yielded 2596 differentially expressed genes (603 up-regulated and 1993 down-regulated). We intersected the GSE85957 dataset, raw count, orange module and black module, and the results showed that eight genes (Atf3, Egr1, Egr2, Fos, Fosb, Gdf15, Serpine1, Nr1d1) were screened as DEGs (Figure 3B). Table 2 shows the BPs annotated with the eight critical genes. These eight up-regulated genes were defined as important in the development of AKI (Figure 4A and Figure S2). In addition, the ROC curves showed that all critical genes had AUCs above 0.8 (Figure 4B), indicating that they could be used as potential biomarkers for the diagnosis of AKI. Moreover, we also predicted miRNAs interacting with eight genes in TargetScan and constructed a possible miRNA–mRNA regulatory network (Figure 5).
 |
Table 2 GO Biological Processes for Eight Critical Genes |
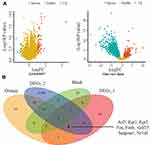 |
Figure 3 Selection of critical genes. (A) Volcano map of differential expressed genes (DEGs) in GSE85957 and our raw data. (B) Screening of eight critical genes by Venn diagram. |
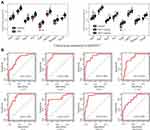 |
Figure 4 Expression profile of critical genes. (A) Expression profile of critical genes in GSE85957 dataset. (B) ROC curve of critical genes. |
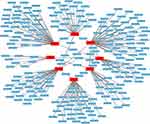 |
Figure 5 miRNA–mRNA regulatory network of critical genes. |
In addition, we extracted total RNA from the kidneys of 15 AKI and 15 control rats, and verified the expression of the above eight critical genes by qRT-PCR, and found that Egr1 and Fos expression was increased in AKI (Figure 6), demonstrating that Egr1 and Fos may be potential key biomarkers of AKI.
 |
Figure 6 Relative expression of eight critical genes in tissue samples. |
Discussion
AKI is a clinical syndrome caused by multiple clinical factors and characterized by a dramatic decline in renal function. AKI patients are often accompanied by metabolite retention and water, electrolyte, and acid-based imbalances.2 Unfortunately, without early treatment, AKI patients are associated with a very poor prognosis and may progress to chronic kidney disease (CKD) and end-stage renal disease, resulting in increased mortality.13 Therefore, exploring the genes and modules specific to AKI can help in early diagnosis and treatment, thus effectively reducing mortality and adverse prognostic responses in patients.
In the present study, according to WGCNA, we found two specific modules highly associated with AKI, containing a total of 133 hub genes. Development-related processes in skeletal muscle and inflammatory response-related processes were significantly involved in the pathology of AKI as revealed by BP and KEGG enrichment analysis. Eight of these hub genes were differentially expressed between the AKI and control groups and were identified as playing a key role in the development of AKI, with promising applications in early predicting AKI. Finally, we predicted and integrated the miRNAs interacting with eight hub genes in TargetScan.
Within these critical genes, Egr1, Egr2, Fos and Fosb are closely associated with cytoprotective or immune-related responses. Egr1 and Egr2, as members of the zinc finger transcription factor family, are characterized by a highly conserved DNA binding domain consisting of three zinc finger motifs.14 Egr1 gene is an important transcription factor, which is located in the human chromosome 5q23-31 region and is mainly involved in processes such as tissue damage, immune response and fibrosis.15 Egr1 can promote T cell activation after T cell receptor (TCR) stimulation.16 EGR2 is induced by TCR binding and plays a key role in the induction of T cell incompetence.17 After T cell activation, EGR2 is highly induced in order to control the inflammatory response and thus negatively regulate T cell activation.18 TCR signaling upregulates Fas ligand (FasL) on CD4+ T cells, while EGR2 acts as a potent activator of FASL expression to maintain immune homeostasis by inducing apoptosis.19 In the present study, Egf1 and Egf2 were significantly upregulated in the AKI group compared to the control group, suggesting that elevated Egf1 and Egf2 transcripts in AKI patients are associated with T lymphocytes activation and proliferation. This is consistent with previous studies finding that after AKI, T cells are dramatically elevated in renal draining lymph nodes, transferring and producing pro-inflammatory cytokines to the injured kidney, activating macrophages and promoting renal inflammation.20 Thus, Egf1 and Egf2 may be a predictive biomarker for patients with AKI. Fos and Fosb are members of the activator protein-1 family (AP-1) of transcription factors. Fos and Fosb are regulators of cell proliferation, differentiation and transformation. They are characterized by a conserved basic leucine zipper domain, and a trans-activating domain that is primarily responsible for providing binding sites for other transcriptional co-regulators.21 However, it is unknown the role of Fos and Fosb in AKI and further research to explore the underlying mechanisms is needed.
Activating transcription factor 3 (ATF3) as a member of the ATF/cAMP response element-binding (CREB) family binded to the cyclic AMP response element (CRE) in numerous promoters.22 ATF3 is a stress-induced transcription factor, which has key roles in modulating metabolism, immunity, and oncogenesis. A variety of extracellular signals, such as endoplasmic reticulum (ER) stress, cytokines, chemokines, and LPS, have been implicated in the induction of ATF3.23 It had been reported that ATF3 promoted Gadd45β/γ transcription and glomerular mesangial cells apoptosis induced by complement C5b-9.24 Several studies verified in both mouse models and patients that urinary exosomal ATF3 (uATF3) expression was higher in the AKI group than in the normal group.25,26 Therefore, uATF3 could a biomarker for early AKI. Growth differentiation factor 15 (GDF15), a member of the transforming growth factor beta family, was associated with immunosuppression, anti-apoptosis and anti-inflammation.27 Furthermore, several studies had shown that GDF15 expression was upregulated in AKI induced by different factors.28,29 However, the effect of GDF15 on AKI was still unclear.
Serpine1 encoding plasminogen activator inhibitor-1 (PAI-1), would suppress fibrinolysis and enhance renal interstitial fibrosis which were precisely the pathological characteristic of AKI.30,31 Moreover, the expression of PAI-1 was significantly correlated with renal inflammatory injury,32,33 and knocking down PAI-1 would play a protective role.34 Another study demonstrated that the Serpine1 gene expression was notably upregulated in cisplatin-induced AKI kidney tissues.35 Thus, Serpine1 may be a potential marker for AKI. NR1D1, as the member of nuclear receptor subfamily 1 group D, functioned as transcriptional repressors with haem as their endogenous ligand.36 NR1D1 was considered as the components of the circadian clock system,37 which play an essential role in regulating circadian rhythms.38 NR1D1 was also involved in the regulation of many physiological processes and diseases, including inflammatory responses and cancer.39 Researchers found inhibition of NR1D1 attenuated ferroptosis-mediated AKI.40 The mechanism of NR1D1 in AKI was still unclear and needed further study.
With the advancement of sequencing technology, genomics is playing an essential role in disease diagnosis, mechanism research and treatment. Now, sequencing technology is more and more used in clinic, and key genes may play an important role in the occurrence and development of some disease. Thus, the diagnosis of AKI could be determined by the expression of key genes and the AKI can be treated by intervention of key genes, so as to improve patient prognosis and reduce the occurrence of serious complications.
Conclusion
In conclusion, by analysis the results of sequencing and validation, we identified eight critical genes in AKI, including GDF15, Serpine1, ATF3, NR1D1, Egr1, Egr2, Fos, Fosb, and verified the concordance of Egr1 and Fos in tissue samples. Their abnormal expression may activate multiple signaling pathways, ultimately leading to the development and progression of AKI. Furthermore, we constructed a related miRNA–mRNA regulatory network based on the above eight critical genes, which may provide new insights into the molecular pathogenesis of AKI.
Data Sharing Statement
The datasets used and analysed during the current study are available from the corresponding author on reasonable request.
Ethics Approval and Consent to Participate
The data for this study was obtained from the GEO database, which was publicly available. All animal experiments were performed in accordance with the protocol approved by the Animal Research Ethics Committee of the Shanghai Pudong New Area People’s Hospital. All experiments are confirmed in writing and conducted in accordance with Shanghai Pudong New Area People’s Hospital guidelines and regulations.
Author Contributions
All authors made a significant contribution to the work reported, whether that is in the conception, study design, execution, acquisition of data, analysis and interpretation, or in all these areas; took part in drafting, revising or critically reviewing the article; gave final approval of the version to be published; have agreed on the journal to which the article has been submitted; and agree to be accountable for all aspects of the work.
Funding
There is no funding to report.
Disclosure
We declare that there are no conflicts of interest in this work.
References
1. Ronco C, Bellomo R, Kellum JA. Acute kidney injury. Lancet. 2019;394(10212):1949–1964. doi:10.1016/S0140-6736(19)32563-2
2. Hoste EAJ, Kellum JA, Selby NM, et al. Global epidemiology and outcomes of acute kidney injury. Nat Rev Nephrol. 2018;14(10):607–625. doi:10.1038/s41581-018-0052-0
3. Guo C, Dong G, Liang X, Dong Z. Epigenetic regulation in AKI and kidney repair: mechanisms and therapeutic implications. Nat Rev Nephrol. 2019;15(4):220–239. doi:10.1038/s41581-018-0103-6
4. Kellum JA, Prowle JR. Paradigms of acute kidney injury in the intensive care setting. Nat Rev Nephrol. 2018;14(4):217–230. doi:10.1038/nrneph.2017.184
5. Vijayan A. Tackling AKI: prevention, timing of dialysis and follow-up. Nat Rev Nephrol. 2021;17(2):87–88. doi:10.1038/s41581-020-00390-3
6. Perazella MA, Coca SG. Three feasible strategies to minimize kidney injury in ‘incipient AKI’. Nat Rev Nephrol. 2013;9(8):484–490. doi:10.1038/nrneph.2013.80
7. Vanmassenhove J, Kielstein J, Jörres A, Biesen WV. Management of patients at risk of acute kidney injury. Lancet. 2017;389(10084):2139–2151. doi:10.1016/S0140-6736(17)31329-6
8. Klein SJ, Brandtner AK, Lehner GF, et al. Biomarkers for prediction of renal replacement therapy in acute kidney injury: a systematic review and meta-analysis. Intensive Care Med. 2018;44(3):323–336. doi:10.1007/s00134-018-5126-8
9. Gonsalez SR, Cortes AL, Silva RCD, Lowe J, Prieto MC, Silva Lara LD. Acute kidney injury overview: from basic findings to new prevention and therapy strategies. Pharmacol Ther. 2019;200:1–12. doi:10.1016/j.pharmthera.2019.04.001
10. Alge JL, Arthur JM. Biomarkers of AKI: a review of mechanistic relevance and potential therapeutic implications. Clin J Am Soc Nephrol. 2015;10(1):147–155. doi:10.2215/CJN.12191213
11. Langfelder P, Horvath S. WGCNA: an R package for weighted correlation network analysis. BMC Bioinform. 2008;9:559. doi:10.1186/1471-2105-9-559
12. Mao W, Wang K, Xu B, et al. ciRS-7 is a prognostic biomarker and potential gene therapy target for renal cell carcinoma. Mol Cancer. 2021;20(1):142. doi:10.1186/s12943-021-01443-2
13. Wu Y-L, Li H-F, Chen -H-H, Lin H. MicroRNAs as biomarkers and therapeutic targets in inflammation- and ischemia-reperfusion-related acute renal injury. Int J Mol Sci. 2020;21(18):6738. doi:10.3390/ijms21186738
14. O’Donovan KJ, Tourtellotte WG, Millbrandt J, Baraban JM. The EGR family of transcription-regulatory factors: progress at the interface of molecular and systems neuroscience. Trends Neurosci. 1999;22(4):167–173. doi:10.1016/S0166-2236(98)01343-5
15. Wang B, Guo H, Yu H, Chen Y, Xu H, Zhao G. The role of the transcription factor EGR1 in cancer. Front Oncol. 2021;11:642547. doi:10.3389/fonc.2021.642547
16. Collins S, Lutz MA, Zarek PE, Anders RA, Kersh GJ, Powell JD. Opposing regulation of T cell function by Egr-1/NAB2 and Egr-2/Egr-3. Eur J Immunol. 2008;38(2):528–536. doi:10.1002/eji.200737157
17. Zheng Y, Zha Y, Driessens G, Locke F, Gajewski TF. Transcriptional regulator early growth response gene 2 (Egr2) is required for T cell anergy in vitro and in vivo. J Exp Med. 2012;209(12):2157–2163. doi:10.1084/jem.20120342
18. Zhu B, Symonds ALJ, Martin JE, et al. Early growth response gene 2 (Egr-2) controls the self-tolerance of T cells and prevents the development of lupuslike autoimmune disease. J Exp Med. 2008;205(10):2295–2307. doi:10.1084/jem.20080187
19. Morita K, Okamura T, Sumitomo S, Iwasaki Y, Fujio K, Yamamoto K. Emerging roles of Egr2 and Egr3 in the control of systemic autoimmunity. Rheumatology (Oxford). 2016;55(suppl2):ii76–ii81. doi:10.1093/rheumatology/kew342
20. Rabb H, Griffin MD, McKay DB, et al. Inflammation in AKI: current understanding, key questions, and knowledge gaps. J Am Soc Nephrol. 2016;27(2):371–379. doi:10.1681/ASN.2015030261
21. Choi Y, Rosewell KL, Brännström M, Akin JW, Curry TE, Jo M. FOS, a critical downstream mediator of PGR and EGF signaling necessary for ovulatory prostaglandins in the human ovary. J Clin Endocrinol Metab. 2018;103(11):4241–4252. doi:10.1210/jc.2017-02532
22. Montminy MR, Bilezikjian LM. Binding of a nuclear protein to the cyclic-AMP response element of the somatostatin gene. Nature. 1987;328(6126):175–178. doi:10.1038/328175a0
23. Deutsch PJ, Hoeffler JP, Jameson JL, Lin JC, Habener JF. Structural determinants for transcriptional activation by cAMP-responsive DNA elements. J Biol Chem. 1988;263(34):18466–18472. doi:10.1016/S0021-9258(19)81381-9
24. He F, Zhou M, Yu T, et al. Sublytic C5b-9 triggers glomerular mesangial cell apoptosis in rat Thy-1 nephritis via Gadd45 activation mediated by Egr-1 and p300-dependent ATF3 acetylation. J Mol Cell Biol. 2016;8(6):477–491. doi:10.1093/jmcb/mjw021
25. Chen HH, Lai PF, Lan YF, et al. Exosomal ATF3 RNA attenuates pro-inflammatory gene MCP-1 transcription in renal ischemia-reperfusion. J Cell Physiol. 2014;229(9):1202–1211. doi:10.1002/jcp.24554
26. Panich T, Chancharoenthana W, Somparn P, Issara-Amphorn J, Hirankarn N, Leelahavanichkul A. Urinary exosomal activating transcriptional factor 3 as the early diagnostic biomarker for sepsis-induced acute kidney injury. BMC Nephrol. 2017;18(1):10. doi:10.1186/s12882-016-0415-3
27. Unsicker K, Spittau B, Krieglstein K. The multiple facets of the TGF-beta family cytokine growth/differentiation factor-15/macrophage inhibitory cytokine-1. Cytokine Growth Factor Rev. 2013;24(4):373–384. doi:10.1016/j.cytogfr.2013.05.003
28. Zimmers TA, Jin X, Hsiao EC, McGrath SA, Esquela AF, Koniaris LG. Growth differentiation factor-15/macrophage inhibitory cytokine-1 induction after kidney and lung injury. Shock. 2005;23(6):543–548.
29. Abulizi P, Loganathan N, Zhao D, et al. Growth differentiation factor-15 deficiency augments inflammatory response and exacerbates septic heart and renal injury induced by lipopolysaccharide. Sci Rep. 2017;7(1):1037. doi:10.1038/s41598-017-00902-5
30. Zhang W, Sha Y, Wei K, et al. Rotenone ameliorates chronic renal injury caused by acute ischemia/reperfusion. Oncotarget. 2018;9(36):24199–24208. doi:10.18632/oncotarget.24733
31. Eren M, Place AT, Thomas PM, Flevaris P, Miyata T, Vaughan DE. PAI-1 is a critical regulator of FGF23 homeostasis. Sci Adv. 2017;3(9):e1603259. doi:10.1126/sciadv.1603259
32. Xue HY, Yuan L, Cao YJ, Fan YP, Chen XL, Huang XZ. Resveratrol ameliorates renal injury in spontaneously hypertensive rats by inhibiting renal micro-inflammation. Biosci Rep. 2016;36(3). doi:10.1042/BSR20160035
33. Jesmin S, Gando S, Zaedi S, et al. Protease-activated receptor 2 blocking peptide counteracts endotoxin-induced inflammation and coagulation and ameliorates renal fibrin deposition in a rat model of acute renal failure. Shock. 2009;32(6):626–632. doi:10.1097/SHK.0b013e3181a5359c
34. Gupta KK, Donahue DL, Sandoval-Cooper MJ, Castellino FJ, Ploplis VA. Abrogation of plasminogen activator inhibitor-1-vitronectin interaction ameliorates acute kidney injury in murine endotoxemia. PLoS One. 2015;10(3):e0120728. doi:10.1371/journal.pone.0120728
35. Zhang C, Ma P, Zhao Z, et al. miRNAmRNA regulatory network analysis of mesenchymal stem cell treatment in cisplatin‑induced acute kidney injury identifies roles for miR210/Serpine1 and miR378/Fos in regulating inflammation. Mol Med Rep. 2019;20(2):1509–1522. doi:10.3892/mmr.2019.10383
36. Yin L, Wu N, Lazar MA. Nuclear receptor Rev-erbalpha: a heme receptor that coordinates circadian rhythm and metabolism. Nucl Recept Signal. 2010;8:e001. doi:10.1621/nrs.08001
37. Triqueneaux G, Thenot S, Kakizawa T, et al. The orphan receptor Rev-erbalpha gene is a target of the circadian clock pacemaker. J Mol Endocrinol. 2004;33(3):585–608. doi:10.1677/jme.1.01554
38. Liu AC, Tran HG, Zhang EE, Priest AA, Welsh DK, Kay SA. Redundant function of REV-ERBalpha and beta and non-essential role for Bmal1 cycling in transcriptional regulation of intracellular circadian rhythms. PLoS Genet. 2008;4(2):e1000023. doi:10.1371/journal.pgen.1000023
39. Kojetin DJ, Burris TP. REV-ERB and ROR nuclear receptors as drug targets. Nat Rev Drug Discov. 2014;13(3):197–216. doi:10.1038/nrd4100
40. Guo L, Zhang T, Wang F, et al. Targeted inhibition of Rev-erb-alpha/beta limits ferroptosis to ameliorate folic acid-induced acute kidney injury. Br J Pharmacol. 2021;178(2):328–345. doi:10.1111/bph.15283
 © 2022 The Author(s). This work is published and licensed by Dove Medical Press Limited. The full terms of this license are available at https://www.dovepress.com/terms.php and incorporate the Creative Commons Attribution - Non Commercial (unported, v3.0) License.
By accessing the work you hereby accept the Terms. Non-commercial uses of the work are permitted without any further permission from Dove Medical Press Limited, provided the work is properly attributed. For permission for commercial use of this work, please see paragraphs 4.2 and 5 of our Terms.

