Back to Journals » International Journal of General Medicine » Volume 15
Identifying Molecular Subtypes and 6-Gene Prognostic Signature Based on Hypoxia for Optimizing Targeted Therapies in Non-Small Cell Lung Cancer
Authors Lin J, Chen S, Xiao L, Wang Z, Lin Y, Xu S ![]()
Received 22 December 2021
Accepted for publication 9 March 2022
Published 26 April 2022 Volume 2022:15 Pages 4417—4432
DOI https://doi.org/10.2147/IJGM.S352238
Checked for plagiarism Yes
Review by Single anonymous peer review
Peer reviewer comments 2
Editor who approved publication: Dr Scott Fraser
Jingrong Lin,1 Shujiao Chen,2 Linling Xiao,3 Ziyan Wang,1 Yanqing Lin,1 Shungui Xu1
1Department of Respiratory Medicine, The Affiliated People’s Hospital of Fujian University of Traditional Chinese Medicine, Fujian, 35003, People’s Republic of China; 2Academic Affairs Office, People’s Hospital Affiliated to Fujian University of Traditional Chinese Medicine, Fujian, 35003, People’s Republic of China; 3The First Clinical Medical College, Fujian University of Traditional Chinese Medicine, Fujian, 35003, People’s Republic of China
Correspondence: Shungui Xu, Department of Respiratory Medicine, Affiliated People’s Hospital of Fujian University of Traditional Chinese Medicine, Fujian, 35003, People’s Republic of China, Email [email protected]
Background: Non-small cell lung cancer (NSCLC) accounts for a great number of all lung cancer cases. Hypoxia, one of the hallmarks in solid cancer, is closely involved in cancer cell progression and migration. This study aimed to develop a molecular subtyping system based on hypoxia-related genes and construct a prognostic model for NSCLC patients.
Methods: Unsupervised consensus clustering was used to classify molecular subtypes. Mutation and immune analyses were conducted to compare differences among the molecular subtypes. Univariate Cox regression, least absolute shrinkage and selection operator (LASSO) analysis, and step Akaike information criterion (stepAIC) were performed to screen prognostic genes.
Results: Two molecular subtypes (C1 and C2) were identified based on hypoxia-related genes and showed significant differences in survival, enriched pathways, tumor microenvironment (TME), and sensitivity to immunotherapy and chemotherapy. Interestingly, C1 subtype had better survival and response to targeted therapies. Oncogenic pathways, such as hypoxia, epithelial mesenchymal transition (EMT), NOTCH signaling, and p53 signaling pathways were more enriched in C2 subtype. A 6-gene prognostic model with robust ability was developed to classify NSCLC patients into high-risk and low-risk groups.
Conclusion: The novel molecular subtypes could assist personalized therapies to select suitable patients. The six prognostic genes may be novel targets for further understanding mechanisms of NSCLC development associated with hypoxia and exploiting novel targeted therapies.
Keywords: non-small cell lung cancer, hypoxia, molecular subtypes, tumor microenvironment, immunotherapy, prognostic genes, bioinformatics analysis
Introduction
Lung cancer, as the most frequently diagnosed cancer all over the world, shows the highest incidence in males.1 A major histological subtype of lung cancer is non-small cell lung cancer (NSCLC), of which lung adenocarcinoma and lung squamous cell carcinoma are the main subtypes. Tobacco smoking is the most common risk factor for lung cancer, and it is even the leading cause of more than 80% of all lung cancer cases in countries with a high smoking rate.2 But still, non-smokers who may be exposed to second-hand smoking and occupational carcinogens may also develop lung cancer. Tobacco prevention, for example, the use of e-cigarettes to eliminate carcinogenic chemicals in cigarettes, is an effective strategy for preventing lung cancer, but it is far from effective to fight against lung cancer. A number of studies have shown that genetic susceptibility is an important cause for lung cancer. Kirsten rat sarcoma (KRAS) and epidermal growth factor receptor (EGFR) are the most common genes detected in NSCLC patients.3
Oxygen deprivation (hypoxia) is a critical characteristic in solid tumors, and it can facilitate cancer progression and metastasis. Arterial oxygen tension is 5.73 kPa in the lung, and an oxygen tension below 2.03–3.04 kPa is defined as hypoxia. Evidence suggested that a significantly low oxygen below 0.02 kPa can induce oriented mutations and improve resistance to ionizing photon irradiation,4,5 indicating that hypoxia could lead to unfavorable survival of cancer.6 Inspired by such an important role in cancers, researchers started to consider hypoxia as a therapeutic target in many cancers including in NSCLC, and have discovered encouraging results.7 Hypoxia-targeted therapies are effective to suppress drug resistance of hypoxia, and have shown a strong performance when combined with other therapies, such as radiotherapy and chemotherapy in clinical trials.8
To design a personalized treatment for optimized outcomes, selecting suitable NSCLC patients for receiving hypoxia-targeted therapies is important. To this end, many studies have explored a series of gene signatures to more accurately identify lung cancer patients with different hypoxia levels.9–11 Also, a number of biomarkers associated with NSCLC prognosis have been discovered to help screen NSCLC patients with high risk.12,13 However, to the best of our knowledge, none of the studies have developed molecular subtypes based on hypoxia for NSCLC. Compared with hypoxia-related biomarkers, molecular subtypes can directly evaluate whether a NSCLC patient could benefit from receiving hypoxia-target therapies or other personalized therapies such as immunotherapy.
Therefore, in this study, we aimed to classify a molecular subtyping system based on hypoxia-related genes for NSCLC patients. We analyzed functional pathways in different molecular subtypes and predicted the sensitivity of patients with different subtypes to immunotherapy and chemotherapy. In addition, we also developed a prognostic signature based on hypoxia-related genes, and the signature could serve as an independent risk factor for NSCLC patients.
Materials and Methods
Data Source
TCGA-LUAD and TCGA-LUSC datasets containing RNA-seq and clinical data were downloaded from The Cancer Genome Atlas (TCGA) database (https://portal.gdc.cancer.gov/). Expression profiles of gene chips, including GSE31210, GSE30219, GSE50081, GSE19188, GSE37745, and GSE29013 datasets, were acquired from the Gene Expression Omnibus (GEO) database (https://www.ncbi.nlm.nih.gov/geo/). These gene chips were all sequenced by GPL570 platform. Two hundred hypoxia-related genes were obtained from h.all.v7.3.symbols.gmt file in the Molecular Signatures Database v7.3 (MSigDB) (https://www.gsea-msigdb.org/gsea/msigdb/index.jsp).
Data Preprocessing
In TCGA datasets, genes with low expression (transcript per million (TPM) < 1 in over half the samples) were excluded. Ensembl ID was converted to gene symbol. Median expression value was selected when one gene symbol corresponded to multiple IDs. Expression was transformed to log2 (expression). Using “RemoveBatchEffect” function in limma R package,14 the batch effects of TCGA-LUAD and TCGA-LUSC datasets were removed and two datasets were combined to one dataset, named TCGA-NSCLC. Principal component analysis (PCA) described sample distribution before and after batch effect removal (Supplementary Figure S1A and B).
In GEO datasets, rma function in affy (V1.66.0) R package15 was applied to process and normalize raw data. Probes were converted to gene symbols, according to the GPL570 annotation file. Median expression was selected when multiple probes matched one gene symbol, whereas probes matching multiple gene symbols were eliminated. Samples without survival time or survival status were excluded. Using the “RemoveBatchEffect” function, the batch effects of the six datasets were eliminated and combined to one cohort. PCA showed that samples were clustered after removing batch effects (Supplementary Figure S1C and D).
Identifying Molecular Subtypes Based on Hypoxia-Related Genes
Firstly, univariate Cox regression analysis was conducted on the TCGA-NSCLC dataset and GSE cohorts to screen hypoxia-related genes significantly associated with prognosis (P<0.05). Intersected genes in the two datasets were retained for further analysis. ConsensusClusterPlus R package (v1.48.0)16 was applied to perform consensus clustering under the parameters of reps =100, pItem =0.8, pFeature =1, clusterAlg = “km”, distance = “euclidean”. Cluster number k =2–10 was analyzed to confirm the optimal cluster number.
Clinical Features and Known Immune Subtypes Analysis in Molecular Subtypes
The distribution of different clinical features, including survival status, age, gender, smoking status, and stages, in C1 and C2 were analyzed using Chi-squared test. Moreover, the distributions of six immune subtypes across 33 cancer types, namely C1 (wound healing), C2 (IFN-γ dominant), C3 (inflammatory), C4 (lymphocyte depleted), C5 (immunologically quiet), and C6 (TGF-β dominant), in C1 and C2 were analyzed using Chi-squared test.
T-Distributed Stochastic Neighbor Embedding (t-SNE)
T-SNE with two tree-based algorithms is commonly used for processing high-dimensional data and data visualization in scatter plots.17 The expression data of hypoxia-related genes in the TCGA dataset and GSE cohorts were used as an input in t-SNE visualization.
SubMap Analysis
Gene Pattern SubMap analysis18 was applied to compare the similarity of expression profiles between the two groups. This was performed here for evaluating the robustness of molecular subtypes in different datasets. The subtyping system was considered as robust if similar expression data of the same molecular subtype were shown in different datasets. In addition, we performed SubMap to predict the sensitivity of different molecular subtypes to immunotherapy (details in “Predicting Sensitivity to Immunotherapy and Chemotherapy” section).
Functional Analysis
Limma R package was employed to identify differential expressed genes between different molecular subtypes. False discovery rate (FDR) <0.05 and |fold change (FC)| >1.5 were set to screen significantly differentially expressed genes. R package of clusterProfiler (v3.16.0)19 was applied to analyze gene ontology (GO) and Kyoto Encyclopedia of Genes and Genomes (KEGG) pathways. Significantly enriched terms and pathways were screened under FDR <0.05. Gene set enrichment analysis (GSEA) in clusterProfiler was employed to enrich pathways (h.all.v7.3.symbols.gmt) obtained from MsigDB.
Assessment of Tumor Microenvironment
Microenvironment Cell Populations-counter (MCP-counter)20 could characterize the immune cells in TME and calculate the abundance of 10 immune cells across mixtures. CIBERSORT,21 a computational method, is widely used to assess the enrichment of 22 immune cells through microarray or RNA-seq data. Estimation of STromal and Immune cells in MAlignant Tumours using Expression data (ESTIMATE)22 evaluates TME through calculating immune score and stromal score based on gene signatures. ESTIMATE score is the combined score of immune score and stromal score. Based on gene expression data, EPIC measurement23 estimates the fraction of immune cells, cancer cells, and other non-malignant cells.
Predicting Sensitivity to Immunotherapy and Chemotherapy
Tumor Immune Dysfunction and Exclusion (TIDE) analysis24 was performed to predict the immune response to immunotherapy through analyzing T-cell dysfunction and T-cell exclusion in LUAD. The proportion of positive and negative responders with different molecular subtypes to immune checkpoint blockade (ICB) was calculated. To more correctly evaluate the sensitivity of molecular subtypes to immunotherapy, we introduced a dataset treated by anti-programmed cell death protein 1 (PD-1) (GSE78220) and conducted SubMap analysis to compare expression profiles between TCGA-NSCLC and GSE78220 datasets. To analyze patients’ sensitivity to chemotherapy, pRRophetic R package25 was applied to determine the estimated biochemical half maximal inhibitory concentration (IC50) of seven chemotherapeutic drugs, namely, bexarotene, doxorubicin, embelin, etoposide, gemcitabine, mitomycin C, and vinorelbine.
Constructing a Prognostic Model
Univariate Cox regression analysis was performed to filter hypoxia-related genes significantly associated with prognosis using the TCGA-NSCLC dataset and GSE cohorts. Intersection of the screened genes in the two datasets served as an input in LASSO analysis to reduce gene number.26 StepAIC in MASS R package27 and multiple Cox regression were applied to further optimize the prognostic model. Finally, the prognostic model was defined as: risk score =  , where coef(i) represents the coefficient of gene(i). The risk score of each sample was calculated and converted to z-score. Surv_cutpoint function in survminer R package (http://www.sthda.com/english/rpkgs/survminer/) was conducted to determine the optimal cut-off of z-score to classify samples into high-risk and low-risk groups. Univariate and multivariate Cox regression analysis were implemented to evaluate the independence of risk score to predict LUAD prognosis. The reliability and practicability of risk score and nomogram was evaluated by decision curve analysis (DCA).
Statistical Analysis
Kaplan-Meier (KM) curves were used to show patients’ survival status. All statistical analyses were performed in R (v3.4.2) platform. Statistical methods were described in the corresponding sections and legends. P<0.05 was considered as significant. All parameters were default if not specified.
GitHub Page
https://github.com/jianwem/pro2022/blob/main/Hypoxia_LUAD_immune_model.R
Results
Construction of Molecular Subtypes for NSCLC Based on Hypoxia-Related Genes
The expression profiles of hypoxia-related genes were extracted from TCGA-NSCLC dataset and GSE cohorts. Genes related to hypoxia were obtained from the hallmark hypoxia pathway. Univariate Cox regression analysis was applied to identify the hypoxia-related genes associated with NSCLC prognosis, specifically, there were 45 and 56 genes from the TCGA-NSCLC dataset and GSE cohorts, respectively (P<0.05). Subsequently, NSCLC samples were categorized into two subtypes (C1 and C2) based on 101 prognosis-associated genes in the TCGA-NSCLC dataset by consensus clustering (Supplementary Figure S2). The two subgroups showed a significantly distinct prognosis, with more favorable overall survival (OS) being found in the C1 subtype (P=0.00011, Figure 1A). The two subtypes were separately visualized by t-SNE, the results of which proved that the classification system was valid (Figure 1B). Enrichment analysis of the hypoxia pathway revealed that, compared with the C1 subtype, the C2 subtype was significantly higher enriched to the hypoxia pathway (P<0.0001, Figure 1C and D). In GSE cohorts, we also observed similar results that 801 samples were clearly divided into the two subgroups, and that the hypoxia pathway was significantly enriched in C2 subtype (P<0.0001, Figure 1E–H). Furthermore, we performed SubMap analysis to compare the similarity between the two groups, which have been classified into C1 and C2 subtypes. The results showed significantly similar expression data between TGCA-NSCLC and GSE cohorts in the same subtype (Supplementary Figure S3). The above results demonstrated the effective classification system based on hypoxia-related genes.
 |
Figure 1 Construction and validation of two molecular subtypes. (A) Kaplan-Meier survival curve between C1 and C2 subtypes in the TCGA-NSCLC dataset. Log rank test was conducted. (B) T-SNE analysis for describing the distribution of samples with two subtypes in the TCGA-NSCLC dataset. (C) Comparison of enrichment of hypoxia pathway between C1 and C2 subtypes in the TCGA-NSCLC dataset. Wilcoxon test was performed. (D) The enrichment score of hypoxia pathway ranking for samples in the TCGA-NSCLC dataset. (E) Kaplan-Meier survival curve between C1 and C2 subtypes in GSE cohorts. Log rank test was conducted. (F) T-SNE analysis for describing the distribution of samples with two subtypes in GSE cohorts. (G) Comparison of enrichment of hypoxia pathway between C1 and C2 subtypes in GSE cohorts. Wilcoxon test was performed. (H) The enrichment score of hypoxia pathway ranking for samples in GSE cohorts. Abbreviations: ES, enrichment score; NES, normalized enrichment score; FDR, false discovery rate. |
Molecular Subtypes are Associated with Clinical Features
As for the relation between the two molecular subtypes and clinical features, we analyzed the distribution of C1 and C2 in different clinical features, including survival status, age, gender, smoking status, and stages. It has been found that the C1 subtype had a higher proportion of alive patients than C2 (P=0.0391, Figure 2A). There was no difference in age, gender, or smoking status (P>0.05, Figure 2B–D). In the staging status, it was observed that the C1 subtype consisted of a higher proportion of patients with mild stages, such as T0, N0, M0, and stage I (Figure 2E–H). The above data validated that C1 and C2 varied in clinical features and the subtyping was effective.
 |
Figure 2 The distribution of different clinical features in C1 and C2 subtypes, including survival status (A), age (B), gender (C), smoking (D), T stage (E), N stage (F), M stage (G), and stage (H). Chi-square test was conducted. |
Oncogenic Pathways are Highly Enriched in C2 Subtype
We next used limma R package to analyze the expression profiles of the TCGA-NSCLC dataset and GSE cohorts. FDR <0.05 and |FC| >1.5 were selected as the criteria to screen DEGs. In the TCGA-NSCLC dataset, the C2 subtype contained 610 DEGs incorporating 496 up-regulated and 114 down-regulated genes. GO function analysis revealed that extracellular matrix-related terms were the most annotated in up-regulated genes (Supplementary Figure S4A–C). Enrichment analysis of KEGG pathways demonstrated that up-regulated genes were highly enriched in tumor-related pathways, such as the PI3K-Akt signaling pathway, ECM-receptor interaction, and proteo glycans in the cancer pathway (Supplementary Figure S4D). In GSE cohorts, a total of 903 DEGs (552 up-regulated and 381 down-regulated) in the C2 subtype were screened. Analysis on the up-regulated genes showed that extracellular matrix-related terms were also enriched in up-regulated genes, and that tumor-related pathways including cell cycle, IL-17 signaling pathway, p53 signaling pathway, and DNA replication were highly enriched (Supplementary Figure S5). Moreover, GSEA was applied to evaluate pathways from hallmark genes (h.all.v7.3.symbols.gmt) in C1 and C2 subtypes. Oncogenic pathways, such as epithelial mesenchymal transition (EMT), hypoxia, NOTCH signaling, p53 pathway, TGF-β signaling, and WNT-β catenin signaling pathways, were significantly enriched in C2 subtype both in the TCGA-NSCLC dataset and GSE cohorts (Figure 3).
 |
Figure 3 Assessment of enriched pathways from h.all.v7.3.symbols.gmt through GESA in TCGA-NSCLC dataset (A) and GSE cohorts (B). Horizontal axis represents the distribution of each sample and vertical axis represents the enrichment score of samples. Different pathways are labeled in different colors. |
Comparison with Other Molecular Subtypes
In a pan-cancer study, Thorsson et al28 proposed six immune subtypes across 33 cancer types, namely C1 (wound healing), C2 (IFN-γ dominant), C3 (inflammatory), C4 (lymphocyte depleted), C5 (immunologically quiet), and C6 (TGF-β dominant). Accordingly, we used the classification system to divide the samples in the TCGA-NSCLC dataset. The results showed that the C5 subtype was not present in these samples, and that C1, C2, and C3 formed the majority of them (Figure 4A). The distribution of our subtypes C1 and C2 was compared with these five subtypes, and we also analyzed the OS of the five subtypes. Here, C2 and C3 subtypes were found to have a more favorable prognosis than the rest, and they had a lower proportion in our subtype C2 than C1 (Figure 4B and C). The C3 subtype consisted of a markedly higher proportion (48%) in our subtype C2 than in C1 (29%), which was related to an unfavorable prognosis of our subtype C2. The above results indirectly demonstrated that our subtyping was effective.
 |
Figure 4 Comparison with immune subtypes from a pan-cancer study. (A) Donut plot of comparing our molecular subtypes (outside circle) with immune subtypes (inside circle). (B) Histogram of the distribution of five immune subtypes in our molecular subtypes. Chi-square test was performed. (C) Kaplan-Meier survival plot of five immune subtypes. Log rank test was performed. |
Distinct Immune Features Between C1 and C2 Subtypes
Next we compared the immune features of C1 and C2 subtypes in the TCGA-NSCLC dataset using CIBERSORT, MCP-counter, EPIC, and ESTIMATE. CIBERSORT analysis revealed a clear difference of 14 out of 22 immune cells between C1 and C2, especially M0 macrophages and CD8 T-cells (P<0.0001, Figure 5A). C2 had a higher proportion of M0 macrophages than C1 but a lower percent of CD8 T-cells. MCP-counter and EPIC methods showed similar results that the proportion of CD8 T-cells were all lower in C2, and a higher proportion of cancer-associated fibroblasts (CAFs) was shown in C2 (P<0.0001, Figure 5B and C). From the results of ESTIMATE analysis, it could be found that the C2 subtype had a significantly higher enrichment score of immune score and stromal score than C1, indicating that C2 involved more immune infiltrated than C1 (Figure 5D). In addition, the two subtypes exhibited a significant difference in immune checkpoint expression because 33 out of 47 immune checkpoints showed differential expression between C1 and C2 (P<0.05, Figure 5E). Furthermore, GSE cohorts demonstrated similar results to the above immune features, suggesting a distinct tumor immune microenvironment of two subtypes (Supplementary Figure S6).
 |
Figure 5 Characterization of tumor microenvironment between two subtypes in TCGA-NSCLC dataset. (A) Enrichment of 22 immune cells evaluated by CIBERSORT. (B) Enrichment of 10 immune cells analyzed by MCP-Counter. (C) EPIC measurement for describing eight immune cells. (D) ESTIMATE method for calculating stromal score and immune score. (E) Expression of 47 immune checkpoints presented as log2 (TPM). Student t-test was performed. *P<0.05, **P<0.01, ***P<0.001, ****P<0.0001. Abbreviations: ns, no significance; TPM, transcript per million. |
C1 Subtype is Predicted to Have a Favorable Prognosis in Immunotherapy and Chemotherapy
As C1 and C2 subtypes presented differential tumor microenvironments, whether they would show a differential response to targeted therapy was examined using TIDE measurement to predict patients’ response to immunotherapy. High TIDE score indicated a high immune escape to immunotherapy. In the TCGA-NSCLC dataset, the C1 subtype showed a lower TIDE score but a higher proportion of positive response to immunotherapy than C2, suggesting an insensitivity of C2 to immunotherapy (P<0.0001, Figure 6A–C). In GSE cohorts, similar results were obtained that C1 was more sensitive than C2 subtype, with a 57% positive response in C1 in comparison with 26% in C2 (Figure 6D–F).
 |
Figure 6 Sensitivity of two subtypes to immunotherapy predicted by TIDE. (A) Kaplan-Meier survival plot of samples grouped by positive (true) and negative (false) responses to immunotherapy in the TCGA-NSCLC dataset. Log rank test was performed. (B) TIDE score of C1 and C2 subtypes in the TCGA-NSCLC dataset. Wilcoxon test was performed. (C) The distribution of positive and negative responses in C1 and C2 subtypes in the TCGA-NSCLC dataset. Chi-square test was performed. (D) Kaplan-Meier survival plot of samples grouped by positive and negative responses to immunotherapy in GSE cohorts. Log rank test was performed. (E) TIDE score of C1 and C2 subtypes in GSE cohorts. Wilcoxon test was performed. (F) The distribution of positive and negative responses in C1 and C2 subtypes in GSE cohorts. Chi-square test was performed. |
Furthermore, we used an openly available dataset of melanoma patients (GSE78220) treated by anti-PD1 therapy to predict the response of NSCLC patients to immunotherapy. Submap analysis was used to compare the similarity of expression profiles between melanoma patients and NSCLC patients. In the TCGA-NSCLC dataset, C1 subtype showed similar expression compared with patients treated by anti-PD1 (P=0.011, Figure 7A), indicating that C1 was predicted to be actively responsive to anti-PD1 immunotherapy. In GSE cohorts, we also observed similar results, although there was no significant difference (Figure 7B). To know the response of two subtypes to chemotherapy, pRRophetic R package was applied to predict their sensitivity to seven chemotherapeutic drugs (bexarotene, doxorubicin, embelin, etoposide, gemcitabine, mitomycin C, and vinorelbine). A significant difference of response to these drugs was observed between C1 and C2 subtypes (Figure 7C and D). The C1 subtype had a higher estimated IC50 than the C2 subtype, which indicated that C1 was more sensitive to these chemotherapeutic drugs.
 |
Figure 7 Predicting response of C1 and C2 subtypes to immunotherapy and chemotherapy. (A and B) Submap analysis between the anti-PD-1 treatment group and TCGA-NSCLC dataset, the anti-PD-1 treatment group and GSE cohorts. Anti-PD-1-NR indicates no response to anti-PD-1 and anti-PD-1-R indicates a positive response. P-value was corrected by Bonferroni correction. (C and D) Estimated IC50 of chemotherapeutic drugs including bexarotene, doxorubicin, embelin, etoposide, gemcitabine, mitomycin C, and vinorelbine in the TCGA-NSCLC dataset and GSE cohorts. **P<0.01, ****P<0.0001. Abbreviation: ns, no significance. |
Construction of a Prognostic Model Based on Hypoxia-Related Genes
In the previous sections, we demonstrated that C1 and C2 subtypes identified based on hypoxia-related genes varied in OS, tumor microenvironment and sensitivity to immunotherapy and chemotherapy. Then, we screened prognostic genes related to hypoxia, and constructed a prognostic model for NSCLC patients. Here, 14 hypoxia-related genes significantly associated with prognosis were filtered using univariate Cox regression analysis. Then LASSO regression analysis was performed to reduce the number of genes with increased lambda value (Supplementary Figure S7A). Five-fold cross validation was applied to construct the model and analyze the confidence interval in each lambda value (Supplementary Figure S7B). When lambda =0.00978, the optimal model was generated, and here 11 genes remained. Subsequently, we performed stepAIC to further reduce the number of genes, and finally six genes were screened, but four genes showed a significant association with NSCLC prognosis (P<0.05, Figure 8). The prognostic model was defined as: risk score =0.173*ALDOA–0.139*EFNA1–0.071*GPC4+0.059*HOXB9+0.14*PGM2+0.157*PLAUR.
 |
Figure 8 Multivariate Cox regression analysis of six prognostic genes. Log rank test was performed. *P<0.05, **P<0.01. |
The risk score was calculated for each sample in TCGA-NSCLC dataset, and we used survminer R package to confirm the optimal cut-off in sample classification into high-risk and low-risk groups. Survival analysis revealed that the two groups had a significant differential prognosis (P<0.0001, Figure 9A). We also validated the 6-gene prognostic model in GSE cohorts, and observed that the samples were neatly classified into high-risk and low-risk groups with distinct OS (P<0.0001, Figure 9B). The above results indicated that the six prognostic genes could serve as predictors for predicting NSCLC prognosis.
 |
Figure 9 Kaplan-Meier survival plots of high-risk and low-risk groups in TCGA-NSCLC dataset (A) and GSE cohorts (B). Log rank test was performed. |
Risk Score is Associated with Clinical Features
To understand if there was a relation between risk score and clinical features, the distribution of risk score in different clinical features was analyzed (Figure 10). The results showed that risk score significantly varied in T1–T4 stages (P=1.9e-05, Figure 10A), N0–N2 stages (P=2.6e-05, Figure 10B), stage I–IV (P=2.4e-05, Figure 10D), and smoking status (P=0.0041, Figure 10F). Particularly, the risk score increased with the stages from I to IV. C2 subtype had a higher risk score than C1, which was consistent with the unfavorable prognosis in C2 (P<2.2e-16, Figure 10E). However, no significant difference was shown in M stage, genders, or ages (Figure 10C, G, and H). We then assessed the independence of the prognostic model in clinical use by univariate and multiple Cox regression analysis. Comparison with other clinical information demonstrated that risk score was an independent factor for clinical prediction (P<0.0001, Figure 11).
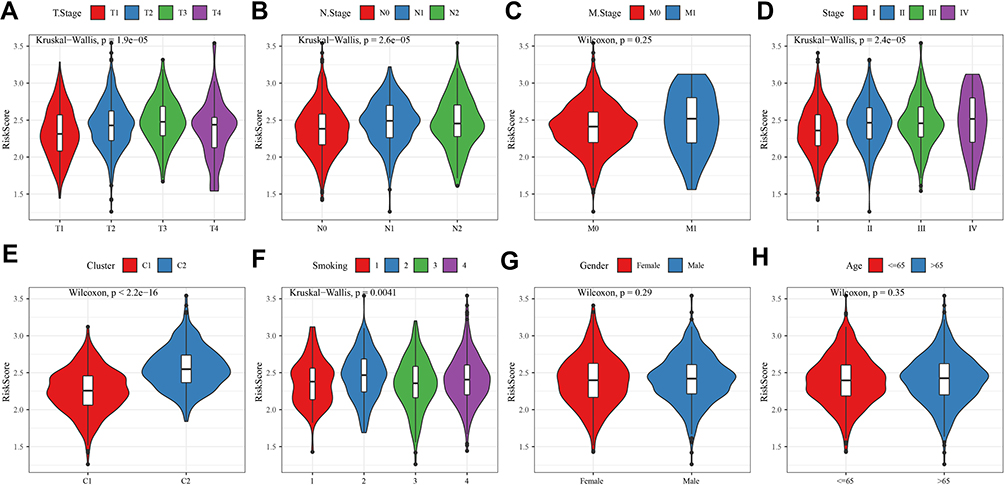 |
Figure 10 The relation between risk score and different features including T stage (A), N stage (B), M stage (C), stage (D), molecular subtypes (E), smoking (F), gender (G) and age (H). Kruskal-Wallis test was performed over two groups. Wilcoxon test was performed between two groups. |
 |
Figure 11 Univariate (A) and multivariate (B) Cox regression analysis of clinical features and risk score. Log rank test was performed. Abbreviation: HR, hazard ratio. |
A Nomogram Based on Risk Score for Predicting Prognosis
To promote the clinical applicability of the risk score, we introduced a nomogram to serve the function of the prognostic model. T stage and risk score were used to construct the nomogram, and 1-, 3-, and 5-year survival were confirmed by the total points from T stage and risk score (Figure 12A). The predicted OS was corrected by the observed OS (Figure 12B). Then DCA was used to verify the robustness of the prognostic model and nomogram (Figure 12C). The result showed that nomogram was the most effective in predicting prognosis and was helpful in assisting clinical decision.
 |
Figure 12 Construction of a nomogram based on risk score. (A) A nomogram based on risk score and T-stage for predicting 1-year, 3-year, and 5-year survival. (B) Correction for the nomogram by observed OS. (C) DCA for evaluating the efficiency of risk score, T-stage, and nomogram in predicting prognosis. Orange line indicates all patients receive no treatment and purple line indicates all patients receive treatment. Vertical axis represents standardized net benefit of positive treatment minus negative treatment. |
Discussion
Hypoxia, which is one of the hallmarks in solid cancers, induces a tumor environment for cancer progression and metastasis. Hypoxia has been considered as a therapeutic target in lung cancer and achieved a promising outcome in clinical trials.8 To improve the efficiency and individuality of hypoxia-targeted therapy, we characterized the molecular features of NSCLC patients at a molecular level for helping design more personalized therapies. Therefore, in this study, we focused on hypoxia-related genes and constructed a molecular subtyping system for NSCLC.
In the two molecular subtypes, functional analysis exhibited that oncogenic pathways were highly enriched in the C2 subtype, indicating a higher activity of cancer progression in C2 compared with C1 subtype. Annotation on KEGG pathways showed that PI3K-Akt signaling, focal adhesion, proteoglycans in cancer, and p53 signaling pathways were significantly enriched in up-regulated genes in C2 subtype. The PI3K-Akt pathway can enhance the expression of hypoxia-inducible factor (HIF)-1 through growth factors such as transforming growth factor (TGF).29 A number of studies suggested that hypoxia induces the EMT process, thereby promoting migration and metastasis in many cancer types.30 NOTCH signaling and TGF-β signaling pathways play a modulation role in mediating EMT and hypoxia-induced cancer cell progression.31–33 C1 and C2 subtypes manifested similar results of enriched pathways in different datasets, indicating that the subtyping based on hypoxia was reliable.
A pan-cancer research proposed that LUAD could be divided into five major immune subtypes, namely C1 (wound healing), C2 (IFN-γ dominant), C3 (inflammatory), C4 (lymphocyte depleted), and C6 (TGF-β dominant).28 Using the TCGA dataset, we compared the distribution of the five immune subtypes with our subtypes. C1, C2, and C3 immune subtypes consisted of the majority, with C3 subtype showing the most favorable prognosis. Consistently, our subtype C1 with a better prognosis had a higher proportion of inflammatory (C3) subtype and a lower proportion of wound healing (C1) and IFN-γ (C2) subtypes, which indirectly proved the effectiveness of our molecular subtypes. In the above results, inflammatory features seemed to be a protective factor for NSCLC, and studies have demonstrated that high immune infiltration is correlated with a positive immune response to cancer cells in TME to some extent,34 but chronic immune infiltration can inhibit effective immune response to cancer cells.35
Hypoxia is a critical factor in TME regulation through modulating the expression of immune checkpoints such as PD-L1 and CD137.36 Hypoxia has been found to play dual roles, such as stimulating anti-tumor effector T-cell functions and immune-suppressive functions of tumor-associated macrophages (TAMs).36 We found that CD8 T-cells were higher-enriched in C1 subtype, while macrophages were more accumulated in C2 subtype. High infiltration of TAMs is considered to be associated with unfavorable prognosis in most cancers.37 TAMs are widely studied in the relation to hypoxia, and evidence has revealed that hypoxia commonly co-exists with TAMs together with an increasing component of migratory factors such as CCL2, CCL5, and colony-stimulating factor 1 (CSF1).38 Hypoxic TAMs release survival cytokines such as interleukin (IL)-6 and tumor necrosis factor (TNF)-α for cancer cells, thereby hindering the normal function of chemotherapeutic drugs. Furthermore, hypoxic TAMs could generate a forced tumor-promoted event in invasion, angiogenesis, and metastasis.38
The above findings suggested a critical role of hypoxia in shaping TME and facilitating cancer progression. The status of TME could largely determine patients’ response to immunotherapy and chemotherapy. It could be concluded that hypoxia does play an important role in modulating TME, thereby leading to a differential response to immunotherapy and chemotherapy.
Based on hypoxia-related genes, we further identified six prognostic genes (ALDOA, EFNA1, GPC4, HOXB9, PGM2, and PLAUR) and constructed a prognostic signature. The signature manifested a strong performance in classifying NSCLC patients into high-risk and low-risk groups with a significantly distinct prognosis. Fructose-bisphosphate aldolase A (ALDOA) was reported to be an oncogene in pancreatic cancer,39 and its high expression was associated with poor prognosis in colorectal cancer.40 In lung cancer, another study found that ALDOA could induce lung cancer progression through activating the HIF-1α/MMP9 axis.41 Ephrin A1 (EFNA1) was found to be overexpressed in gastric cancer and colorectal cancer,42,43 but it was confirmed as a protective factor to NSCLC in our study, which suggested its different roles in different cancer types. Glypicans are a family of heparan sulfate proteoglycans that interact with variable ligands such as chemokines, growth factors, and extracellular matrix.44 Some glypicans were detected to be aberrantly expressed in cancer. Studies indicated that Glypican 4 (GPC4) was involved in tumorigenesis and migration in breast cancer and colorectal cancer.45,46 Homeobox B9 (HOXB9) was considered as a biomarker in many cancer types, and it was commonly overexpressed in lung cancer to promote its metastasis.47,48 Urokinase plasminogen activator receptor (PLAUR) was also identified as a biomarker in various cancers. Zhou et al49 observed that PLAUR could induce gefitinib-resistance in NSCLC patients, indicating that it may be a potential target for chemotherapy. PGM2 was less reported in lung cancer, but it could be a new possibility to help explain the tumorigenesis mechanism in NSCLC.
In addition, a nomogram based on the prognostic signature showed promising results for its application in clinical practice. These identified prognostic genes related to hypoxia could serve as a signature for predicting NSCLC prognosis, and they were possibly involved in the cancer development and hypoxia in NSCLC.
Conclusion
In conclusion, this study proposed two novel immune subtypes (C1 and C2) and a 6-gene prognostic signature based on hypoxia-related genes. Analyses on multiple aspects demonstrated their effectiveness and validity for clinical management of NSCLC patients. Importantly, the study emphasized the important role of hypoxia in the tumorigenesis of NSCLC and the interactions of hypoxia-related pathways, TME, and targeted therapies. The immune subtypes could provide guidance to select suitable patients for immunotherapy, chemotherapy, or combined therapies. The six prognostic genes could serve as new targets for personalized therapies and to help further explain mechanisms in NSCLC development.
Data Sharing Statement
The datasets generated and/or analyzed during the current study are available in the GEO database (GSE31210, GSE30219, GSE50081, GSE19188, GSE37745, and GSE29013 datasets).
Ethical Statement
The study was exempted by the Ethical Committee of The Affiliated People’s Hospital of Fujian University of Traditional Chinese Medicine.
Author Contributions
All authors made a significant contribution to the work reported, whether that is in the conception, study design, execution, acquisition of data, analysis and interpretation, or in all these areas; took part in drafting, revising, or critically reviewing the article; gave final approval of the version to be published; have agreed on the journal to which the article has been submitted; and agree to be accountable for all aspects of the work.
Funding
There is no funding to report.
Disclosure
The authors declare that they have no competing interests.
References
1. Sung H, Ferlay J, Siegel RL, et al. Global cancer statistics 2020: GLOBOCAN estimates of incidence and mortality worldwide for 36 cancers in 185 countries. CA Cancer J Clin. 2021. doi:10.3322/caac.21660
2. Sun S, Schiller JH, Gazdar AF. Lung cancer in never smokers — a different disease. Nat Rev Cancer. 2007;7(10):778–790. doi:10.1038/nrc2190
3. Sacher AG, Paweletz C, Dahlberg SE, et al. Prospective validation of rapid plasma genotyping for the detection of EGFR and KRAS mutations in advanced lung cancer. JAMA Oncol. 2016;2(8):1014–1022. doi:10.1001/jamaoncol.2016.0173
4. Bhandari V, Hoey C, Liu LY, et al. Molecular landmarks of tumor hypoxia across cancer types. Nat Genet. 2019;51(2):308–318. doi:10.1038/s41588-018-0318-2
5. Horsman MR, Overgaard J. The impact of hypoxia and its modification of the outcome of radiotherapy. J Radiat Res. 2016;57 Suppl 1:i90–i98. doi:10.1093/jrr/rrw007
6. Ren W, Mi D, Yang K, et al. The expression of hypoxia-inducible factor-1α and its clinical significance in lung cancer: a systematic review and meta-analysis. Swiss Med Wkly. 2013;143:w13855. doi:10.4414/smw.2013.13855
7. Salem A, Asselin MC, Reymen B, et al. Targeting hypoxia to improve non–small cell lung cancer outcome. J Natl Cancer Inst. 2018;110:14–30. doi:10.1093/jnci/djx160
8. Tharmalingham H, Hoskin P. Clinical trials targeting hypoxia. Br J Radiol. 2019;92(1093):20170966. doi:10.1259/bjr.20170966
9. Chang WH, Forde D, Lai AG. A novel signature derived from immunoregulatory and hypoxia genes predicts prognosis in liver and five other cancers. J Transl Med. 2019;17(1):14. doi:10.1186/s12967-019-1775-9
10. Mo Z, Yu L, Cao Z, Hu H, Luo S, Zhang S. Identification of a hypoxia-associated signature for lung adenocarcinoma. Front Genet. 2020;11:647. doi:10.3389/fgene.2020.00647
11. Sun J, Zhao T, Zhao D, et al. Development and validation of a hypoxia-related gene signature to predict overall survival in early-stage lung adenocarcinoma patients. Ther Adv Med Oncol. 2020;12:1758835920937904. doi:10.1177/1758835920937904
12. Carvalho S, Troost EG, Bons J, Menheere P, Lambin P, Oberije C. Prognostic value of blood-biomarkers related to hypoxia, inflammation, immune response and tumour load in non-small cell lung cancer – a survival model with external validation. Radiother Oncol. 2016;119:487–494. doi:10.1016/j.radonc.2016.04.024
13. Shi Y, Fan S, Wu M, et al. YTHDF1 links hypoxia adaptation and non-small cell lung cancer progression. Nat Commun. 2019;10(1):4892. doi:10.1038/s41467-019-12801-6
14. Ritchie ME, Phipson B, Wu D, et al. limma powers differential expression analyses for RNA-sequencing and microarray studies. Nucleic Acids Res. 2015;43(7):e47. doi:10.1093/nar/gkv007
15. Gautier L, Cope L, Bolstad BM, Irizarry RA. Affy--analysis of Affymetrix GeneChip data at the probe level. Bioinformatics (Oxford, England). 2004;20(3):307–315. doi:10.1093/bioinformatics/btg405
16. Wilkerson MD, Hayes DN. ConsensusClusterPlus: a class discovery tool with confidence assessments and item tracking. Bioinformatics (Oxford, England). 2010;26(12):1572–1573. doi:10.1093/bioinformatics/btq170
17. Maaten LVD. Accelerating t-SNE using tree-based algorithms. J Mach Learn Res. 2014;15:3221–3245.
18. Roh W, Chen PL, Reuben A, et al. Integrated molecular analysis of tumor biopsies on sequential CTLA-4 and PD-1 blockade reveals markers of response and resistance. Sci Transl Med. 2017;9. doi:10.1126/scitranslmed.aah3560
19. Yu G, Wang LG, Han Y, He QY. clusterProfiler: an R package for comparing biological themes among gene clusters. Omics. 2012;16:284–287. doi:10.1089/omi.2011.0118
20. Becht E, Giraldo NA, Lacroix L, et al. Estimating the population abundance of tissue-infiltrating immune and stromal cell populations using gene expression. Genome Biol. 2016;17(1):218. doi:10.1186/s13059-016-1070-5
21. Chen B, Khodadoust MS, Liu CL, Newman AM, Alizadeh AA. Profiling tumor infiltrating immune cells with CIBERSORT. Methods Mol Biol. 2018;1711:243–259.
22. Yoshihara K, Shahmoradgoli M, Martínez E, et al. Inferring tumour purity and stromal and immune cell admixture from expression data. Nat Commun. 2013;4(1):2612. doi:10.1038/ncomms3612
23. Racle J, de Jonge K, Baumgaertner P, Speiser DE, Gfeller D. Simultaneous enumeration of cancer and immune cell types from bulk tumor gene expression data. eLife. 2017;6. doi:10.7554/eLife.26476
24. Jiang P, Gu S, Pan D, et al. Signatures of T cell dysfunction and exclusion predict cancer immunotherapy response. Nat Med. 2018;24(10):1550–1558. doi:10.1038/s41591-018-0136-1
25. Geeleher P, Cox N, Huang RS. pRRophetic: an R package for prediction of clinical chemotherapeutic response from tumor gene expression levels. PLoS One. 2014;9:e107468. doi:10.1371/journal.pone.0107468
26. Lu Y, Zhou Y, Qu W, Deng M, Zhang C. A Lasso regression model for the construction of microRNA-target regulatory networks. Bioinformatics (Oxford, England). 2011;27(17):2406–2413. doi:10.1093/bioinformatics/btr410
27. Zhang Z. Variable selection with stepwise and best subset approaches. Ann Transl Med. 2016;4(7):136. doi:10.21037/atm.2016.03.35
28. Thorsson V, Gibbs DL, Brown SD, et al. The immune landscape of cancer. Immunity. 2018;48(4):812–830.e814. doi:10.1016/j.immuni.2018.03.023
29. Xie Y, Shi X, Sheng K, et al. PI3K/Akt signaling transduction pathway, erythropoiesis and glycolysis in hypoxia (Review). Mol Med Rep. 2019;19(2):783–791. doi:10.3892/mmr.2018.9713
30. Marie-Egyptienne DT, Lohse I, Hill RP. Cancer stem cells, the epithelial to mesenchymal transition (EMT) and radioresistance: potential role of hypoxia. Cancer Lett. 2013;341(1):63–72. doi:10.1016/j.canlet.2012.11.019
31. Ishida T, Hijioka H, Kume K, Miyawaki A, Nakamura N. Notch signaling induces EMT in OSCC cell lines in a hypoxic environment. Oncol Lett. 2013;6(5):1201–1206. doi:10.3892/ol.2013.1549
32. Sahlgren C, Gustafsson MV, Jin S, Poellinger L, Lendahl U. Notch signaling mediates hypoxia-induced tumor cell migration and invasion. Proc Natl Acad Sci U S A. 2008;105(17):6392–6397. doi:10.1073/pnas.0802047105
33. Lin YT, Wu KJ. Epigenetic regulation of epithelial-mesenchymal transition: focusing on hypoxia and TGF-β signaling. J Biomed Sci. 2020;27:39. doi:10.1186/s12929-020-00632-3
34. Binnewies M, Roberts EW, Kersten K, et al. Understanding the tumor immune microenvironment (TIME) for effective therapy. Nat Med. 2018;24(5):541–550. doi:10.1038/s41591-018-0014-x
35. Wang D, DuBois RN. Immunosuppression associated with chronic inflammation in the tumor microenvironment. Carcinogenesis. 2015;36(10):1085–1093. doi:10.1093/carcin/bgv123
36. Labiano S, Palazon A, Melero I. Immune response regulation in the tumor microenvironment by hypoxia. Semin Oncol. 2015;42(3):378–386. doi:10.1053/j.seminoncol.2015.02.009
37. Noy R, Pollard JW. Tumor-associated macrophages: from mechanisms to therapy. Immunity. 2014;41(1):49–61. doi:10.1016/j.immuni.2014.06.010
38. Henze AT, Mazzone M. The impact of hypoxia on tumor-associated macrophages. J Clin Invest. 2016;126:3672–3679. doi:10.1172/JCI84427
39. Ji S, Zhang B, Liu J, et al. ALDOA functions as an oncogene in the highly metastatic pancreatic cancer. Cancer Lett. 2016;374(1):127–135. doi:10.1016/j.canlet.2016.01.054
40. Dai L, Pan G, Liu X, et al. High expression of ALDOA and DDX5 are associated with poor prognosis in human colorectal cancer. Cancer Manag Res. 2018;10:1799–1806. doi:10.2147/CMAR.S157925
41. Chang YC, Chan YC, Chang WM, et al. Feedback regulation of ALDOA activates the HIF-1α/MMP9 axis to promote lung cancer progression. Cancer Lett. 2017;403:28–36. doi:10.1016/j.canlet.2017.06.001
42. Nakamura R, Kataoka H, Sato N, et al. EPHA2/EFNA1 expression in human gastric cancer. Cancer Sci. 2005;96:42–47. doi:10.1111/j.1349-7006.2005.00007.x
43. Yamamoto H, Tei M, Uemura M, et al. Ephrin-A1 mRNA is associated with poor prognosis of colorectal cancer. Int J Oncol. 2013;42(2):549–555. doi:10.3892/ijo.2012.1750
44. Li N, Spetz MR, Ho M. The role of glypicans in cancer progression and therapy. J Histochem Cytochem. 2020;68(12):841–862. doi:10.1369/0022155420933709
45. Munir J, Van Ngu T, Na Ayudthaya PD, Ryu S. Downregulation of glypican-4 facilitates breast cancer progression by inducing cell migration and proliferation. Biochem Biophys Res Commun. 2020;526(1):91–97. doi:10.1016/j.bbrc.2020.03.064
46. Fang Y, Shen ZY, Zhan YZ, et al. CD36 inhibits β-catenin/c-myc-mediated glycolysis through ubiquitination of GPC4 to repress colorectal tumorigenesis. Nat Commun. 2019;10:3981. doi:10.1038/s41467-019-11662-3
47. Hayashida T, Takahashi F, Chiba N, et al. HOXB9, a gene overexpressed in breast cancer, promotes tumorigenicity and lung metastasis. Proc Natl Acad Sci U S A. 2010;107(3):1100–1105. doi:10.1073/pnas.0912710107
48. Nguyen DX, Chiang AC, Zhang XH, et al. WNT/TCF signaling through LEF1 and HOXB9 mediates lung adenocarcinoma metastasis. Cell. 2009;138:51–62. doi:10.1016/j.cell.2009.04.030
49. Zhou J, Kwak KJ, Wu Z, et al. PLAUR confers resistance to gefitinib through EGFR/P-AKT/Survivin signaling pathway. Cell Physiol Biochem. 2018;47(5):1909–1924. doi:10.1159/000491071
 © 2022 The Author(s). This work is published and licensed by Dove Medical Press Limited. The
full terms of this license are available at https://www.dovepress.com/terms
and incorporate the Creative Commons Attribution
- Non Commercial (unported, 3.0) License.
By accessing the work you hereby accept the Terms. Non-commercial uses of the work are permitted
without any further permission from Dove Medical Press Limited, provided the work is properly
attributed. For permission for commercial use of this work, please see paragraphs 4.2 and 5 of our Terms.
© 2022 The Author(s). This work is published and licensed by Dove Medical Press Limited. The
full terms of this license are available at https://www.dovepress.com/terms
and incorporate the Creative Commons Attribution
- Non Commercial (unported, 3.0) License.
By accessing the work you hereby accept the Terms. Non-commercial uses of the work are permitted
without any further permission from Dove Medical Press Limited, provided the work is properly
attributed. For permission for commercial use of this work, please see paragraphs 4.2 and 5 of our Terms.