Back to Journals » Journal of Inflammation Research » Volume 14
Identification of Unique Transcriptomic Signatures and Hub Genes Through RNA Sequencing and Integrated WGCNA and PPI Network Analysis in Nonerosive Reflux Disease
Received 21 September 2021
Accepted for publication 12 November 2021
Published 23 November 2021 Volume 2021:14 Pages 6143—6156
DOI https://doi.org/10.2147/JIR.S340452
Checked for plagiarism Yes
Review by Single anonymous peer review
Peer reviewer comments 2
Editor who approved publication: Professor Ning Quan
Ye Zhao,1,* Teng Ma,2,* Duowu Zou1
1Department of Gastroenterology, Ruijin Hospital, Shanghai Jiao Tong University School of Medicine, Shanghai, 200025, People’s Republic of China; 2Department of Thoracic Surgery, Zhongshan Hospital, Fudan University, Shanghai, 200032, People’s Republic of China
*These authors contributed equally to this work
Correspondence: Duowu Zou 200025 Tel +86-2164370045-665444
Email [email protected]
Purpose: Transcriptomic studies on gastroesophageal reflux disease are scarce, and gene expression signatures in nonerosive reflux disease (NERD) remain elusive. The aim of the study was to identify gene expression profiles and potential hub genes in NERD.
Patients and Methods: We performed RNA sequencing on biopsy samples from nine consecutive patients with NERD and six healthy controls. Differentially expressed genes (DEGs) were analysed with the DESeq2 R package. A DEG-based protein–protein interaction (PPI) network was constructed to filter hub genes using Cytoscape. Weighted gene coexpression network analysis (WGCNA) was conducted to identify the coexpression relationships of all modules and explore the relationship between gene sets and clinical traits.
Results: In total, 1195 DEGs were identified, including 649 upregulated and 546 downregulated genes involved in regulating the inflammatory response and epithelial cell differentiation. Overlap of the PPI and WGCNA networks identified five shared genes, namely, THY1, BMP2, LOX, KDR and MMP9, as candidate hub genes in NERD. Quantitative PCR analysis of the expression of these five genes confirmed the sequencing results. Receiver operating characteristic analyses indicated that these hub genes had diagnostic potential for NERD patients. Gene set enrichment analysis confirmed that each hub gene was closely associated with the pathophysiological processes of NERD. In addition, a regulatory network comprising 42 transcription factors (TFs), 28 miRNAs and 5 hub genes was established.
Conclusion: The five core genes may be promising biomarkers of NERD. The TF/miRNA/hub gene network can improve the understanding of the molecular mechanisms underlying disease progression.
Keywords: nonerosive reflux disease, RNA sequencing, hub gene, bioinformatics analysis, WGCNA, validation
Introduction
Gastroesophageal reflux disease (GERD) is among the most common reasons for outpatient gastroenterology visits. The worldwide prevalence of GERD is estimated to be 8–33%, placing a substantial health burden on society.1 The cardinal symptoms of GERD are troublesome regurgitation and heartburn. Symptoms and complications usually occur due to abnormal refluxate exposure, while visceral hypersensitivity, genetic factors, and psychological factors may contribute to refractory GERD, classified as insensitivity to acid suppression therapies.2
From the endoscopic perspective, 30% of GERD cases present as erosive reflux disease (ERD), 60–70% present as nonerosive reflux disease (NERD), and only up to 10% are diagnosed as Barrett’s esophagus (BE).3 Notably, the severity of symptoms does not correspond with endoscopic findings, and NERD makes up the vast majority of refractory GERD cases.4 These heterogeneities indicate that NERD is the most common manifestation of GERD and a more formidable challenge than ERD. Given that a substantial proportion of NERD patients continue to experience persistent symptoms despite acid suppression therapies,5 there is an unmet medical need for additional NERD treatment strategies.
With this goal in mind, researchers are committed to exploring the molecular pathogenesis of NERD to identify novel therapeutic targets. As the first defense against gastroesophageal refluxate, the esophageal epithelium mucosa plays a pivotal role in the pathogenesis of NERD.3 Accumulating insights into mucosal pathogenesis have revealed impaired mucosal integrity and a defective mucosal barrier in the esophageal epithelium of patients with NERD.6,7 Adherens junction molecules, such as E-cadherin, and tight junction molecules, such as claudin-4 (CLDN4), have been reported to be potential biomarkers for NERD.8–10 Transient receptor potential vanilloid (TRPV) channel subfamily members, known therapeutic targets for visceral pain modulation, have been widely reported to be upregulated in NERD,11,12 confirming a close association between visceral hypersensitivity and NERD. The levels of proteinase-activated receptor-2 (PAR-2), which is activated by acidified medium, were elevated in the esophageal mucosa of NERD patients, thereby modulating pain and sensation though TRPV1 and acid-sensing ion channel-3 (ASIC3) sensitization.11,13,14 Furthermore, recent studies have demonstrated that mucosal inflammation has a critical impact on symptom generation and disease progression in GERD. The current prevailing opinion is that mucosal inflammation is initiated and mediated by reflux-induced cytokine production rather than direct caustic injury.3,15,16 Prostaglandin-endoperoxide synthase 2 (PTGS2) and proinflammatory cytokines, including interleukin (IL)-8, IL-1β, IL-6, IL-33, tumor necrosis factor (TNF), and monocyte chemoattractant protein 1 (MCP-1), have been shown to be correlated with mucosal inflammation in GERD, especially ERD.17–22 However, the possible roles of these cytokines, other than IL-8, in NERD have yet to be characterized.22 As an upstream regulator of IL-8, nuclear factor κB (NFκB) signaling pathway activation in GERD has been implicated in numerous studies.17,23 In addition, several intracellular signaling pathways, including the mitogen-activated protein kinase (MAPK) and Wnt/β-catenin pathways, also participate in GERD.24,25 Despite a surge of interest in identifying novel biomarkers in NERD, current biomarkers lack either sensitivity or specificity, and gene expression profiles remain largely elusive.
To elucidate the differential gene expression signature between NERD and healthy controls (HCs), we completed RNA sequencing transcriptomic analysis. Nevertheless, RNA sequencing alone is insufficient to discover promising diagnostic and therapeutic targets for disease. We next integrated a protein–protein interaction (PPI) network and weighted gene coexpression network analysis (WGCNA) to identify the key genes in the progression of NERD. Five hub genes were identified and validated using quantitative real-time polymerase chain reaction (qRT-PCR) and receiver operating characteristic (ROC) analysis. Molecular mechanisms underlying the hub gene signatures were explored by gene set enrichment analysis (GSEA). Finally, a transcription factor (TF)/miRNA/hub gene regulatory network was established for the progression of NERD.
Materials and Methods
Biopsy Specimens
Tissue samples were obtained during upper gastrointestinal endoscopy of patients with a normal esophagus and NERD patients at Ruijin Hospital affiliated with Shanghai Jiao Tong University. All patients including healthy volunteers and those with persistent symptoms suggestive of GERD (acid regurgitation and/or heartburn) and no previous antisecretory or prokinetic therapy were advised to undergo 24 h multiple intraluminal impedance-pH (MII-pH) monitoring and endoscopy in sequence. Before 24 h MII-pH testing, high-resolution manometry was conducted to accurately locate lower esophageal sphincter and exclude major motility disorders. NERD was defined as abnormal pH-impedance monitoring and normal endoscopic findings. Healthy volunteers were those with an absence of GERD symptoms, normal GERD questionnaire score, negative pH-impedance studies and no identification of esophageal mucosal lesions. For each subject, specimens were taken prior to any antisecretory and/or prokinetic therapy. Each biopsy was obtained at 5 cm above the squamocolumnar junction from macroscopically intact mucosa. This study was blinded to the results of pH monitoring, mucosal biopsy and transcriptomic analysis. This study complies with the Declaration of Helsinki. All participants signed written informed consent to participate in the study, which was approved by the hospital ethics committee (KY20194421).
Transcriptome Sequencing
Nine NERD patients and six HCs were enrolled for RNA sequencing. Biopsies from these patients were immersed in RNAlater (Ambion, TX, USA) for processing at a later date. RNA extraction, library construction, and sequencing analyses were performed by Novogene (Beijing, China). RNA integrity and library quality were assessed on a Bioanalyzer 2100 system (Agilent Technologies, CA, USA). An Illumina NovaSeq6000 (Illumina, CA, USA) was used to sequence the library preparations.
Data Analysis and DEG Identification
To ensure data quality, raw data (raw reads) in FASTQ format were first manipulated using in-house Perl scripts. High-quality clean data (clean reads) were then obtained after removing reads containing adapters or poly-N sequences and low-quality reads from raw data. All subsequent analyses were based on clean reads. FeatureCounts (1.5.0-p3) was utilized to count the number of reads mapped to each gene. DESeq2 was used to perform read count normalization and differentially expressed gene (DEG) analysis. The FPKM (fragments per kilobase of transcript per million mapped reads) of each gene was calculated according to gene length and read count mapped to this gene. Principal component analysis (PCA) on all genes was performed to compare the similarities among the samples using the R function prcomp. An adjusted P value of 0.05 and absolute fold change (FC) of 1 were set as the thresholds for significant differential expression.
Gene Ontology (GO) and Pathway Enrichment Analysis
To better interpret the biological importance of the identified DEGs, GO analyses of biological process (BP), cellular component (CC) and molecular function (MF) were performed, and the results were visualized using ClueGO (version 2.5.7), a Cytoscape plugin.26 Meanwhile, Kyoto Encyclopedia of Genes and Genomes (KEGG) pathway enrichment analysis was conducted using the online tool Metascape (http://metascape.org).27 P < 0.05 was set as the threshold for significant enrichment in the GO and KEGG analyses.
WGCNA
To perform coexpression analysis, WGCNA was executed on all genes using the WGCNA package in R.28 A sample dendrogram was plotted and combined with clinical traits using the average linkage method and Pearson’s correlation. Hierarchical clustering based on the topological overlap matrix was conducted to identify highly correlated gene modules with a minimum module size of 30 genes and a cut height threshold of 0.25. The network heatmap plot of coexpression modules was generated by the H-clust package in R.
Clinically Significant Module Identification
Module–trait relationship analysis was applied to evaluate the association between module eigengenes (MEs) and phenotypes. Significant module–trait correlations were considered when P < 0.05. Trait-related genes were extracted from the module with significant correlations with clinical features. Subsequently, genes with high within-module connectivity were selected as hub genes.
Protein–Protein Interaction (PPI) Network Construction and Hub Gene Extraction
The PPI network of the DEGs was generated by the STRING database (http://string-db.org/)29 and reconstructed using Cytoscape software (version 3.8.2)26 with a confidence interaction score of 0.4. The CytoHubba and MCODE plugins in Cytoscape were applied to screen modules of hub genes in the established PPI network. Finally, a Venn diagram was utilized to screen for hub gene signatures present in both the PPI and WGCNA networks.
Hub Gene Validation
For qRT-PCR analysis, total RNA was isolated from esophageal biopsy samples from NERD patients (n = 40) and HCs (n = 40) using TRIzol reagent (Invitrogen, CA, USA). First Strand cDNA Synthesis SuperMix (Yeasen, Shanghai, China) and SYBR Green Master Mix (Yeasen) were used to synthesize cDNA and assess the mRNA levels of candidate hub genes, respectively. β-Actin was used as an internal control, and the relative mRNA expression levels were calculated using the 2-ΔΔCT method. The primer sequences are shown in Table S1. ROC curves were generated with the R package (pROC) to assess the capability of candidate hub genes to distinguish NERD patients from HCs.
GSEA
RNA sequencing data were first divided into two groups (high and low) according to the median values of the selected hub genes. GSEA (www.broadinstitute.org/gsea)30 was then conducted to discern enriched functions and pathways in the high and low expression groups using the curated gene sets (C2: canonical pathways) of the Molecular Signature Database.
TF Regulatory Network Construction
Putative miRNA–mRNA interactions were retrieved from starBase (http://starbase.sysu.edu.cn/index.php).31 MiRNAs that bind hub genes were selected based on the following criteria: CLIP ≥ 5 and the miRNA–mRNA relationship was predicted by at least four programs. For each miRNA, we obtained experimentally verified TF–miRNA interactions from TransmiR (http://www.cuilab.cn/transmir).32 ChIP-Atlas (http://chip-atlas.org/target_genes), an integrative data mining suite for public ChIP-seq data,33 was utilized to test the interactions between predicted TFs and hub genes. Finally, the TF/miRNA/hub gene interaction network was visualized using Cytoscape software.
Results
RNA-Seq Data Processing
Nine samples from consecutive patients with NERD (mean age, 44.78 ± 10.20 years; range, 25–58 years; 6 females) and six samples from HCs (mean age, 43.33 ± 12.23 years; range 28–62 years; 4 females) were collected and processed for RNA sequencing. The demographic and clinical characteristics of these patients are provided in Table 1. The complete sequencing data have been deposited in Gene Expression Omnibus (GEO, GSE182974). A flow chart describing the study design is shown in Figure 1.
 |
Table 1 Clinical Characteristics of the Fifteen Patients Enrolled for RNA Sequencing |
 |
Figure 1 Schematic of the study workflow. Abbreviations: NERD, nonerosive reflux disease; HC, healthy control; PCA, principal component analysis; DEG, differentially expressed gene; GO, Gene Ontology; KEGG, Kyoto Encyclopedia of Genes and Genomes; WGCNA, weighted gene coexpression network analysis; PPI, protein–protein interaction; qRT-PCR, quantitative real-time polymerase chain reaction; ROC, receiver operating characteristic; GSEA, gene set enrichment analysis; TF, transcription factor. |
Analysis of Gene Expression and Functional Enrichment
PCA of RNA-seq data showed a substantial difference in the gene signatures of the two groups (Figure 2A). A total of 1195 DEGs in the NERD and HC groups were identified, including 649 upregulated and 546 downregulated DEGs (Table S2). The corresponding volcano plot and heatmap are shown in Figure 2B and C. C-X-C motif chemokine ligand 8 (CXCL8, encoding IL-8), IL-33, TRPV3, PTGS2, and MAPK10 were among the upregulated DEGs, while transmembrane protein 47 (TMEM47), epithelial membrane protein 3 (EMP3), and mucin 1 (MUC1) were among the downregulated DEGs. Additionally, IL1B (logFC = 0.82, P = 0.05), NFκB subunit 1 (NFKB1, logFC = 0.29, P < 0.01) and REL (logFC = 0.7, P < 0.001) were highly expressed in the NERD vs HC groups. Tight junction protein 3 (TJP3, logFC = - 0.75, P < 0.001) and apical junction component 1 homolog (AJM1, logFC = - 0.65, P < 0.001) were decreased in NERD patients compared to HCs. According to the GO terms BP, CC and MF, the identified DEGs were significantly enriched in tissue development, cell motility, extracellular matrix (ECM) organization, cellular response to chemical stimulus, cell–cell signaling, regulation of cell adhesion, intrinsic component of membrane, and signaling receptor binding (Figure 3A–C, Figure S1A–C). KEGG enrichment analysis revealed that the DEGs in the NERD group were associated with regulation of protein digestion and absorption, mineral absorption, cytokine-cytokine receptor interaction, pathways in cancer and IL-17 signaling pathway (Figure 3D, Figure S1D).
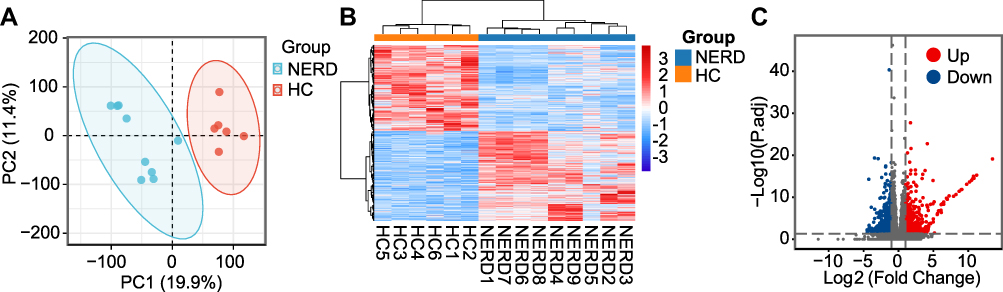 |
Figure 2 Analysis of RNA sequencing data. (A) PCA of sequencing data generated from biopsies of 9 patients with NERD and 6 HCs. (B) DEGs retrieved from sequencing data are illustrated in the clustered heatmap. Red in the heatmap denotes upregulation, while blue denotes downregulation. (C) The overall distribution of DEGs is depicted in a volcano plot. |
 |
Figure 3 GO and KEGG enrichment analyses of DEGs. (A) Biological process (BP). (B) Cellular component (CC). (C) Molecular function (MF). (D) Heatmap of KEGG enriched terms colored by p-values. |
WGCNA and Clinically Significant Module Identification
All 32,186 genes in the 15 samples were analyzed by WGCNA. The sample dendrogram and trait heatmap are shown in Figure 4A. No outlier samples were detected by hierarchical clustering. The correlation coefficient was set as 0.82, and hence, β=4 was determined to be the ideal soft-thresholding power (Figure 4B). A clustering dendrogram of all selected genes is shown as a heatmap plot in Figure S2A. A hierarchical clustering tree identified 25 distinct modules (Figure 4C). In Figure S2B, the hierarchical clustering dendrogram and eigengene adjacency heatmap are depicted to indicate the connectivity among the coexpression modules and clinical trait weight. In addition, the correlations between MEs and clinical traits, namely, NERD, regurgitation, heartburn, age, sex, body mass index, hiatus hernia, smoking and drinking, were analyzed (Figure 4D). The turquoise module with 4833 genes was selected as the clinically significant module owing to its most significant association with NERD and regurgitation (Figure 4D).
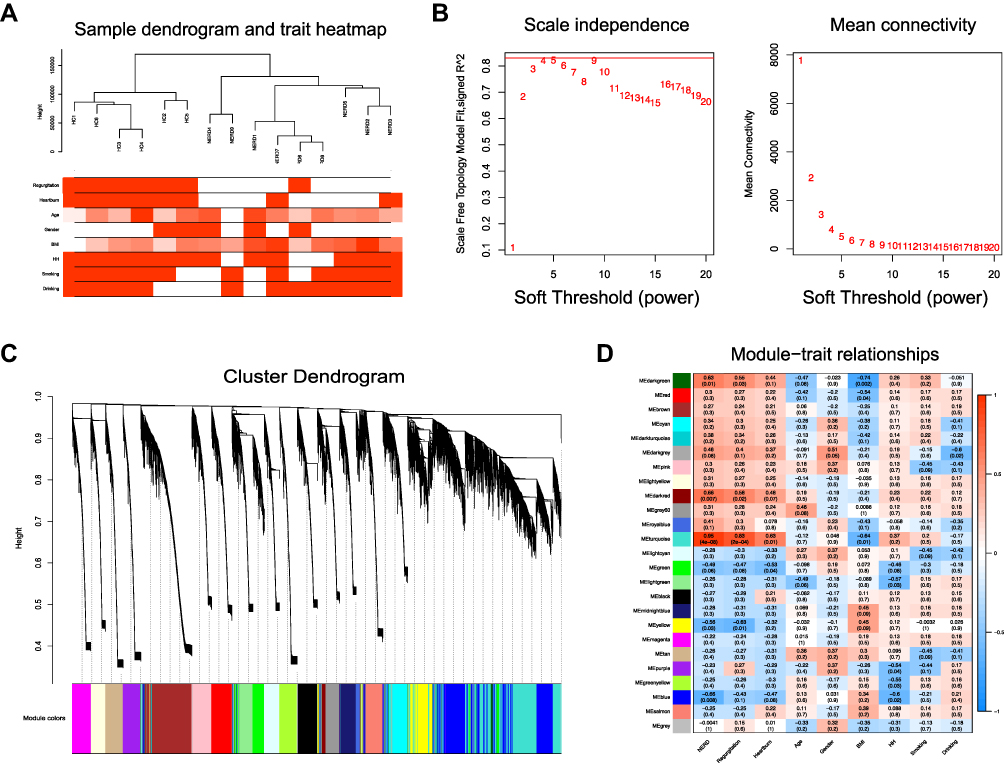 |
Figure 4 WGCNA. (A) Sample dendrogram and trait heatmap. (B) Analysis of the scale-free fit index for various soft-thresholding powers (left) and the mean connectivity for various soft-thresholding powers (right). (C) Clustering dendrogram of genes for GSE182974, together with the assigned module colors. (D) The module–trait association analysis revealed the highest association between the turquoise module and NERD. |
PPI Network Analysis and Hub Gene Identification
To extract the key genes involved in NERD using another method, a PPI network with 800 nodes and 2723 edges was also built based on the protein-coding DEGs (Figure 5A). The interactive relationships were subsequently imported into Cytoscape plugins. The top twenty genes were selected by the Stress algorithm of the CytoHubba plugin (Figure 5B, Table S3). We confidently identified the hub genes as those in common between the turquoise module and the PPI analysis. Finally, thy-1 cell surface antigen (THY1), bone morphogenetic protein 2 (BMP2), lysyl oxidase (LOX), kinase insert domain receptor (KDR) and matrix metallopeptidase 9 (MMP9) were identified as hub genes for NERD (Figure 5C).
 |
Figure 5 (A) PPI network of DEGs. (B) The top twenty hub genes were selected by the Stress algorithm of the Cytoscape plugin CytoHubba. The color indicates the score calculated by CytoHubba; higher scores are more red, and lower scores are more yellow. (C) Venn diagram shows the overlapping genes in the DEG–PPI network and WGCNA. |
Validation and GSEA of Hub Genes
The expression of the five hub genes was further evaluated in patients with NERD (n = 40) and HCs (n = 40). qRT-PCR demonstrated that all five genes were highly expressed in the NERD group, which was in accordance with the high-throughput sequencing results (Figure 6A). ROC curve analyses based on qRT-PCR data indicated that the mRNA expression of the five genes possessed potential diagnostic value for NERD (Figure 6B). The GSEA results showed the top gene set enrichment patterns between the high and low expression groups of different hub genes. Specifically, the ECM-specific pathway was enriched in the high expression groups for all the hub genes, while the electron transport chain and eukaryotic translation initiation complexes were enriched in the low expression groups for all the hub genes (Figure 6C–G). Moreover, IL signaling, basement membrane, inflammatory pathways, the cell cycle, DNA double strand break repair, the NRF2 pathway, potassium channels, and cell junction organization were significantly enriched in the high expression groups for different hub genes. Tight junctions, antigen processing and presentation, protein localization, and copper homeostasis were significantly enriched in the low expression groups for different hub genes (Figure 6C–G).
 |
Figure 6 Validation and single-gene GSEA of hub genes. (A) qRT-PCR analyses of hub genes. n = 40 per group. Data were presented as mean ± SD. Statistical significance was calculated by two-tailed unpaired Student’s t-test (THY1, LOX, and KDR) and Mann Whitney test (BMP2 and MMP9), respectively. * P < 0.05. (B) ROC curve analyses of hub genes. AUC, area under the ROC curve. An AUC of 0.9–1.0 is considered to indicate excellent discrimination. GSEA of THY1 (C), BMP2 (D), LOX (E), KDR (F), and MMP9 (G). |
Construction of the TF Regulatory Network
StarBase predicted 28 miRNAs that could bind hub genes. According to the standard criteria, one hub gene, MMP9, was not matched to any upstream miRNA. For KDR, the inclusion criteria were reduced to CLIP ≥ 2 and predicted miRNA binding sites by at least four programs; thus, two miRNAs were predicted to having binding sites in the 3ʹ-UTR of KDR. A total of 42 TFs targeting the predicted miRNAs were identified by TransmiR. Taken together, these results establish a TF/miRNA/hub gene network containing 266 regulatory relationships (155 TF/miRNA regulatory pairs, 28 miRNA/hub gene pairs, and 83 TF/hub gene pairs) (Figure 7, Table S4).
 |
Figure 7 The TF/miRNA/hub gene regulatory network. |
Discussion
NERD and ERD are the two main clinical presentations of GERD. Unlike ERD, NERD is an obstinate subgroup of GERD with a high rate of refractoriness to acid suppression therapy due to multiple factors, including visceral hypersensitivity, epithelial barrier destruction, and nonacid (weak acid or weak alkaline) reflux.34 Unfortunately, complementary therapy, as well as both convenient and reliable NERD diagnostics, are limited by the lack of precise gene expression profiles. Considering the intractability of NERD, a better understanding of the pathophysiological mechanisms underlying this disease remains a high priority.
In this study, we provide clear evidence for distinct transcriptomic repertoires between NERD and HC mucosa and verified candidate hub genes in the progression of NERD. To our knowledge, this is the first published RNA sequencing study comparing NERD patients with normal controls. Consistent with the results of prior studies,17–20 proinflammatory cytokines such as IL-8, IL-1β, and IL-33 and inflammatory mediators such as PTGS2 were upregulated in the NERD group compared to the HC group.17–20 We found that mucosal IL-6 expression was barely detectable in either group. No significant difference in TNFα (TNF) or MCP-1 (CCL2) was observed between the two groups. We also confirmed the activation of several proteins involved in major signaling pathways, in particular the MAPK and NFκB signaling pathways. The nociceptors TRPVs (TRPV1, 2, 3, 4, 6) and ASICs (ASIC1, 3), which are responsible for activating the nociceptive pathway in GERD,14 were detected in the esophageal mucosa of both NERD patients and HCs. Moreover, sequencing data showed the reduced expression of cell–cell junction molecules, suggesting compromised epithelial barrier function in NERD.7
To gain insight into the disease mechanism underlying NERD progression, we performed GO and KEGG analyses. GO and KEGG enrichment analysis for DEGs identified common processes in ECM-specific pathways, including ECM organization, collagen fibril organization, ECM–receptor interaction, and regulation of actin cytoskeleton. The network structure and biological components of the natural ECM are indispensable for cell fate, differentiation and communication during development, tissue maintenance and repair.35 However, excessive ECM production damages tissue elasticity and leads to fibrosis under conditions of chronic inflammation.36 Stuart Jon Spechler et al proposed that esophageal fibrosis conceivably aggravates GERD by interfering with lower esophageal sphincter function and peristalsis.37 Together with the findings from our enrichment results, these data suggest that the associations between NERD and esophageal fibrosis are worth studying further. Esophageal mucosal lesions that develop in response to noxious stimuli induce protective responses, such as mucosal repair and tissue restitution, which are mediated by various physiological events, such as cell motility, cell–cell adhesion, keratinocyte dedifferentiation, and angiogenesis.38 The processes involved in wound healing and tissue development were predicted in the enrichment analysis based on our sequencing data, providing evidence for the theory that although macroscopically intact, the esophageal mucosal integrity is impaired in NERD.7 Instead of cell death and apoptosis, inflammation-regulated processes were found to be enriched in this study, reinforcing the concept that the pathogenesis of GERD is initiated by cytokine-driven mucosal damage, rather than the death of surface cells-triggered inflammatory responses.3,15,16 In addition, KEGG analysis indicated that the DEGs were associated with DNA repair. A previous study suggested that there is crosstalk among mitochondrial function, the epithelial barrier and DNA damage in NERD.10 More comprehensive and in-depth research is still needed to understand the exact mechanism mediating this interplay.
We identified five key genes (THY1, BMP2, KDR, LOX, and MMP9) with differential expression between NERD patients and HCs. GSEA confirmed that the overexpression of hub genes was positively correlated with the ECM signaling pathway and negatively correlated with the mitochondrial electron transport chain and embryonic-associated translation initiation process. THY1 encodes Thy-1 (also known as CD90), an extracellular glycosylphosphatidylinositol-linked glycoprotein that has been identified in fibroblasts, myofibroblasts, mesangial cells, vascular pericytes, and active endothelial cells. In the human gut, THY1 has been shown to be an immunosuppressor and key regulator of acute and chronic inflammation.39 However, to the best of our knowledge, the role of THY1 in GERD remains unclear. Single-gene GSEA indicated that increased THY1 expression was also correlated with the NRF2 pathway, potassium channels, and cell junction organization. Another key gene, BMP2, belongs to the TGF-β superfamily, which plays essential roles in multiple developmental processes, such as cardiogenesis, osteogenesis and neurogenesis. Previous studies have provided robust evidence that the BMP pathway is indispensable for morphogenesis of the stratified squamous epithelium in the embryonic esophagus.40 Intriguingly, in another study on GERD, BMP4 was suggested to elicit the transformation of normal squamous cells into columnar cells in esophagitis.41 Our sequencing analyses and experimental validation showed that BMP2 was activated in patients with NERD. Cell motility, the syndecan-1 pathway, and basement membranes were also closely correlated with BMP2 by GSEA. The particular mechanism of BMP2 in NERD warrants further exploration. Repair following epithelial barrier damage involves many complicated processes in addition to re-epithelialization and inflammation, including angiogenesis and ECM remodeling.42 Both LOX and MMP9 are well characterized as pivotal factors in ECM remodeling.35,36 The LOX gene encodes the lysyl oxidase family of extracellular copper-dependent enzymes that catalyze the crosslinking of collagen and elastin fibers in the ECM of connective tissues.35 GSEA indicated that LOX may also regulate the inflammatory pathway, DNA damage repair, the cell cycle, and focal adhesion in NERD. MMPs, a family of zinc-dependent endopeptidases, have pleiotropic functions, including breaking down the ECM, proteolytically activating or degrading nonmatrix substrates and promoting angiogenesis, therefore affecting both the ECM and inflammation.36 In particular, MMP9, an ECM degradation protein, regulates the ECM remodeling during fibrosis.43 MMP9, also known as gelatinase B, has been recently reported to be increased in BE, which is a major complication of GERD.44 In an in vitro model mimicking GERD, MMP9 expression was upregulated by artificial gastric juice stimulation.45 GSEA revealed that genes regulated by MMP9 were enriched in signaling by ILs, the JAK-STAT signaling pathway, and the coordinately dysregulated pathways regulated by each hub gene. These findings indicated the involvement of MMP9 for the development of GERD, and shed new light on the relationship between ECM and GERD. MMP9 also plays a pivotal role in angiogenesis by modulating VEGF expression.46 The gene product of KDR is vascular endothelial growth factor receptor 2 (VEGFR2), which is activated by VEGFs and responsible for the major angiogenic functions of VEGF during wound healing. Angiogenesis markers such as VEGF-A have been widely shown to play crucial roles in gastrointestinal mucosal repair, such as healing of gastric ulcers.47 Auvinen et al reported that the immature blood vessels of Barrett’s esophagus express VEGFR2 and MMP9 on their exterior.48 Zhang et al demonstrated that strategies to inhibit VEGFR2 represent promising approaches to prevent carcinogenesis of Barrett’s esophagus.49,50 GSEA revealed that KDR was positively involved in pathways related to IL signaling and the JAK-STAT pathway and negatively involved in pathways related to tight junctions and TCR signaling.
In summary, this study provides supplementary evidence for why the predicted THY1, BMP2, LOX, MMP9, and KDR genes are highly correlated with the pathophysiology of NERD and are potential diagnostic biomarkers. The establishment of a TF/miRNA/hub gene regulatory network will help improve understanding of disease progression and optimize treatment strategies.
Conclusion
In the present study, the high-throughput sequencing and integrated bioinformatics methods were used for the first time to explore the molecular pathogenesis and developmental mechanism of NERD. Five shared genes, namely, THY1, BMP2, LOX, KDR and MMP9, were identified as candidate hub genes in NERD. The establishment of a transcription factor/miRNA/hub gene regulatory network help improve understanding of the molecular mechanisms underlying disease progression and optimize treatment strategies.
Data Sharing Statement
Sequencing data are deposited at GEO (www.ncbi.nlm.nih.gov/geo, GSE182974). All remaining data used and/or analyzed during the current study are available from the corresponding author (Duowu Zou) on reasonable request.
Ethics Approval and Consent to Participate
The use of human samples was approved by the ethics committee of Ruijin Hospital affiliated to Shanghai Jiao Tong University (Approval Number: KY20194421) and all patients signed an informed consent form. The study met the principles of the Declaration of Helsinki.
Consent for Publication
Consent was obtained from all participants for publication.
Acknowledgments
This work was supported by the National Natural Science Foundation of China (grant numbers 81970480, 82061138003, 81700492, and 81702899).
Disclosure
The authors report no conflicts of interest in this work.
References
1. Gyawali CP, Kahrilas PJ, Savarino E, et al. Modern diagnosis of GERD: the Lyon consensus. Gut. 2018;67(7):1351–1362. doi:10.1136/gutjnl-2017-314722
2. Yadlapati R, DeLay K. Proton pump inhibitor-refractory gastroesophageal reflux disease. Med Clin North Am. 2019;103(1):15–27. doi:10.1016/j.mcna.2018.08.002
3. Ustaoglu A, Nguyen A, Spechler S, et al. Mucosal pathogenesis in gastro-esophageal reflux disease. Neurogastroenterol Motil. 2020;32(12):e14022. doi:10.1111/nmo.14022
4. de Bortoli N, Ottonello A, Zerbib F, et al. Between GERD and NERD: the relevance of weakly acidic reflux. Ann N Y Acad Sci. 2016;1380(1):218–229. doi:10.1111/nyas.13169
5. Fock KM, Talley N, Goh KL, et al. Asia-Pacific consensus on the management of gastro-oesophageal reflux disease: an update focusing on refractory reflux disease and Barrett’s oesophagus. Gut. 2016;65(9):1402–1415.
6. Woodland P, Al-Zinaty M, Yazaki E, Sifrim D. In vivo evaluation of acid-induced changes in oesophageal mucosa integrity and sensitivity in non-erosive reflux disease. Gut. 2013;62(9):1256–1261. doi:10.1136/gutjnl-2012-302645
7. Woodland P, Sifrim D. Oesophageal mucosal barrier: a key factor in the pathophysiology of non-erosive reflux disease (NERD) and a potential target for treatment. Gut. 2014;63(5):705–706. doi:10.1136/gutjnl-2013-305101
8. Jovov B, Reed CC, Shaheen NJ, et al. Fragments of e-cadherin as biomarkers of non-erosive reflux disease. Dig Dis Sci. 2018;63(3):628–635. doi:10.1007/s10620-017-4815-4
9. Jovov B, Que J, Tobey NA, et al. Role of E-cadherin in the pathogenesis of gastroesophageal reflux disease. Am J Gastroenterol. 2011;106(6):1039–1047. doi:10.1038/ajg.2011.102
10. Chen H, Hu YH, Fang Y, et al. Nrf2 deficiency impairs the barrier function of mouse oesophageal epithelium. Gut. 2014;63(5):711–719. doi:10.1136/gutjnl-2012-303731
11. Suzuki N, Mihara H, Nishizono H, Tominaga M, Sugiyama T. Protease-activated receptor-2 up-regulates transient receptor potential vanilloid 4 function in mouse esophageal keratinocyte. Dig Dis Sci. 2015;60(12):3570–3578. doi:10.1007/s10620-015-3822-6
12. Guarino MP, Cheng L, Ma J, et al. Increased TRPV1 gene expression in esophageal mucosa of patients with non-erosive and erosive reflux disease. Neurogastroenterol Motil. 2010;22(7):746–751. doi:10.1111/j.1365-2982.2010.01514.x
13. Kandulski A, Wex T, Monkemuller K, et al. Proteinase-activated receptor-2 in the pathogenesis of gastroesophageal reflux disease. Am J Gastroenterol. 2010;105(9):1934–1943. doi:10.1038/ajg.2010.265
14. Wu L, Oshima T, Shan J, et al. PAR-2 activation enhances weak acid-induced ATP release through TRPV1 and ASIC sensitization in human esophageal epithelial cells. Am J Physiol Gastrointest Liver Physiol. 2015;309(8):G695–702. doi:10.1152/ajpgi.00162.2015
15. Souza RF, Huo XF, Mittal V, et al. Gastroesophageal reflux might cause esophagitis through a cytokine-mediated mechanism rather than caustic acid injury. Gastroenterology. 2009;137(5):1776–1784. doi:10.1053/j.gastro.2009.07.055
16. Dunbar KB, Agoston AT, Odze RD, et al. Association of acute gastroesophageal reflux disease with esophageal histologic changes. JAMA. 2016;315(19):2104–2112. doi:10.1001/jama.2016.5657
17. Isomoto H, Saenko VA, Kanazawa Y, et al. Enhanced expression of interleukin-8 and activation of nuclear factor kappa-B in endoscopy-negative gastroesophageal reflux disease. Am J Gastroenterol. 2004;99(4):589–597. doi:10.1111/j.1572-0241.2004.04110.x
18. Mönkemüller K, Wex T, Kuester D, et al. Interleukin-1beta and interleukin-8 expression correlate with the histomorphological changes in esophageal mucosa of patients with erosive and non-erosive reflux disease. Digestion. 2009;79(3):186–195. doi:10.1159/000211714
19. Taddei A, Fabbroni V, Pini A, et al. Cyclooxygenase-2 and inflammation mediators have a crucial role in reflux-related esophageal histological changes and Barrett’s esophagus. Dig Dis Sci. 2014;59(5):949–957. doi:10.1007/s10620-013-2975-4
20. Shan J, Oshima T, Muto T, et al. Epithelial-derived nuclear IL-33 aggravates inflammation in the pathogenesis of reflux esophagitis. J Gastroenterol. 2015;50(4):414–423. doi:10.1007/s00535-014-0988-1
21. Isomoto H, Wang A, Mizuta Y, et al. Elevated levels of chemokines in esophageal mucosa of patients with reflux esophagitis. Am J Gastroenterol. 2003;98(3):551–556. doi:10.1111/j.1572-0241.2003.07303.x
22. Isomoto H, Nishi Y, Kanazawa Y, et al. Immune and inflammatory responses in GERD and lansoprazole. J Clin Biochem Nutr. 2007;41(2):84–91. doi:10.3164/jcbn.2007012
23. O’Riordan JM, Abdel-Latif MM, Ravi N, et al. Proinflammatory cytokine and nuclear factor kappa-B expression along the inflammation-metaplasia-dysplasia-adenocarcinoma sequence in the esophagus. Am J Gastroenterol. 2005;100(6):1257–1264. doi:10.1111/j.1572-0241.2005.41338.x
24. Lyros O, Rafiee P, Nie L, et al. Dickkopf-1, the Wnt antagonist, is induced by acidic pH and mediates epithelial cellular senescence in human reflux esophagitis. Am J Physiol-Gastrointest Liver Physiol. 2014;306(7):G557–574. doi:10.1152/ajpgi.00153.2013
25. Zhang HY, Zhang X, Chen X, et al. Differences in activity and phosphorylation of MAPK enzymes in esophageal squamous cells of GERD patients with and without Barrett’s esophagus. Am J Physiol Gastrointest Liver Physiol. 2008;295(3):G470–G478. doi:10.1152/ajpgi.90262.2008
26. Shannon P, Markiel A, Ozier O, et al. Cytoscape: a software environment for integrated models of biomolecular interaction networks. Genome Res. 2003;13(11):2498–2504. doi:10.1101/gr.1239303
27. Zhou Y, Zhou B, Pache L, et al. Metascape provides a biologist-oriented resource for the analysis of systems-level datasets. Nat Commun. 2019;10(1):1523. doi:10.1038/s41467-019-09234-6
28. Langfelder P, Horvath S. WGCNA: an R package for weighted correlation network analysis. BMC Bioinform. 2008;9:559. doi:10.1186/1471-2105-9-559
29. Szklarczyk D, Morris JH, Cook H, et al. The STRING database in 2017: quality-controlled protein-protein association networks, made broadly accessible. Nucleic Acids Res. 2017;45(D1):D362–D368. doi:10.1093/nar/gkw937
30. Subramanian A, Tamayo P, Mootha VK, et al. Gene set enrichment analysis: a knowledge-based approach for interpreting genome-wide expression profiles. Proc Natl Acad Sci U S A. 2005;102(43):15545–15550. doi:10.1073/pnas.0506580102
31. Li J-H, Liu S, Zhou H, Qu L-H, Yang J-H. starBase v2.0: decoding miRNA-ceRNA, miRNA-ncRNA and protein-RNA interaction networks from large-scale CLIP-Seq data. Nucleic Acids Res. 2014;42(Database issue):D92–D97. doi:10.1093/nar/gkt1248
32. Tong Z, Cui Q, Wang J, Zhou Y. TransmiR v2.0: an updated transcription factor-microRNA regulation database. Nucleic Acids Res. 2019;47(D1):D253–D258. doi:10.1093/nar/gky1023
33. Oki S, Ohta T, Shioi G, et al. ChIP-Atlas: a data-mining suite powered by full integration of public ChIP-seq data. EMBO Rep. 2018;19(12):e46255.
34. Hungin AP, Molloy-Bland M, Scarpignato C. Revisiting Montreal: new insights into symptoms and their causes, and implications for the future of GERD. Am J Gastroenterol. 2019;114(3):414–421. doi:10.1038/s41395-018-0287-1
35. Laczko R, Csiszar K. Lysyl Oxidase (LOX): functional contributions to signaling pathways. Biomolecules. 2020;10(8):1093. doi:10.3390/biom10081093
36. Rieder F, Fiocchi C, Rogler G. Mechanisms, management, and treatment of fibrosis in patients with inflammatory bowel diseases. Gastroenterology. 2017;152(2):340–350. doi:10.1053/j.gastro.2016.09.047
37. Cheng E, Souza RF, Spechler SJ. Eosinophilic esophagitis: interactions with gastroesophageal reflux disease. Gastroenterol Clin North Am. 2014;43(2):243–256. doi:10.1016/j.gtc.2014.02.004
38. Roudebush C, Catala-Valentin A, Andl T, Le Bras GF, Andl CD. Activin A-mediated epithelial de-differentiation contributes to injury repair in an in vitro gastrointestinal reflux model. Cytokine. 2019;123:154782. doi:10.1016/j.cyto.2019.154782
39. Beswick EJ, Grim C, Singh A, et al. Expression of programmed death-ligand 1 by human colonic CD90(+) stromal cells differs between ulcerative colitis and crohn’s disease and determines their capacity to suppress th1 cells. Front Immunol. 2018;9:1125. doi:10.3389/fimmu.2018.01125
40. Rodriguez P, Silva SD, Oxburgh L, et al. BMP signaling in the development of the mouse esophagus and forestomach. Development. 2010;137(24):4171–4176. doi:10.1242/dev.056077
41. Milano F, van Baal JW, Buttar NS, et al. Bone morphogenetic protein 4 expressed in esophagitis induces a columnar phenotype in esophageal squamous cells. Gastroenterology. 2007;132(7):2412–2421. doi:10.1053/j.gastro.2007.03.026
42. Kinchen J, Chen HH, Parikh K, et al. Structural remodeling of the human colonic mesenchyme in inflammatory bowel disease. Cell. 2018;175(2):372–386. doi:10.1016/j.cell.2018.08.067
43. Goffin L, Fagagnini S, Vicari A, et al. Anti-MMP-9 antibody: a promising therapeutic strategy for treatment of inflammatory bowel disease complications with fibrosis. Inflamm Bowel Dis. 2016;22(9):2041–2057. doi:10.1097/MIB.0000000000000863
44. Zavala-Solares MR, Fonseca-Camarillo G, Valdovinos M, et al. Gene expression profiling of inflammatory cytokines in esophageal biopsies of different phenotypes of gastroesophageal reflux disease: a cross-sectional study. BMC Gastroenterol. 2021;21(1):201. doi:10.1186/s12876-021-01707-7
45. Sandner A, Illert J, Koitzsch S, Unverzagt S, Schön I. Reflux induces DNA strand breaks and expression changes of MMP1+9+14 in a human miniorgan culture model. Exp Cell Res. 2013;319(19):2905–2915. doi:10.1016/j.yexcr.2013.09.004
46. Bergers G, Brekken R, McMahon G, et al. Matrix metalloproteinase-9 triggers the angiogenic switch during carcinogenesis. Nat Cell Biol. 2000;2(10):737–744. doi:10.1038/35036374
47. Jones MK, Kawanaka H, Baatar D, et al. Gene therapy for gastric ulcers with single local injection of naked DNA encoding VEGF and angiopoietin-1. Gastroenterology. 2001;121(5):1040–1047. doi:10.1053/gast.2001.29308
48. Auvinen MI, Sihvo EIT, Ruohtula T, et al. Incipient angiogenesis in Barrett’s epithelium and lymphangiogenesis in Barrett’s adenocarcinoma. J Clin Oncol. 2002;20(13):2971–2979. doi:10.1200/JCO.2002.09.011
49. Zhang Q, Agoston AT, Pham TH, et al. Acidic bile salts induce epithelial to mesenchymal transition via VEGF signaling in non-neoplastic barrett’s cells. Gastroenterology. 2019;156(1):130–144. doi:10.1053/j.gastro.2018.09.046
50. Zhang Q, Yu C, Peng S, et al. Autocrine VEGF signaling promotes proliferation of neoplastic barrett’s epithelial cells through a PLC-dependent pathway. Gastroenterology. 2014;146(2):461–472.e466. doi:10.1053/j.gastro.2013.10.011
 © 2021 The Author(s). This work is published and licensed by Dove Medical Press Limited. The
full terms of this license are available at https://www.dovepress.com/terms
and incorporate the Creative Commons Attribution
- Non Commercial (unported, 3.0) License.
By accessing the work you hereby accept the Terms. Non-commercial uses of the work are permitted
without any further permission from Dove Medical Press Limited, provided the work is properly
attributed. For permission for commercial use of this work, please see paragraphs 4.2 and 5 of our Terms.
© 2021 The Author(s). This work is published and licensed by Dove Medical Press Limited. The
full terms of this license are available at https://www.dovepress.com/terms
and incorporate the Creative Commons Attribution
- Non Commercial (unported, 3.0) License.
By accessing the work you hereby accept the Terms. Non-commercial uses of the work are permitted
without any further permission from Dove Medical Press Limited, provided the work is properly
attributed. For permission for commercial use of this work, please see paragraphs 4.2 and 5 of our Terms.