")
Back to Journals » Cancer Management and Research » Volume 13
Identification of the Hub Genes Associated with the Prognosis of Ovarian Cancer Patients via Integrated Bioinformatics Analysis and Experimental Validation
Authors Zhao Y, Pi J, Liu L, Yan W, Ma S, Hong L
Received 29 September 2020
Accepted for publication 4 December 2020
Published 26 January 2021 Volume 2021:13 Pages 707—721
DOI https://doi.org/10.2147/CMAR.S282529
Checked for plagiarism Yes
Review by Single anonymous peer review
Peer reviewer comments 2
Editor who approved publication: Dr Antonella D'Anneo
Yuzi Zhao,1 Jie Pi,1 Lihua Liu,2 Wenjie Yan,1 Shufang Ma,3 Li Hong1
1Department of Gynaecology and Obstetrics, Renmin Hospital of Wuhan University, Wuhan, People’s Republic of China; 2Department of Gynaecology and Obstetrics, Huanggang Huangzhou Maternity and Child Health Care Hospital, Huanggang, People’s Republic of China; 3Reproductive Medicine Center, Wuhan Kangjian Women and Infants Hospital, Wuhan, People’s Republic of China
Correspondence: Li Hong
Renmin Hospital of Wuhan University, 238 Jiefang Road, Wuchang District, Wuhan, Hubei 430060, People’s Republic of China
Tel +86-13476814853
Email [email protected]
Background: This study aimed to identify the hub genes associated with prognosis of patients with ovarian cancer by using integrated bioinformatics analysis and experimental validation.
Methods: Four microarray datasets (GSE12470, GSE14407, GSE18521 and GSE46169) were analyzed by the GEO2R tool to screen common differentially expressed genes (DEGs). Gene Ontology, the Kyoto Encyclopedia of Genes and Genomes, the (KEGG) pathway and Reactome pathway enrichment analysis, protein–protein interaction (PPI) construction, and the identification of hub genes were performed. Furthermore, we performed the survival and expression analysis of the hub genes. In vitro functional assays were performed to assess the effects of hub genes on ovarian cancer cell proliferation, caspase-3/7 activity and invasion.
Results: A total of 89 common DEGs were identified among these four datasets. The KEGG and Reactome pathway results showed that the DEGs were mainly associated with cell cycle, mitotic and p53 signaling pathway. A total of 20 hub genes were identified from the PPI network by using sub-module analysis. The survival analysis revealed that high expression of six hub genes (AURKA, BUB1B, CENPF, KIF11, KIF23 and TOP2A) were significantly correlated with shorter overall survival and progression-free survival of patients with ovarian cancer. Furthermore, the expression of the six hub genes were validated by the GEPIA database and Human Protein Atlas, and functional studies revealed that knockdown of KIF11 and KIF23 suppressed the SKOV3 cell proliferation, increased caspase-3/7 activity and attenuated invasive potentials of SKOV3 cells. In addition, knockdown of KIF11 and KIF23 up-regulated E-cadherin mRNA expression but down-regulated N-cadherin and vimentin mRNA expression in SKOV3 cells.
Conclusion: Our results showed that six hub genes were up-regulated in ovarian cancer tissues and may predict poor prognosis of patients with ovarian cancer. KIF11 and KIF23 may play oncogenic roles in ovarian cancer cell progression via promoting ovarian cancer cell proliferation and invasion.
Keywords: ovarian cancer, bioinformatics, cell cycle, hub genes, survival, prognosis
Introduction
Ovarian cancer is one of the most common gynaecological malignancies, and is one of the major causes of gynaecological cancer-related mortality worldwide.1,2 It is estimated that there were about 250,000 new cases and 160,000 deaths in 2018.3 Various risk factors including a family history of ovarian cancer or breast cancer, overweight, smoking, earlier menstruation or later menopause and not giving birth have been suggested to contribute to the development of ovarian cancer.4 The main treatment regimens for ovarian cancer are mainly surgical resection and chemotherapy. However, more than 50% of ovarian cancer cases are diagnosed at a late stage, as the effective diagnosis for ovarian cancer is still limited.5 Thus, the overall survival (OS) of patients with ovarian cancer is less than 40%.5 Therefore, it is of great importance to identify and understand novel biomarkers and therapeutic targets for ovarian cancer, which is essential for us to improve the diagnosis and treatment of ovarian cancer.
High throughput technologies have been developed to identify novel biomarkers and therapeutic targets in different types of cancers including ovarian cancer.6–8 Winterhoff et al, used the single cell sequencing and demonstrated the heterogeneity within ovarian cancer epithelium and cancer-related stromal cells.9 Zhang et al, performed next-generation sequencing-based genomic profiling analysis and identified novel mutations for clinical diagnosis in Chinese primary epithelial ovarian cancer patients.10 Recently, publicly available gene profiles and gene chips have been commonly employed to identify differentially expressed genes (DEGs) in cancer studies by using bioinformatics analysis. Zhang et al, analyzed the datasets of GSE53012 and identified the hypoxia networks related to ovarian cancer progression via bioinformatics analysis.11 In addition, various studies have analyzed the Gene Expression Omnibus (GEO) datasets and identified hub genes associated with the prognosis of ovarian cancer.12–14 Based on the above evidence, re-analysis of GEO datasets by using bioinformatics tools can assist us to explore the biomarkers and mechanisms underlying the ovarian cancer progression and provide novel insights into the current research in ovarian cancer.
In this study, we performed bioinformatics analysis in four GEO datasets including GSE12470, GSE14407, GSE18521 and GSE46169. The common DEGs among these datasets were first screened. Subsequently, integrated bioinformatics analyses including Gene Ontology (GO) term analysis, Kyoto Encyclopedia of Genes and Genomes (KEGG) pathway and Reactome pathway enrichment analysis, protein–protein interaction (PPI) construction, and the identification of hub genes were performed. Furthermore, we performed the survival and expression analysis of the hub genes. Finally, in vitro functional assays were performed to assess the effects of hub genes on ovarian cancer cell proliferation, caspase-3/7 activity and invasion. The workflow of the present study is presented in Figure 1.
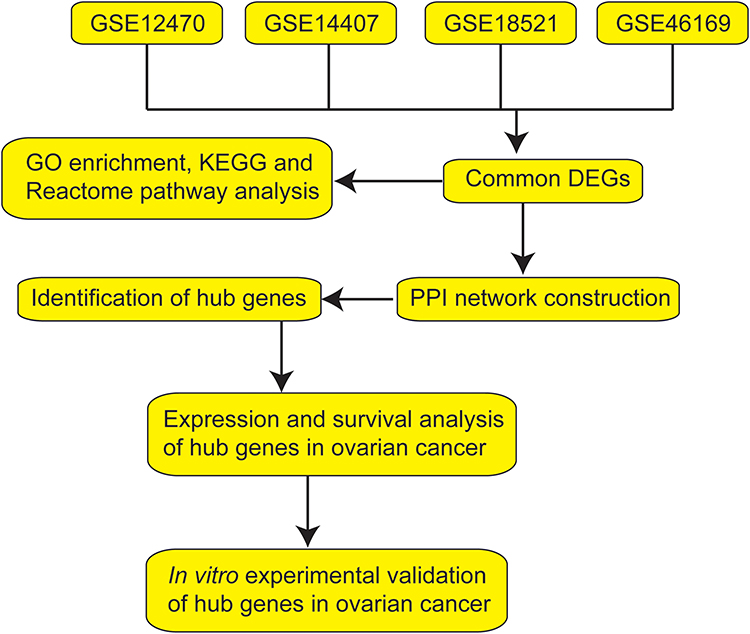 |
Figure 1 Workflow of the bioinformatics analysis. |
Materials and Methods
Collection of Data
The microarray datasets were downloaded from the GEO database, which is public repository for data storage. A total of four datasets including GSE12470, GSE14407, GSE18521 and GSE46169 were downloaded and processed for analysis. The details of the collected datasets are presented in Table 1.
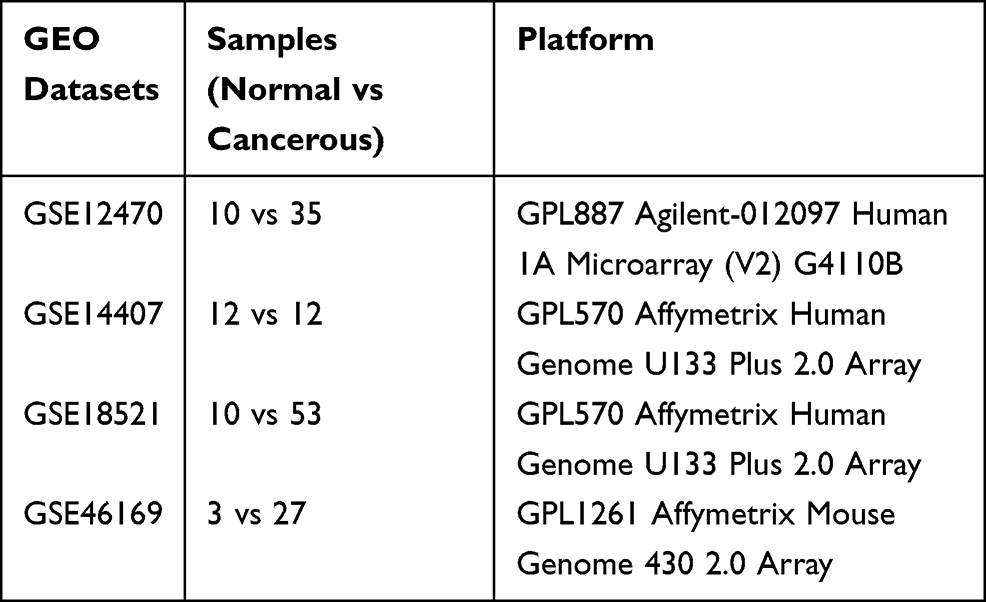 |
Table 1 Information of the Selected GEO Datasets |
Data Processing
The GEO2R tool (http://www.ncbi.nlm.nih.gov/geo/geo2r/) was used to identify the DEGs between normal ovarian tissues and ovarian cancer tissues in the collected datasets. GEO2R is an online interactive tool that compares two groups of samples in the same dataset. The adjusted P-values (adj. P) were applied to correct for the occurrence of false positive results using Benjamini and Hochberg false discovery rate method by default. The |logFC| > 1.5 and adj. P < 0.05 were set as the cut-off criteria.
Functional and Pathway Enrichment Analysis
The GO, KEGG pathway and Reactome pathway enrichment analysis was performed using the g: profiler, which is an online program that provides a comprehensive set of functional annotation tools for researchers to understand biological meaning behind plenty of genes.15 P < 0.05 was set as the cut-off criteria.
PPI Network Construction and Identification of Hub Genes
The Search Tool for Retrieval of Interacting Genes (STRING, http://string.embl.de/) database was used to construct the protein–protein interaction (PPI) network of DEGs and subsequently was visualized using Cytoscape software with confidence score ≥ 0.7 being set as the cut-off criteria. Molecular Complex Detection (MCODE; degree cutoff = 2, node score cutoff = 0.2, k-core = 2, and max. depth = 100) and CytoHubba16 were performed to screen sub-modules of PPI network and the potential hub genes.
Survival Analysis of Hub Genes
The survival analysis of DEGs in ovarian cancer patients was performed using Kaplan–Meier plotter (KM plotter, www.kmplot.com), which can assess the effect of 54,675 genes on survival using 10,188 cancer samples, including 4,142 breast, 1,648 ovarian, 2,437 lung, and 1,065 gastric cancer patients.17 The patients with ovarian cancer were split into two groups according to the expression of a particular gene (high vs low expression). The hazard ratio (HR) with 95% confidence intervals and log rank P-value were calculated and displayed on the webpage.
Expression Analysis of Hub Genes
The gene expressions of the hub genes were validated using the Gene Expression Profiling Interactive Analysis (GEPIA),18 which is based on 9,736 tumors and from the cancer genomic map [The Cancer Genome Atlas (TCGA)] and genotype-tissue expression. The protein expression of the hub genes in the tissues samples were further validated in the Human Protein Atlas (http://www.proteinatlas.org/).
Cell Culture and Cell Transfection
Human ovarian cancer cell line (SKOV3) was purchased from ATCC (Manassas, USA) and the cells were cultured with RPMI-1640 medium (Gibco, Waltham, USA) containing 10% fetal bovine serum (FBS; Gibco) and 100 U/mL penicillin and 100 μg/mL streptomycin. The SKOV3 cells were maintained in a humidified incubator supplied with 5% CO2 at 37°C. Two siRNAs for KIF11 (siKIF11(i) and siKIF11(ii)) and KIF23 (siKIF23(i) and siKIF23(ii)) as well as the scrambled negative control (NC) siRNAs (siNC) were purchased from Ribobio (Guangzhou, People's Republic of China). For the cell transfection, the SKOV3 cells were plated on the 6-well plates, and when the cells reached ~80–90% confluence, the siRNAs were transfected by using the Lipofectamine 2000 reagent (Invitrogen, Carlsbad, USA) according to the manufacturer’s protocol. At 24 hours after transfection, the SKOV3 cells were collected for in vitro functional assays.
Quantitative Real-Time PCR (qRT-PCR) Assay
Total RNA was isolated from cells using TRIzol reagent (Invitrogen) according to a standard protocol. The reverse transcription products of total RNA were obtained by using the Prime-Script RT reagent kit (Takara, Dalian, People's Republic of China). The real-time PCR was performed on an ABI 7900 real-time PCR system (Applied Biosystems, Foster City, USA) using SYBR Real-time PCR Master Mix kit (Takara). Data generated by qRT-PCR were analyzed by the 2−ΔΔCt method, and GAPDH was used as the internal control normalizing the expression of detected genes.
Cell Counting-8 Kit (CCK-8) Assay
The SKOV3 cell proliferative potential was evaluated by the CCK-8 assay (Beyotime, Beijing, People's Republic of China). Briefly, the transfected SKOV3 cells were incubated with the CCK-8 solution at the indicated time. After that, the cell proliferative potential was assessed by measuring optical density (OD) values at 450 nm.
Caspase-3/7 Activity Assay
The caspase-3/7 activity of the SKOV3 cells was determined by Caspase-Glo 3/7 assay (Promega, Madison, USA). Briefly, cells with different treatments were seeded in 96-well plates and cultured for 24 hours. After that, the cells were incubated with 100 µL of Caspase-Glo 3/7 reagent for 3 hours at room temperature. The caspase-3/7 activity was determined by measuring the luminescence.
Transwell Invasion Assay
The invasive potential of SKOV3 cells was determined by using the Transwell invasion assay. Briefly, the transfected SKOV3 cells were seeded onto the upper chamber (Matrigel-coated inserts with 8 µm pore size, Merck Millipore, Burlington, USA). The upper chamber was filled with RPMI-1640 medium without FBS, and the lower chamber was filled with 10% FBS-RPMI-1640 medium. After culturing for 24 hours, the SKOV3 cells invaded into the lower surface of the inserts were stained with gentian violet (Beyotime), and the stained invading cells were counted using a light microscope.
Statistical Analysis
All the data from the in vitro functional studies is presented as mean ± standard deviation. The data was processed using the GraphPad Prism Software (Version 6.0, GraphPad Software, La Jolla, USA). Significant differences among the different groups was determined by one-way analysis of variance followed with Bonferroni’s post hoc test. P < 0.05 was considered to statistically significant.
Results
Screening of the DEGs Among GSE12470, GSE14407, GSE18521 and GSE46169
The DEGs were analyzed using the GO2R tool, and the DEGs were presented using volcano plots. The volcano plots for the respective GEO datasets are presented in Figure 2A–D. A total of 2,241, 2,343, 2,383 and 3,617 genes were identified in the GSE12470 (1,491 up-regulated and 750 down-regulated), GSE14407 (1,042 up-regulated and 1,301 down-regulated), GSE18521 (1,264 up-regulated and 1,119 down-regulated) and GSE46169 (2,321 up-regulated and 1,296 down-regulated), respectively. The Venn diagram illustrated the common up-regulated and down-regulated DEGs among these datasets (Figure 2E and F). A total of 89 common DEGs with 56 up-regulated genes and 33 down-regulated genes were identified among these datasets.
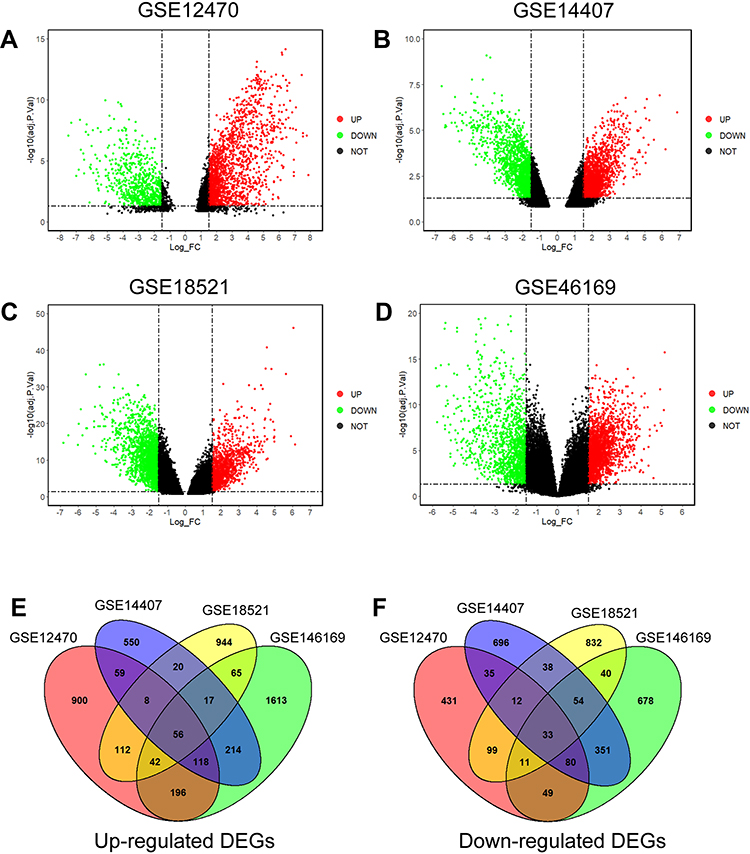 |
Figure 2 Identification of common DEGs in the GSE12470, GSE14407, GSE18521 and GSE46169. Volcano plots of DEGs in GSE12470 (A), GSE14407 (B), GSE18521 (C) and GSE46169 (D) are shown. (E) Venn diagram shows the common up-regulated DEGs in the datasets. (F) Venn diagram shows the common down-regulated DEGs in the datasets. Abbreviations: Adj.P.val, adjusted P-values; UP, up-regulated genes; DOWN, down-regulated genes; NOT, genes without significant changes; FC, fold change. |
GO, KEGG and Reactome Pathway Enrichment Analysis
The common DEGs among these datasets were firstly evaluated by the GO enrichment analysis. As shown in Figure 3A, the DEGs were significantly enriched in “spindle pole,” “spindle microtubule,” “spindle” and “nuclear chromosome” in the cellular component category. In the biological process category, the DEGs were significantly enriched in “sister chromatid segregation,” “regulation of cell cycle process,” “regulation of cell cycle,” “organelle fission” and so on (Figure 3B). In the molecular function category, the DEGs were markedly enriched in “protein binding,” “histone kinase activity,” “tubulin binding,” “carbohydrate derivative binding” and so on (Figure 3C). The analysis of KEGG pathway showed that the DEGs were mainly enriched in the pathways including “progesterone-mediated oocyte maturation,” “P53 signaling pathway,” “oocyte meiosis,” “cellular senescence” and “cell cycle” (Figure 3D). Furthermore, the Reactome pathway revealed that DEGs were significantly enriched in the pathways including “cell cycle,“ “mitotic cell cycle,” “ regulation of mitotic cell cycle,” “APC/C-mediated degradation of cell cycle proteins” and so on (Figure 3E).
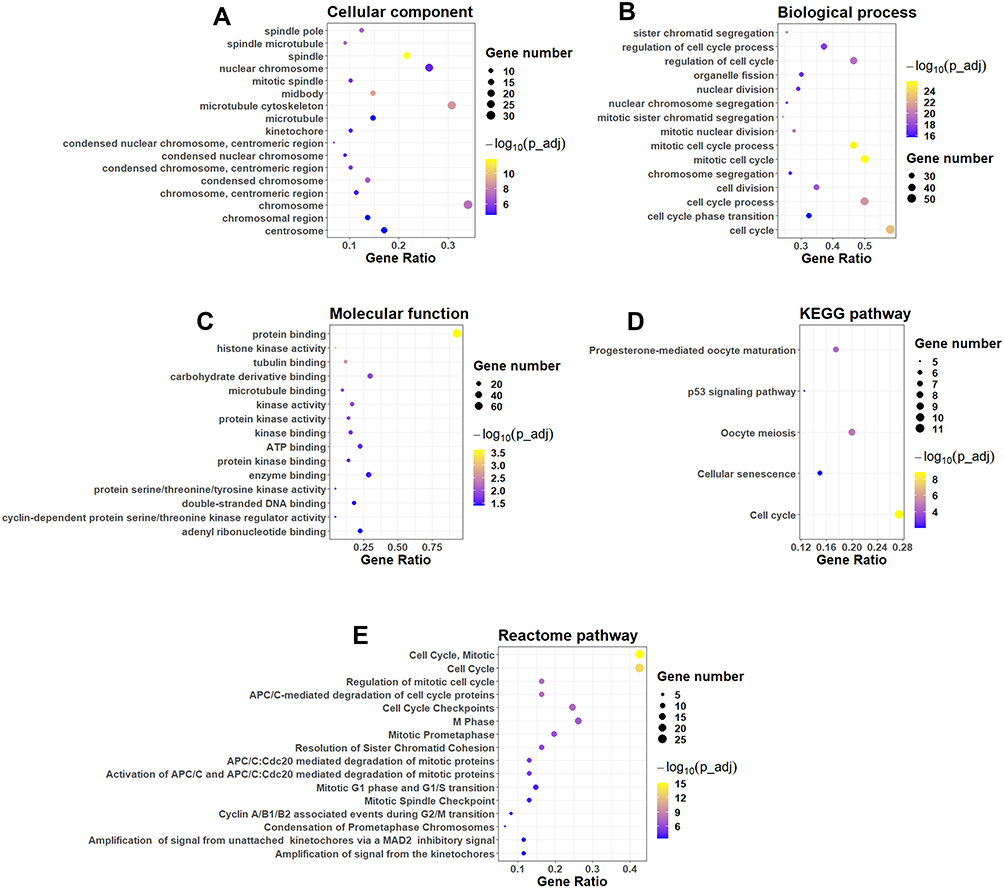 |
Figure 3 Functional and pathway enrichment analysis. GO enrichment analysis of common DEGs: (A) cellular component, (B) biological process and (C) molecular function. (D) KEGG pathway enrichment analysis of common DEGs. (E) Reactome pathway enrichment analysis of common DEGs. |
PPI Network Construction and Hub Genes Identification
The STRING database was used to construct the PPI network of the DEGs. The constructed network was illustrated in Figure 4A and B, and there are 89 nodes and 768 edges in the PPI network. Furthermore, the PPI network was further analyzed by using MCODE and CytoHubba to identify key sub-modules in the PPI network. Based on the MCODE analysis, a network with 30 nodes was identified (Figure 5A); by using the CytoHubba module, the top 20 genes with the highest scores were identified from the PPI network (Figure 5B). Thus, the genes that were identified both in MCODE and Cytohubba analysis were defined by hub genes, and a total of 20 hub genes were identified and chosen for survival analysis.
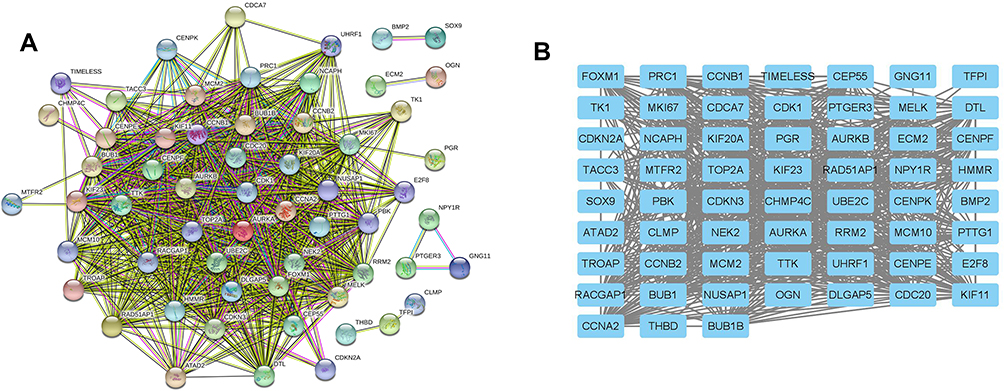 |
Figure 4 Construction of PPI network of common DEGs. (A) PPI network constructed using STRING database. (B) The interactions among different genes are further presented using Cytoscape software. |
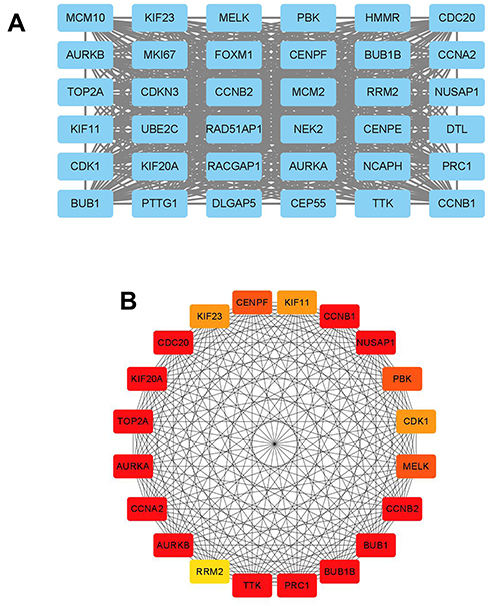 |
Figure 5 Sub-module analysis of PPI network. (A) Sub-module network analyzed by MCODE. (B) Sub-module network analyzed by cytoHubba, and top 20 genes are shown. |
Survival Analysis of Hub Genes in Patients with Ovarian Cancer
The prognostic role of hub genes in ovarian cancer was analyzed by the online database (http://kmplot.com/analysis/index.php?p=serviceandcancer=ovar). As shown in Figure 6, a total of 1,656 ovarian cancer patients were included in the overall survival (OS) analysis. Among these hub genes, high expression of AURKA (Figure 6A), BUB1 (Figure 6B), BUB1B (Figure 6C), CENPF (Figure 6D), KIF11 (Figure 6E), KIF23 (Figure 6F) and TOP2A (Figure 6G) was significantly correlated with shorter OS of the patients with ovarian cancer; whereas the other hub genes had no significant correlation with OS of the patients with ovarian cancer (data not shown). As shown in Figure 7A, a total of 1,435 patients with ovarian cancer were included in progression-free survival (PFS) analysis. Among these hub genes, high expression of AURKA (Figure 7A), BUB1B (Figure 7B), CENPF (Figure 7C), KIF11 (Figure 7D), KIF23 (Figure 7E) and TOP2A (Figure 7F) was significantly correlated with shorter PFS of patients with ovarian cancer; whereas the other hub genes were not significantly correlated with PFS of patients with ovarian cancer (data not shown).
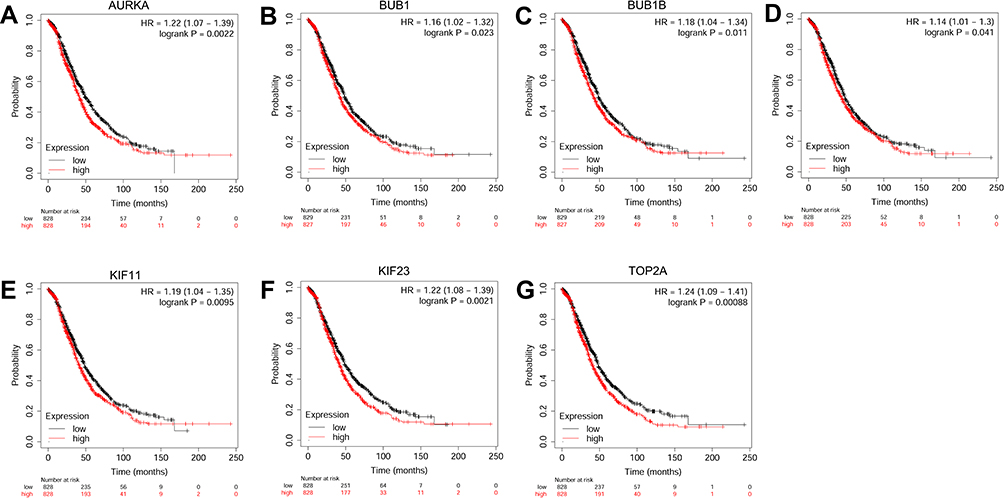 |
Figure 6 The correlation analysis between hub genes and OS of patients with ovarian cancer. The association between the expression levels of AURKA (A), BUB1 (B), BUB1B (C), CENPF (D), KIF11 (E), KIF23 (F) and TOP2A (G) and the OS of patients with ovarian cancer was analyzed by KM plotter (www.kmplot.com). Abbreviation: HR, hazard ratio. |
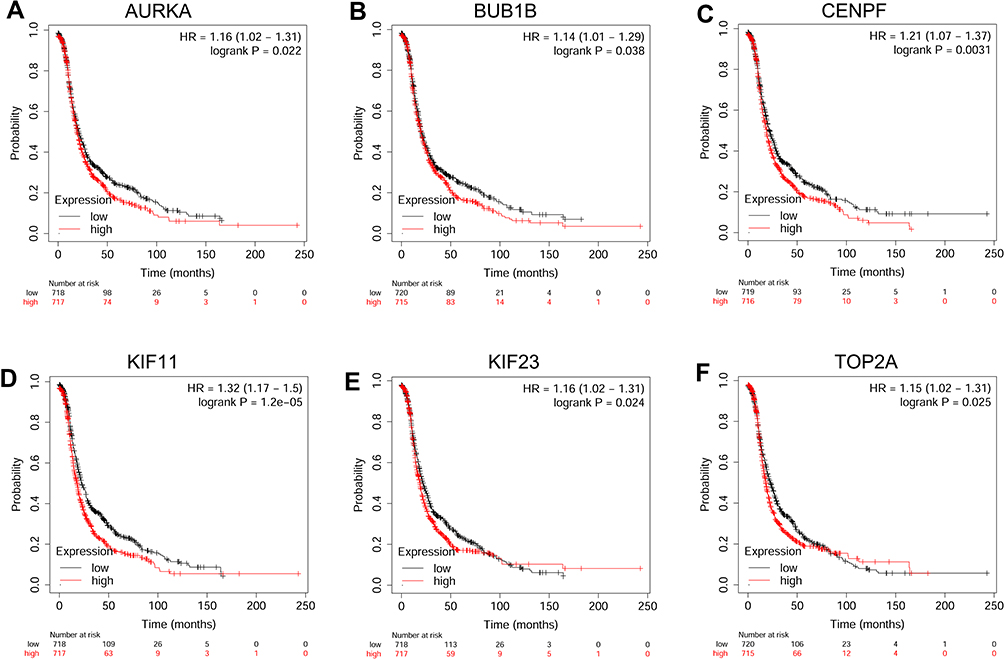 |
Figure 7 The correlation analysis between hub genes and PFS of patients with ovarian cancer. The association between the expression levels of AURKA (A), BUB1B (B), CENPF (C), KIF11 (D), KIF23 (E) and TOP2A (F) and the PFS of patients with ovarian cancer was analyzed by KM plotter (www.kmplot.com). Abbreviation: HR, hazard ratio. |
Expression Analysis of Hub Genes Associated with Prognosis of Patients with Ovarian Cancer
Based on the OS and PFS analysis, six hub genes including AURKA, BUB1B, CENPF, KIF11, KIF23 and TOP2A had prognostic potential in patients with ovarian cancer, and the expression of these six hub genes in the ovarian tissues and normal ovarian tissues were analyzed by GEPIA. As shown in Figure 8A, a total of 426 ovarian cancer tissues and 88 normal ovarian tissues were included in the expression analysis, and the expression levels of AURKA (Figure 8A), BUB1B (Figure 8B), CENPF (Figure 8C), KIF11 (Figure 8D), KIF23 (Figure 8E) and TOP2A (Figure 8F) were significantly higher in the ovarian tissues than in the normal ovarian tissues. Furthermore, the protein expression of hub genes including AURKA (Figure 9A), CENPF (Figure 9B), KIF11 (Figure 9C), KIF23 (Figure 9D) and TOP2A (Figure 9E) was analyzed by using the Human Protein Atlas, and the protein expression levels of these genes were significantly higher in the ovarian cancer tissues than that in the normal ovarian tissues.
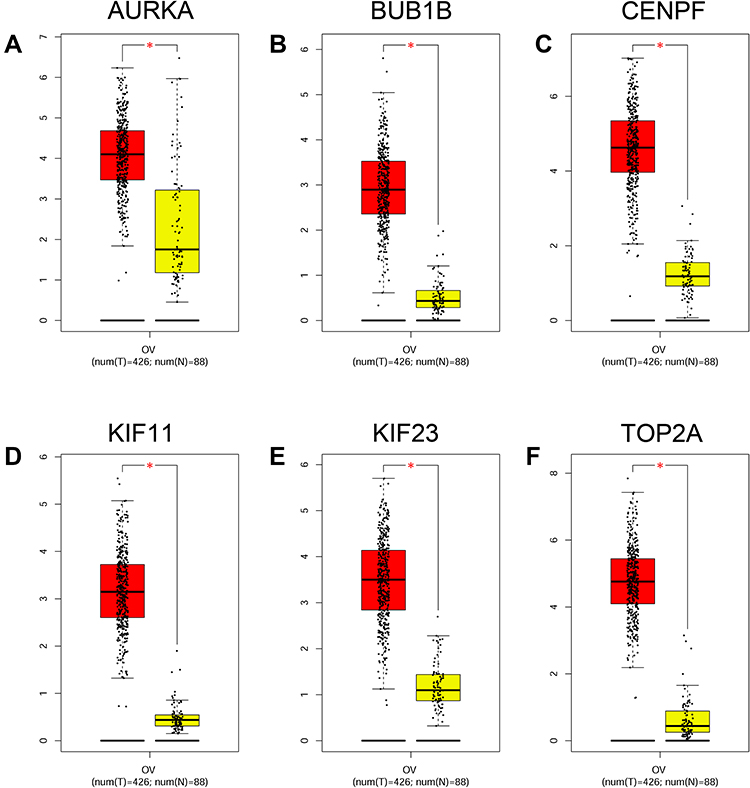 |
Figure 8 Expression analysis of hub genes. The expression levels of AURKA (A), BUB1B (B), CENPF (C), KIF11 (D), KIF23 (E) and TOP2A (F) in ovarian cancer tissues and normal ovarian tissues were analyzed by GEPIA tool. *P < 0.05. Abbreviations: OV, ovarian cancer; num (T), number of tumor tissues; num (N), number of normal tissues. |
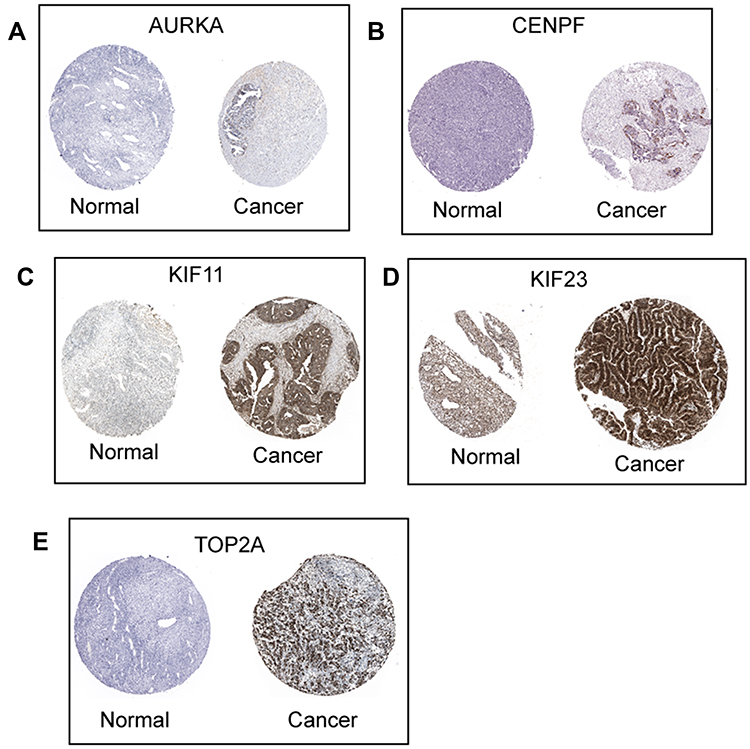 |
Figure 9 Protein expression of hub genes. The protein expression of AURKA (A), CENPF (B), KIF11 (C), KIF23 (D) and TOP2A (E) in ovarian cancer tissues and normal ovarian tissues were extracted from the Human Protein Atlas (http://www.proteinatlas.org/). |
Effects of KIF11 and KIF23 Knockdown on the Proliferation, Caspase-3/7 Activity and Invasion of Ovarian Cancer Cells
Among the six hub genes, the role of AURKA, BUB1B, CENPF and TOP2A in ovarian cancer has been well-documented in various reports;19–26 however, the role of KIF11 and KIF23 in ovarian cancer is less understood. In this regard, we further validated the biological functions of two hub genes KIF11 and KIF23 in the SKOV3 ovarian cancer cell line. As shown in Figure 10, the transfection of siRNAs respectively targeting KIF11 and KIF23 significantly down-regulated the expression of KIF11 and KIF23 in SKOV3 cells (Figure 10A and B). The CCK-8 assay showed that silence of KIF11 and KIF23 both significantly repressed the SKOV3 cell proliferation (Figure 10C and D). Furthermore, the knockdown of KIF11 and KIF23 both significantly increased the caspase-3/7 activity of SKOV3 cells (Figure 10E and F). Consistently, transwell invasion assay revealed that silence of KIF11 and KIF23 remarkably suppressed the invasive potential of SKOV3 cells (Figure 10G and H). In order to further explore the KIF11- and KIF23-mediated SKOV3 cell invasion, we examined the epithelial-mesenchymal transition (EMT)-related biomarkers, and the results showed that the silence of KIF11 and KIF23 both remarkably up-regulated the mRNA expression of E-cadherin, but down-regulated the mRNA expression of N-cadherin and vimentin in SKVO3 cells (Figure 10I and J)
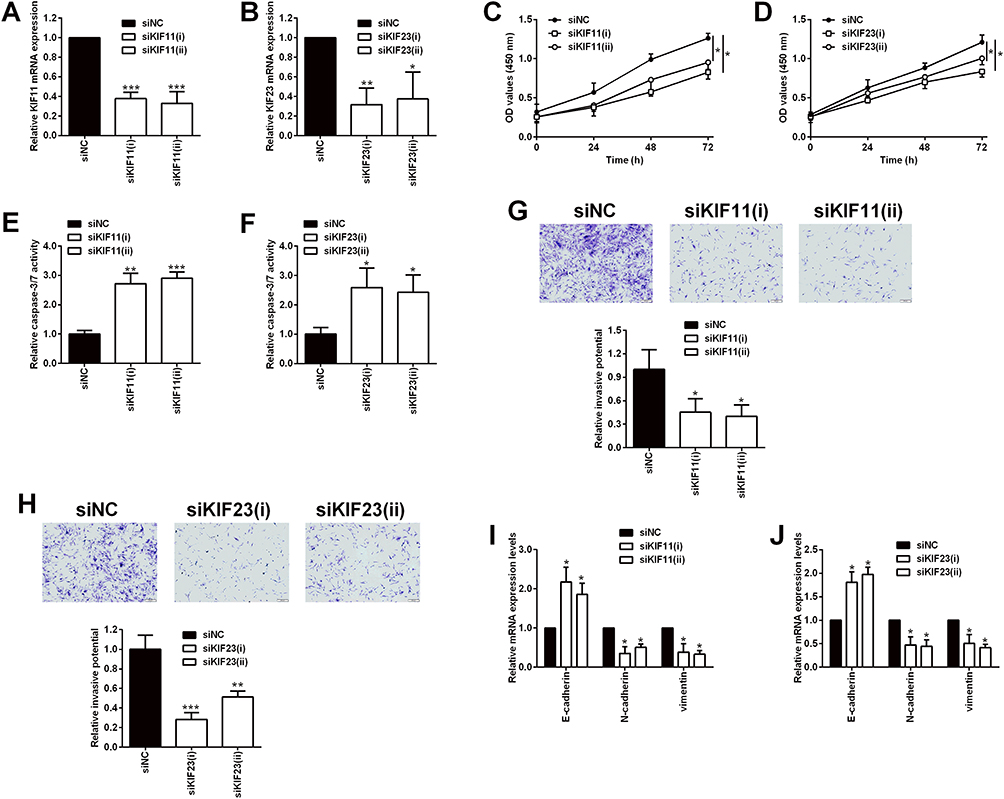 |
Figure 10 Effects of KIF11 and KIF23 knockdown on the proliferation and invasion of ovarian cancer cells. (A) KIF11 and (B) KIF23 mRNA expression levels in SKOV3 cells being transfected with siRNAs for KIF11 (siKIF11(i) and siKIF11(ii)) and the scrambled siRNA (siNC) were determined by qRT-PCR. (C) The proliferation of SKOV3 cells after being transfected with siNC, siKIF11(i) and siKIF11(ii) was determined by CCK-8 assay. (D) The proliferation of SKOV3 cells after being transfected with siNC, siKIF23(i) and siKIF23(ii) was determined by CCK-8 assay. (E) The caspase-3/7 activity of SKOV3 cells after being transfected with siNC, siKIF11(i) and siKIF11(ii) was determined by the caspase-3/7 activity assay kit. (F) The caspase-3/7 activity of SKOV3 cells after being transfected with siNC, siKIF23(i) and siKIF23(ii) was determined by the caspase-3/7 activity assay kit. (G) The invasion of SKOV3 cells after being transfected with siNC, siKIF11(i) and siKIF11(ii) was determined by transwell invasion assay. (H) The invasion of SKOV3 cells after being transfected with siNC, siKIF23(i) and siKIF23(ii) was determined by transwell invasion assay. (I) The mRNA expression levels of E-cadherin, N-cadherin and vimentin in SKOV3 cells after being transfected with siNC, siKIF11(i) and siKIF11(ii) were determined by qRT-PCR. (J) The mRNA expression levels of E-cadherin, N-cadherin and vimentin in SKOV3 cells after being transfected with siNC, siKIF23(i) and siKIF23(ii) were determined by qRT-PCR. siNC = scrambled negative control siRNA, siKIF11 = KIF11 siRNA, siKIF23 = KIF23 siRNA. N = 3; *P < 0.05, **P < 0.01 and ***P < 0.001 compared to the siNC group. |
Discussion
Although great efforts have been invested in the management of ovarian cancer, the prognosis of ovarian cancer patients is still poor.4 Thus, it is necessary to identify novel biomarkers and detailed mechanisms for early diagnosis, treatment and prognosis of ovarian cancer. Recently, with the progress in bioinformatics analysis, analysis of microarray and sequencing data has been regarded as a useful strategy for investigating general genetic alterations and deciphering the pathophysiology of ovarian cancer. In our study, we screened the DEGs from four GEO datasets (GSE12470, GSE14407, GSE18521 and GSE46169) and identified 89 DEGs including 56 up-regulated and 33 down-regulated DEGs. Furthermore, GO, KEGG and Reactome pathway of the DEGs were performed by g: Prolifer. The KEGG and Reactome pathway results showed that the DEGs were mainly associated with cell cycle, mitotic and p53 signaling pathway. These results provided insightful clues to examine the molecular interactions in the pathophysiology of ovarian cancer. Furthermore, the PPI network with 89 nodes and 768 edges was constructed and 20 hub genes were identified from the PPI network by using sub-module analysis. The survival analysis revealed that high expression of six hub genes (AURKA, BUB1B, CENPF, KIF11, KIF23 and TOP2A) were significantly correlated with shorter OS and PFS of patients with ovarian cancer. Furthermore, the expression of the six hub genes were validated by the GEPIA database and the Human Protein Atlas, and the results were consistent with those from GEO datasets. In summary, the dysregulation of these hub genes has been associated with the tumorigenesis and progression of ovarian cancer.
AURKA is mainly located in the centrosomes and mitotic spindles and plays a key role in mediating mitotic progression and chromosomal stability.27 AURKA is overexpressed in various types of cancers, leading to acquisition of alternate non-mitotic functions.27 In ovarian cancer, AURKA can promote epithelial ovarian cancer cell migration and adhesion.28 Mechanistically, AURKA can promote ovarian malignant transformation by regulating telomerase activity via c-Myc.29 Yang et al also demonstrated that AURKA promoted ovarian tumorigenesis via dysregulation of the cell cycle and suppression of BRCA2.30 In clinical settings, AURKA overexpression is detected in the majority of late stage epithelial ovarian cancers, most likely due to increased AURKA DNA copy numbers and/or chromosome 20 aneusomy,31 and AURKA expression correlates with poor prognosis of patients with ovarian cancer.32 AURKA expression predicts platinum-resistance and adverse outcome in high-grade serous ovarian carcinoma patients.33 Consistently, our results showed that AURKA was up-regulated in ovarian cancer tissues, and high expression of AURKA was correlated with poor prognosis of patients with ovarian cancer, suggesting the good reliability of the bioinformatics analysis using these datasets in our study.
BUB1B is the mammalian homolog of yeast Mad3, but differs significantly since Bub1B has a kinase domain that is absent in Mad3.34 Loss of BUB1B can cause embryonic death in the mouse germline.35 Down-regulation of BUB1B can induce massive chromosome loss and apoptotic cell death in human cancer cells.36 BUB1B has been identified as oncogenes in the various types of cancers including lung cancer,37 gastric cancer,38 bladder cancer,39 and prostate cancer.40 In ovarian cancer, the gene co-expression network reveals BUB1B is related to grade in serous ovarian cancers;41 bioinformatics analysis also revealed that BUB1B was up-regulated in the ovarian cancer tissues and was correlated with poor prognosis of patients with ovarian cancer.14,21 Consistently, our analysis also identified the up-regulation of BUB1B in ovarian tissues and high expression of BUB1B was correlated with poor prognosis of patients with ovarian cancer. However, the exact role of BUB1B in ovarian cancer still requires further examination.
CENPF was first discovered in the serum from patients with systemic diseases and is mainly located in the outer surface of the outer kinetochore plate.42 A growing amount of studies have shown the oncogenic role of CENPF in various types of cancers including breast cancer,43 prostate cancer,44 liver cancer,45 and so on. In ovarian cancer, Xu et al showed that high expression of CENPF in ovarian cancer tissues was associated with worse OS of patients with ovarian cancer by using bioinformatics analysis.46 AKT3-mediated effects in the ovarian cancer growth and metastasis is associated with CENPF.47 A recent study by Chong et al showed that deregulation of CENPF is associated with paclitaxel resistance in ovarian cancer.23 Consistently, our results showed that CENPF was up-regulated in the ovarian cancer tissues and high expression of CENPF was correlated with shorter OS and PFS of patients with ovarian cancer, suggesting that CENPF may be a prognostic biomarker in ovarian cancer.
TOP2A encodes DNA topoisomerase and plays a key role in regulating the topological state of DNA during transcription, replication, and repair.48 A growing amount of studies revealed that TOP2A is involved in carcinogenesis in different types of cancer including breast cancer, lung cancer, liver cancer and so on and high expression of TOP2A was associated with poor prognosis in these patients.49 In ovarian cancer, TOP2A promotes tumorigenesis of high-grade serous ovarian cancer by regulating the TGF-β/Smad pathway.50 The clinical data suggested that TOP2A status might predict activity of pegylated liposomal doxorubicin in patients with epithelial ovarian cancers.25 A study by Gulec et al showed that TOP2A expression was found to be related to poor OS of ovarian cancer patients, and was associated with platinum resistance.51 In combination with the above results, our study showed that TOP2A was up-regulated in ovarian cancer tissues and predicted poor prognosis in ovarian cancer patients.
KIF11 belongs to the kinesin family and plays an important role in centrosome separation in the mitotic spindle.52 KIF11 overexpression has been identified to promote the progression of different types of cancer such as lung cancer,53 breast cancer,54 glioblastoma,55 and so on. Inhibition of kinesin spindle proteins have been found to be effective in attenuating the progression of ovarian cancer.56 Shi et al showed that KIF11 was up-regulated in ovarian cancer tissues and KIF11 overexpression eliminated the suppression of ovarian cancer cell migration by death receptor 6 knockdown.57 Recent studies found that KIF11 was associated with the prognosis of patients with ovarian cancer by using bioinformatics analysis.58 In combination with the above evidence, our results suggested that high expression of KIF11 in ovarian tissues predicts poor prognosis of patients with ovarian cancer. KIF23 also belongs to the kinesin family and plays a key role in regulating cytokinesis. In ovarian cancer studies, Engqvist et al indicated that KIF23 may serve as a novel prognostic biomarker for early-stage clear-cell, endometrioid and mucinous ovarian carcinomas using immunohistochemistry.59 Mechanistic studies revealed that KIF23 that was targeted by miR-424/503 cluster promoted oncogenic performance of ovarian cancer cells in vitro.60 Collectively, our results suggested that the oncogenic role of KIF23 in ovarian cancer and KIF23 may be a poor prognostic biomarker in ovarian cancer. Consistently, our in vitro functional studies showed that KIF11 and KIF23 knockdown suppressed the proliferation of the SKOV3 cells, which may be associated with the enhanced SKOV3 cell apoptosis, as KIF11 and KIF23 knockdown increased the caspase-3/7 activity of SKOV3 cells. Furthermore, KIF11 and KIF23 suppressed the invasion of SKOV3 cells, which may be associated with the attenuated EMT of SKOV3 cells, as the E-cadherin mRNA expression was up-regulated, and the N-cadherin and vimentin mRNA expression was down-regulated in SKOV3 cells with KIF11 and KIF23 knockdown. Collectively, these results suggest that KIF11 and KIF23 may exert enhancing effects on ovarian cancer progression.
This study has several limitations. Firstly, only one dataset in the four had prognostic information in our study, and further studies should analyze more datasets with prognostic information to fully address the importance of the hub genes in ovarian cancer prognosis. Secondly, the present study examined the effects of KIF11 and KIF23 knockdown on ovarian cancer proliferation and invasion, and further studies may examine the role of KIF11 and KIF23 on the stemness and chemo-sensitivity of the ovarian cancer cells. Thirdly, the regulatory mechanisms of KIF11 and KIF23 in ovarian cancer are still largely unknown, and future studies should consider investigating the up-stream and down-stream targets/signaling pathways to fully address the biological actions of KIF11 and KIF23 in ovarian cancer.
In summary, a total of 89 DEGs including 56 upregulated DEGs and 33 downregulated genes in ovarian cancer were identified by using integrated bioinformatic analysis, and six hub genes namely AURKA, BUB1B, CENPF, KIF11, KIF23 and TOP2A were up-regulated in ovarian cancer tissues and may predict poor prognosis of patients with ovarian cancer. KIF11 and KIF23 may play oncogenic roles in ovarian cancer cell progression via promoting ovarian cancer cell proliferation and invasion. Future studies are required to determine mechanistic actions of these hub genes in ovarian cancer.
Disclosure
The authors report no conflicts of interest for this work.
References
1. Kahn LG, Philippat C, Nakayama SF, Slama R, Trasande L. Endocrine-disrupting chemicals: implications for human health. Lancet Diabetes Endocrinol. 2020;8(8):703–718. doi:10.1016/S2213-8587(20)30129-7
2. Sessa C, Schneider DT, Planchamp F, et al. ESGO-SIOPE guidelines for the management of adolescents and young adults with non-epithelial ovarian cancers. Lancet Oncol. 2020;21(7):e360–e368. doi:10.1016/S1470-2045(20)30091-7
3. Lheureux S, Gourley C, Vergote I, Oza AM. Epithelial ovarian cancer. Lancet. 2019;393(10177):1240–1253. doi:10.1016/S0140-6736(18)32552-2
4. Jayson GC, Kohn EC, Kitchener HC, Ledermann JA. Ovarian cancer. Lancet. 2014;384(9951):1376–1388. doi:10.1016/S0140-6736(13)62146-7
5. Rojas V, Hirshfield KM, Ganesan S, Rodriguez-Rodriguez L. Molecular characterization of epithelial ovarian cancer: implications for diagnosis and treatment. Int J Mol Sci. 2016;17:12. doi:10.3390/ijms17122113
6. Deo A, Mukherjee S, Rekhi B, Ray P. Subtype specific biomarkers associated with chemoresistance in epithelial ovarian cancer. Indian J Pathol Microbiol. 2020;63(Supplement):S64–s69. doi:10.4103/IJPM.IJPM_872_19
7. Yang H, Cui W, Wang L. Epigenetic synthetic lethality approaches in cancer therapy. Clin Epigenetics. 2019;11(1):136. doi:10.1186/s13148-019-0734-x
8. Zelli V, Compagnoni C, Cannita K, et al. Applications of next generation sequencing to the analysis of familial breast/ovarian cancer. High-Throughput. 2020;9:1. doi:10.3390/ht9010001
9. Winterhoff BJ, Maile M, Mitra AK, et al. Single cell sequencing reveals heterogeneity within ovarian cancer epithelium and cancer associated stromal cells. Gynecol Oncol. 2017;144(3):598–606. doi:10.1016/j.ygyno.2017.01.015
10. Zhang L, Luo M, Yang H, Zhu S, Cheng X, Qing C. Next-generation sequencing-based genomic profiling analysis reveals novel mutations for clinical diagnosis in Chinese primary epithelial ovarian cancer patients. J Ovarian Res. 2019;12(1):19. doi:10.1186/s13048-019-0494-4
11. Zhang K, Kong X, Feng G, et al. Investigation of hypoxia networks in ovarian cancer via bioinformatics analysis. J Ovarian Res. 2018;11(1):16. doi:10.1186/s13048-018-0388-x
12. Li W, Liu Z, Liang B, et al. Identification of core genes in ovarian cancer by an integrative meta-analysis. J Ovarian Res. 2018;11(1):94. doi:10.1186/s13048-018-0467-z
13. Zhang L, Zhang X, Fan S, Zhang Z. Identification of modules and hub genes associated with platinum-based chemotherapy resistance and treatment response in ovarian cancer by weighted gene co-expression network analysis. Medicine. 2019;98(44):e17803. doi:10.1097/MD.0000000000017803
14. Yang D, He Y, Wu B, et al. Integrated bioinformatics analysis for the screening of hub genes and therapeutic drugs in ovarian cancer. J Ovarian Res. 2020;13(1):10. doi:10.1186/s13048-020-0613-2
15. Reimand J, Kull M, Peterson H, Hansen J, Vilo J. g: Profiler–aweb-based toolset for functional profiling of gene lists from large-scale experiments. Nucleic Acids Res. 2007;35(WebServer issue):W193–200. doi:10.1093/nar/gkm226
16. Chin CH, Chen SH, Wu HH, Ho CW, Ko MT, Lin CY. cytoHubba: identifying hub objects and sub-networks from complex interactome. BMC Syst Biol. 2014;8(Suppl 4):S11. doi:10.1186/1752-0509-8-S4-S11
17. Gyorffy B, Lánczky A, Szállási Z. Implementing an online tool for genome-wide validation of survival-associated biomarkers in ovarian-cancer using microarray data from 1287 patients. Endocr Relat Cancer. 2012;19(2):197–208. doi:10.1530/ERC-11-0329
18. Tang Z, Li C, Kang B, Gao G, Li C, Zhang Z. GEPIA: a web server for cancer and normal gene expression profiling and interactive analyses. Nucleic Acids Res. 2017;45(W1):W98–w102. doi:10.1093/nar/gkx247
19. Alcaraz-Sanabria A, Nieto-Jiménez C, Corrales-Sánchez V, et al. Synthetic lethality interaction between aurora kinases and chek1 inhibitors in ovarian cancer. Mol Cancer Ther. 2017;16(11):2552–2562. doi:10.1158/1535-7163.MCT-17-0223
20. Wang C, Yan Q, Hu M, Qin D, Feng Z. Effect of AURKA gene expression knockdown on angiogenesis and tumorigenesis of human ovarian cancer cell lines. Target Oncol. 2016;11(6):771–781. doi:10.1007/s11523-016-0436-7
21. Feng H, Gu ZY, Li Q, Liu QH, Yang XY, Zhang JJ. Identification of significant genes with poor prognosis in ovarian cancer via bioinformatical analysis. J Ovarian Res. 2019;12(1):35. doi:10.1186/s13048-019-0508-2
22. Zhang L, Sun L, Zhang B, Chen L. Identification of differentially expressed genes (DEGS) relevant to prognosis of ovarian cancer by use of integrated bioinformatics analysis and validation by immunohistochemistry assay. Medical Science Monitor. 2019;25:9902–9912. doi:10.12659/MSM.921661
23. Chong T, Sarac A, Yao CQ, et al. Deregulation of the spindle assembly checkpoint is associated with paclitaxel resistance in ovarian cancer. J Ovarian Res. 2018;11(1):27. doi:10.1186/s13048-018-0399-7
24. Kao GD, McKenna WG, Yen TJ. Detection of repair activity during the DNA damage-induced G2 delay in human cancer cells. Oncogene. 2001;20(27):3486–3496. doi:10.1038/sj.onc.1204445
25. Ghisoni E, Maggiorotto F, Borella F, et al. TOP2A as marker of response to pegylated lyposomal doxorubicin (PLD) in epithelial ovarian cancers. J Ovarian Res. 2019;12(1):17. doi:10.1186/s13048-019-0492-6
26. Zhang R, Xu J, Zhao J, Bai JH. Proliferation and invasion of colon cancer cells are suppressed by knockdown of TOP2A. J Cell Biochem. 2018;119(9):7256–7263. doi:10.1002/jcb.26916
27. Ma HT, Poon RYC. Aurora kinases and DNA damage response. Mutat Res. 2020;821:111716. doi:10.1016/j.mrfmmm.2020.111716
28. Do TV, Xiao F, Bickel LE, et al. Aurora kinase A mediates epithelial ovarian cancer cell migration and adhesion. Oncogene. 2014;33(5):539–549. doi:10.1038/onc.2012.632
29. Yang H, Ou CC, Feldman RI, Nicosia SV, Kruk PA, Cheng JQ. Aurora-A kinase regulates telomerase activity through c-Myc in human ovarian and breast epithelial cells. Cancer Res. 2004;64(2):463–467. doi:10.1158/0008-5472.CAN-03-2907
30. Yang G, Chang B, Yang F, et al. Aurora kinase A promotes ovarian tumorigenesis through dysregulation of the cell cycle and suppression of BRCA2. Clinical Cancer Res. 2010;16(12):3171–3181. doi:10.1158/1078-0432.CCR-09-3171
31. Lassmann S, Shen Y, Jütting U, et al. Predictive value of Aurora-A/STK15 expression for late stage epithelial ovarian cancer patients treated by adjuvant chemotherapy. Clinical Cancer Res. 2007;13(14):4083–4091. doi:10.1158/1078-0432.CCR-06-2775
32. Yang F, Guo X, Yang G, Rosen DG, Liu J. AURKA and BRCA2 expression highly correlate with prognosis of endometrioid ovarian carcinoma. Modern Pathol. 2011;24(6):836–845. doi:10.1038/modpathol.2011.44
33. Mignogna C, Staropoli N, Botta C, et al. Aurora Kinase A expression predicts platinum-resistance and adverse outcome in high-grade serous ovarian carcinoma patients. J Ovarian Res. 2016;9(1):31. doi:10.1186/s13048-016-0238-7
34. Wan X, Yeung C, Kim SY, et al. Identification of FoxM1/Bub1b signaling pathway as a required component for growth and survival of rhabdomyosarcoma. Cancer Res. 2012;72(22):5889–5899. doi:10.1158/0008-5472.CAN-12-1991
35. Baker DJ, Jeganathan KB, Cameron JD, et al. BubR1 insufficiency causes early onset of aging-associated phenotypes and infertility in mice. Nat Genet. 2004;36(7):744–749. doi:10.1038/ng1382
36. Kops GJ, Foltz DR, Cleveland DW. Lethality to human cancer cells through massive chromosome loss by inhibition of the mitotic checkpoint. Proc Natl Acad Sci U S A. 2004;101(23):8699–8704. doi:10.1073/pnas.0401142101
37. Chen H, Lee J, Kljavin NM, et al. Requirement for BUB1B/BUBR1 in tumor progression of lung adenocarcinoma. Genes Cancer. 2015;6(3–4):106–118. doi:10.18632/genesandcancer.53
38. Kawakubo E, Matsumoto T, Yoshiya K, et al. BUBR1 insufficiency is correlated with enos reduction experimentally in vitro and in vivo, and in gastric cancer tissue. Anticancer Res. 2018;38(11):6099–6106. doi:10.21873/anticanres.12960
39. Yamamoto Y, Matsuyama H, Chochi Y, et al. Overexpression of BUBR1 is associated with chromosomal instability in bladder cancer. Cancer Genet Cytogenet. 2007;174(1):42–47. doi:10.1016/j.cancergencyto.2006.11.012
40. Fu X, Chen G, Cai ZD, et al. Overexpression of BUB1B contributes to progression of prostate cancer and predicts poor outcome in patients with prostate cancer. Onco Targets Ther. 2016;9:2211–2220. doi:10.2147/OTT.S101994
41. Sun Q, Zhao H, Zhang C, et al. Gene co-expression network reveals shared modules predictive of stage and grade in serous ovarian cancers. Oncotarget. 2017;8(26):42983–42996. doi:10.18632/oncotarget.17785
42. Rattner JB, Rao A, Fritzler MJ, Valencia DW, Yen TJ. CENP-F is a.ca 400 kDa kinetochore protein that exhibits a cell-cycle dependent localization. Cell Motil Cytoskeleton. 1993;26(3):214–226. doi:10.1002/cm.970260305
43. Sun J, Huang J, Lan J, et al. Overexpression of CENPF correlates with poor prognosis and tumor bone metastasis in breast cancer. Cancer Cell Int. 2019;19:264. doi:10.1186/s12935-019-0986-8
44. Shahid M, Kim M, Lee MY, et al. Downregulation of CENPF remodels prostate cancer cells and alters cellular metabolism. Proteomics. 2019;19(11):e1900038. doi:10.1002/pmic.201900038
45. Kim HE, Kim DG, Lee KJ, et al. Frequent amplification of CENPF, GMNN and CDK13 genes in hepatocellular carcinomas. PLoS One. 2012;7(8):e43223. doi:10.1371/journal.pone.0043223
46. Xu Z, Zhou Y, Cao Y, Dinh TL, Wan J, Zhao M. Identification of candidate biomarkers and analysis of prognostic values in ovarian cancer by integrated bioinformatics analysis. Medical Oncology. 2016;33(11):130. doi:10.1007/s12032-016-0840-y
47. Yeganeh PN, Richardson C, Bahrani-Mostafavi Z, Tait DL, Mostafavi MT. Dysregulation of AKT3 along with a small panel of mRNAs stratifies high-grade serous ovarian cancer from both normal epithelia and benign tumor tissues. Genes Cancer. 2017;8(11–12):784–798. doi:10.18632/genesandcancer.164
48. Lee JH, Berger JM. Cell cycle-dependent control and roles of DNA topoisomerase II. Genes. 2019;10:11. doi:10.3390/genes10110859
49. Chen T, Sun Y, Ji P, Kopetz S. Topoisomerase IIα in chromosome instability and personalized cancer therapy. Oncogene. 2015;34(31):4019–4031. doi:10.1038/onc.2014.332
50. Gao Y, Zhao H, Ren M, et al. TOP2A promotes tumorigenesis of high-grade serous ovarian cancer by regulating the tgf-β/smad pathway. J Cancer. 2020;11(14):4181–4192. doi:10.7150/jca.42736
51. Kucukgoz Gulec U, Gumurdulu D, Guzel AB, et al. Prognostic importance of survivin, Ki-67, and topoisomerase IIα in ovarian carcinoma. Arch Gynecol Obstet. 2014;289(2):393–398. doi:10.1007/s00404-013-3000-z
52. Rath O, Kozielski F. Kinesins and cancer. Nat Rev Cancer. 2012;12(8):527–539. doi:10.1038/nrc3310
53. Schneider MA, Christopoulos P, Muley T, et al. AURKA, DLGAP5, TPX2, KIF11 and CKAP5: five specific mitosis-associated genes correlate with poor prognosis for non-small cell lung cancer patients. Int J Oncol. 2017;50(2):365–372. doi:10.3892/ijo.2017.3834
54. Zhou J, Chen WR, Yang LC, et al. KIF11 functions as an oncogene and is associated with poor outcomes from breast cancer. Cancer Research Treatment. 2019;51(3):1207–1221. doi:10.4143/crt.2018.460
55. Venere M, Horbinski C, Crish JF, et al. The mitotic kinesin KIF11 is a driver of invasion, proliferation, and self-renewal in glioblastoma. Sci Transl Med. 2015;7(304):304ra143. doi:10.1126/scitranslmed.aac6762
56. Takenaga M, Yamamoto Y, Takeuchi T, et al. Potential new chemotherapy strategy for human ovarian carcinoma with a novel KSP inhibitor. Biochem Biophys Res Commun. 2015;463(3):222–228. doi:10.1016/j.bbrc.2015.05.029
57. Shi B, Bao J, Liu Y, Shi J. Death receptor 6 promotes ovarian cancer cell migration through KIF11. FEBS Open Bio. 2018;8(9):1497–1507. doi:10.1002/2211-5463.12492
58. Liu J, Meng H, Li S, et al. Identification of potential biomarkers in association with progression and prognosis in epithelial ovarian cancer by integrated bioinformatics analysis. Front Genet. 2019;10:1031. doi:10.3389/fgene.2019.01031
59. Engqvist H, Parris TZ, Kovács A, et al. Validation of novel prognostic biomarkers for early-stage clear-cell, endometrioid and mucinous ovarian carcinomas using immunohistochemistry. Front Oncol. 2020;10:162. doi:10.3389/fonc.2020.00162
60. Li T, Li Y, Gan Y, et al. Methylation-mediated repression of MiR-424/503 cluster promotes proliferation and migration of ovarian cancer cells through targeting the hub gene KIF23. Cell Cycle. 2019;18(14):1601–1618. doi:10.1080/15384101.2019.1624112
 © 2021 The Author(s). This work is published and licensed by Dove Medical Press Limited. The full terms of this license are available at https://www.dovepress.com/terms.php and incorporate the Creative Commons Attribution - Non Commercial (unported, v3.0) License.
By accessing the work you hereby accept the Terms. Non-commercial uses of the work are permitted without any further permission from Dove Medical Press Limited, provided the work is properly attributed. For permission for commercial use of this work, please see paragraphs 4.2 and 5 of our Terms.
© 2021 The Author(s). This work is published and licensed by Dove Medical Press Limited. The full terms of this license are available at https://www.dovepress.com/terms.php and incorporate the Creative Commons Attribution - Non Commercial (unported, v3.0) License.
By accessing the work you hereby accept the Terms. Non-commercial uses of the work are permitted without any further permission from Dove Medical Press Limited, provided the work is properly attributed. For permission for commercial use of this work, please see paragraphs 4.2 and 5 of our Terms.