")
Back to Journals » Journal of Inflammation Research » Volume 16
Identification of Targets for Subsequent Treatment of Crohn’s Disease Patients After Failure of Anti-TNF Therapy
Authors Yao Y, Yang L, Zhang Z, Wang B, Feng B, Liu Z
Received 25 May 2023
Accepted for publication 20 September 2023
Published 17 October 2023 Volume 2023:16 Pages 4617—4631
DOI https://doi.org/10.2147/JIR.S422881
Checked for plagiarism Yes
Review by Single anonymous peer review
Peer reviewer comments 2
Editor who approved publication: Professor Ning Quan
Yao Yao,1,* Liu Yang,1,* Zhe Zhang,1,* Binbin Wang,1 Baisui Feng,1 Zhanju Liu1,2
1Department of Gastroenterology, the Second Affiliated Hospital of Zhengzhou University, Zhengzhou, 450014, People’s Republic of China; 2Department of Gastroenterology, the Shanghai Tenth People’s Hospital of Tongji University, Shanghai, 200072, People’s Republic of China
*These authors contributed equally to this work
Correspondence: Zhanju Liu; Baisui Feng, Tel +86-18917683431 ; +86-18756585626, Email [email protected]; [email protected]
Background: Anti-TNF medications are the first-line treatment for Crohn’s Disease (CD), despite the fact that a significant portion of the population continues to be ineffectively treated. This research aims to discover accurate intervention targets for the follow-up of anti-TNF non-responders using bioinformatics technology.
Methods: GSE16879, GSE111761, and GSE52746 retrieved from the GEO database. Unbiased differentially expressed genes (DEGs) were discovered utilizing the limma and RobustRankAggreg (RRA) tools. Then, we used weighted gene co-expression network analysis (WGCNA) to identify the module most strongly associated with non responders and subjected this module to Kyoto Encyclopedia of Genes and Genomes (KEGG) and Gene Ontology (GO) enrichment analysis with overlapping genes of the DEGs. GSEA analysis applied to check the results of GO and KEGG. Using the Cytoscape program, the protein-protein interaction (PPI) network was constructed. The software’s MCODE addon and CytoHubba addon was used to find the most important modules and the hub genes. Subsequently, we employed reverse transcription-polymerase chain reaction (RT-PCR) to confirm hub gene expression from mucosal biopsy specimens.
Results: There were a total of 142 genes co-upregulated and 65 genes co-downregulated. According to the WGCNA analysis, 42 genes were duplicated inside the light cyan module. GO and KEGG enrichment analyses of overlapped genes in nonresponders demonstrated an increase in the expression of genes associated with inflammation and immune response, consistent with GSEA results. The PPI network was constructed using 41 protein nodes and 177 edges. After validation, 8 of the top 10 genes were verified to be differentially expressed.
Conclusion: Our investigation is the first to integrate three CD databases after the anti-TNF medication treatment. We identified IL1B, CCL4, CXCL1, CXCL10, CCL3, CSF3, TREM1, and IL1RN as potential therapeutic targets for patients whose anti-TNF treatment failed.
Keywords: Crohn’s disease, weighted gene co-expression network analysis, robust rank aggreg, therapeutic targets
Introduction
Crohn’s Disease (CD) is a typical group of inflammatory bowel disease, a chronic intestinal disease with an unclear cause that fluctuates between clinical remission and relapse. The disease may affect the entirety of the gastrointestinal tract, frequently manifesting as segmental, asymmetric, and transmural lesions. 21–47% of patients present with extraintestinal manifestations, which profoundly influence patients in terms of hospitalization risk, complications and quality of life.1 In 2022, in addition to conventional medications such as corticosteroids, and thiopurines, monoclonal antibodies targeting inflammatory cells and cytokines (Infliximab, Adalimumab, Vedolizumab, ustekinumab) have emerged to provide effective symptom relief and promote healing of endoscopic ulcers.2
Infliximab, the first anti-TNF monoclonal antibody administered intravenously, is currently the first-line treatment for Crohn’s disease, reducing hospitalization, surgery, and intestinal damage in moderate to severe patients. Adalimumab is another anti-TNF monoclonal antibody authorized for the treatment of Crohn’s disease.3 Nonetheless, only two-thirds of patients have an induced anti-TNF response, and half of these patients may lose the response over the course of many years.4 In addition, the long-term efficacy of switching to a second anti-TNF therapy after failing to establish remission with the first anti-TNF therapy is poor and considerably worse in patients with primary non-response.5,6 Other widely utilized biologics include vedolizumab, a humanized immunoglobulin G1 monoclonal antibody targeting the α4β7 integrin on the surface of lymphocytes, and ustekinumab, a recently approved monoclonal antibody against the p40 component shared by interleukins (IL)12 and IL23. Several studies have demonstrated that the efficacy of vedolizumab and ustekinumab in anti-TNF-exposed individuals is inferior to that of biologics naïve patients.6–8 The appropriate target and best technique for the aftercare of patients with Crohn’s disease who have failed first-line medication remain controversial.9 The study’s overarching objective is to determine which therapy targets are most useful for monitoring anti-TNF non-responders, with the hope of helping these patients achieve clinical and endoscopic remission as rapidly as possible and slowing the course of their disease.
The Gene Expression Omnibus (GEO) is the largest and most comprehensive online repository of gene expression data currently accessible to the public. We retrieved the microarray expression matrix of CD patients who had received anti-TNF therapy as part of our survey from this database. Unbiased differentially expressed genes for the several microarrays on the platform were determined using the RobustRankAggreg (RRA) method. Weighted gene co-expression network analysis (WGCNA) was utilized to identify the differential genes most strongly related to the trait of nonresponders. The STRING and Cytoscape plug-ins were then examined to figure out the most efficient probable targets.
Based on a comprehensive examination of changes in expression patterns between anti-TNF medication responders and nonresponders, our study identified numerous targets that may be beneficial to CD patients with refractory disease.
Methods
Figure 1 presents the flow of the disease dataset analyzed in this study.
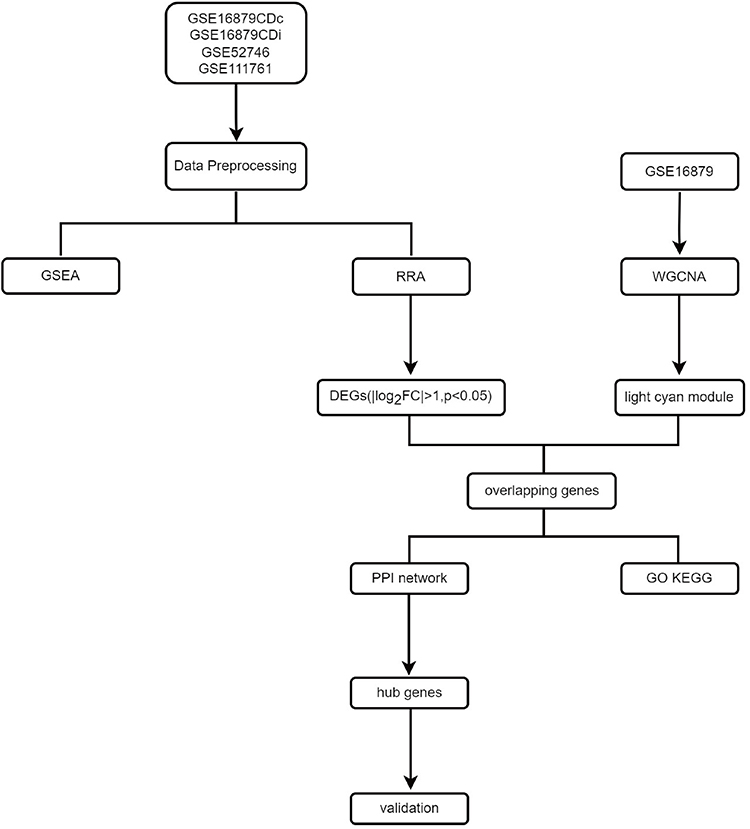 |
Figure 1 Flow chart of this study. |
Data Collection and Preprocessing
We searched the GEO website (https://www.ncbi.nlm.nih.gov/geo) with the keywords (Crohn’s disease) AND (“Infliximab” OR “anti-TNF”) AND (“intestine” OR “mucosa”), and among the results obtained, we included datasets that 1, contained adult patients who responded to the anti-TNF agent and those who failed to respond 2, were microarray sequenced, resulting in three datasets: GSE16879, GSE52746, and GSE111761. The series expression matrices and their accompanying files were downloaded from the GEO website. Since the GSE16879 dataset covers the expression spectra of 133 intestinal biopsies, we selected the expression profiles of ileal samples from 8 responding and 10 nonresponding patients who had received infliximab as GSE16879CDi; and colonic expression patterns from 11 responding and 7 nonresponding patients as GSE16879CDc. In the GSE52746 microarray dataset, 7 patients responded to anti-TNF medication, while 5 did not. The GSE111761 dataset contains a total of six individuals: three responders and three nonresponders. Then we converted the probe ID into a gene symbol using GEOquery packages10 from R software (R 4.2.0). In instances where multiple probe IDs were found to match a gene, the expression level for that gene was determined by calculating the mean value of all of those probe IDs. In addition, we rejected rows and columns that are missing more than half of their values.
Identification of Differentially Expressed Genes (DEGs)
We used the limma11 package to implement background correction and normalization while tallying the genes with p <0.05, |log2FC|>1. These genes were then subjected to the RobustRankAggreg (RRA)12 algorithm to acquire the differentially expressed genes (DEGs). The DEGs were defined as genes that satisfied p<0.05,|log2FC|>1 in all four databases.
Construction of Co-Expression Network
Weighted gene co-expression network analysis (WGCNA)13 is a method that is used in systems biology to characterize patterns of gene association between different samples. It is also a method that can be used to identify highly synergistic sets of gene variation for data patterns that consist of multiple, and typically requires more than 15 samples. We merged GSE16879CDi and GSE16879CDc for the WGCNA analysis in order to achieve more reliable and refined results while taking into account the small sample size. To determine the similarity of expression, we first computed the correlation between the expression levels of the two genes across a matrix of numerous samples. To establish a co-expression network, WGCNA must convert the similarity matrix to the topological overlap matrix (TOM) by performing a morphological distribution adjustment. The key to this step is choosing an appropriate index parameter β so that the weight distribution of the adjacency matrix result is consistent with the morphological distribution to the greatest extent possible. Using the pickSoftThreshold function, we determined the optimal value for the exponential parameter β: 6 (Figure 2). Then the gene co-expression network was turned into a matrix of dissimilarities, and the genes were partitioned into various modules by dynamic shearing based on the hierarchical clustering of the tree diagram. Further, the correlation between gene expression within the module and module eigengene was evaluated.
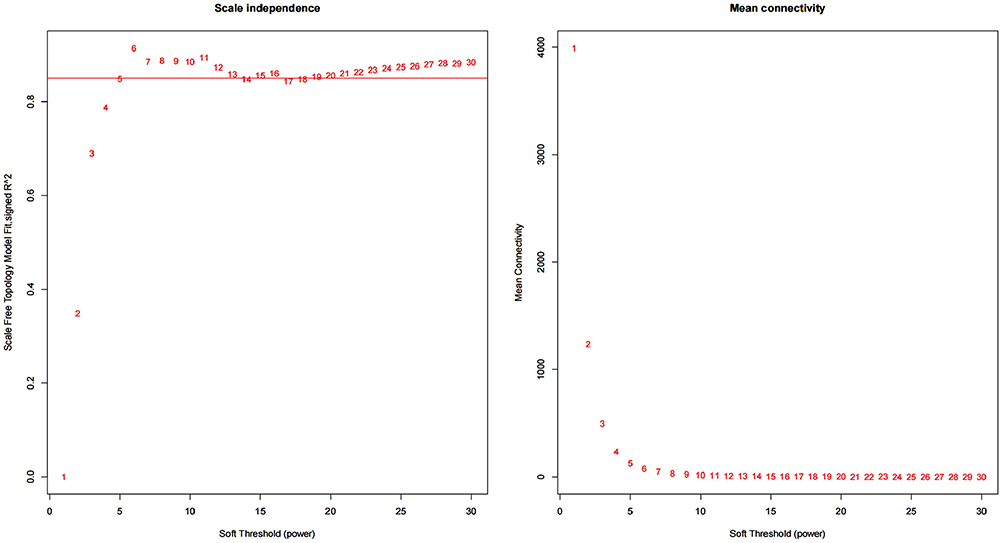 |
Figure 2 Selection of the optimal soft threshold β. |
Functional Enrichment Analysis
The clusterProfiler program was used to maintain the overlapping genes from DEGs and the most robust positive nonresponders correlation module for Gene Ontology(GO)14 and Kyoto Encyclopedia of Genes and Genomes(KEGG)15 pathway enrichment.16 GO analysis involves the biological process(BP), cellular component(CC), and molecular function(MF). The criterion was determined to be a false discovery rate (FDR) of less than 0.05. We used the combat package to fuse the four database expression profiles and the resulting meta-expression profiles were analyzed by GSEA.
Construction of Protein-Protein Interaction (PPI) Network and Selection of Hub Gene
Proteins and functional interactions of overlapping DEGs were predicted using the online database STRING (https://string-db.org/).17 Download the PPI network Interaction file, Medium Confidence > = 0.4. And the results were visualized using Cytoscape18 software. Furthermore, we identified hub genes employing the cytoHubba plug-in.19
Patient Cohort
The demographics and clinical characteristics of the patients are summarized in Table 1. Participants satisfied the necessary requirements: 1. patients with CD aged >18 years; 2. no previous exposure to anti-TNF agents; 3. patients were treated with adequate dosages of anti-TNF agent load (5/10 mg/kg) and got anti-TNF treatment at least 4 times between the time the patient was started on the medication and the time they were included in the study regularly; 4. no combination with other drugs during treatment; 5. no long-term antibiotic use during treatment and for 3 years prior to treatment.20 In the end, 16 patients with current inpatient intestinal biopsies were enrolled in this trial, with eight patients in each of the responder and nonresponder groups. As these 16 patients were all inpatients, infliximab was the only anti-TNF medication administered. Using a week’s worth of observational scoring, the Crohn’s Disease Activity Index (CDAI) is an essential indicator for calculating how active a patient’s condition is. We defined responder as a patient with a CDAI <150 along with a Simple Endoscopic Score for Crohn’s Disease (SES-CD) <5 assessed at least 14 weeks after the initial administration of infliximab; conversely, we rated it as a failure to respond if the patient did not meet the aforementioned criteria or suffered a dose increase that was not due to weight gain. All of the sections were graded according to their histological characteristics with the help of a pathologist.
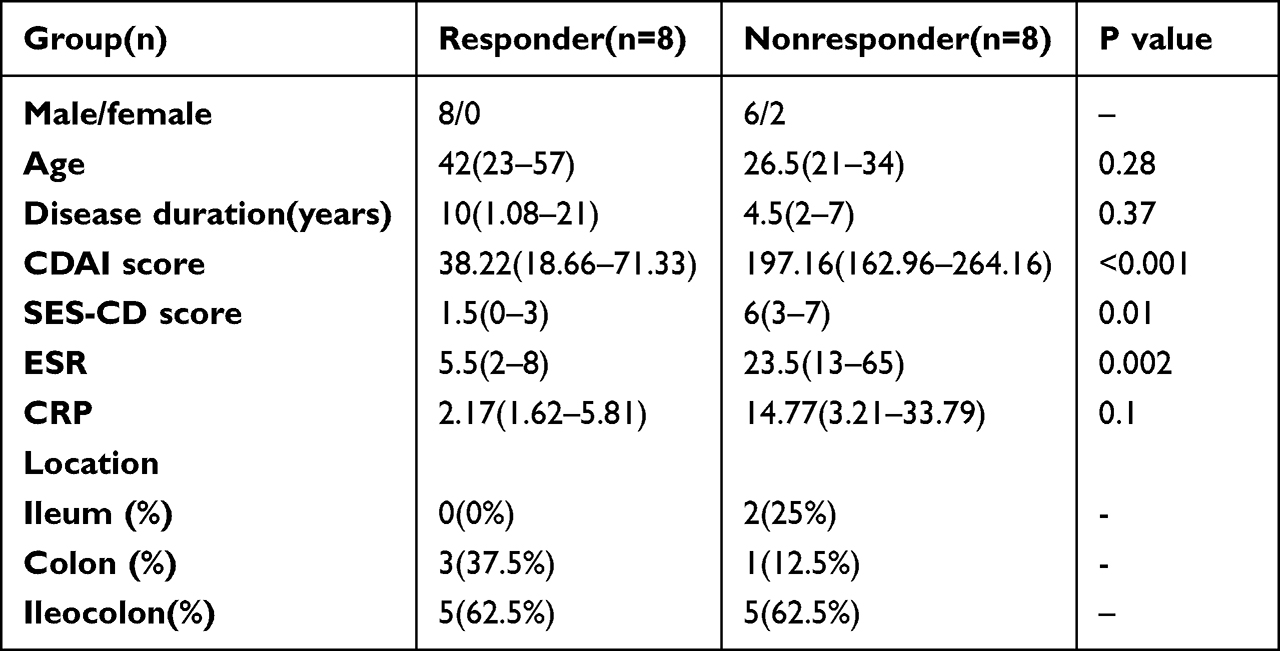 |
Table 1 Baseline Demographics and Clinical Characteristics. Continuous Variables Were Described Using the Median (IQR). IQR, Interquartile Range |
Biopsies were obtained at the ulcer’s edge during the active phase of intestinal inflammation, in the event of endoscopic healing, at the location where the ulcer developed prior to treatment administration. Prior to RNA extraction, all tissues were immediately frozen in RNAlater at −80 degrees Celsius (Eppendorf) for long-term storage.
Reverse Transcription-Polymerase Chain Reaction (RT-PCR)
Total RNA was extracted from intestinal tissue using the TRIzol (Invitrogen) reagent and then converted into cDNA using the PrimeScriptTM1strand cDNA synthesis kit (Takara). RT-PCR reaction was carried out with PowerUPTMSYBRTM Green Mix (Thermo Fisher Scientific), and ABI STEPONE PLUS ran fluorescence detection program. The relative expression of the measured genes was normalized to GAPDH and then calculated according to the 2−ΔΔCt method. The specific primer sequences of hub genes are shown in Table 2.
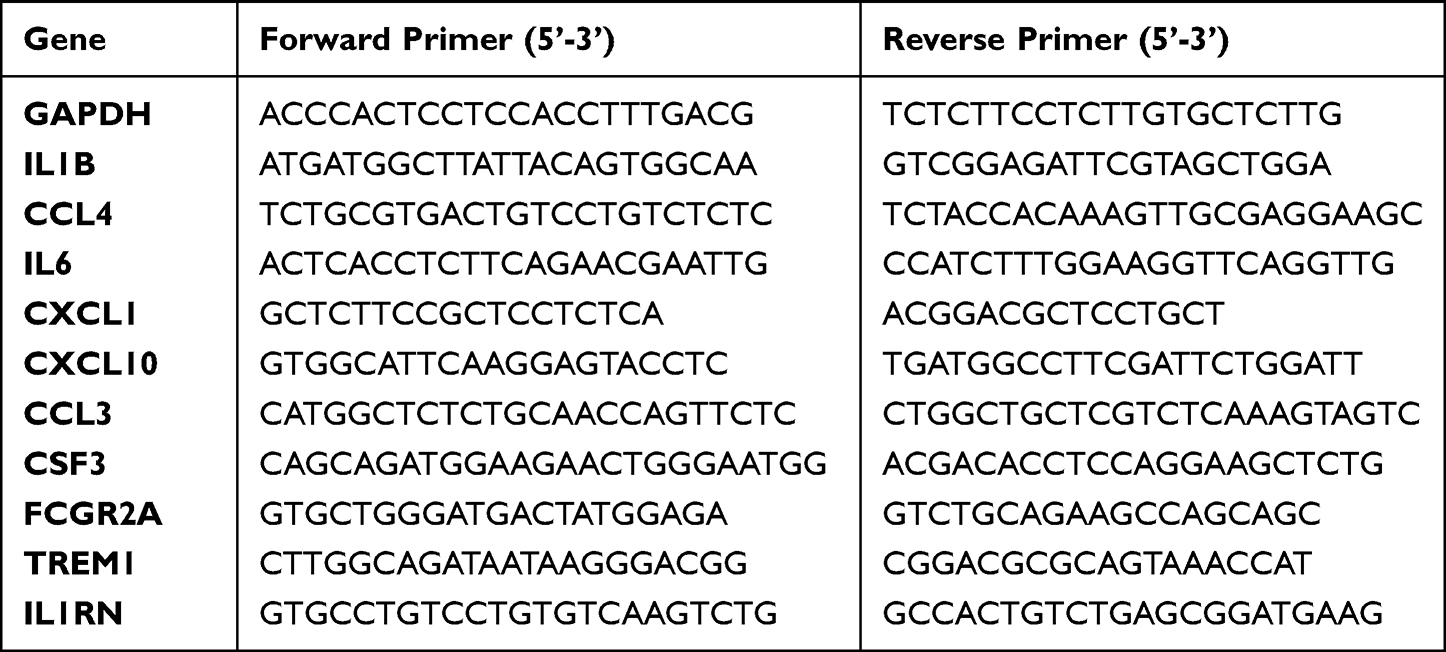 |
Table 2 qPCR Primers |
Statistical Analysis
We employed GraphPad Prism 8.0.1 software to analyze the differences between the two groups and the RT-PCR results. Continuous variables in the patient information were examined first for normality and chi-squareness. If both were satisfied, we used the Student’s t-test to obtain p-values, and vice versa; where one condition was not satisfied, we used the Mann–Whitney U-test for analysis. The Mann–Whitney U-test estimated comparing hub genes in the intestine tissues of responding and nonresponding patients. A statistically significant difference was considered if p<0.05.
Results
Identification of DEGs
Limma was utilized to normalize and process the expression of anti-TNF-treated samples on four microarray matrices. Genes meeting the criteria of p<0.05 and |log2FC|>1 were selected for subsequent analysis, and the expression levels of these genes in each database were visually represented using volcano plots (Figure 3A–D). A RRA analysis was conducted to evaluate the statistical expression of genes across the various data sets. If we set the criterion that p<0.05, 142 upregulated DEGs and 65 downregulated DEGs were discovered in nonresponders. Figure 3E depicts the top 10 previously upregulated and downregulated genes.
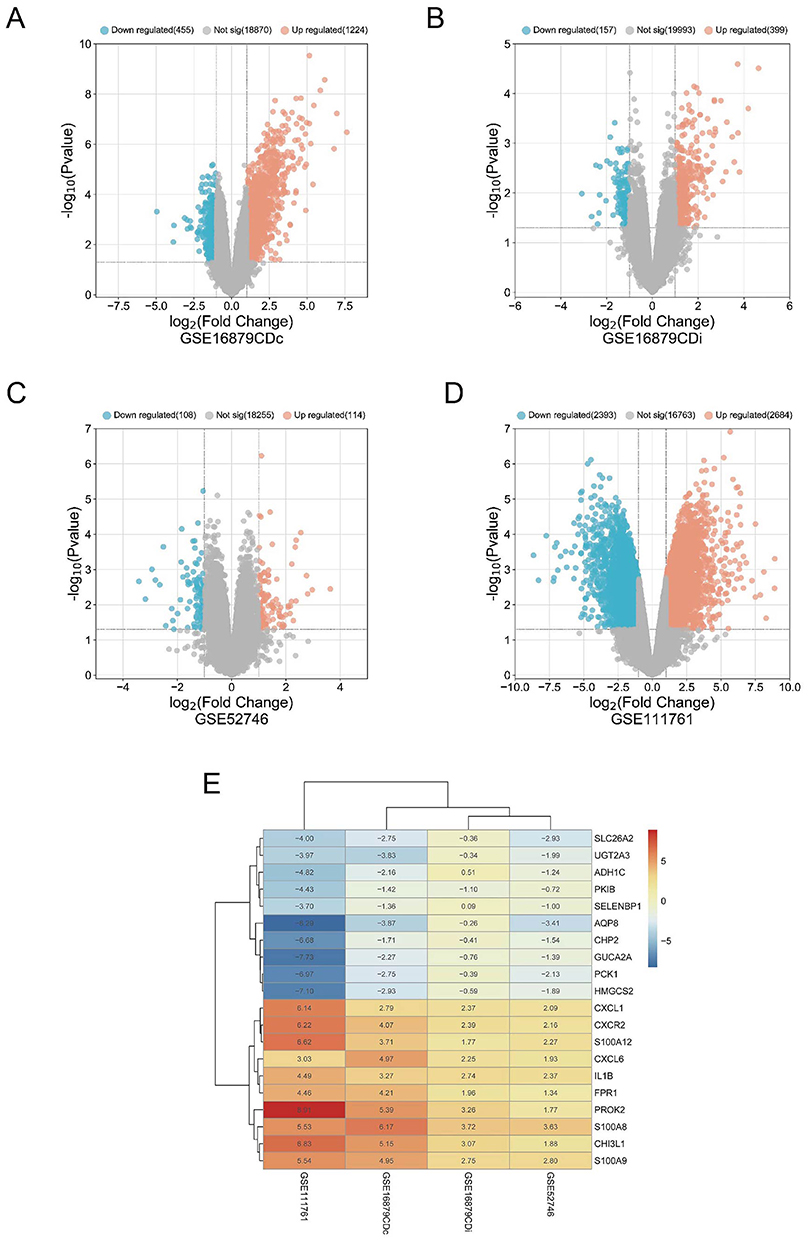 |
Figure 3 Identification of DEGs. (A–D) The volcano plots depicted the gene expression patterns across four databases. Genes exhibiting p<0.05 and log2FC>1 were classified as up-regulated genes and represented by red dots. Conversely, genes with a p<0.05 and log2FC<-1 were classified as down-regulated genes and represented by blue dots; (E) Heatmap of the top 10 up- and down-regulated DEGs from the RRA algorithm. |
Construction of Co-Expression Modules
We utilized the R package WGCNA to construct gene co-expression networks, access modules of co-expressed genes, and investigate the link between each module and nonresponders. Twelve modules were discovered in the GSE16879 database after hierarchical clustering, dynamic sectioning, and merging of comparable modules (Figure 4A). Intriguingly, the light cyan module (r=0.57, p=3e-04) was most positively related with a lack of response to anti-TNF therapy and comprised 1000 genes that would be incorporated into the upcoming research (Figure 4B).
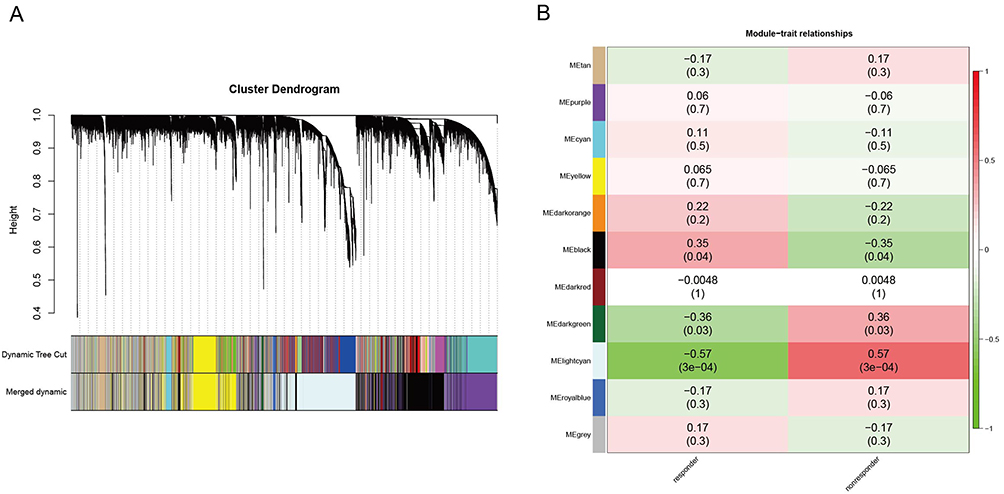 |
Figure 4 Weighted gene co-expression network analysis (WGCNA). (A) The cluster dendrogram of co-expression genes in GSE16879; (B) Module-trait correlation heatmap. |
Gene Functional Enrichment Analysis
42 genes spanning between DEGs and the light can module were upregulated (Figure 5A). We conducted GO and KEGG enrichment analysis to further investigate the potential roles of intersection genes. The most apparent enrichment of BP in the GO analysis was in response to molecules of bacterial origin and leukocyte movement. The CC category involved predominantly tertiary granules. Within the context of the MF category, there was an increase in cytokine activity, receptor-ligand activity, and activator activity of signaling receptors (Figure 5B).
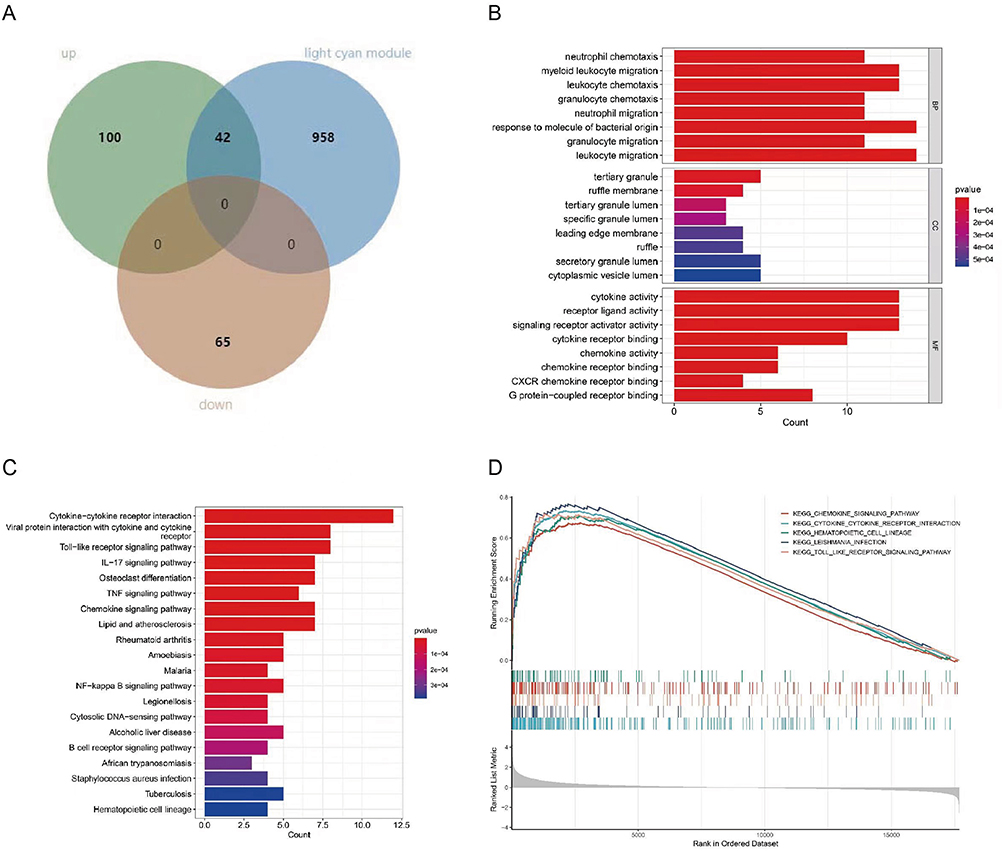 |
Figure 5 Functional enrichment analysis of overlapped DEGs. (A) Venn diagram of DEGs with Midnight blue module; (B) The top 8 significant GO terms; (C) The top 20 significant KEGG signaling pathways; (D) The five GSEA enrichment pathways with the highest Normalized Enrichment Score (NES) in the meta-expression profile. |
KEGG analysis prior to 20 enriched for immune-related pathways, including those associated with cytokine activation such as cytokine−cytokine receptor interaction, IL−17 signaling pathway, TNF signaling pathway; immunologically related disease pathways, such as lipid and atherosclerosis, rheumatoid arthritis, amoebiasis; and primary immune-related pathways, containing Toll-like receptor signaling pathway, cytosolic DNA−sensing pathway, B-cell receptor signaling pathway (Figure 5C). This showed that inflammation and immunological response were the primary functions of the overlapped genes.
By utilizing the expression matrix encompassing all genes within the dataset, Gene Set Enrichment Analysis (GSEA) was conducted to ensure the identification of pathways that are crucial in patients who exhibit a lack of response. Following our expectations, GSEA analysis of merged expression profiles from four databases delivered outcomes comparable to GO and KEGG, predominantly enriching immune and inflammation-related pathways. Figure 5D displayed the top 5 pathways ranked by Normalized Enrichment Score (NES), among them was the differential gene-enriched cytokine-cytokine receptor interaction pathway.
PPI Network Construction and Hub Gene Detection
The 42 DEGs were imported into the STRING database to map the protein interaction network consisting of 41 protein nodes and 177 edges, which was then displayed using Cytoscape software (3.9.1) (Figure 6A). Each node in the PPI represented a protein, and the letter that corresponded to each node was the gene symbol for the corresponding gene. Each edge represented interactions between proteins. The degree was the number of connections a protein had with the other proteins. Using Cytoscape software, we computed the degree value for each protein in the PPI, which we then mapped to color; the greater the degree value of the protein, the darker and redder the color. The MCODE plug-in indicated that the network featured a crucial module (Figure 6B). Central genes in the network were identified as the top 10 sequenced genes according to the MCC algorithm of cytoHubba (Figure 6C): IL6, IL1B, triggering receptor expressed on myeloid cells-1 (TREM1), IL1RN, CCL3, CCL4, CXCL1, CXCL10, FCGR2A, and colony-stimulating factors 3 (CSF3). To confirm the validity of the hub gene screen, we acquired 10 disease targets from the Genecards database using the term “Crohn’s disease” and scored highly on all 10 of these targets (Supplementary Table 1).
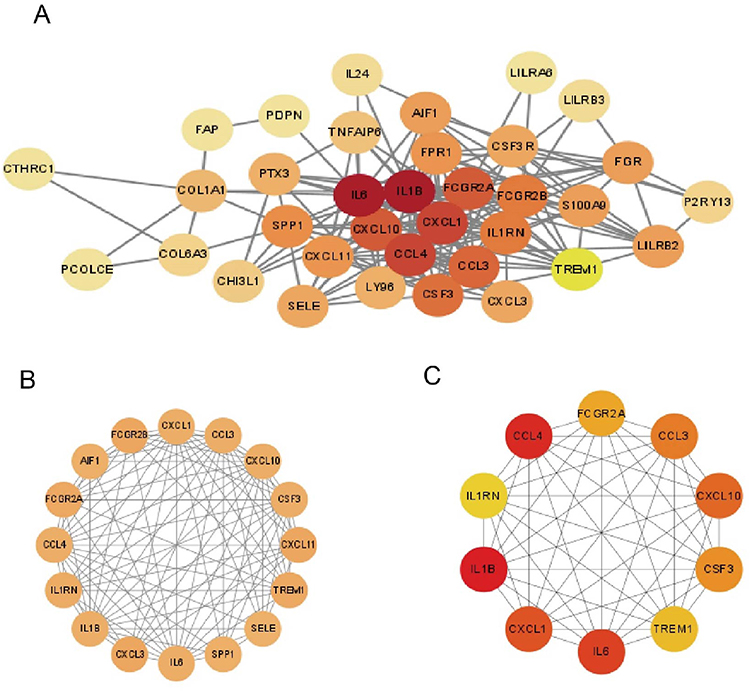 |
Figure 6 Analysis of protein interactions. (A) PPI network of 42 genes. (B) The only important module. (C) Ten Hub genes identified by MCC. |
Validation of Hub Genes Using RT-PCR
We completed RT-PCR on intestinal mucosa from 16 patients to further validate these ten hub genes. IL1B, CCL4, CXCL1, CXCL10, CCL3, CSF3, TREM1, and IL1RN (Figure 7A–H) were significantly elevated in the non-responsive group relative to the treatment responding group. Regrettably, IL6 and FCGR2A mRNA levels did not differ significantly between responders and nonresponders (Figure 7I and J), although nonresponders tended to have higher levels. It should be noted that we have eliminated outliers from the CCL4, IL6 relative expression values in order to acquire more accurate results.
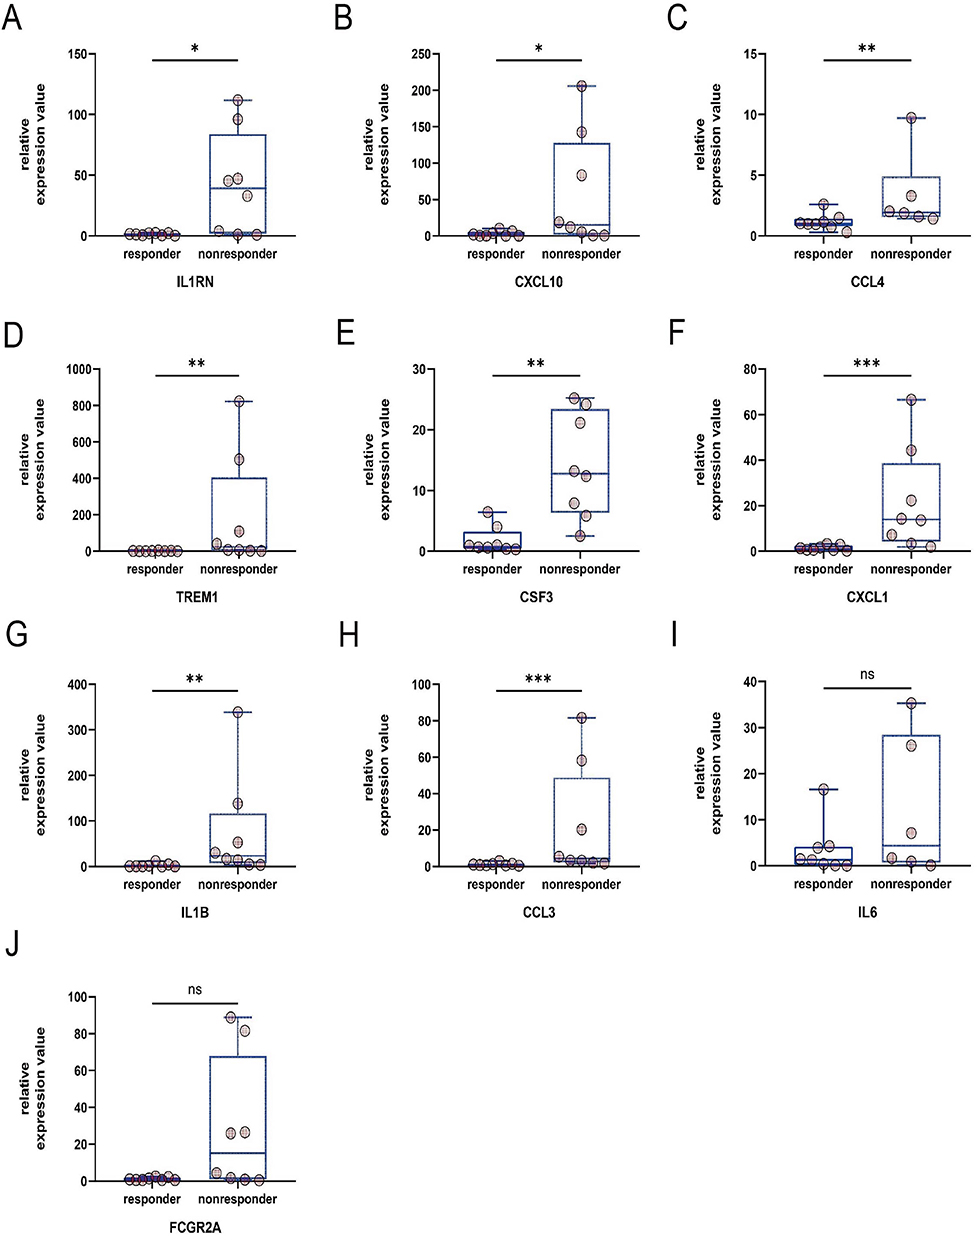 |
Figure 7 Validation results of the target. (A), IL1RN (B), CXCL10 (C), CCL4 (D), TREM1 (E), CSF3 (F), CXCL1 (G), IL1B (H) CCL3 (I), IL6 (J) FCGR2A. *p value<0.05, **p value<0.01, ***p value<0.001, ns means p<0.05. |
Discussion
A considerable number of moderate-to-severe CD patients treated with anti-TNF have unfavorable clinical outcomes. Despite their urgent need for quick remission, viable treatment targets for subsequent therapy remain elusive for these refractory patients. We downloaded expression matrices from intestinal biopsies of CD patients after anti-TNF antibody treatment from public datasets and then analyzed the expression patterns of nonresponders using information from multiple databases in an effort to identify novel therapeutic targets for the benefit of CD patients with refractory disease.
We initially evaluated the variations in gene expression at the transcriptome level between anti-TNF medication responders and non-responders in the intestinal mucosa. In this stage, the limma software and the RRA method were coupled to identify co-differentially expressed genes across several databases. In the interim, we did WGCNA analysis to identify the gene module most highly linked with the clinical trait of nonresponders, the light cyan module, and genes from this module were selected for future investigation. We hypothesized that genes associated with the lack of response to treatment following anti-TNF antibody injection and that were significantly differentially expressed in multiple databases could be targets for future alternative treatments. Accordingly, we selected 42 genes located at the intersection of DEGs and midnight blue modules for functional analysis and the construction of PPI networks. Consistent with our expectations, GO and KEGG results indicated that inflammation remained hyperactive in the intestines of nonresponders, with high enrichment of inflammatory cells, inflammatory cell-associated chemokines, and cytokine-related pathways. Then, ten genes were screened and validated, resulting in the identification of eight markedly different expressed genes between groups.
Due to the gender imbalance in the validation sample available to us, we used the responder samples from GSE52746 for comparison of 10 hub genes to prevent gender bias from causing differential results. There was no significant difference in gene expression between males and females for the eight genes in GSE52746 (FCGR2A and CCL3 were not included in this dataset) (Supplementary Figure 1). To validate our conclusions in a larger sample, we compared male and female patients in inflammatory and non-inflammatory intestinal specimens from the dataset GSE100833. The results indicated that our ten chosen hub genes were also not expressed differently in males and females (Supplementary Figures 2 and 3); in other words, the DEGs we validated were caused by response and non-response.
Chemokines CCL3, CCL4, CXCL1, and CXCL10 were significantly up-regulated among the ten hub genes that we examined in patients who did not respond to treatment. Chemokines are a class of 8–14 kDa small molecule structure-associated proteins that can stimulate leukocyte migration and irritative cell activation.21 IBD ulcerative lesions are accompanied by a significant infiltration of inflammatory cells, including T lymphocytes, macrophages, neutrophils, and plasma cells. CCL3 (also known as macrophage inflammatory protein-1, MIP-1) and CCL4 (also known as macrophage inflammatory protein-1, MIP-1) belong to the group of β-chemokines, which are believed to primarily attract monocytes and T-lymphocytes. Th1 cells, which have been found to dominate the pathogenic inflammatory response in CD patients and constitute the majority of activated CD8+ T cells, often express the CCR5 coreceptors CCL3 and CCL4. Intriguingly, monocyte conjugation with the intercellular adhesion molecule (ICAM)-1 augments CCL3 release, which may be an effective strategy to boost cell recruitment in the setting of proinflammatory reactions.22 However, it has been well documented that CCL3 and CCL4 are also powerful neutrophil chemotactic agents.23 Neutrophils at the region of inflammation release protein hydrolases as well as oxygen and nitrogen radicals that are capable of causing tissue damage. All chemokines were much more abundant in severely inflamed intestinal mucosa than in healthy participants or at resting disease stage. The expression of CCL3 and CCL4 was significantly elevated in intestinal epithelial cells, inflammatory cells, and stromal cells, and in CD patients more so than in UC patients, regardless of disease activity.24 Consequently, blocking CCL3 or CCL4 is anticipated to markedly limit the migration of inflammatory cells to the colon and induce clinical remission. In comparison, the chemokine CXCL1 is likewise an extremely potent neutrophil attractant. According to reports, CXCL1 is crucial for Th17 development, as well as reactive oxygen species generation and neutrophil extracellular trap creation. Boro M. established for the first time in recent investigations that CXCL1 also activates macrophage NLRP3 inflammatory vesicles, which are necessary for immunological activity.25–27 CXCL1 expression is elevated in the interepithelial compartment and inflammatory cells of patients with inflammatory bowel disease (IBD).28 CXCL10, the final chemokine, induces a Th1 response at the site of induction by increasing the release of pro-inflammatory cytokines from monocytes in a nonredundant manner and by attracting cells expressing its CXCR3 receptor in a manner similar to the other three chemokines.29 CXCL10 expression was significantly raised in colonic IBD and entirely normalized in infliximab responders, suggesting its potential utility in patients with inferior outcomes.28 Despite the failure of the CXCL10 eldelumab antibody to meet primary and secondary endpoints in Phase II clinical trials in patients with CD, both clinical and endoscopic evaluations demonstrated efficacy trends, which were more pronounced in the cohort of patients with SES-CD baseline of greater over 2.30 In addition, the anti-TNF - naive group and the anti-TNF-defective group attained comparable levels of endoscopic improvement. We believe that in the future, directing chemokines to specific cell subsets to restrict the trafficking of inflammatory cells to the patient’s gut while modifying the immune response may be a potent therapeutic, but one that requires additional development and refinement.
In addition to the four chemokines discussed previously, the cytokine-encoding mRNA levels of IL1B, IL1RN, and CSF3 were considerably greater in patients with TNF antibody resistance than in responsive patients. Over the past several decades, dysregulation of the cytokine network in intestinal inflammation has been discovered as a key pathogenic cause of disease and has been successfully used in clinical practice. Cytokine-targeted medicines have revolutionized the treatment of IBD, and further cytokine-targeted alternatives are currently being explored.31 IL1B encourages the formation of Th17 cells and the generation of IFN, both of which have proinflammatory effects. A few studies have also demonstrated that IL1B is related with a lack of response to anti-TNF therapy and may be a potential target for nonresponders.32,33 The application of single-cell sequencing technology has revealed a variety of cell subpopulations with high IL1B expression that are associated with therapy resistance, bolstering IL1B’s potential as a future target.34,35 However, the field of application of anti-IL1B antibodies in patients with IBD is yet undeveloped and requires confirmation through substantial clinical trials. IL1RA, encoded by IL1RN, binds IL1R competitively and is a natural IL1 antagonist. It has been demonstrated that IL1RA induces remission of symptoms in rats with DSS-induced colitis and in people with IBD.36 Studies of single nucleotide polymorphism in Danish populations suggest that a genetically determined reduction in IL1RA is associated with a lack of therapeutic response.32,33 In the current experiment, however, greater IL1RN mRNA rates were measured in the non-responder treatment cohort, possibly because high IL1RA levels were unable to counteract the similarly significant increase in IL1B. Providing patients with enough IL1RA to neutralize unbalanced IL1B may alleviate their clinical symptoms. CSF3, unlike the first two cytokines, is crucial for maintaining intestinal homeostasis. It is an intermediary between innate and adaptive immunity, encouraging the generation, survival, and activity of neutrophils, promoting the proliferation of Treg cells, inhibiting Th1 immune response but activating Th2 immunological response, etc. Inflammatory stimuli induce CSF3 synthesis, which is at least 116-fold more in inflamed IBD tissue than in non-inflamed tissue.37 CSF3, on the other hand, is implicated in multiple epithelial repair pathways in intestinal epithelial injury, and insufficient levels may even aggravate DSS-induced colitis;38 hence, the pharmacological intensity of targeting CSF3 must be tightly controlled.
A notable differentially represented gene, TREM1, encodes a receptor that is predominantly expressed on innate immune cells like mononuclear phagocytes (MNPs) and neutrophils. High ileal TREM-1 expression in Crohn’s disease is attributable to an increased frequency of immature, pro-inflammatory macrophages and CD11b+ granulocytes with high intestine TREM-1 expression; CD14+ monocytes may be responsible for the inferior treatment response in some cases.39 Intriguingly, Charles Caër et al40 found that blockade of both monocytes of the TNF pathway and TREM1 within the intestinal mucosa of CD patients resulted in a greater decrease in IL6 than anti-TNF alone. IL6 exerts a potent pro-inflammatory effect, which we shall discuss later. Anti-TREM1 may be a promising complement to TNF antagonist therapy for the management of patients in partial remission.
Furthermore, there was no statistically significant difference in IL6 and FCGR2A levels between the two groups, but there was a trend toward an increase in the group of non-responders relative to the group of responders. Considering its multiple proinflammatory effects, IL6 is a viable choice for the treatment of CD. PF-04236921, an IL6-complete human immunoglobulin G2 monoclonal antibody, caused remission in moderate-to-severe CD patients who had not responded to earlier anti-TNF therapy, according to the findings of a phase II clinical trial.41 It is essential to mention that gastrointestinal perforation and abscesses were frequent side effects in this experiment. In line with this finding, Raquel Franco Leal et al42 deduced through whole transcriptome analysis of the colonic mucosa of CD patients that IL6 was up-regulated by anti-TNF treatment in both responders, and additional experimental evidence is required to determine if anti-IL6 therapy may provide any additional benefit to non-responders. A second target, FCGR2A, is expressed on several immune cells and is closely connected to acute inflammatory pathways and pathogen-associated recognition receptors.43 Studies on UC have shown that FCGR2A promotes the release of inflammatory cytokines through multiple mechanisms;44 thus, targeting FCGR2A may have advantages over other single cytokine blockades. The exact utility in treatment-resistant patients, by analogy with IL6, still needs to be investigated.
Also, there are limitations to our study. First, as a result of the CD intestinal mucosal microarray’s limitations and the small number of patients included, our screening capacity was significantly lowered. There were differences between the three included databases in their definitions of non-response and the period over which samples were collected, which may have given some degree of bias to our results. Moving forward, we missed some Adalimumab patients because we were recruiting inpatient patients and will need to include these patients in the future and expand the sample size to determine the efficacy of the screening goal. To the best of our knowledge, however, this is the first study to incorporate multiple post-usage anti-TNFα drug datasets for analysis and validation in clinical patients. Our findings will be informative in selecting the most appropriate subsequent regimen for patients with non-responsive CD to anti-TNFα.
Conclusions
Our investigation is the first to integrate three CD databases after the anti-TNF medication treatment. Following various algorithms such as RRA, WGCNA, and PPI, we used intestinal biopsy specimens from CD patients for validation and identified IL1B, CCL4, CXCL1, CXCL10, CCL3, CSF3, TREM1, and IL1RN as potential therapeutic targets for patients whose anti-TNF treatment failed. This will provide guidance for future drug development and selection for refractory CD patients.
Abbreviations
CD, Crohn’s Disease; DEGs, differentially expressed genes; RRA, RobustRankAggreg; WGCNA, weighted gene co-expression network analysis; KEGG, Kyoto Encyclopedia of Genes and Genomes; GO, Gene Ontology; PPI, protein-protein interaction; RT-PCR, reverse transcription-polymerase chain reaction; GEO, Gene Expression Omnibus; TOM, topological overlap matrix; BP, biological process; CC, cellular component(CC); MF, molecular function; FDR, false discovery rate; Crohn’s Disease Activity Index (CDAI); SES-CD, Simple Endoscopic Score for Crohn’s Disease; GSEA, Gene Set Enrichment Analysis; NES, Normalized Enrichment Score; CSF3, colony-stimulating factors 3; TREM1, triggering receptor expressed on myeloid cells-1; ICAM-1, intercellular adhesion molecule; IBD, inflammatory bowel disease; MNPs, mononuclear phagocytes.
Data Sharing Statement
The data used in this study are accessible for download on the GEO website (https://www.ncbi.nlm.nih.gov/geo). The authors affirm that the data supporting the article are available.
Ethics Statement
After receiving written informed consent, eligible hospitalized patients from the Department of Gastroenterology at the Second Affiliated Hospital of Zhengzhou University were recruited for this study between June 2021 and May 2022. This research was evaluated and approved by Zhengzhou University’s Second Affiliated Hospital Ethics Committee, and in line with the Declaration of Helsinki.
Acknowledgments
The authors are sincerely grateful to all the medical practitioners who contributed to the research.
Author Contributions
All authors made a significant contribution to the work reported, whether that is in the conception, study design, execution, acquisition of data, analysis and interpretation, or in all these areas; took part in drafting, revising or critically reviewing the article; gave final approval of the version to be published; have agreed on the journal to which the article has been submitted; and agree to be accountable for all aspects of the work.
Funding
This project was supported by the Science and Technology Benefiting the People Program of Zhengzhou, 2021 (2021KJHM0018), the Science and Technology Breakthrough Project of Henan Province (222102310460 and 222102310531), the Medical Science and Technology Breakthrough Project of Henan Province, China (LHGJ20210424 and LHGJ20210379).
Disclosure
The authors declare that the study is free from any potential financial and commercial competition relationships.
References
1. Roda G, Chien Ng S, Kotze PG, et al. Crohn’s disease. Nat Rev Dis Primers. 2020;6(1):22. doi:10.1038/s41572-020-0156-2
2. Lamb CA, Kennedy NA, Raine T, et al. British society of gastroenterology consensus guidelines on the management of inflammatory bowel disease in adults. Gut. 2019;68(Suppl 3):s1–s106. doi:10.1136/gutjnl-2019-318484
3. Peyrin-Biroulet L, Fiorino G, Buisson A, Danese S. First-line therapy in adult Crohn’s disease: who should receive anti-TNF agents? Nat Rev Gastroenterol Hepatol. 2013;10(6):345–351. doi:10.1038/nrgastro.2013.31
4. Cohen BL, Sachar DB. Update on anti-tumor necrosis factor agents and other new drugs for inflammatory bowel disease. BMJ. 2017;357:j2505. doi:10.1136/bmj.j2505
5. C RGM, Chaparro M, Mesonero F, et al. Effectiveness of anti-TNFalpha drugs in patients with Crohn’s disease who do not achieve remission with their first anti-TNFalpha agent. Dig Liver Dis. 2016;48(6):613–619. doi:10.1016/j.dld.2016.02.012
6. Gisbert JP, Chaparro M. Primary failure to an anti-tnf agent in inflammatory bowel disease: switch (to a Second Anti-TNF Agent) or Swap (for another mechanism of action)? J Clin Med. 2021;10(22):5318. doi:10.3390/jcm10225318
7. Liefferinckx C, Minsart C, Cremer A, et al. Early vedolizumab trough levels at induction in inflammatory bowel disease patients with treatment failure during maintenance. Eur J Gastroenterol Hepatol. 2019;31(4):478–485. doi:10.1097/MEG.0000000000001356
8. Sands BE, Feagan BG, Rutgeerts P, et al. Effects of vedolizumab induction therapy for patients with Crohn’s disease in whom tumor necrosis factor antagonist treatment failed. Gastroenterology. 2014;147(3):618–627 e613. doi:10.1053/j.gastro.2014.05.008
9. Yanai H, Hanauer SB. Assessing response and loss of response to biological therapies in IBD. Am J Gastroenterol. 2011;106(4):685–698. doi:10.1038/ajg.2011.103
10. Davis S, Meltzer PS. GEOquery: a bridge between the Gene Expression Omnibus (GEO) and bioConductor. Bioinformatics. 2007;23(14):1846–1847. doi:10.1093/bioinformatics/btm254
11. Ritchie ME, Phipson B, Wu D, et al. limma powers differential expression analyses for RNA-sequencing and microarray studies. Nucleic Acids Res. 2015;43(7):e47. doi:10.1093/nar/gkv007
12. Kolde R, Laur S, Adler P, Vilo J. Robust rank aggregation for gene list integration and meta-analysis. Bioinformatics. 2012;28(4):573–580. doi:10.1093/bioinformatics/btr709
13. Langfelder P, Horvath S. WGCNA: an R package for weighted correlation network analysis. BMC Bioinform. 2008;9:559. doi:10.1186/1471-2105-9-559
14. The Gene Ontology C. The gene ontology resource: 20 years and still GOing strong. Nucleic Acids Res. 2019;47(D1):D330–D338. doi:10.1093/nar/gky1055
15. Kanehisa M, Furumichi M, Tanabe M, Sato Y, Morishima K. KEGG: new perspectives on genomes, pathways, diseases and drugs. Nucleic Acids Res. 2017;45(D1):D353–D361. doi:10.1093/nar/gkw1092
16. Yu G, Wang LG, Han Y, He QY. clusterProfiler: an R package for comparing biological themes among gene clusters. Omics. 2012;16(5):284–287. doi:10.1089/omi.2011.0118
17. Szklarczyk D, Gable AL, Lyon D, et al. STRING v11: protein-protein association networks with increased coverage, supporting functional discovery in genome-wide experimental datasets. Nucleic Acids Res. 2019;47(D1):D607–d613. doi:10.1093/nar/gky1131
18. Shannon P, Markiel A, Ozier O, et al. Cytoscape: a software environment for integrated models of biomolecular interaction networks. Genome Res. 2003;13(11):2498–2504. doi:10.1101/gr.1239303
19. Chin CH, Chen SH, Wu HH, Ho CW, Ko MT, Lin CY. cytoHubba: identifying hub objects and sub-networks from complex interactome. BMC Syst Biol. 2014;8(4):S11. doi:10.1186/1752-0509-8-S4-S11
20. Gorelik Y, Freilich S, Gerassy-Vainberg S, et al. Antibiotic use differentially affects the risk of anti-drug antibody formation during anti-TNFalpha therapy in inflammatory bowel disease patients: a report from the epi-IIRN. Gut. 2022;71(2):287–295. doi:10.1136/gutjnl-2021-325185
21. Reichel CA, Puhr-Westerheide D, Zuchtriegel G, et al. C-C motif chemokine CCL3 and canonical neutrophil attractants promote neutrophil extravasation through common and distinct mechanisms. Blood. 2012;120(4):880–890. doi:10.1182/blood-2012-01-402164
22. Hughes CE, Nibbs RJB. A guide to chemokines and their receptors. Febs j. 2018;285(16):2944–2971. doi:10.1111/febs.14466
23. Ramos CD, Canetti C, Souto JT, et al. MIP-1alpha[CCL3] acting on the CCR1 receptor mediates neutrophil migration in immune inflammation via sequential release of TNF-alpha and LTB4. J Leukoc Biol. 2005;78(1):167–177. doi:10.1189/jlb.0404237
24. Banks C, Bateman A, Payne R, Johnson P, Sheron N. Chemokine expression in IBD. Mucosal chemokine expression is unselectively increased in both ulcerative colitis and Crohn’s disease. J Pathol. 2003;199(1):28–35. doi:10.1002/path.1245
25. Boro M, Balaji KN. CXCL1 and CXCL2 Regulate NLRP3 Inflammasome Activation via G-Protein-Coupled Receptor CXCR2. J Immunol. 2017;199(5):1660–1671. doi:10.4049/jimmunol.1700129
26. De Filippo K, Dudeck A, Hasenberg M, et al. Mast cell and macrophage chemokines CXCL1/CXCL2 control the early stage of neutrophil recruitment during tissue inflammation. Blood. 2013;121(24):4930–4937. doi:10.1182/blood-2013-02-486217
27. Sawant KV, Sepuru KM, Lowry E, et al. Neutrophil recruitment by chemokines Cxcl1/KC and Cxcl2/MIP2: role of Cxcr2 activation and glycosaminoglycan interactions. J Leukoc Biol. 2021;109(4):777–791. doi:10.1002/JLB.3A0820-207R
28. Arijs I, De Hertogh G, Machiels K, et al. Mucosal gene expression of cell adhesion molecules, chemokines, and chemokine receptors in patients with inflammatory bowel disease before and after infliximab treatment. Am J Gastroenterol. 2011;106(4):748–761. doi:10.1038/ajg.2011.27
29. Cripps JG, Celaj S, Burdick M, Strieter RM, Gorham JD. Liver inflammation in a mouse model of Th1 hepatitis despite the absence of invariant NKT cells or the Th1 chemokine receptors CXCR3 and CCR5. Lab Invest. 2012;92(10):1461–1471. doi:10.1038/labinvest.2012.104
30. Sandborn WJ, Rutgeerts P, Colombel JF, et al. Eldelumab [anti-interferon-gamma-inducible protein-10 antibody] induction therapy for active crohn’s disease: a randomised, double-blind, placebo-controlled phase iia study. J Crohns Colitis. 2017;11(7):811–819. doi:10.1093/ecco-jcc/jjx005
31. Friedrich M, Pohin M, Powrie F. Cytokine networks in the pathophysiology of inflammatory bowel disease. Immunity. 2019;50(4):992–1006. doi:10.1016/j.immuni.2019.03.017
32. Bank S, Julsgaard M, Abed OK, et al. Polymorphisms in the NFkB, TNF-alpha, IL-1beta, and IL-18 pathways are associated with response to anti-TNF therapy in Danish patients with inflammatory bowel disease. Aliment Pharmacol Ther. 2019;49(7):890–903. doi:10.1111/apt.15187
33. Bank S, Andersen PS, Burisch J, et al. Associations between functional polymorphisms in the NFkappaB signaling pathway and response to anti-TNF treatment in Danish patients with inflammatory bowel disease. Pharmacogenomics J. 2014;14(6):526–534. doi:10.1038/tpj.2014.19
34. Martin JC, Chang C, Boschetti G, et al. Single-cell analysis of Crohn’s disease lesions identifies a pathogenic cellular module associated with resistance to Anti-TNF therapy. Cell. 2019;178(6):1493–1508 e1420. doi:10.1016/j.cell.2019.08.008
35. Devlin JC, Axelrad J, Hine AM, et al. Single-cell transcriptional survey of ileal-anal pouch immune cells from ulcerative colitis patients. Gastroenterology. 2021;160(5):1679–1693. doi:10.1053/j.gastro.2020.12.030
36. Dosh RH, Jordan-Mahy N, Sammon C, Le Maitre C. Interleukin 1 is a key driver of inflammatory bowel disease-demonstration in a murine IL-1Ra knockout model. Oncotarget. 2019;10(37):3559–3575. doi:10.18632/oncotarget.26894
37. Soderman J, Berglind L, Almer S. Gene expression-genotype analysis implicates GSDMA, GSDMB, and LRRC3C as Contributors to inflammatory bowel disease susceptibility. Biomed Res Int. 2015;2015:834805. doi:10.1155/2015/834805
38. Shi YJ, Hu SJ, Zhao QQ, Liu XS, Liu C, Wang H. Toll-like receptor 4 (TLR4) deficiency aggravates dextran sulfate sodium (DSS)-induced intestinal injury by down-regulating IL6, CCL2 and CSF3. Ann Transl Med. 2019;7(23):713. doi:10.21037/atm.2019.12.28
39. Prins MM, Verstockt B, Ferrante M, Vermeire S, Wildenberg ME, Koelink PJ. Monocyte TREM-1 levels associate with anti-TNF Responsiveness in IBD through autophagy and fcgamma-receptor signaling pathways. Front Immunol. 2021;12:627535. doi:10.3389/fimmu.2021.627535
40. Caer C, Gorreja F, Forsskahl SK, et al. TREM-1+ macrophages define a pathogenic cell subset in the intestine of Crohn’s disease patients. J Crohns Colitis. 2021;15(8):1346–1361. doi:10.1093/ecco-jcc/jjab022
41. Danese S, Vermeire S, Hellstern P, et al. Randomised trial and open-label extension study of an anti-interleukin-6 antibody in Crohn’s disease (ANDANTE I and II). Gut. 2019;68(1):40–48. doi:10.1136/gutjnl-2017-314562
42. Leal RF, Planell N, Kajekar R, et al. Identification of inflammatory mediators in patients with Crohn’s disease unresponsive to anti-TNFalpha therapy. Gut. 2015;64(2):233–242. doi:10.1136/gutjnl-2013-306518
43. Dahlqvist J, Fulco CP, Ray JP, et al. Systematic identification of genomic elements that regulate FCGR2A expression and harbor variants linked with autoimmune disease. Hum Mol Genet. 2022;31(12):1946–1961. doi:10.1093/hmg/ddab372
44. Castro-Dopico T, Dennison TW, Ferdinand JR, et al. Anti-commensal IgG drives intestinal inflammation and type 17 immunity in ulcerative colitis. Immunity. 2019;50(4):1099–1114 e1010. doi:10.1016/j.immuni.2019.02.006
 © 2023 The Author(s). This work is published and licensed by Dove Medical Press Limited. The full terms of this license are available at https://www.dovepress.com/terms.php and incorporate the Creative Commons Attribution - Non Commercial (unported, v3.0) License.
By accessing the work you hereby accept the Terms. Non-commercial uses of the work are permitted without any further permission from Dove Medical Press Limited, provided the work is properly attributed. For permission for commercial use of this work, please see paragraphs 4.2 and 5 of our Terms.
© 2023 The Author(s). This work is published and licensed by Dove Medical Press Limited. The full terms of this license are available at https://www.dovepress.com/terms.php and incorporate the Creative Commons Attribution - Non Commercial (unported, v3.0) License.
By accessing the work you hereby accept the Terms. Non-commercial uses of the work are permitted without any further permission from Dove Medical Press Limited, provided the work is properly attributed. For permission for commercial use of this work, please see paragraphs 4.2 and 5 of our Terms.