Back to Journals » Drug Design, Development and Therapy » Volume 13
Identification of substandard drug products using electronic tongue: cefdinir suspension as a pilot example
Authors Abu-Khalaf N ![]() , Zaid AN
, Zaid AN ![]() , Jaradat N
, Jaradat N ![]() , Alkilany AM, Abulateefeh SR
, Alkilany AM, Abulateefeh SR ![]() , Al Ramahi R
, Al Ramahi R ![]() , Ghanem M
, Ghanem M
Received 2 May 2019
Accepted for publication 11 July 2019
Published 16 September 2019 Volume 2019:13 Pages 3249—3258
DOI https://doi.org/10.2147/DDDT.S214228
Checked for plagiarism Yes
Review by Single anonymous peer review
Peer reviewer comments 2
Editor who approved publication: Professor Anastasios Lymperopoulos
Nawaf Abu-Khalaf,1 Abdel Naser Zaid,2 Nidal Jaradat,2 Alaaldin M Alkilany,3 Samer R Abulateefeh,3 Rowa Al Ramahi,2 Mashhour Ghanem4
1Department of Agricultural Biotechnology, College of Agricultural Sciences and Technology, Palestine Technical University-Kadoorie (PTUK), Tulkarm, Palestine; 2Department of Pharmacy, Faculty of Medicine and Health Sciences, An-Najah National University, Nablus, Palestine; 3Department of Pharmaceutics and Pharmaceutical Technology, School of Pharmacy, the University of Jordan, Amman 11942, Jordan; 4Department of Regulatory, Pharmacare PLC, Ramallah, Palestine
Correspondence: Abdel Naser Zaid
Department of Pharmacy, Faculty of Medicine and Health Sciences, An-Najah National University, B.O. Box 7, Nablus, Palestine
Email [email protected]
Background: Electronic tongue (ET) is a well-established technology that is used to detect the taste of a food or a medicinal product and to differentiate between different products based on their tastes. In addition, it can be used to monitor environmental parameters and biochemical and biological processes.
Purpose: This study aims to assess any correlation between the results of pharmacopeial quality control (ie, assay, impurities, and dissolution, etc) and ET analysis for reconstituted cefdinir (CR) suspension over 10 days (ie, shelf-life).
Methods: The reconstituted CR suspension was tested for several quality attributes such as dissolution behavior, pH, assay, related substances, and microbial contamination. An HPLC analytical method was verified and then used for chemical analysis. The taste of CR reconstituted suspension was followed over 10 days and was then compared with the quality control results. Moreover, Pearson’s correlation test was used to find a correlation between chemical analysis results and ET results.
Results: Pearson’s test of correlation showed a significant correlation (p-value <0.05) between the conventional chemical analysis results (% of CR, % of preservative, % of released CR, % of total impurities and % of total undefined impurities in the reconstituted suspension) with the change of their taste (ie, % pattern discrimination index). ET was able to correlate the results of stability of CR suspension with the change in the taste of the suspension during the shelf life of the reconstituted suspension.
Conclusion: The obtained results may suggest the use of ET as a new tool for a rapid assessment of the general quality of a suspension. Moreover, such results would suggest the use of ET to identify fake or substandard products, especially those have been stored under inappropriate storage conditions.
Keywords: electronic tongue, fake, substandard, cefdinir, taste
Introduction
The circulation of fake and substandard drug products, especially in developing countries, is a serious and dangerous problem.1 This resulted in an increasing number of dangerous clinical and public health concerns in these countries.2 In fact, there has been recently an increase in public awareness regarding the existence of fake and substandard pharmaceutical products.3,4 Although practically all types of drugs and pharmaceutical products could be counterfeited, the available data suggest that anti-infectious products are the most counterfeited products in these countries.1,5 Unfortunately, nowadays, there are fake products with extreme similarity to the original counterparts, which makes it very difficult to differentiate them by visual inspection.6 Problems include poor quality active ingredients, pollution, under or over-concentration of active ingredients, poor stability, a significant difference in pharmacological properties (bioavailability, efficacy and toxicity) and inappropriate packaging. Recently, many regulatory and international bodies including the world health organization (WHO) have established several initiatives to address the problem of counterfeited medicine, which calls for the development of analytical tools that can identify the counterfeited medicine in order to detect any substandard pharmaceutical product.7 Moreover, community pharmacists should be instructed to carry some simple quality control tests such as visual control, disintegration tests or simple color reaction tests. However, these tests reveal only very rough forgeries.8–10 Nowadays, more sophisticated chemical methods are available but unfortunately, most of these methods try to prove or disprove the identity and assay of an active pharmaceutical ingredient (API).11 But sometimes the objective is the discrimination between pure and fake medications, even when the fake drug contains the sufficient concentration of API.6 Electronic tongue (ET), is an analytical instrument comprising an array of non-specific, poorly selective chemical sensors with partial specificity (cross sensitivity)to different compounds in a solution, coupled to an appropriate chemometric tool for data processing.12
It was well proven that ET devices mimic the ability of the human tongue to detect the five basic tastes of sweet, sour, bitter, salty, and umami.13 The ET was successfully used in several pharmaceutical applications in our laboratory. It was used to evaluate the taste of clarithromycin oral pharmaceutical suspension available in the Palestinian market.14 Furthermore, ET was used to assess effectively the taste of Arum palaestinum, which is one of the famous wild plants used in the medical applications.14,15
Many analytical methods are available in the literature to assess the amount of cefdinir (CR), alone or in combination with other drugs, in the available pharmaceutical products.16–18 In addition, many other methods are available to assess its concentration in the biological fluids. To the best of our knowledge, none of these methods reported its suitability for dissolution studies.
This study aims to investigate the capacity of ET in the assessment of the general quality of drug products. For this purpose, CR reconstituted suspension was selected as a pilot example. The dry suspension was reconstituted, stored under the recommended storage conditions and was routinely analyzed (for 10 consecutive days) as per the requirement of the international guidelines for quality of drug product.19
After that, the results of analysis including drug content, related substances, and dissolution profile were compared with the signals obtained from ET.
Materials and methods
Chemicals and reagents
Cefdinir (CR) suspension produced by Pharmacare PLC (Ramallah, Palestine) and USP CR reference standard (RIs; Holland Moran, Holon, Israel) was used in this study. High-performance liquid chromatography (HPLC)-grade solvents such as acetonitrile and methanol were purchased from Sigma-Aldrich GmbH (Germany) and were used as received. Potassium dihydrogen phosphate, dibasic sodium phosphate, sodium hydroxide pellets, phosphoric acid, tetramethylammonium hydroxide (TMAH) solution, citric acid, and tetrahydrofuran were also purchased from Sigma-Aldrich (Germany). Purified water was obtained using a Millipore Milli-Q plus water purification system.
Instruments
An HPLC system (Merck–Hitachi, Kent, England) provided with model L-7100 pump, L-7200 autosampler, DAD L-7450 photodiode array detector, L-7300 column oven, and D-7000 software HSM Version 3.1 (Merck–Hitachi, Kent, England). The experimental conditions for HPLC were optimized using C18 chemically bonded column (3.9-mm×150-mm column that contains 4-µm packing L1) that was purchased from ACE (London, UK). The wavelength for CR detection was 254-nm. The flow rate was maintained at about 1.4 mL per minute. The resolution between CR and m-hydroxybenzoic acid was greater than 3.0; the tailing factor of the CR peak was not more than 2.0, and the relative standard deviation (RSD) for replicate injections of the standard preparation was not more than 1.0%. Weights were measured using Ohaus balance (Model DV215CD; Shekel Ltd, Israel); pH was identified using Mettler Toledo GmbH pH meter (Model S47-K; Agentek, Mettler Toledo, Switzerland).
An α-Astree ET device (α-MOS, Toulouse, France) was used for the experiment. The ET was equipped with an Ag/AgCl reference electrode, a 16-position auto-sampler and automatic stirrer. It has seven solid potential sensors that are chemically modified field effect transistors (ChemFET). These sensors consist of two parts: the sensitive layer and the transducer. These sensors are coated with the specific membrane (chemical compounds) to induce both cross sensitivity and cross selectivity. A reversible bond will form between specific molecules and the coated membrane leading to variation in potential between each sensor and Ag/AgCl reference electrode.20,21 The device has a software package for multivariate data analysis (ie chemometrics) named α-Soft version 14 (α-MOS, Toulouse, France), which also automatically collects and stores the sensors’ output signal.
Methods
General quality control of suspension
The obtained reconstituted CR suspension was tested for several quality attributes such as organoleptic properties, viscosity, dissolution behavior, pH, assay, related substances, and microbial contamination.
Assay and chromatographic conditions
The concentration of CR in the compounded suspension was measured using HPLC analytical method according to the United States Pharmacopoeia18 which was verified according to the FDA guidelines for analytical method verification.22 The optimum mobile phase was prepared by mixing 1L of citric acid buffer (citric acid buffer was prepared by dissolving 7.0 g of citric acid monohydrate in 1000 mL of water and adjusting with phosphoric acid to a pH of 2.0±0.05) with 111 mL of methanol and 28 mL of tetrahydrofuran.
The mobile phase was filtered with microporous filter (0.45 μm) and was degassed by sonication prior to use. A wavelength of 254 nm was used. The flow rate used was 1.4 mL/minute and the injection volume was 15 μL. The diluent was prepared by dissolving 10.65 g of anhydrous dibasic sodium phosphate and 3.40 g of monobasic potassium phosphate in 750 mL of water. The final pH, 7.0±0.05, was adjusted using phosphoric acid or sodium hydroxide, and then was diluted with water to 1000 mL. The peak was quantified by comparing the sample and standard peak area ratios as a function of concentration. Weights were measured using Ohaus balance; pH was identified using pH meter (Toledo GmbH).
Analytical verification
The method was verified according to the ICH guidelines.22,23 Parameters such as system suitability, selectivity, linearity, range, accuracy (recovery) and precision (reproducibility) were all revalidated. This analytical procedure validation was conducted using three trials of the product and one trial of the placebo product that was prepared in the laboratory. The dissolution test method for CR suspension, based on the assay test method, was also validated.
Solutions preparations
Precisely, 0.1 M phosphate buffer was prepared by dissolving 10.65 g of anhydrous dibasic sodium phosphate and 3.40 g of monobasic potassium phosphate in 750 mL of water. The pH was adjusted by phosphoric acid or sodium hydroxide to a pH of 7.0±0.05, and then the volume was reported to 1L using purified water. Concerning the mobile phase, it was prepared by mixing1L of the above-prepared phosphate buffer with 111 mL of methanol and 28 mL of tetrahydrofuran.
Concerning the preparation of CR Standard, this was prepared by placing an accurately weighed amount of USP CR RS into a proper volumetric flask and then dissolving it in 0.1 M phosphate buffer to obtain a solution that has a concentration of about 0.05 mg per mL of CR.
Concerning the assessment of assay, this was done by transferring quantitatively the contents of each bottle of reconstituted oral suspension into an appropriate flask and diluting with 0.1 M solution of phosphate buffer to achieve a solution that has a concentration of about 0.05 mg per mL of CR. With regard to the resolution solution, this was performed by accurately weighing the required quantities of USP Cefdinir RS and m-hydroxybenzoic acid into an appropriate volumetric flask. Then dissolve in 0.1 M solution of phosphate to obtain a solution that has a concentration of about 0.05 mg per mL of CR and about 0.175 mg per mL of m-hydroxybenzoic acid.
The mobile phase was prepared with variable mixtures of solution A and solution B as indicated in the chromatographic system. Solution A was prepared as a mixture of aqueous EDTA solution (0.4 mL, 0.1 M) and TMAH solution (1000 mL, 0.1% w/v, pH of 5.5±0.1). Solution B was a mixture of: TMAH solution (250 mL of 0.1% w/v), acetonitrile (150 mL), methanol (100 mL) and EDTA solution (0.2 mL, 0.1 M). To prepare a standard solution 1, an appropriate amount of USP CR RS was dissolved in phosphate buffer (0.1 M, pH of 7.0) to achieve a solution that has a concentration of 0.75 mg/mL. Then an appropriate amount of this resulting solution was diluted with 0.1% TMAH solution to achieve a solution that has a concentration of about 15 μg/mL. To prepare a standard solution 2, an appropriate amount of USP CR related compound A RS was dissolved in TMAH buffer (0.1% w/v) to achieve a solution that has a concentration of 0.04 mg/mL. To prepared a standard solution 3, an appropriate amount of USP CR related compound B RS was dissolved in phosphate buffer (0.1 M, pH of 7.0) to achieve a solution that has a concentration of 0.04 mg/mL. To prepare the “resolution solution”, accurately weighed USP CR RS (37.5 mg) were transferred into a 25-mL volumetric flask and then a solution of phosphate buffer (10 mL of 0.1 M) was added. After that, standard solutions 2 and 3 (5.0 mL of each), were added and the final solution was diluted with 0.1% w/v TMAH solution to the desired volume.
To prepare the “test solution”, proper volume of reconstituted oral suspension equivalent to 150 mg of CR was transferred into a 100-mL volumetric flask and then a solution of phosphate buffer was added (30 mL of 0.1 M) and the resulting solution was further diluted to the desired final volume with 0.1% w/v TMAH solution. Concerning the chromatographic system, the test solution is maintained at a temperature of 4±3 °C, and the column temperature was kept at 40±0.5°C. The flow rate was set about 1 mL per minute. The chromatograph is programmed for a runtime of about 60 mins, about 10 µL) of the resolution solution, standard solution 1, and the test solution were separately injected. Record the chromatograms and measure the peak responses. The resolution between the CR peak and the third peak of CR related compound A was higher than 1.5; the tailing factor of CR related compound B was not more than 1.5, and the relative standard deviation for the CR peak response in replicate injections of standard solution 1 is not higher than 2.0%. The percentage of individual specified and unspecified impurities in the portion of oral re-compounded suspension was calculated.
Taste assessment
Purified water was added to CR dry powder bottles to reconstitute the suspension according to the package insert instruction. All samples were randomly evaluated on the same day of measurement.
ET measurement, conditioning, calibration and diagnostic steps were carried out according to the manufacturer guidelines (α MOS, Toulouse, France).The samples were measured at a room temperature of 25 °C using a potentiometric α-Astree ET device, equipped with seven ChemFET potentiometric sensors designated by the manufacturer as BA, BB, GA, CA JB, HA and ZZ, an Ag/AgCl reference electrode (Metrohm, Ltd., Herisau, Switzerland), a mechanical stirrer (Metrohm, Ltd.) and a 16-position sample changer and a 759 Swing Head for sampling (Metrohm, Ltd.). The ET was connected to a computer with an installed α-Soft version 14 to automatically gather and store the outputs of the sensors (i.e. potentiometric values in Millevolte) for further analysis. Each sample measurement lasted for 2 mins. Between each measurement, 80 mL deionized water was used to clean the sensors for 10 s. Moreover, each sample was measured 6 times per cycle each day. The first, second and the sixth measurements were discarded in order to obtain the most stable possible potentiometric signals, according to our previous experience and manufacturer recommendations. Data for each sampler day was reduced (i.e. centered and standardized) for further multivariate data analysis. Three sensors namely CA, HA and ZZ were used for multivariate data analysis.
To investigate the relationship between these samples, the similarity test was carried out. The method is used to investigate the similarity relationship between samples, since it is not easy to reveal this relation in a linear model, like PCA. The test describes three parameters; i.e. group distance, probability value (p-value) and pattern discrimination index (%). In which, the greater the distance amongst the center of gravity of each group, the better the differences between groups are. However, this value does not take into account the groups’ dispersion. The dispersions occur due to poor reproducibility, inappropriate selection of sensors, sensor failure to discriminate the samples and the presence of too wide sample to sample variability. As a consequence, if two groups are widely dispersed and have a relatively large distance among their center of gravity, they are not considered significantly different. The p-value is a good mean for evaluating the discrimination of the compared groups. Wherein, the smallest the p-value is (ie, less than 0.05), the higher the probability that groups are discriminated. The highest the pattern discrimination index (%) the better the discrimination between samples, taking into account the dispersion issue between groups.21
Statistical analysis
For ET results, Principle Component Analysis (PCA) - which is a well-known method that is used with different types of odor and taste sensors –and similarity test were used for data exploration and discrimination study using α-Soft version 14 (α MOS, Toulouse, France).
Regarding statistical analysis, the SPSS program (version 21) was used. Moreover, Pearson correlation test was used to find a correlation between chemical analysis results and ET results. p-value <0.05 was considered to be statistically significant.
Results
The aim of this analysis is to verify and establish a correlation between assay method (USP method) and ET analysis for CR suspension. First, we confirmed that the assay method is effective and reproducible according to the validation parameters: System Suitability, Specificity, Linearity, Range, Accuracy, and Precision. Regarding the used analytical method, it was found to be valid for the assay of CR in the prepared suspension since all validation parameters were within the accepted levels as reported in Appendix 1.
Moreover, the parameters of the dissolution method were assessed and they were within the accepted criteria as summarized in Appendix 2.
The parameters of system suitability were assessed and they were within the acceptance criteria as also summarized in Appendix 3.
The related substances test was carried out according to United States Pharmacopeia (USP 33) method of analysis. All results were within the acceptable limit in the USP 33 as reported in the Appendices 4–8.
Concerning the results of quality of the final CR suspension (250 mg/5 mL), it was reconstituted using purified water and then placed on the shelf at room temperature for complete quality control such as physical microbial assessment and chemical analysis which, for example, showed decrease in the % w/v concentration of both CR and sodium benzoate from 103.4 to 100.1% w/v and from 103.9 to 100.4, respectively, while the total related impurities where increased from 1.62 to 4.49% w/v, as reported in Table 1.
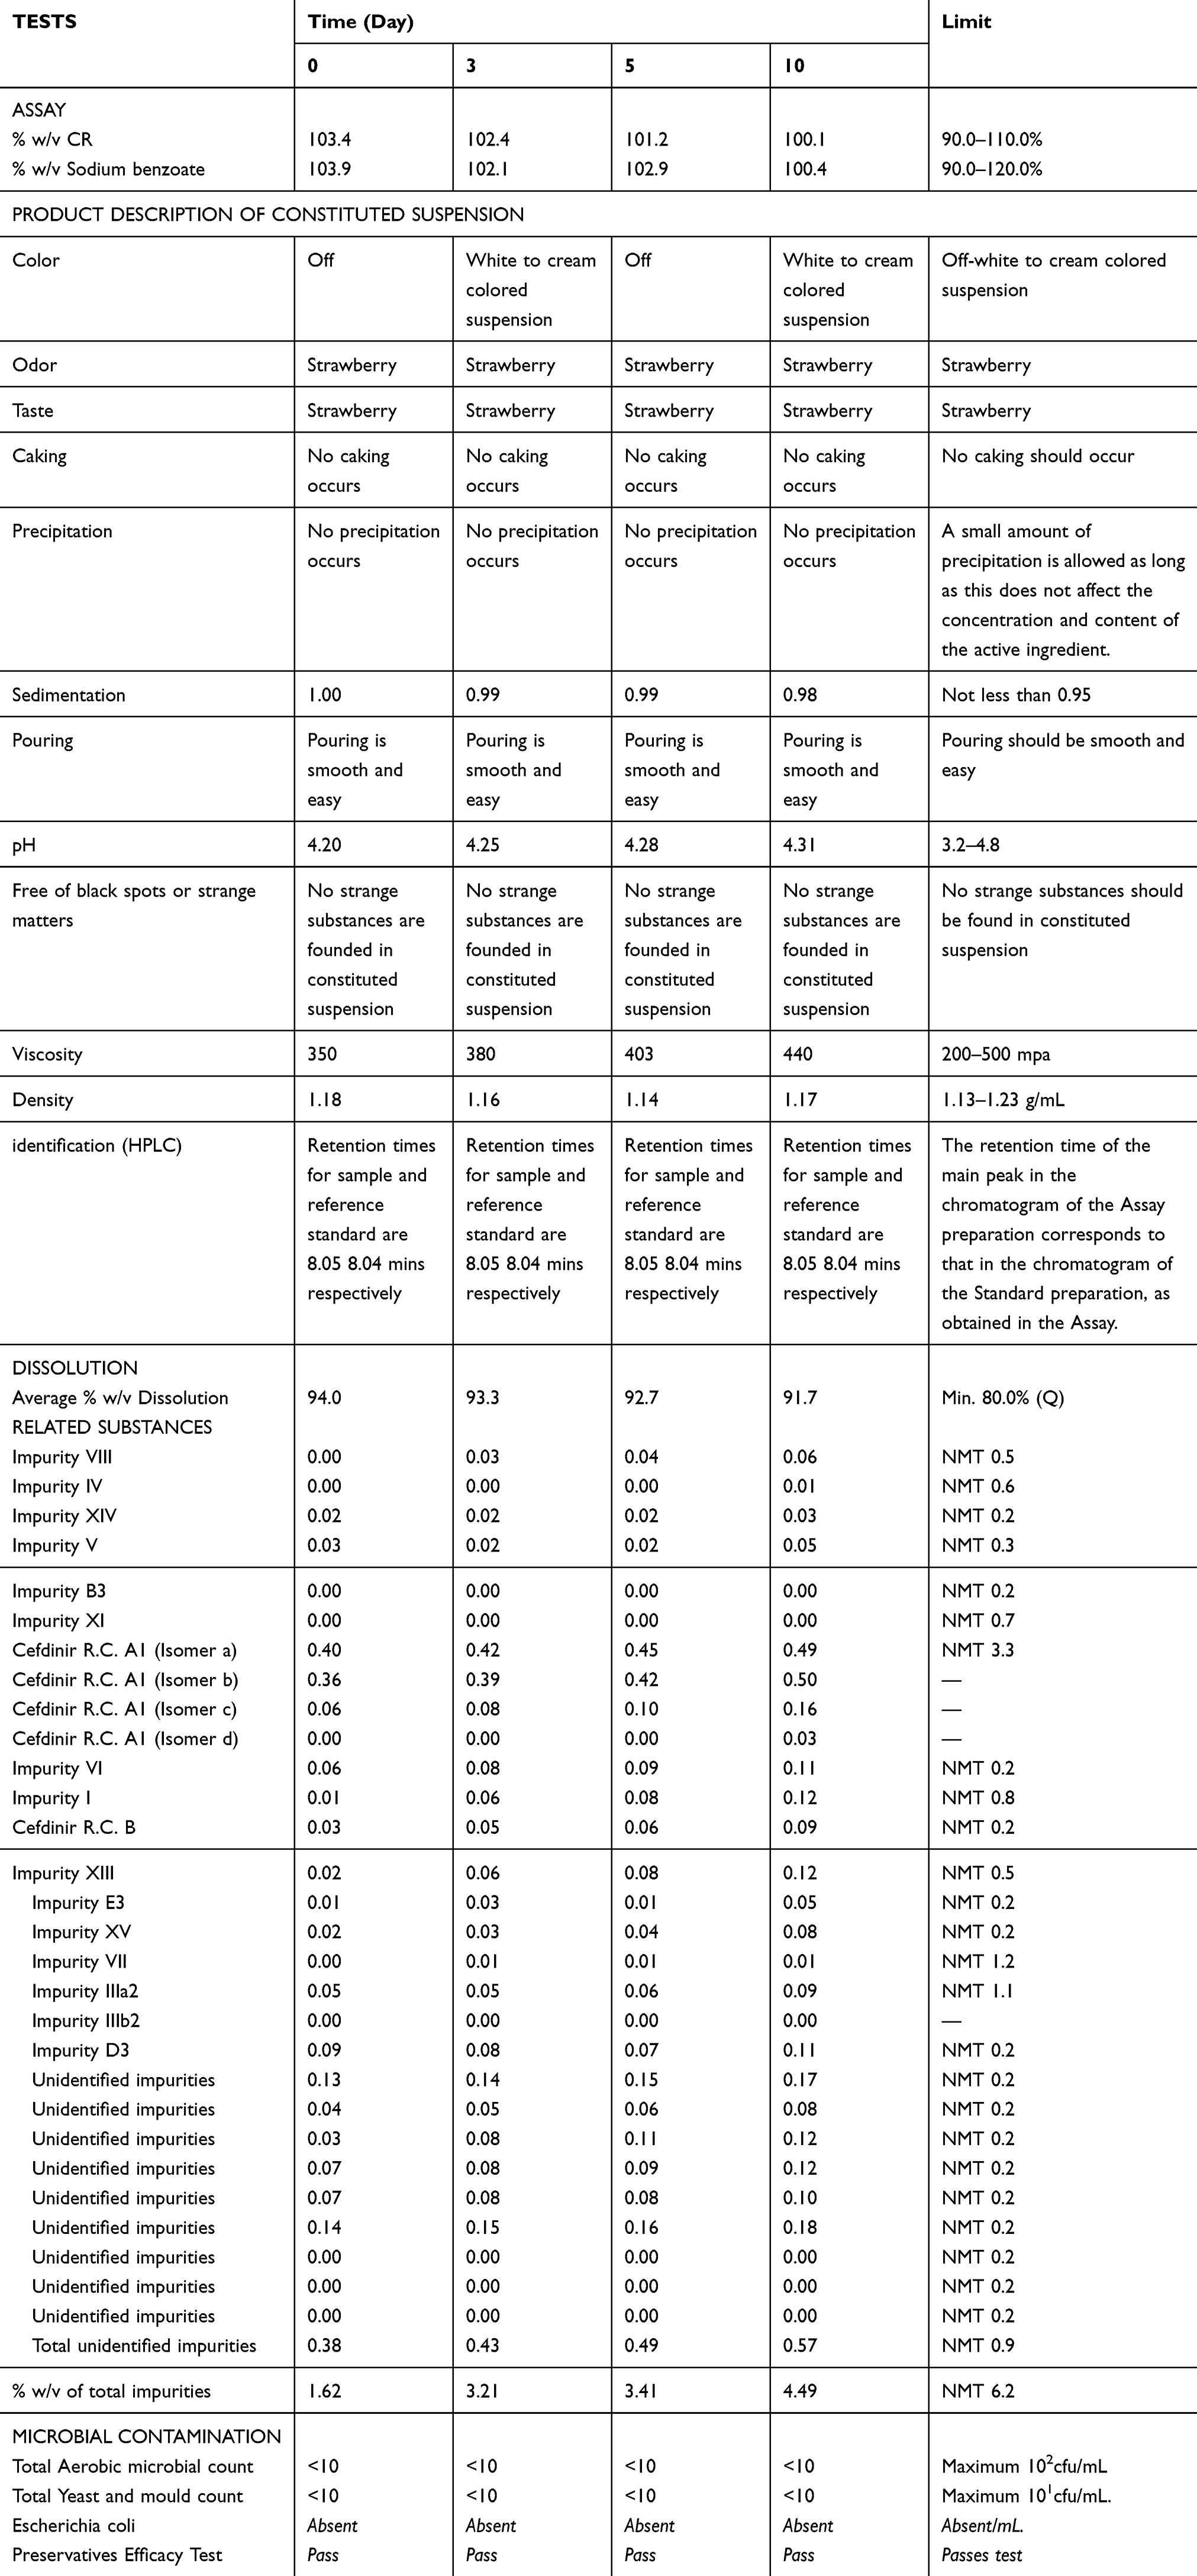 |
Table 1 Results of stability of CR reconstituted suspension |
The USP method was verified and revalidated according to the ICH guidelines for analytical validation development by testing parameters such as system suitability, linearity, selectivity, precision, range, accuracy, and robustness (Appendices 1–8). In fact, all tested parameters were within the accepted range according to the guidelines for the above-mentioned validation parameters.
Our results confirm the stability of the re-suspended CR suspension for the tested time interval (10 days) as evident from assay evaluation as well as preservative-related impurity testing (Table 1).
However, there is a trend of change in these parameters that were correlated with the change of the taste of the re-compounded suspensions as reported in Tables 1 and 2 as well as in Figures 1 and 2. For example, the % concentration of CR, showed a decrease from 103. 4% to 100.1% which correlated negatively with the distance from the original taste in the ET (r=−0.958, p=0.042). Moreover, % sodium benzoate decreased from 103.9% to 100.4% which correlated negatively with the distance of the taste in the ET although it was not statistically significant (r 0.919, p=0.081), while the total impurities showed an increase from 1.62% to 4.49% from day 0 to 10 days of assessment (Table 1), which also correlated with the distance from the original taste in the ET (r=−0.923, p=0.077).
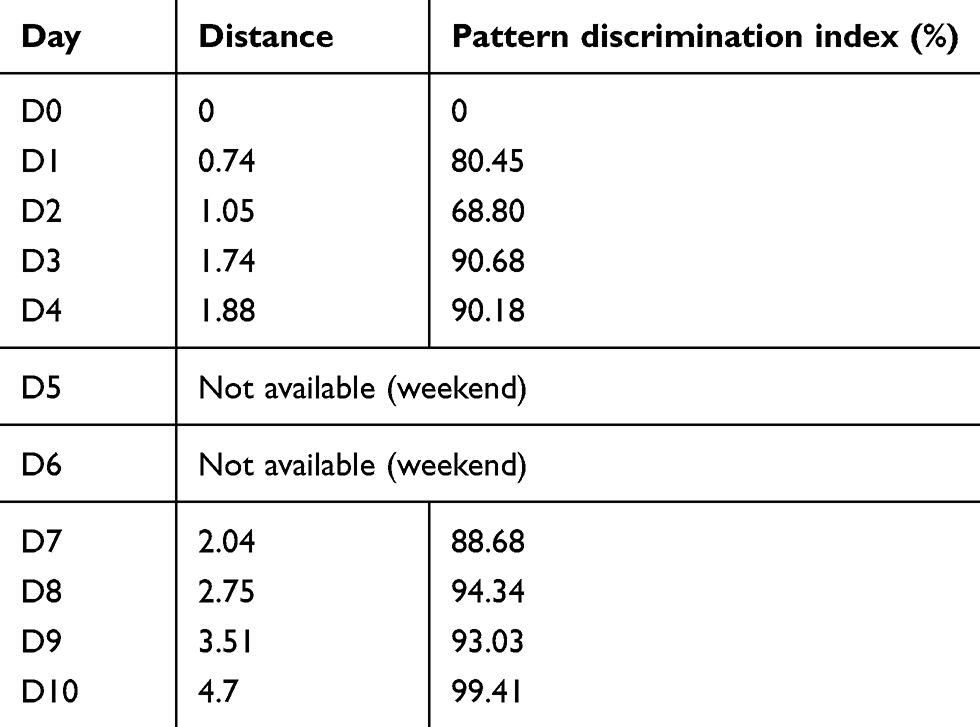 |
Table 2 Similarity test between samples at different days and the pattern discrimination index (p-value <0.05) |
To carry out the ET assessment, CR suspension was diluted in purified water and tested by ET daily for ten days (except weekend). The principal component analysis (PCA) scores plot (Figure 1) of the data shows very distinguished samples according to their analysis day. Two principal components explained about 96% of the total variation, which indicates that almost all data variation is explained. It can also be noticed that there is a clear trend that ET can follow the product according to the tested day (i.e. shelf life), which supports the idea of using ET for quality control.
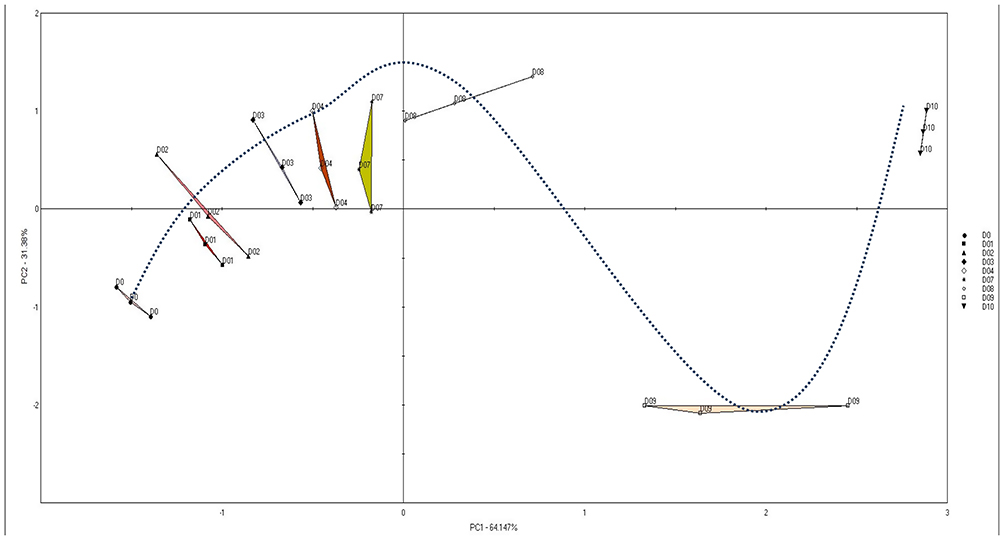 |
Figure 1 Scores plot of the PCA model for the samples during the test days. |
It can be shown how the scores plots of PCA are shifting from those of the initial day (Day 0) to form clear distinguished groups according to their testing day (Figure 1). In fact, the higher the distance between these groups the higher the change in the taste of the tested sample.
Table 2 shows that the distance between samples increases from day to day. The higher the distance between samples, the higher the difference in the taste and composition between them. Moreover, the pattern discrimination indices generally increase also. However, this index takes into account the difference between the centers of gravity and the dispersion of each group. The distance from the original taste and the pattern discrimination index were significantly correlated (r =0.789, p=0.018). Moreover, α-Soft version 14 (α-MOS, Toulouse, France) created a quality control model (SQC), which shows the difference in taste between the analyzed samples and the reference (i.e. Day 0 in our case). Regarding the taste of CR reconstituted suspension, a continuous change in the taste profile versus time was observed as shown in Figure 2 and Table 2. Pearson test of correlation showed significant correlation between the results of decrease in the concentration of CR (r=0.971, p=0.029), decrease in the concentration of sodium benzoate (r =0.953, p=0.047), amount of released CR (r=0.961, p=0.039), increase in the total impurities (r =−0.985, p=0.015) and increase in the total undefined impurities (r=−0.966, p=0.034) in the compounded suspension when plotted against the results of its % Pattern discrimination index (Figure 2).
 |
Figure 2 Correlation between assay of CR, % w/v of preservative, % w/v of total impurities and % w/v of total undefined impurities in the compounded suspension versus the results of its % pattern discrimination index. |
Discussion
In this study, full verification was conducted and the method was proved as reported in the appendices (Appendices 1–8). The results of the quality analysis showed a linear change in the critical quality parameters within the time. These changes were correlated with the changes in the taste of the CR suspension (light bitter with a strawberry flavor taste) using the ET. In fact, ET is a mature technology that is used to detect the taste of a food or a medicinal product and to differentiate between different products based on their tastes. The distance from the genuine product in ET analysis represents how much close is the taste of the tested product to the genuine or the references, light bitter with a strawberry flavor taste since the probe of the ET takes information from the chemistry of the sample. Therefore, we tried to find if there is a relationship between the results of chemical analyses of the tested CR suspension after reconstitution and the results of ET analysis. Accordingly, a verified HPLC analytical method was successfully conducted and used to assess both CR concentration and the known and unknown impurities as per the USP.24 After that a correlation between the release profile of CR from the suspension, the decrease of the assay of CR and the increase in the concentration of the impurities after reconstitution of CR suspension for 10 consecutive days was conducted and compared with the variation in the distance of the light bitter with a strawberry flavor taste of the suspension and the pattern discrimination index (%) (From 0 to 10 days) by the ET as reported in Table 2, Figures 1 and 2. Interestingly a significant correlation between chemical analysis and ET results was found for all variables, that indicates how the variation in the chemical analysis of the suspension corresponds to the waking or stepping away of the pattern discrimination index (%) from 0 to 10 days (Figures 1 and 2). This may suggest that using ET to compare the quality of the tested drug product with the genuine or the reference one may provide useful indications about the quality or the status (unfavorable storage conditions may alter its quality) of the product which at least may suggest to move for more sophisticated analysis in case of suspicion of a substandard or a counterfeit drug product.
Conclusion
Electronic tongue (ET) is considered one of the most important tools to assess the taste of food and pharmaceutical products. In this study, ET was able to significantly correlate the results of chemical stability of CR suspension with the change in the taste of the suspension. This may suggest the use of ET as a new tool for a rapid assessment of the quality of the suspension and accordingly if it is a fake or a substandard product by comparing its percentage of discrimination pattern index with the genuine product. Further studies should be carried out on more drug products to verify the effectiveness and reproducibility of this method on a wide range of pharmaceutical products.
Disclosure
Mashhour Ghanem is an employee of Pharmacare PLC. The authors declare no other conflicts of interest in this work.
References
1. World Health Organization. Counterfeit Drugs: Guidelines for the Development of Measures to Combat Counterfeit Drugs. Geneva: World Health Organization; 1999.
2. Shakoor O, Taylor R, Behrens R. Assessment of the incidence of substandard drugs in developing countries. Trop Med Int Health. 1997;2(9):839–845.
3. Mackey TK, Liang BA. The global counterfeit drug trade: patient safety and public health risks. J Pharm Sci. 2011;100(11):4571–4579. doi:10.1002/jps.22679
4. Afu S. Incidence of substandard drugs in developing countries. Trop Med Int Health. 1999;4(1):73–79.
5. Frankish H. WHO steps up campaign on counterfeit drugs. Lancet. 2003;362(9397):1730. doi:10.1016/S0140-6736(03)14891-X
6. Rodionova OY, Houmøller LP, Pomerantsev AL, et al. NIR spectrometry for counterfeit drug detection: a feasibility study. Anal Chim Acta. 2005;549(1–2):151–158. doi:10.1016/j.aca.2005.06.018
7. Caudron JM, Ford N, Henkens M, Mace C, Kiddle‐Monroe R, Pinel J. Substandard medicines in resource‐poor settings: a problem that can no longer be ignored. Trop Med Int Health. 2008;13(8):1062–1072. doi:10.1111/j.1365-3156.2008.02106.x
8. Kenyon A, Layloff T. Rapid Screening of Pharmaceuticals by Thin-layer Chromatography. St Louis (MO): US Food and Drug Administration, Division of Drug Analysis; 1994.
9. Preparations WECoSfP, World Health Organization. WHO Expert Committee on Specifications for Pharmaceutical Preparations: Thirty-ninth Report. Vol. 39. World Health Organization; 2005.
10. World Health Organization. Basic Tests for Pharmaceutical Dosage Forms. World Health Organization; 1991.
11. Arzamastsev A, Dorofeev V, Konovalov A, Kochin VY, Lebedeva N, Titov I. Determining adulterated drugs by modern analytical techniques. Pharm Chem J. 2004;38(3):166–169. doi:10.1023/B:PHAC.0000034308.08754.33
12. Holmberg M, Eriksson M, Krantz-Rülcker C, et al. 2nd workshop of the second network on artificial olfactory sensing (NOSE II). Sens Actuators B Chem. 2004;101(1–2):213–223. doi:10.1016/j.snb.2004.02.054
13. Baldwin EA, Bai J, Plotto A, Dea S. Electronic noses and tongues: applications for the food and pharmaceutical industries. Sensors. 2011;11(5):4744–4766. doi:10.3390/s110504744
14. Abu-Khalaf N, Zaid A, Jaradat N, et al. The taste of commercially available clarithromycin oral pharmaceutical suspensions in the palestinian market: electronic tongue and in vivo evaluation. Sensors. 2018;18(2):454. doi:10.3390/s18020454
15. Qneibi M, Jaradat N, Zaid AN, Abu-Khalaf N, Natsheh A-R, Hussen F. evaluation of taste, total phenols and antioxidant for fresh, roasted, shade dried and boiled leaves of edible Arum palaestinum Bioss. Marmara Pharm J. 2018;22:1. doi:10.12991/mpj.2018.40
16. Hashem H, Gouda AA, Hassan W. Development and validation of a rapid stability indicating chromatographic determination of cefdinir in bulk powder and dosage form using monolithic stationary phase. J Liq Chromatogr Relat Technol. 2012;35(12):1638–1648. doi:10.1080/10826076.2011.621154
17. Hamrapurkar P, Patil P, Phale M, Gandhi M, Pawar S. A developed and validated stability-indicating reverse-phase high performance liquid chromatographic method for determination of cefdinir in the presence of its degradation products as per International Conference on Harmonization guidelines. Pharm Methods. 2011;2(1):15–22. doi:10.4103/2229-4708.81085
18. USP-NF. Cefdinir for oral suspension. 2013 [Updated December 12, 2018]. Available from: https://www.uspnf.com/sites/default/files/usp_pdf/EN/USPNF/revisions/m2184_cefdinir_for_oral_solution.pdf.
19. World Health Organization. Stability testing of active pharmaceutical ingredients and finished pharmaceutical products. WHO Tech Rep Ser. 2009;953:87–123.
20. Haraguchi T, Yoshida M, Kojima H, Uchida T. Usefulness and limitations of taste sensors in the evaluation of palatability and taste-masking in oral dosage forms. Asian J Pharm Sci. 2016;11(4):479–485. doi:10.1016/j.ajps.2016.03.001
21. Alpha MOS. Astree II Manual Taste Sensor. France: Toulouse; 2009.
22. ICH E. Validation of Analytical Procedures: Text and Methodology. USA: ICH Steering Committee; 2005.
23. Harmonisation ICO Validation of analytical procedures: textand methodology Q2(r1). 1996. Available from: https://www.ich.org/fileadmin/Public_Web_Site/ICH_Products/Guidelines/Quality/Q2_R1/Step4/Q2_R1__Guideline.pdf.
24. Convention TUSP. Cefdinir for oral suspension. USP-NF. 2014.
 © 2019 The Author(s). This work is published and licensed by Dove Medical Press Limited. The
full terms of this license are available at https://www.dovepress.com/terms
and incorporate the Creative Commons Attribution
- Non Commercial (unported, 3.0) License.
By accessing the work you hereby accept the Terms. Non-commercial uses of the work are permitted
without any further permission from Dove Medical Press Limited, provided the work is properly
attributed. For permission for commercial use of this work, please see paragraphs 4.2 and 5 of our Terms.
© 2019 The Author(s). This work is published and licensed by Dove Medical Press Limited. The
full terms of this license are available at https://www.dovepress.com/terms
and incorporate the Creative Commons Attribution
- Non Commercial (unported, 3.0) License.
By accessing the work you hereby accept the Terms. Non-commercial uses of the work are permitted
without any further permission from Dove Medical Press Limited, provided the work is properly
attributed. For permission for commercial use of this work, please see paragraphs 4.2 and 5 of our Terms.