")
Back to Journals » Diabetes, Metabolic Syndrome and Obesity » Volume 13
Identification of Reactive Hypoglycemia with Different Basic BMI and Its Causes by Prolonged Oral Glucose Tolerance Test
Authors Lv X , Fang K, Hao W, Han Y, Yang N, Yu Q
Received 7 September 2020
Accepted for publication 29 October 2020
Published 2 December 2020 Volume 2020:13 Pages 4717—4726
DOI https://doi.org/10.2147/DMSO.S280084
Checked for plagiarism Yes
Review by Single anonymous peer review
Peer reviewer comments 2
Editor who approved publication: Prof. Dr. Antonio Brunetti
Xue Lv,1 Kun Fang,2 Wenqing Hao,1 Yuxin Han,1 Nailong Yang,1 Qing Yu1
1Department of Endocrinology and Metabolism, Affiliated Hospital of Qingdao University, Qingdao, Shandong, People’s Republic of China; 2Division of Health Management Center, Qingdao Municipal Hospital, Qingdao, Shandong, People’s Republic of China
Correspondence: Nailong Yang
Department of Endocrinology and Metabolism, Affiliated Hospital of Qingdao University, Qingdao University of Medicine, No. 1677, Wutai Mountain Road, Huangdao District, Qingdao, Shandong 266555, People’s Republic of China
Tel +86 18661806185
Email [email protected]
Qing Yu
Department of Endocrinology and Metabolism, Affiliated Hospital of Qingdao University, Qingdao University of Medicine, No. 1677, Wutai Mountain Road, Huangdao District, Qingdao, Shandong 266555, People’s Republic of China
Email [email protected]
Purpose: To identify the population susceptible to reactive hypoglycemia and explain the possible reasons for their susceptibility.
Methods: Ninety-four patients were divided into normal weight, overweight and obese groups before a 75-gram prolonged oral glucose tolerance test (POGTT). The incidence of reactive hypoglycemia (blood glucose ≤ 3.1 mmol/L or 55 mg/dL at points of 0– 4 hours) was compared among three groups, and blood glucose and insulin levels were monitored simultaneously from 0 - 4 hours to assess the level of insulin resistance and insulin sensitivity. Furthermore, the degree of insulin resistance among three groups and within each subgroup (whether hypoglycemia events occurred) was compared.
Results: Among the three groups, the incidence of hypoglycemia was significantly different at 3 (P=0.033) and 4 hours (P=0.020). At 4 hours, the incidence of reactive hypoglycemia in the obese group was approximately 3 times that in the normal weight group. The insulin level in obese group at 4 hours was nearly 4 times higher than that in normal group, and the same result also exists in the same subgroup of different groups. In addition, the hypoglycemia subgroup of obese group had higher insulin level than non-hypoglycemia (P=0.000). The homeostasis model assessment of insulin resistance index increased with increasing BMI among the three groups (P=0.000), while the Matsuda index decreased (P=0.000). The comparison of the homeostasis model assessment of insulin resistance index between subgroups in each group showed that the P values were 0.021, 0.038 and 0.085, successively, and the P values for the Matsuda index were 0.019, 0.013 and 0.119, respectively.
Conclusion: Obese people has higher rate of reactive hypoglycemia than other groups in POGTT, in which insulin resistance may play an important role. But patients who are evaluated for reactive hypoglycemia need to be observed for at least 3 or 4 hours.
Keywords: reactive hypoglycemia, prolonged oral glucose tolerance test, insulin resistance, low-carb ketogenic diet
Introduction
Glucose is the main energy supply of the human body. It maintains dynamic balance under the action of various mechanisms. More or less glucose in the blood, that is, diabetes or hypoglycemia, will cause corresponding damage; however, compared with that caused by diabetes, the harm caused by hypoglycemia is more rapid and serious.1 When the plasma glucose concentration is approximately 60mg/dL (3.3mmol/L), patients may have a series of autonomic nervous symptoms, including adrenergic symptoms such as tachycardia and tremor, and cholinergic symptoms such as sweating, nausea and hunger. When the plasma glucose concentration drops to 50mg/dL (2.8mmol/L) or below, the energy supply of vital organs such as the heart and brain is insufficient, and changes in vision, confusion, dizziness, forgetfulness, lethargy, seizures and even coma will occur.2 Hypoglycemia may be caused by a variety of reasons, such as increased endogenous insulin or low secretion of anti-insulin hormones, and organic lesions such as insulinoma, proliferation of islet β cells, or drug-induced hypoglycemia caused by overtreatment in patients with diabetes.3 But, clinically, we found that some nondiabetic patients often come to the clinic for tachycardia, cold sweats, hunger, tremor and other autonomic nervous symptoms 3–4 hours after a meal, that is, at 10:00 am and 3:00 pm. This kind of hypoglycemia is called reactive hypoglycemia (RH),4 which may be due to gastrointestinal dysfunction or insufficiency that leads to relative insulin secretion or increased insulin sensitivity, including some idiopathic functional hypoglycemia, often has no organic lesions; it occurs 2–5 hours after eating and does not easily attract attention but is a great hazard. Many daily activities are often disturbed by this type of hypoglycemic event, which is related to emotional ups and downs, irritability, and increased risk of falls, motor vehicle accidents, hospitalization and sudden death.5,6 Therefore, it is of great clinical value to identify and avoid the occurrence of hypoglycemia in these patients. Previous studies often focused on postprandial blood glucose of 1 hour and 2 hours but rarely focused on blood glucose at 3 hours and 4 hours after a glucose load. Consequently, the main purpose of this paper was to compare the incidence of RH among three groups. Second, by comparing the levels of blood glucose, insulin and the degree of insulin resistance among groups and subgroups, the relationship between insulin resistance and the occurrence of hypoglycemia were clarified.
Methods
Patients Enrolled
From June 2015 to February 2020, we collected data on 141 patients who agreed to participate and underwent a 75-grams oral glucose tolerance prolongation test (75g POGTT) as inpatients in the department of Endocrinology and Metabolism. The exclusion criteria were as follows: adolescents under the age of 18; patients with a previous history of mental disorders, cancer, or major cardiovascular, respiratory, and gastrointestinal diseases and post-surgery; patients with an acute medical history or pregnancy, lactation, etc.; and patients diagnosed with diabetes, Cushing syndrome, or primary aldosterone syndrome. Finally, 94 patients were included.
Grouping
All people underwent a 75g POGTT after giving informed consent (in this experiment, venous blood samples were taken to determine blood glucose and insulin for 0–4 hours before and after the glucose load), and people who did not meet the criteria were excluded. Finally, according to the basic conditions of the patients included in the study and the criteria defined by WHO,7 the patients were divided into three groups: the normal weight group (body mass index, BMI 18.5–24.9kg/m2), the overweight group (BMI 25–30kg/m2) and the obese group (BMI ≥30kg/m2) (Figure 1). The research was reviewed and approved by the institutional human ethics committee (QYFY WZLL 25924) for the Affiliated Hospital of Qingdao University in accordance with national guidelines and the provisions of the Helsinki Declaration, as revised in 2000.
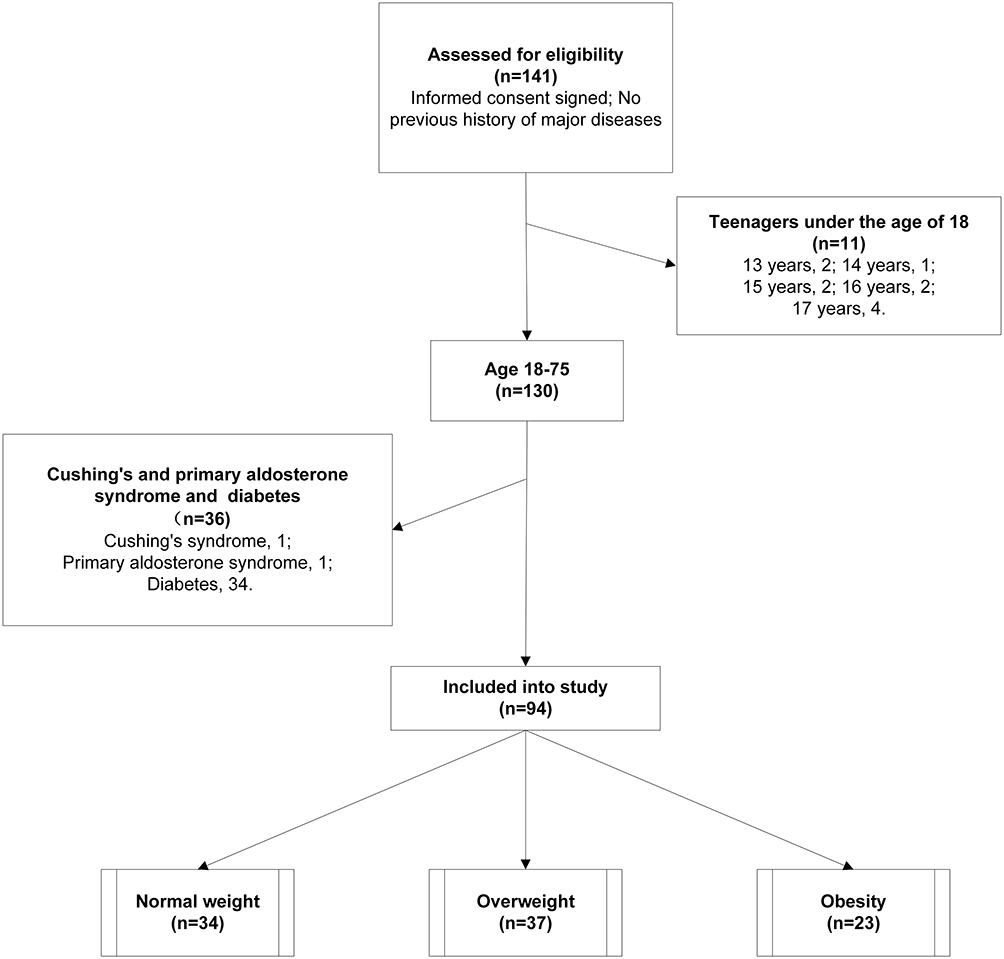 |
Figure 1 Flow diagram outlining patient screening process and grouping. |
Data Collection
The sex, age, height, weight, glycosylated hemoglobin (HbA1c), blood glucose and insulin before and glucose load test were collected, and then in view of the acceptability of patients, venous blood is taken every hour and sent to the clinical laboratory for evaluation. The normal range of related indicators in our hospital clinical laboratory are as follows: fasting blood glucose (3.9–6.16mmol/L), HbA1c (3.6–6.0%), fasting insulin (2.6–24.9 uIU/mL).
Mathematical Modeling
On the one hand, the level of insulin resistance was estimated by using Homeostasis Model Assessment of insulin resistance (HOMA-IR) proposed by Matthews et al.8 The formula is as follows:
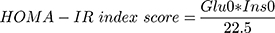
(Glu0 is fasting blood glucose in mmol/L and Ins0 is fasting insulin in uIU/mL).
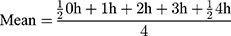
On the other hand, the function of islet β cells and the sensitivity of liver and peripheral tissues to insulin were evaluated by Matsuda dynamic index proposed by Matsuda and De Fronzo.9 The formula is as follows:

Glu0 and Ins0 are the same as above, Glu mean and Ins mean are the average value of blood glucose and insulin during the process of the POGTT, respectively. The formula is:
Statistics
The general characteristics of the data were described by using means and standard deviations (SD) for normally distributed data or by using medians and interquartile ranges (IQRs) for data that were skewed according to a test for normality. The normality evaluation of all data is described by Kolmogorov–Smirnov test.
In this study, hypoglycemia was defined as any blood glucose value ≤3.1mmol/L (55mg/dL) during the course of the POGTT. The correlation between the three levels of BMI and hypoglycemia events during the POGTT were analyzed by chi-square or Fisher’s exact test.
The comparison of blood glucose and insulin level between groups or subgroups (whether hypoglycemia occurred or not) should use one-way ANOVA or t tests if it accords with normal distribution, and nonparametric test if it does not.
Because of the skewed distribution of the HOMA-IR index scores and Matsuda index scores, the Kruskal–Wallis nonparametric test of multiple independent samples was used to compare the differences in insulin resistance levels and sensitivity among the three groups of quantitative data. The deltas in the two groups were then compared. The insulin resistance indexes of the subgroups were compared within each group, and t tests of two independent samples were carried out between the two subgroups had normal distributions; otherwise, the Mann–Whitney U nonparametric test of two independent samples was used.
P <0.05 shows that the difference is significant. All data analysis and graphic production are processed by SPSS Statistics 22.0 and Graph-pad Prism 7.0.
Results
Overall, 94 out of 141 people participated in the study, 11 people were excluded because they were teenagers, and 36 people were excluded because they were finally diagnosed with diabetes (34 people), primary aldosterone syndrome (1 person) and Cushing’s disease (1 person). The participants were divided into three groups according to BMI. The blood glucose and insulin levels were monitored 0–4 hours before and after the POGTT, and then insulin resistance or sensitivity index were calculated. The related data characteristics were depicted in “Table 1”. The ages of the normal weight group, overweight group and obese group were 46.56±12.45 years, 45.00±13.34 years and 38.09±12.27 years, respectively (P= 0.043); the obesity group was younger than the other groups, which is in line with the current general epidemiological trend. Because height and weight are related to BMI, there were differences among the three groups. Other baseline indicators, including sex (P=0.368), HbA1c (P=0.665) and fasting blood glucose (P=0.066), were not significantly different among the three groups. Fasting insulin levels had obvious differences among the three groups, which may be related to the relative hyperinsulinemia caused by different levels of insulin resistance (specific analysis and elaboration will be made in the discussion).
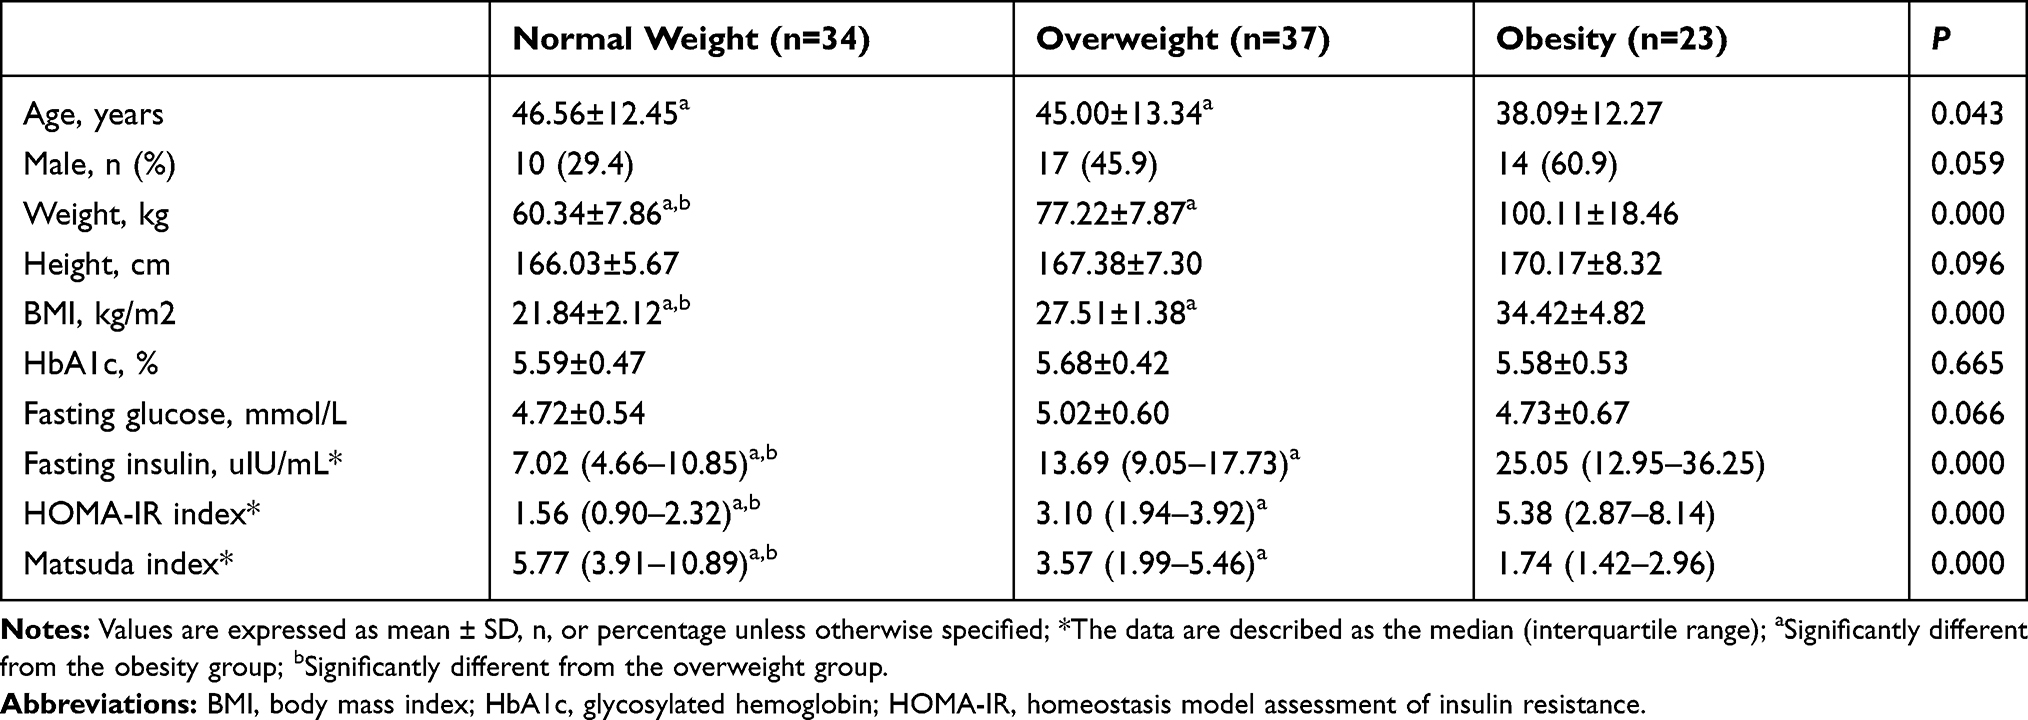 |
Table 1 Data Characteristics of Participants According to Body Mass Group |
Incidence of Hypoglycemia During the POGTT
In the course of the POGTT, the standard for hypoglycemia was≤3.1mmol/L (55mg/dL). There were almost no hypoglycemia events at 0, 1 and 2 hours, and the difference in hypoglycemia incidence among the groups was negligible.
However, at 3 hours, the overall distribution of hypoglycemia among the three groups showed a visible difference (P=0.033). The incidence of hypoglycemia in the obesity group (26.1%) was greater than that in the normal body weight group (5.9%), Fisher’s exact test showed P=0.051. Although the difference was not statistically significant, it was at the critical value; compared with the overweight group (5.4%) (P=0.045<0.05), the difference was statistically significant (Table 2). In addition, 2 people (8.7%) in the obesity group had severe hypoglycemia and blood glucose ≤2.8mmol/L or 50mg/dL (P=0.058).
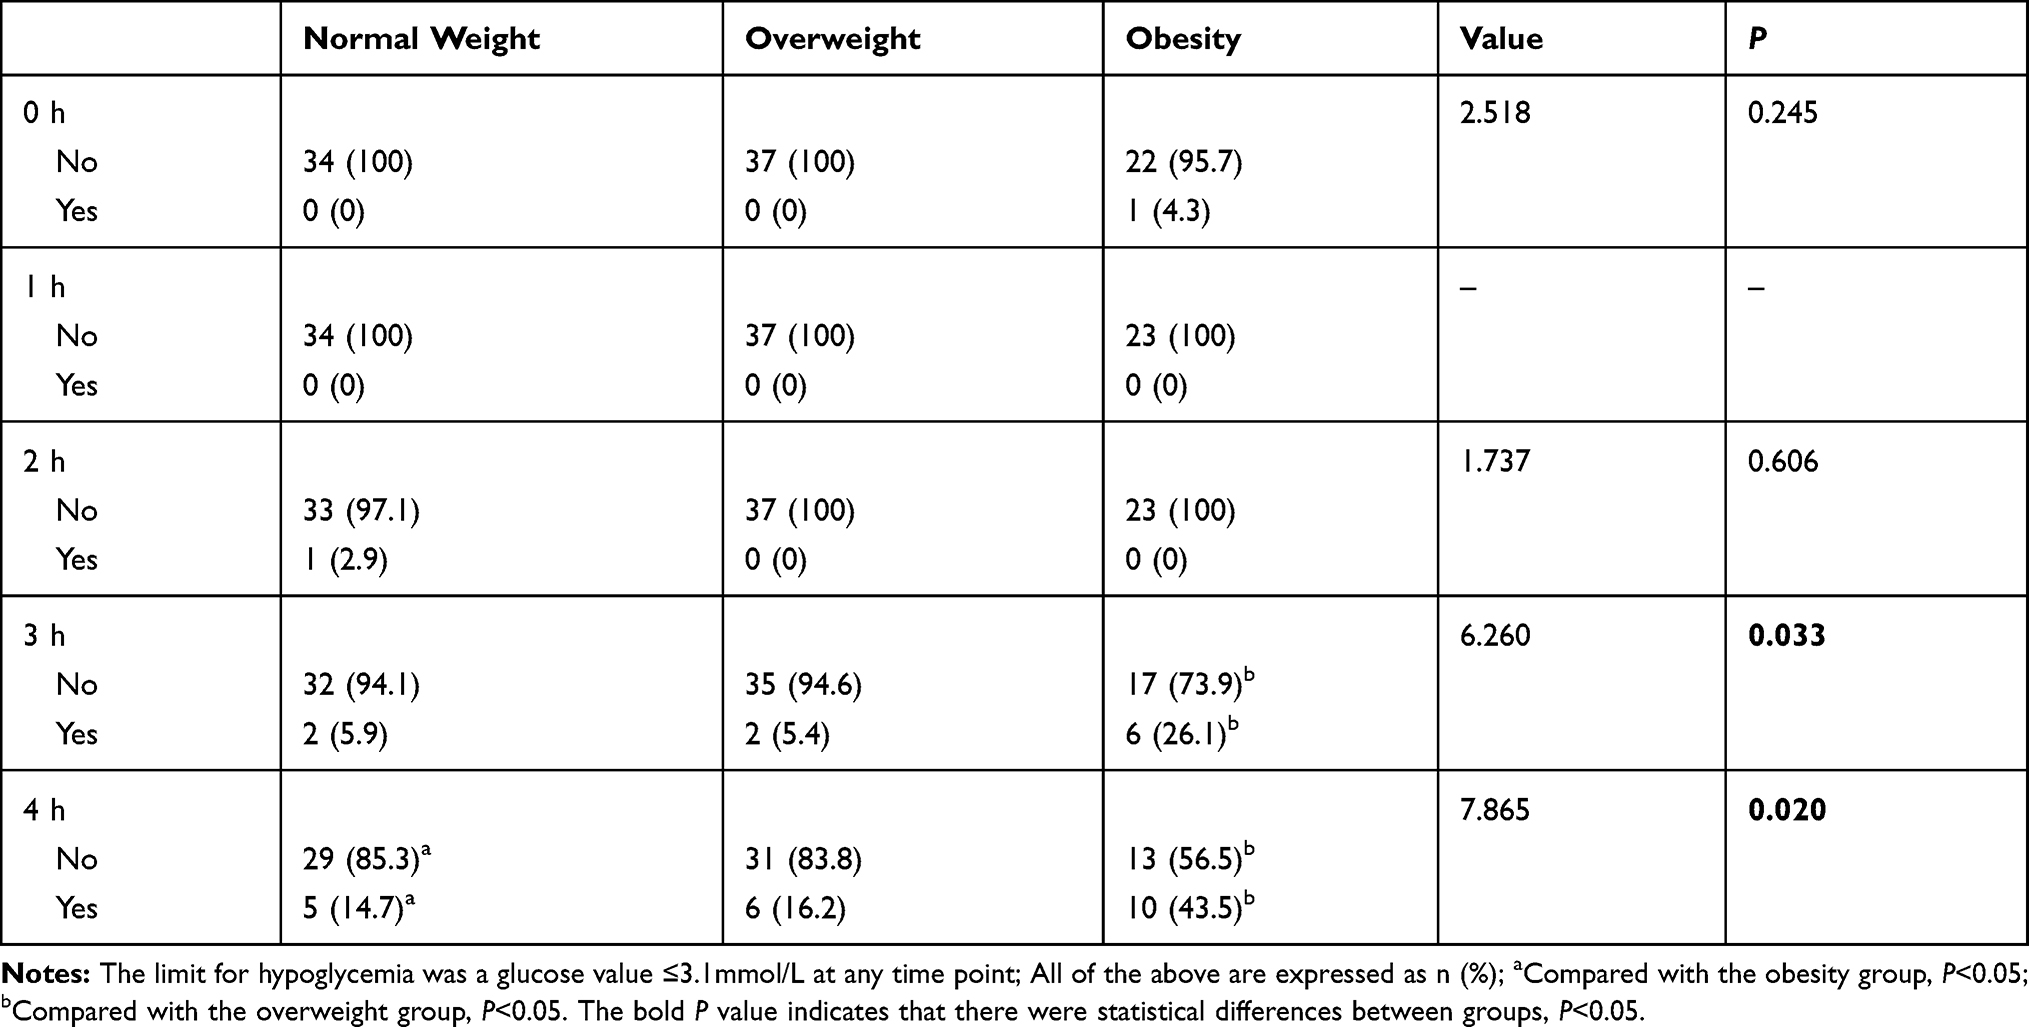 |
Table 2 Comparison of the Incidence of Hypoglycemia in Three Groups at Different Time Points |
At 4 hours, the incidence of hypoglycemia among the three groups was compared (P=0.020). The incidence of hypoglycemia at 4 hours in the obese group (43.5%) was approximately three times that in the normal group (14.7%) (P=0.016<0.05), and the incidence in the overweight group (16.2%) was significantly lower than that in the obese group (P=0.020<0.05); there was no obvious difference between the normal and overweight groups (Table 2). At 4 hours, the number of people with blood glucose ≤2.8 mmol/L or 50 mg/dL in the normal weight group, overweight group and obese group were 3 (8.8%), 2 (5.4%) and 4 (17.4%), respectively, P=0.322.
Combined with the line chart (Figure 2) of the hypoglycemia incidence at different time points in each group, as BMI increased, the incidence of hypoglycemia gradually increased. The lowest hypoglycemia of normal weight, overweight and obesity groups were 2.59 mmol/L, 2.59 mmol/L and 1.11 mmol/L respectively, and the obese group had more hypoglycemia and lower glucose level at 4 hours. However, there was no significant difference in hypoglycemia incidence between the overweight group and the normal weight group, which may be due to the relatively small sample size.
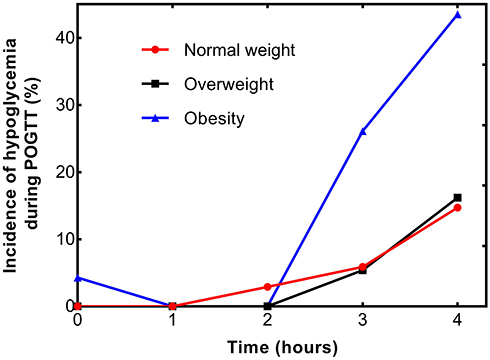 |
Figure 2 Hypoglycemia incidence at various time points (0, 1, 2, 3, 4 hours) during the POGTT process within three groups were presented in line chart. Abbreviation: POGTT, Prolonged Oral Glucose Tolerance Test. |
Blood Glucose and Insulin Levels Among Various BMI Groups
Under the condition that there was no obvious difference in ground glucose (Table 1), compared with the normal weight group, the glucose of obese group had a sharp decline trend, reaching the lowest value at 4 hours, while the group of overweight decline was relatively gentle. Although at 3 hours, there was no significant difference between normal weight group (5.21±1.57mmol/L) and obese group (4.51±1.33mmol/L), P=0.097, and overweight group (5.31±1.61mmol/L) vs obese group, P=0.051. At 4 hours, the glucose level was 4.14±1.29, 3.99±1.04 and 3.48±0.91mmol/L in normal weight group, overweight group and obesity group, respectively, among which the normal weight group was compared with obesity group, P=0.030, and the rest were with no significant difference between-groups (Figure 3A). In Figure 3B, the insulin in obesity group changed sharply and kept a relatively high state after glucose loading, while the overweight group was between the other two. With the extension of time, the glucose level in obesity group had almost returned to normal level at 3 hours, but the relatively high insulin level could still be observed at 4 hours, 6.94 (4.05–13.29) in the normal weight, 12.42 (7.00–30.76) in the overweight and 23.29 (11.96–30.50) uIU/mL in the obesity group, with significant difference between groups (P=0.000).
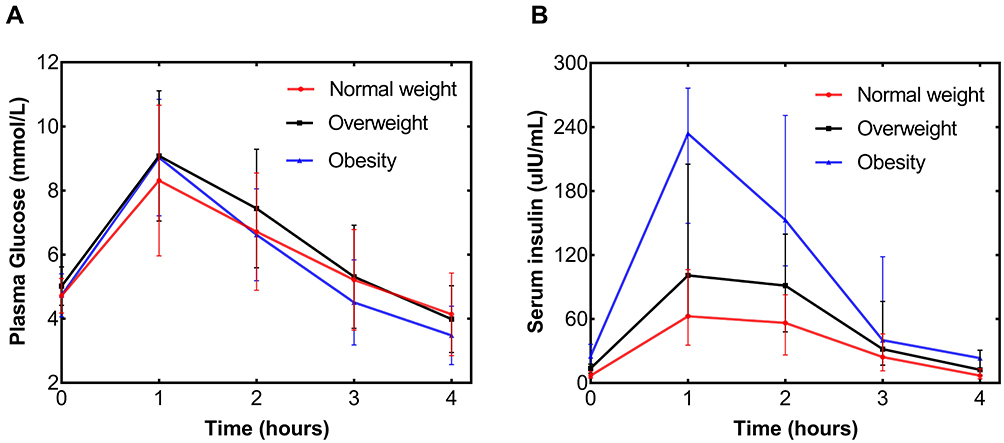 |
Figure 3 Plasma glucose (A) and serum insulin (B) levels of normal weight (solid red circle), overweight (solid black square), obesity (solid blue triangle) groups in 0, 1, 2, 3, 4 hours. |
Insulin Resistance Index Scores Among Various BMI Groups
As shown in Table 1, the HOMA-IR index, reflecting the degree of insulin resistance, and the Matsuda index, reflecting insulin sensitivity, were significantly different between groups (the overall differences were all P=0.000). The deltas in the two groups were then compared with the Kruskal–Wallis test. According to the comparison of the HOMA-IR index scores alone, the degree of insulin resistance increased with increasing BMI (Figure 4A): the normal weight group 1.56 (0.90–2.32) versus the overweight group 3.10 (1.94–3.92), P=0.001; the overweight group versus the obesity group 5.38 (2.87–8.14), P=0.016; and the normal weight group versus the obesity group, P=0.000. Similarly, the Matsuda index, which reflects the insulin sensitivity of the liver and peripheral tissues, gradually decreased with increasing BMI (Figure 4B): the normal weight group 5.77 (3.91–10.89) versus the overweight group 3.57 (1.99–5.46), P=0.002; the overweight group versus the obesity group 1.74 (1.42–2.96), P=0.026; and the normal weight group versus the obesity group, P=0.000. Islet resistance is consistent with insulin level in “Table 1”, which always increases with BMI. Under the same glucose load, the higher the insulin resistance, the more insulin needs to be secreted to maintain blood glucose homeostasis.
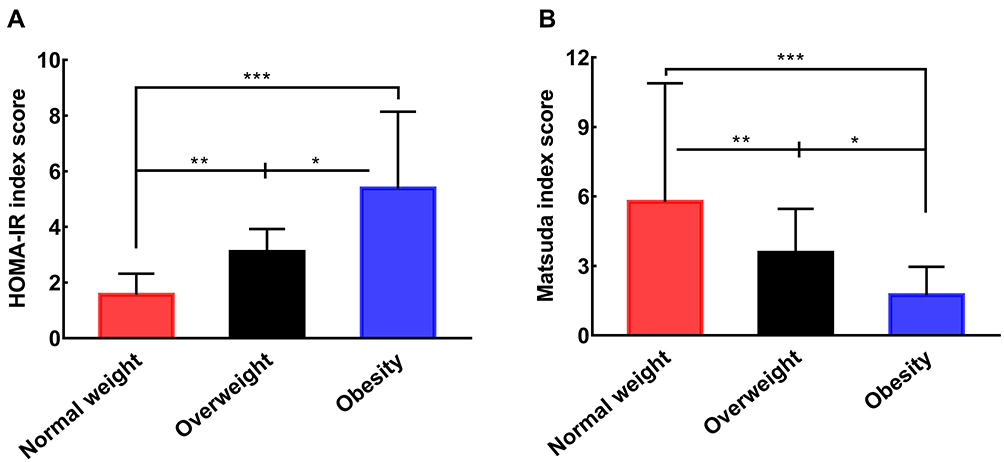 |
Figure 4 (A) Comparison of HOMA-IR index scores among three groups; (B) comparison of Matsuda index scores among three groups (*P<0.05; **P<0.005; ***P<0.0005). Abbreviation: HOMA-IR, Homeostasis model assessment of insulin resistance. |
Blood Glucose and Insulin Levels at 4 Hours Between Subgroups (Whether Hypoglycemia Events Occurred) in Each Group
Similarly, Figure 5 is a scatter plot of blood glucose and insulin levels in a subgroup (taking data at 4 hours as an example). In the hypoglycemia subgroup, the serum insulin level in obesity group 24.10 (13.53–33.55) was still higher than that in normal weight group 10.03 (3.84–19.64) (P=0.039), and the overweight 21.09 (10.99–47.67) uIU/mL was between them (Figure 5B), however, there was no significant difference in glucose level among the groups (P=0.208), and the values were 4.00±2.37, 3.17±0.56, 2.85±0.75 mmol/L respectively (Figure 5A). In like manner, the insulin values were 6.80 (3.89–12.82) in the normal weight, 12.09 (6.35–24.75) in the overweight, and 23.39 (10.64–27.77) uIU/mL in the obesity, showing a stepwise upward trend in the non-hypoglycemia subgroup (P=0.003), this is also consistent with the results obtained by Figure 4.
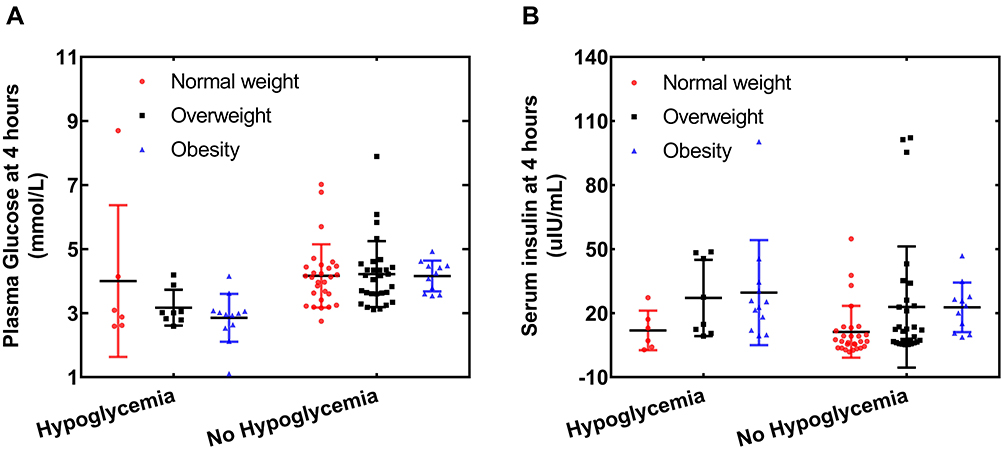 |
Figure 5 The scatter diagram of plasma glucose and serum insulin in each subgroup at 4 hours (A and B) were shown respectively. |
In addition, we also found that there was no significant difference in insulin level among different subgroups of normal weight group (P=0.676), and the same as in blood glucose level between hypoglycemia and non-hypoglycemia subgroups (P=0.877); although there were no significant differences in insulin level between subgroups of overweight (P=0.101) and obese group (P=0.786), obvious differences were observed in the hypoglycemia (3.17±0.56mmol/L) vs non-hypoglycemia (4.22±1.03mmol/L) of the overweight group, P=0.009, obesity group hypoglycemia (2.85±0.75mmol/L) vs non-hypoglycemia (4.16±0.48mmol/L), P = 0.000 (Figure 5).
Insulin Resistance Index Scores Between Subgroups in Each Group
Since reactive hypoglycemia events mainly occurred at 3 or 4 hours after the glucose load, within a group, people with blood glucose levels ≤3.1 mmol/L (55 mg/dL) at 3 or 4 hours were classified into one subgroup, and the rest, who were without hypoglycemia, were classified into another subgroup. In the normal weight, overweight and obesity groups, 6, 8 and 12 people had hypoglycemia at 3 hours or 4 hours, respectively.
The differences in the HOMA-IR scores, a static index, in the normal weight subgroup (P=0.021) and overweight subgroup (P=0.038) were significant (Table 3). Similarly, the differences in the Matsuda scores, a dynamic index, in the normal weight subgroups (P=0.019) and overweight subgroups (P=0.013) were marked (Table 4).
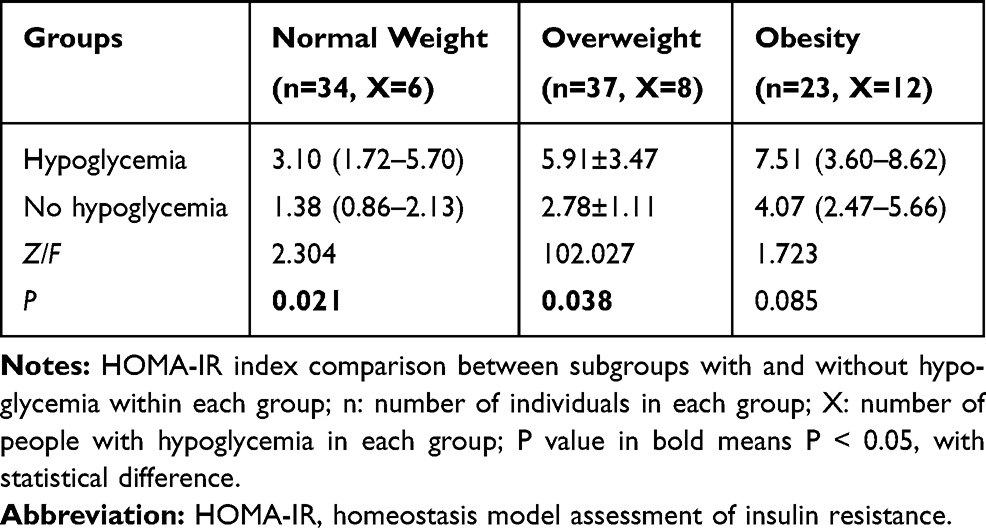 |
Table 3 Comparison of the HOMA-IR Index Among Subgroups with and without Hypoglycemia at 3 Hours or 4 Hours by BMI Group |
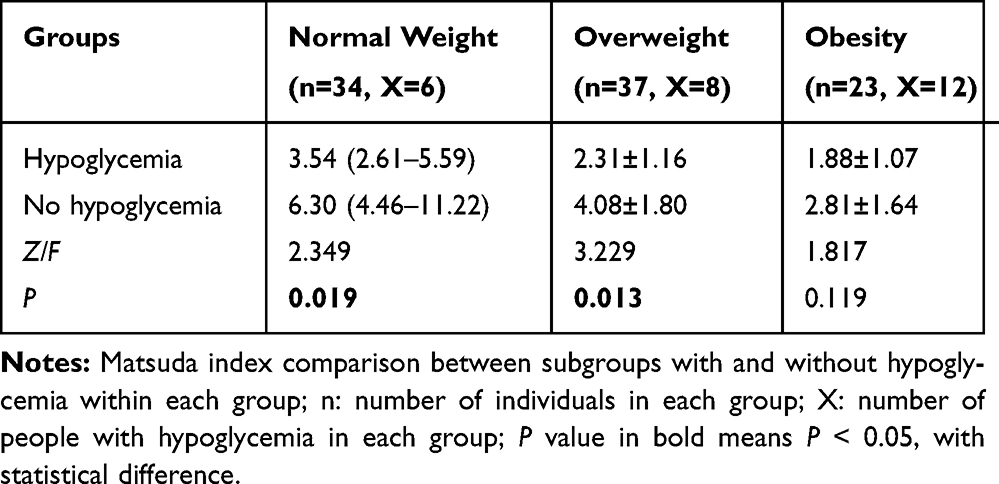 |
Table 4 Comparison of the Matsuda Index Among Subgroups with and without Hypoglycemia at 3 Hours or 4 Hours by BMI Group |
Surprisingly, in the obesity subgroups, the insulin resistance difference was not statistically significant (HOMA-IR index score P=0.085, Matsuda index score P=0.119). Combined with “Table 1 and Figure 3”, it can be seen that the two indexes increased or decreased with increasing BMI, except that there was no significant difference between obesity subgroups.
Adverse Events
No major adverse events were observed during the study.
Discussion
Except for the symptoms of hypoglycemia, such as palpitation and hand shaking, that will be relieved after taking sugar again (4 hours later), we used ≤3.1mmol/L (55mg/dL) as the main cutoff for severe hypoglycemia in the three groups of people. In 2017, ADA Hypoglycemia Research Group suggested that blood glucose <54mg/dL (3.0mmol/L) was defined as severe and clinically significant hypoglycemia.10 However, considering the possible huge harm of hypoglycemia, that a series of autonomic nervous symptoms may occur in patients with blood glucose values ≤3.3mmol/L (60mg/dL), besides, previous studies have taken this as the standard as well,1,11,12 3.1mmol/L (55mg/dL), which is in the middle, was selected as the limit.
The incidence of hypoglycemia among the three groups was not significantly different at 0–2 hours, while the results were opposite at 3 hours and 4 hours. Compared with that in the normal weight and overweight groups, the incidence of hypoglycemia in the obesity group was higher, and the blood glucose level was lower when hypoglycemia occurred. We have reason to believe that the occurrence of reactive hypoglycemia has a certain correlation with BMI grade, and with the increase in BMI grade, the incidence of hypoglycemia also increases. Although the difference in hypoglycemia incidence between the normal weight group and the overweight group was not obvious, there was an upward trend in terms of incidence alone.
Through Figure 3, it can be seen that under the same glucose load, overweight has higher insulin secretion than the normal weight group, but blood glucose decreases more slowly, indicating that insulin resistance may have appeared in overweight, which can be regarded as the transition from normal weight to obese people, compared with normal weight. The insulin level of obese patients has been in a high state, which shows that obese patients are not caused by islet β cell dysfunction, on the contrary, it may be due to insulin resistance in the early stage of the body leading to secondary hyperinsulinemia, of course, it may also be due to the untimely secretion of anti-insulin hormone resulting in a delayed hyperinsulinism, or in the late stage of glucose load, insulin sensitivity recovers to a certain extent, resulting in a decrease in blood sugar.
Figure 5 further illustrates this problem. With the increase of BMI, there is no significant change in blood glucose levels but an upward trend in insulin levels in both hypoglycemia and non-hypoglycemia subgroups, which may indicate the existence of insulin resistance and then lead to hyperinsulinemia. In addition, there was no difference in insulin levels between subgroups in each group, but for the overweight and obese groups, there were significant differences in glucose level, except for normal weight group, which may be due to different recovery degrees of insulin sensitivity in the later stage of glucose load. But whatever the reasons, this phenomenon cannot be observed in the first two hours, especially the decrease in glucose level at 3 and 4 hours.
Moreover, under the stimulation of the same amount of glucose, people with a higher degree of insulin resistance secrete more insulin to maintain the homeostasis of blood glucose, which coincides with the fact that the increase in insulin demand is directly proportional to weight gain.13–15 However, the decrease in insulin sensitivity, that is the decrease in insulin’s ability to respond to an increase in blood sugar, may lead to a delay in insulin secretion;16 relatively high insulin levels and delayed secretion of a large amount of insulin contribute to the occurrence of delayed hypoglycemia. As a result, in the alleged normal population, it is reasonable to suspect that insulin resistance may play a crucial role in delayed hypoglycemia.
In the study, we finally analyzed and compared the difference in insulin resistance between the two subgroups in each group by controlling BMI, etc. Insulin resistance exhibited significant differences between the two subgroups within the normal weight group and overweight group, and the subgroup with hypoglycemia had higher insulin resistance, which further shows the possible relationship between insulin resistance and the occurrence of RH. However, there was no significant difference between the two subgroups of the obesity group. This may be due to the relatively small sample size. On the other hand, it can be seen that insulin resistance gradually increases with increasing BMI, although there was no difference between the hypoglycemia and non-hypoglycemia subgroups in the obesity group, which may shows that insulin resistance of different degrees exists widely in obese people that has been proven in previous studies,15 the fact should be given more attention. After all, in the long run, hyperinsulinemia, which is an independent risk factor for type 2 diabetes,17 is inevitable, and then the increase of insulin level reacts to the insulin receptors on muscle18 and fat cells,19 which leads to the downregulation of receptor sensitivity, playing a “positive feedback” role in insulin resistance and thus forming a vicious circle. Furthermore, according to reports in the literature, people who are obese and have a history of hypoglycemia 4 hours after meals may be more prone to suffer from diabetes and thrombotic diseases.20–22 Of course, new and larger trials are necessary; at present, the limits of the HOMA-IR and Matsuda index to define the degree of insulin resistance are unclear. Although this experiment can effectively clarify the relationship between BMI and the incidence of insulin resistance and reactive hypoglycemia, the relatively small sample size is still the deficiency of this experiment.
In addition, OGTT is a crucial method of clinical diagnosis no matter which country in the world, while POGTT only extends the observation time on the original basis. The test itself has a strong generalizability and a certain acceptability of patients, besides, patients with obesity and pre-diabetes are everywhere, and reactive hypoglycemia lurks like a hidden killer. The easy-to-implement POGTT plays a key role in identifying and guiding follow-up interventions before the body forms organic diseases.
It is also necessary to mention that previous data reported that RH is largely influenced by patients’ diet and lifestyle (high carbohydrate, low fat diet, alcohol intake) and usually occurs 1–4 hours after meals.23 After sugar loading, 15 grams of carbohydrate will increase plasma glucose by approximately 75 mg/dL.24 If the increase in blood sugar is accompanied by insulin resistance, it may lead to excessive and delayed insulin secretion, resulting in relative hyperinsulinemia.25,26 Therefore, lifestyle change (such as a low-carbohydrate ketogenic diet) is still the main treatment method,27 although some drugs for treating diabetes, such as metformin, α-glucosidase inhibitor (AGI), dipeptidase-IV (DPP-IV) inhibitors, and glucagon-like peptide-1 receptor agonist (GLP-1 RA), may help people who are overweight or obese or who have a history of hypoglycemia.28,29
Conclusion
In short, we have reason to believe that obese people has higher rate of reactive hypoglycemia in POGTT than other groups, insulin resistance may play an important role. The POGTT can effectively identify early diabetes and reactive hypoglycemia and provide effective evaluation and screening. Patients who are evaluated for reactive hypoglycemia need to be observed for at least 3 or 4 hours. Incidentally, lifestyle changes, such as adopting a low-carbohydrate ketogenic diet and exercising, as well as the use of appropriate diabetes drugs, can effectively reduce the occurrence of hyperinsulinemia, further improve the degree of insulin resistance, prevent frequent hypoglycemia reactions, and reduce the risk of cardiovascular events and developing diabetes.
Acknowledgments
We wish to acknowledge the Department of Endocrinology and Metabolism, the Affiliated Hospital of Qingdao University for support and emergency assistance. Besides, this article did not receive any specific grant from any funding agency in the public, commercial or not-for-profit sector.
Disclosure
The authors report no conflicts of interest in this work.
References
1. Nilsson M, Jensen N, Gejl M, et al. Experimental non-severe hypoglycaemia substantially impairs cognitive function in type 2 diabetes: a randomised crossover trial. Diabetologia. 2019;62(10):1948–1958. doi:10.1007/s00125-019-4964-4
2. Kittah NE, Vella A. Management of endocrine disease: pathogenesis and management of hypoglycemia. Eur J Endocrinol. 2017;177(1):R37–R47. doi:10.1530/EJE-16-1062
3. Douillard C, Jannin A, Vantyghem MC. Rare causes of hypoglycemia in adults. Ann Endocrinol. 2020;81(2–3):110–117. doi:10.1016/j.ando.2020.04.003
4. Hall M, Walicka M, Traczyk I. [Reactive hypoglycemia - an interdisciplinary approach of the disease of XXI Century]. Wiadomosci Lekarskie. 2020;73(2):384–389. Polish.
5. Lavernia F, Kushner P, Trence D, Rice D, Dailey G, Kuritzky L. Recognizing and minimizing hypoglycemia: the need for individualized care. Postgrad Med. 2015;127(8):801–807. doi:10.1080/00325481.2015.1086628
6. Unger J. Educating patients about hypoglycemia prevention and self-management. Clin Diabetes. 2013;31(4):179. doi:10.2337/diaclin.31.4.179
7. Kurisu S, Ikenaga H, Watanabe N, et al. Implications of World Health Organization classification for body mass index on the correlations between common electrocardiographic indexes for left ventricular hypertrophy and left ventricular mass. Clin Exp Hypertens. 2016;38(8):715–720. doi:10.1080/10641963.2016.1200604
8. Matthews DR, Hosker JP, Rudenski AS, Naylor BA, Treacher DF, Turner RC. Homeostasis model assessment: insulin resistance and beta-cell function from fasting plasma glucose and insulin concentrations in man. Diabetologia. 1985;28(7):412–419. doi:10.1007/BF00280883
9. Matsuda M, DeFronzo RA. Insulin sensitivity indices obtained from oral glucose tolerance testing: comparison with the euglycemic insulin clamp. Diabetes Care. 1999;22(9):1462–1470. doi:10.2337/diacare.22.9.1462
10. Standards of medical care in diabetes-2017: summary of revisions. Diabetes Care. 2017;40(Suppl 1):S4–s5. doi:10.2337/dc17-S003
11. Avari P, Ramli R, Reddy M, Oliver N, Fothergill R. Rationale and protocol for the assessment of impact of real-time continuous glucose monitoring on people presenting with severe hypoglycaemia (AIR-CGM) study. BMC Endocr Disord. 2019;19(1):110. doi:10.1186/s12902-019-0439-3
12. Capristo E, Panunzi S, De Gaetano A, et al. Incidence of hypoglycemia after gastric bypass vs sleeve gastrectomy: a randomized trial. J Clin Endocrinol Metab. 2018;103(6):2136–2146. doi:10.1210/jc.2017-01695
13. UK Prospective Diabetes Study (UKPDS) Group. Effect of intensive blood-glucose control with metformin on complications in overweight patients with type 2 diabetes (UKPDS 34). UK Prospective Diabetes Study (UKPDS) Group. Lancet. 1998;352(9131):854–865. doi:10.1016/S0140-6736(98)07037-8
14. Lindström TH, Arnqvist HJ, von Schenck HH. Effect of conventional and intensified insulin therapy on free-insulin profiles and glycemic control in NIDDM. Diabetes Care. 1992;15(1):27–34. doi:10.2337/diacare.15.1.27
15. Erion KA, Corkey BE. Hyperinsulinemia: a Cause of Obesity? Curr Obes Rep. 2017;6(2):178–186. doi:10.1007/s13679-017-0261-z
16. Wang X, Zhao X, Zhou R, et al. Delay in glucose peak time during the oral glucose tolerance test as an indicator of insulin resistance and insulin secretion in type 2 diabetes patients. J Diabetes Investig. 2018;9(6):1288–1295.
17. Weyer C, Hanson RL, Tataranni PA, Bogardus C, Pratley RE. A high fasting plasma insulin concentration predicts type 2 diabetes independent of insulin resistance: evidence for a pathogenic role of relative hyperinsulinemia. Diabetes. 2000;49(12):2094–2101. doi:10.2337/diabetes.49.12.2094
18. Nolan CJ, Ruderman NB, Kahn SE, Pedersen O, Prentki M. Insulin resistance as a physiological defense against metabolic stress: implications for the management of subsets of type 2 diabetes. Diabetes. 2015;64(3):673–686. doi:10.2337/db14-0694
19. Rajan S, Shankar K, Beg M, et al. Chronic hyperinsulinemia reduces insulin sensitivity and metabolic functions of brown adipocyte. J Endocrinol. 2016;230(3):275–290. doi:10.1530/JOE-16-0099
20. Altuntas Y. Postprandial reactive hypoglycemia. Med Bull Sisli Etfal Hosp. 2019;53(3):215–220.
21. Malone JI, Hansen BC. Does obesity cause type 2 diabetes mellitus (T2DM)? Or is it the opposite? Pediatr Diabetes. 2019;20(1):5–9. doi:10.1111/pedi.12787
22. Chow E, Iqbal A, Walkinshaw E, et al. Prolonged prothrombotic effects of antecedent hypoglycemia in individuals with type 2 diabetes. Diabetes Care. 2018;41(12):2625–2633.
23. Malik S, Mitchell JE, Steffen K, et al. Recognition and management of hyperinsulinemic hypoglycemia after bariatric surgery. Obes Res Clin Pract. 2016;10(1):1–14. doi:10.1016/j.orcp.2015.07.003
24. Freeland B. Hypoglycemia in diabetes mellitus. Home Healthcare Now. 2017;35(8):414–419. doi:10.1097/NHH.0000000000000584
25. Ferrannini E, Natali A, Bell P, Cavallo-Perin P, Lalic N, Mingrone G. Insulin resistance and hypersecretion in obesity. European Group for the Study of Insulin Resistance (EGIR). J Clin Invest. 1997;100(5):1166–1173. doi:10.1172/JCI119628
26. Isken F, Weickert MO, Tschöp MH, et al. Metabolic effects of diets differing in glycaemic index depend on age and endogenous glucose-dependent insulinotrophic polypeptide in mice. Diabetologia. 2009;52(10):2159–2168. doi:10.1007/s00125-009-1466-9
27. Castellana M, Conte E, Cignarelli A, et al. Efficacy and safety of very low calorie ketogenic diet (VLCKD) in patients with overweight and obesity: a systematic review and meta-analysis. Rev Endocr Metab Disord. 2020;21(1):5–16. doi:10.1007/s11154-019-09514-y
28. Brun JF, Fedou C, Mercier J. Postprandial reactive hypoglycemia. Diabetes Metab. 2000;26(5):337–351.
29. Lin C-H, Shao L, Zhang Y-M, et al. An evaluation of liraglutide including its efficacy and safety for the treatment of obesity. Expert Opin Pharmacother. 2020;21(3):275–285. doi:10.1080/14656566.2019.1695779
 © 2020 The Author(s). This work is published and licensed by Dove Medical Press Limited. The full terms of this license are available at https://www.dovepress.com/terms.php and incorporate the Creative Commons Attribution - Non Commercial (unported, v3.0) License.
By accessing the work you hereby accept the Terms. Non-commercial uses of the work are permitted without any further permission from Dove Medical Press Limited, provided the work is properly attributed. For permission for commercial use of this work, please see paragraphs 4.2 and 5 of our Terms.
© 2020 The Author(s). This work is published and licensed by Dove Medical Press Limited. The full terms of this license are available at https://www.dovepress.com/terms.php and incorporate the Creative Commons Attribution - Non Commercial (unported, v3.0) License.
By accessing the work you hereby accept the Terms. Non-commercial uses of the work are permitted without any further permission from Dove Medical Press Limited, provided the work is properly attributed. For permission for commercial use of this work, please see paragraphs 4.2 and 5 of our Terms.