")
Back to Journals » OncoTargets and Therapy » Volume 11
Identification of prognostic risk factors for esophageal adenocarcinoma using bioinformatics analysis
Authors Dong Z , Wang J , Zhan T, Xu S
Received 10 November 2017
Accepted for publication 7 April 2018
Published 25 July 2018 Volume 2018:11 Pages 4327—4337
DOI https://doi.org/10.2147/OTT.S156716
Checked for plagiarism Yes
Review by Single anonymous peer review
Peer reviewer comments 2
Editor who approved publication: Dr Yao Dai
Zhiyu Dong, Junwen Wang, Tingting Zhan, Shuchang Xu
Department of Gastroenterology, Tongji Hospital, Tongji University School of Medicine, Shanghai, China
Purpose: Esophageal adenocarcinoma (EAC) is the most common type of esophageal cancer in Western countries. It is usually detected at an advanced stage and has a poor prognosis. The aim of this study was to identify key genes and miRNAs in EAC.
Methods: The mRNA microarray data sets GSE1420, GSE26886, and GSE92396 and miRNA data set GSE16456 were downloaded from the Gene Expression Omnibus database. Differentially expressed genes (DEGs) and differentially expressed miRNAs (DEMs) were obtained using R software. Functional enrichment analysis was performed using the DAVID database. A protein–protein interaction (PPI) network and functional modules were established using the STRING database and visualized by Cytoscape. The targets of the DEMs were predicted using the miRecords database, and overlapping genes between DEGs and targets were identified. The prognosis-related overlapping genes were identified using Kaplan–Meier analysis and Cox proportional hazard analysis based on The Cancer Genome Atlas (TCGA) database. The differential expression of these prognosis-related genes was validated using the expression matrix in the TCGA database.
Results: Seven hundred and fifteen DEGs were obtained, consisting of 313 upregulated and 402 downregulated genes. The PPI network consisted of 281 nodes; 683 edges were constructed and 3 functional modules were established. Forty-four overlapping genes and 56 miRNA–mRNA pairs were identified. Five genes, FAM46A, RAB15, SLC20A1, IL1A, and ACSL1, were associated with overall survival or relapse-free survival. FAM46A and IL1A were found to be independent prognostic indicators for overall survival, and FAM46A, RAB15, and SLC20A1 were considered independent prognostic indicators for relapse-free survival. Among them, the overexpression of RAB15 and SLC20A1 and lower expression of ACSL1 were also identified in EAC tissues based on the expression matrix in the TCGA database.
Conclusion: These prognosis-related genes and differentially expressed miRNA have provided potential biomarkers for EAC diagnosis and treatment.
Keywords: esophageal adenocarcinoma, differential expression genes, functional enrichment analysis, Kaplan–Meier analysis, Cox proportional hazard analysis
Introduction
Esophageal cancer is the eighth most common and sixth most fatal cancer worldwide.1 More than 450,000 people are afflicted with esophageal cancer characterized by early metastasis and poor prognosis every year.2 Esophageal adenocarcinoma (EAC), a type of esophageal cancer, is the most common type in Western countries. Owing to the lack of adequate diagnosis methods, EAC is usually detected at an advanced stage. Despite improvements in diagnosis and treatment, the overall survival rate of EAC is still lower than for other solid tumors. Thus, with regard to more efficient diagnostic methods in early stages and the molecular mechanisms underlying EAC, further research is needed to improve prevention, therapeutic strategies, and prognosis.
Molecular markers have potential as predictive and prognostic markers in EAC. Immunohistochemical results from a clinical study revealed that epidermal growth factor receptor expression in EAC is closely related to nodal metastasis, pathological stage, and reduced overall survival.3 The expression of E-cadherin, α-catenin, and β-catenin in EAC is also associated with overall survival.4 In terms of blood-based biomarkers, the combination of Fas ligand and anti-NY-ESO-1 was identified as a useful diagnostic method, with a sensitivity and specificity for detection of EAC of 88.9% and 100%, respectively.5 As for miRNA biomarkers, miR-196a, miR-25, miR-93, and miR-221/222 are considered as oncogenic miRNAs in EAC,6 while the combination of expression of miR-133a-3p, miR-382-5p, and miR-451a in plasma is thought to be an effective method to distinguish EAC from controls.7 However, these biomarkers are not suitable for clinical use owing to their low specificity and sensitivity or lack of clinical evidence. Accordingly, it is worth investigating the molecular mechanisms in EAC and exploring additional biomarkers for more effective diagnosis.
Microarray technology is widely used to analyze the expression of genes, miRNA, lncRNA, and DNA methylation to explore genetic alterations during tumorigenesis. In our work, to decrease the false-positive results, 3 mRNA microarrays and 1 miRNA microarray were analyzed to acquire differentially expressed genes (DEGs) and differentially expressed miRNAs (DEMs) between EAC tissues and normal esophageal squamous epithelium tissue samples. Functional enrichment and network analysis were applied for DEGs, and miRNA–mRNA interaction analysis, overall survival analysis, and clinical, pathological stage analysis were used to identify key miRNA and genes in EAC.
Material and methods
Microarray data
The GSE1420, GSE26886, and GSE92396 gene expression profiles and GSE16456 miRNA expression profile were downloaded from Gene Expression Omnibus (https://www.ncbi.nlm.nih.gov/geo/),8 which was based on the platform of the Affymetrix Human Genome U133A Array, Affymetrix Human Genome U133 plus 2.0 Array, Affymetrix Human Gene 1.0 ST Array, and Agilent-016436 Human miRNA Microarray 1.0. The GSE1420 data set included 8 normal esophageal squamous epithelium (normal), 8 Barrett’s esophagus, and 8 EAC tissues.9 GSE26886 comprised 69 samples, including 19 normal, 20 Barrett’s esophagus, 21 EAC, and 9 esophageal squamous cell carcinoma tissues.10 GSE92396 contained 21 samples, including 12 EAC and 9 normal tissues. GSE16456 comprised 32 samples, including 6 EAC, 10 Barrett’s esophagus, and 16 normal-paired tissues.11 For these data sets, only normal esophageal squamous epithelium and EAC tissue samples were retrieved and analyzed.
DEG and DEM analysis
DEGs and DEMs in EAC tissue compared with normal esophageal squamous epithelium tissue were identified through the Linear Models for Microarray Analysis package (Limma; www.bioconductor.org/packages/release/bioc/html/limma.html)12 in R software. Limma was used to analyze the p-value of each gene symbol. A p<0.01 and fold change (FC) >1.5 were used as the cutoff criteria of DEG analysis, and p<0.01 and FC >2 were used as the cutoff criteria of DEM analysis to identify a statistically significant difference.
Functional enrichment analysis of DEGs
Gene ontology (GO; www.geneontology.org)13 is widely used in bioinformatics and increases the possibility of identifying the most correlative biological process (BP). The Kyoto Encyclopedia of Genes and Genomes (KEGG; www.genome.ad.jp/KEGG)14 is used for understanding the most relevant pathway information of genes. To identify the biological significance of DEGs, GO BP analysis and KEGG pathway analysis were performed through the Database for Annotation Visualization and Integrated Discovery (DAVID; david.ncifcrf.gov/) online tool.15 A false discovery rate (FDR) ≤0.01 and gene count >2 were used as the cutoff criteria.
Protein–protein interaction (PPI) network construction
The Search Tool for the Retrieval of Interacting Genes (STRING) is an online tool to predict PPI using the combined score. Through the STRING database, DEGs with a combined score ≥0.7 were chosen to construct a PPI network which can be visualized using Cytoscape software (www.cytoscape.org).16 The functional modules of the PPI network were then identified using the Molecular Complex Detection (MCODE), an app of Cytoscape software. The parameters of Cluster Finding in MCODE were set as follows: Node Score Cutoff, 0.2; K-Core, 2; and Max.Depth, 100. Then, the GO analysis and KEGG pathway analysis of identified DEGs in modules with a score of node density >5 were performed using the DAVID tool again. An FDR <0.01 and a gene count >2 were considered to identify a statistically significant difference.
Prediction of miRNA targets
The target genes of DEMs were predicted using miRecords (http://c1.accurascience.com/miRecords/),17 which is an integrated resource produced by 11 miRNA target prediction databases, namely DIANA, MicroInspector, miRanda, MirTarget2, miTarget, NBmiRTar, PicTar, PITA, RNA22, RNAhybrid, and TargetScan. The genes predicted by miRanda, Pictar, and TargetScan simultaneously were identified as the targets of DEMs.
Construction of DEM–DEG network
miRNAs regulate target gene expression through translational inhibition or mRNA degradation. The miRNA-targeted genes regulated by mRNA degradation are negatively correlated with the expression of this miRNA. Thus, opposite-trend DEM–DEG pairs (upregulated miRNA–downregulated DEG or downregulated miRNA–upregulated DEG) were identified, and a DEM–DEG pair network was constructed.
Kaplan–Meier analysis of DEM-targeted DEGs
The mRNA transcript per million of 89 EAC tissue samples and corresponding clinical parameters and follow-up information for these patients were downloaded from UCSC Xena (https://xenabrowser.net/datapages/?host=https://tcga.xenahubs.net), an integrated online tool based on The Cancer Genome Atlas (TCGA) database.18 Kaplan–Meier analyses were performed in Survival package (https://CRAN.R-project.org/package=survival)19 in R software to explore the prognostic value of DEM-targeted DEGs based on overall survival and relapse-free survival. Patients with EAC were divided into low- and high-expression groups according to the median of each DEG expression. A log-rank p-value <0.05 was considered statistically significant.
Cox proportional hazard analysis
The association between clinical parameters including age at diagnosis, alcohol history, Barrett’s esophagus history, and pathological TNM stage and survival was investigated using the univariate Cox proportional hazard (CPH) model. Based on Kaplan–Meier analysis, all variables that showed an effect (p<0.05) on survival in univariate analyses and prognosis-related genes were entered in a multivariate CPH model. The results of CPH models were presented as HRs, along with tests of significance and 95% CIs. Categorization of continuous variables was prespecified. A p-value <0.05 was considered statistically significant.
Validation of differential expression of prognosis-related genes
The expression level of all prognosis-related genes identified by Kaplan–Meier analysis and Cox proportional hazard analysis was performed in boxplots to visualize the relationship between EAC and healthy tissue based on data from TCGA. Data on only 8 precancerous lesions were found in TCGA database, although 104 EAC patients were included. The expression level was expressed as mean (standard deviation). A p-value <0.05 was considered statistically significant.
Results
DEG and DEM analysis
In total, 2,669, 4,548, and 2,371 DEGs were identified from GSE1420, GSE26886, and GSE92396, respectively. As shown in Figure 1, 717 genes were screened out in all 3 data sets. Among them, 715 genes presented the same expression trends in these 3 data sets, including 313 upregulated genes and 402 downregulated genes in EAC tissue compared with normal esophageal squamous epithelium tissue. In total, 25 DEMs were identified from GSE16456, consisting of 12 upregulated miRNAs and 13 downregulated miRNAs in EAC tissue compared with normal esophageal squamous epithelium tissue.
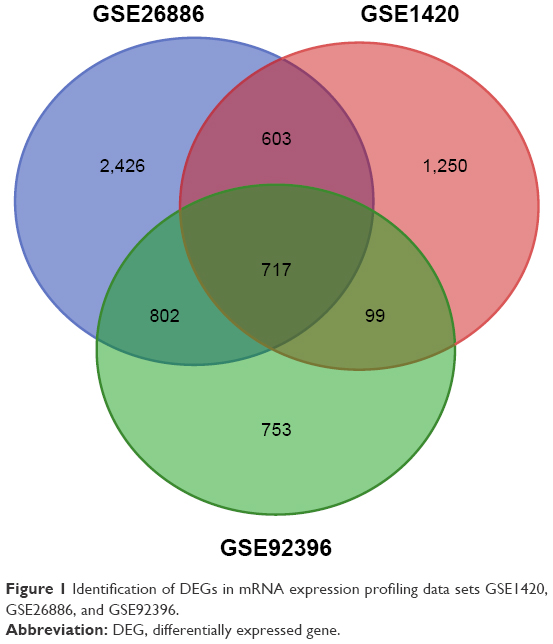 | Figure 1 Identification of DEGs in mRNA expression profiling data sets GSE1420, GSE26886, and GSE92396. |
Functional enrichment analysis
The GO BP analysis and KEGG pathway analysis were performed. The GO BP analysis results demonstrated that the upregulated DEGs were significantly associated with collagen catabolic processes, 2 types of interferon signaling pathway, cell adhesion, and skeletal system development, while downregulated DEGs were associated considerably with epidermis development, peptide cross-linking, keratinocyte differentiation, and keratinization. Only 2 KEGG pathways of upregulated genes were identified, but no significantly enriched pathways were identified for downregulated genes. The upregulated genes were enhanced considerably in the tumor necrosis factor (TNF) signaling pathway and extracellular matrix (ECM)–receptor interaction KEGG pathway. The detailed results are presented in Table 1.
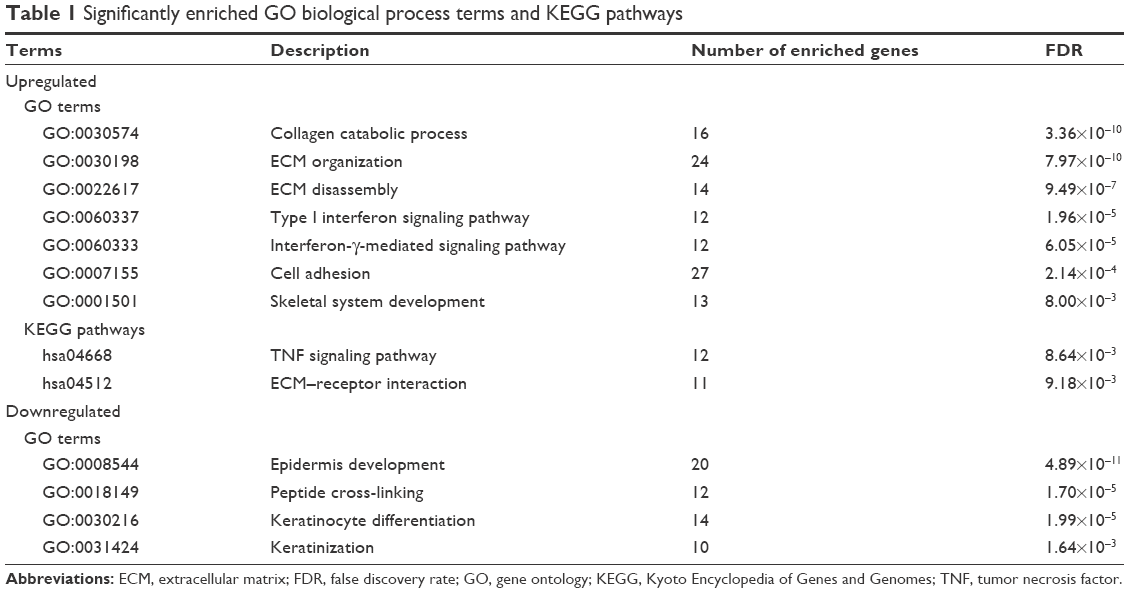 | Table 1 Significantly enriched GO biological process terms and KEGG pathways |
PPI network analysis
Based on the STRING database, PPI network analysis was performed. The PPI network of DEGs was constructed by 317 protein interactions with combined scores >0.7 (Figure 2). The functional modules were assessed using the MCODE plug-in. Three modules were identified. Module 1 consists of 14 nodes and 78 edges including IRF8, IRF1, IFI35, IFITM3, and so on. Module 2 comprises 10 nodes and 41 edges consisting of COL1A1, COL1A2, COL3A1, COL5A2, and so on. Module 3 includes 9 nodes and 30 edges including CXCR2, BDKRB2, HCAR3, LPAR6, and so on. The functional enrichment analysis of DEGs in these 3 modules indicated that Module 1 enriches in the immune response and 2 types of interferon signaling pathway in GO BP analysis; and during cell adhesion, viral myocarditis, and allograft rejection in KEGG pathway analysis. Module 2 enriches in collagen fibril organization, collagen catabolic process, and ECM organization in GO BP analysis; and ECM–receptor interaction, protein digestion, and focal adhesion in KEGG pathway analysis. Module 3 enriches in positive regulation of cytosolic calcium ion concentration and cell surface receptor signaling pathways in GO BP analysis; but no significant KEGG pathways were identified. The detailed results are presented in Figure 3 and Table 2.
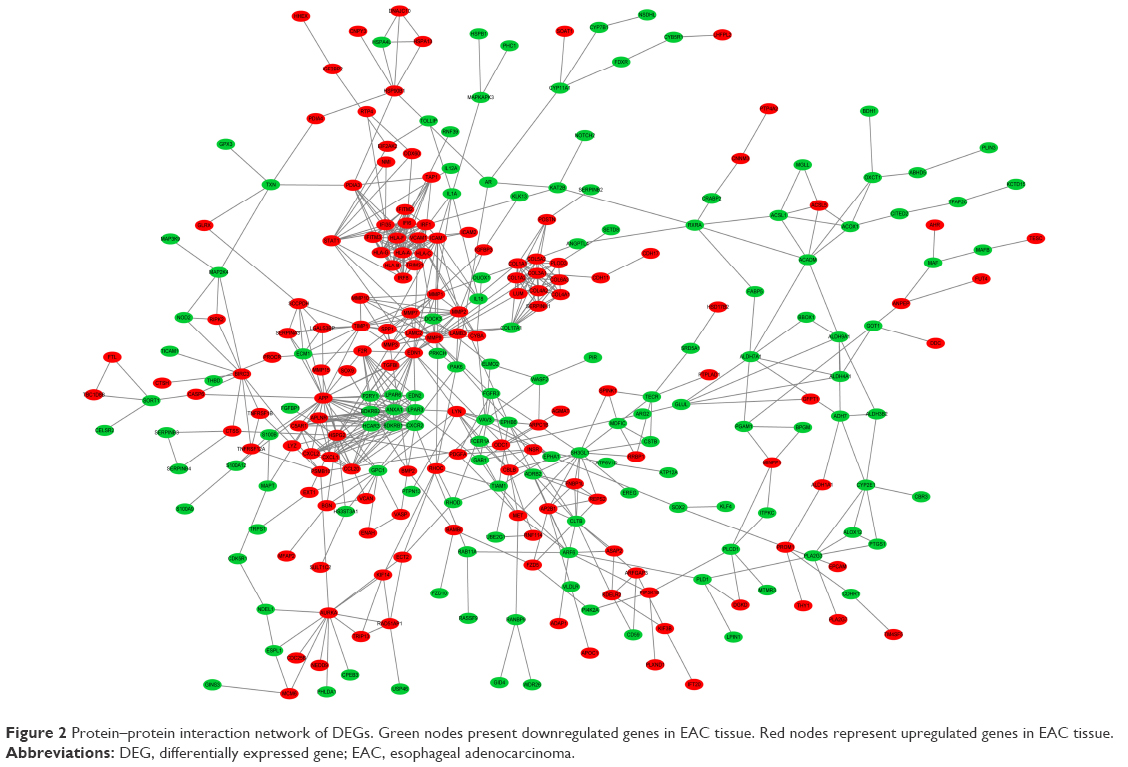 | Figure 2 Protein–protein interaction network of DEGs. Green nodes present downregulated genes in EAC tissue. Red nodes represent upregulated genes in EAC tissue. |
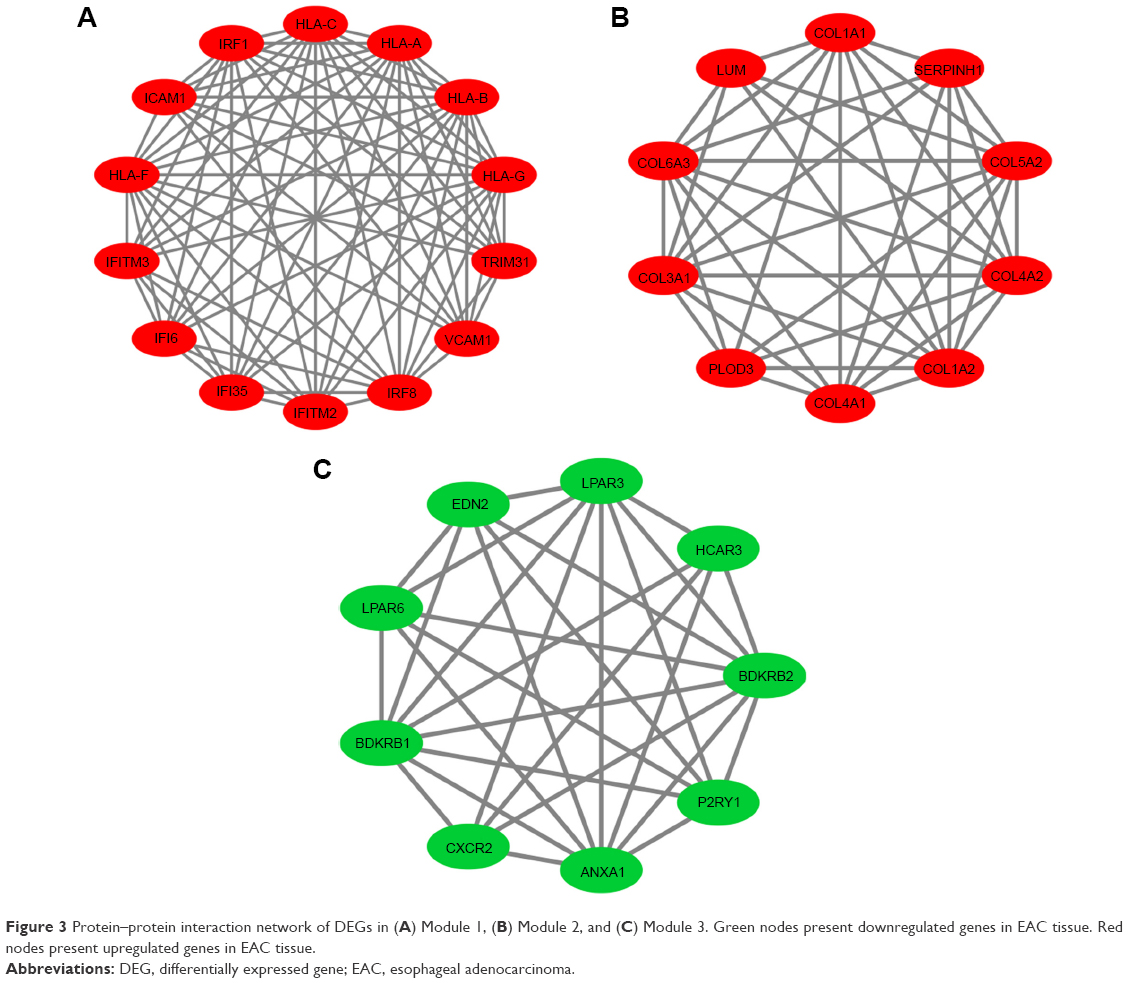 | Figure 3 Protein–protein interaction network of DEGs in (A) Module 1, (B) Module 2, and (C) Module 3. Green nodes present downregulated genes in EAC tissue. Red nodes present upregulated genes in EAC tissue. |
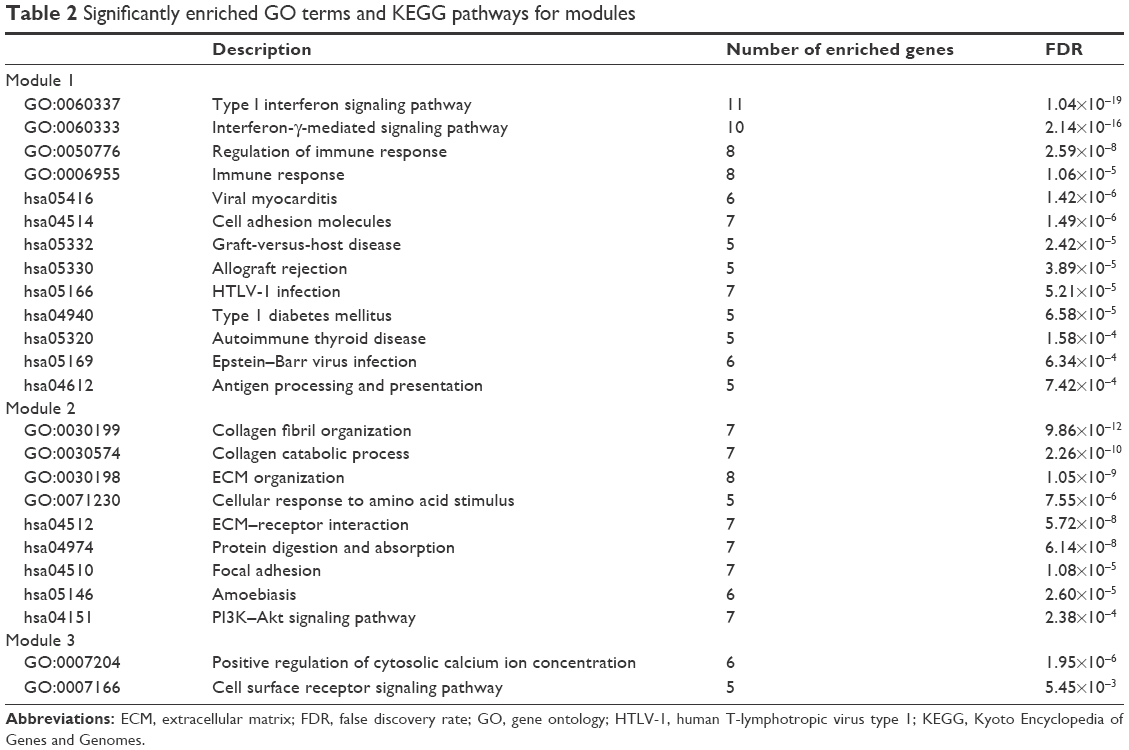 | Table 2 Significantly enriched GO terms and KEGG pathways for modules |
DEM target prediction and DEM–DEG pairs
A total of 1,708 DEM-targeted genes were predicted using the miRecord database, comprising 897 genes targeted by downregulated DEMs and 811 genes targeted by upregulated DEMs. Among them, 19 genes targeted by downregulated DEMs were upregulated in EAC tissue, and 25 genes targeted by upregulated DEMs were downregulated in EAC tissue. A DEM–DEG pair network was constructed, as shown in Figure 4.
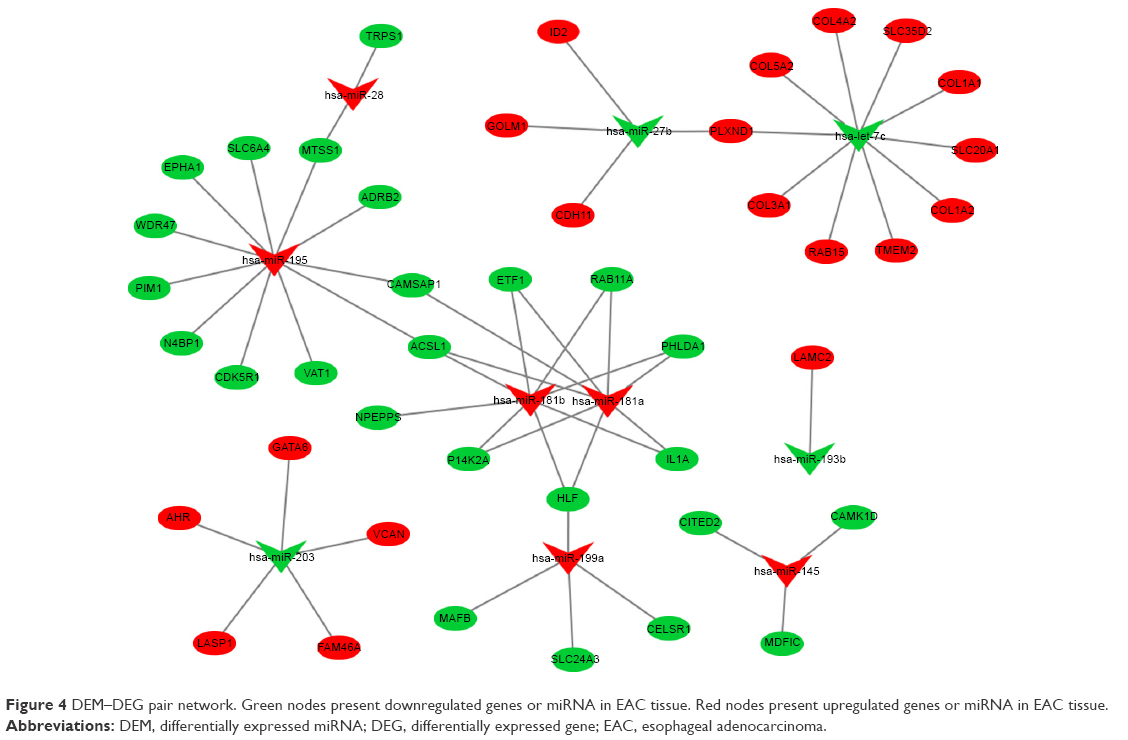 | Figure 4 DEM–DEG pair network. Green nodes present downregulated genes or miRNA in EAC tissue. Red nodes present upregulated genes or miRNA in EAC tissue. |
Kaplan–Meier analysis of DEM-targeted DEGs
The prognostic values of 19 upregulated genes and 25 downregulated genes targeted by DEMs were assessed in R software. It was found that the high expression of FAM46A, RAB15, SLC20A1, and IL1A was associated with worse overall survival, while the high expression of FAM46A, RAB15, and SLC20A1, and low expression of ACSL1 were associated with worse relapse-free survival for EAC patients (Figures 5 and 6). Among them, FAM46A, RAB15, and SLC20A1 were upregulated in EAC tissue, while IL1A and ACSL1 were downregulated in EAC tissue.
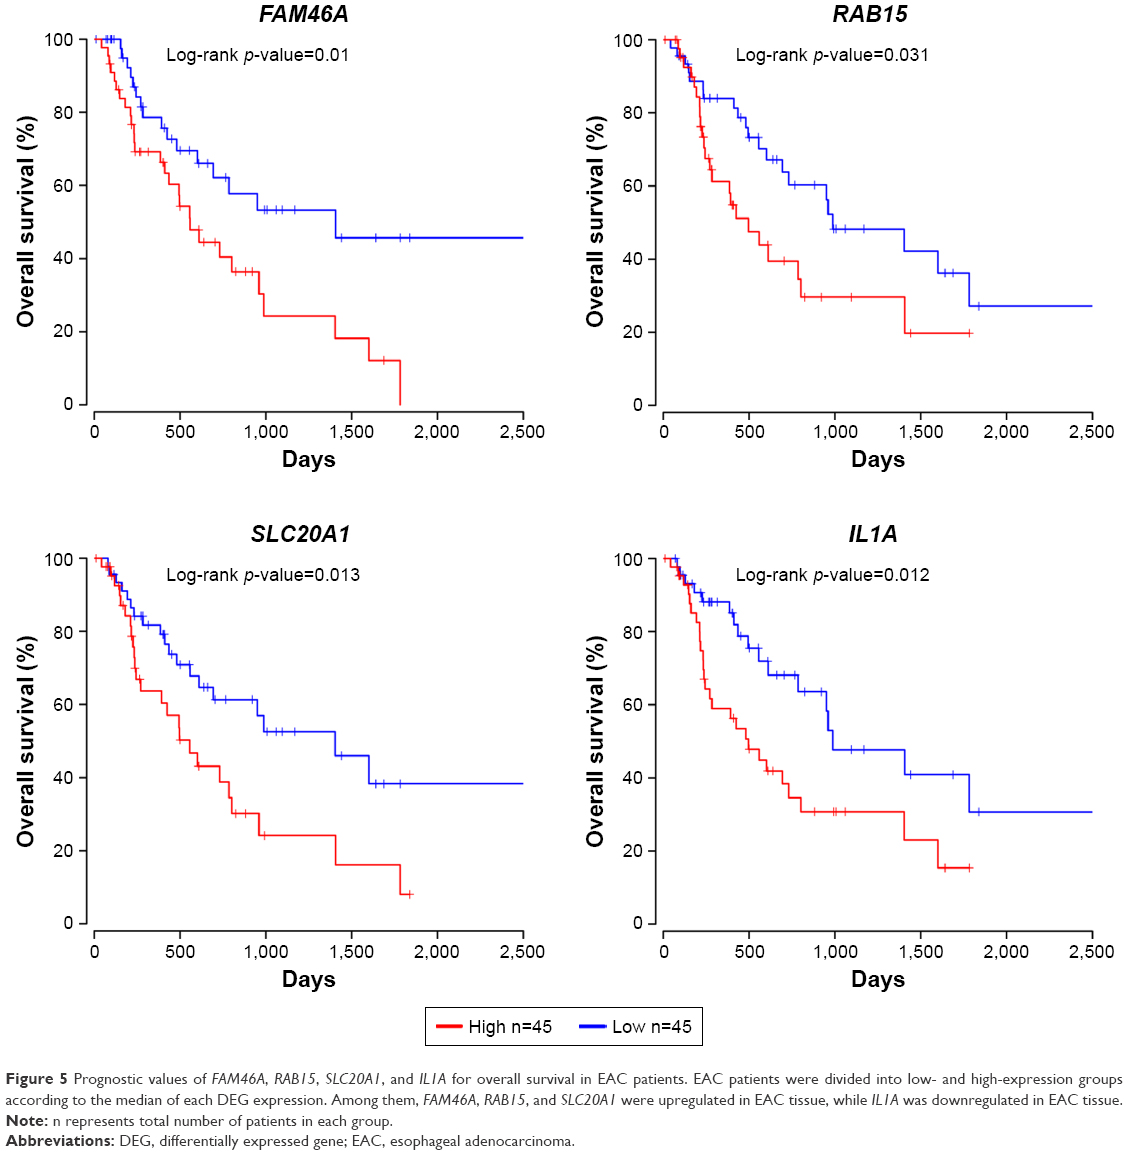 | Figure 5 Prognostic values of FAM46A, RAB15, SLC20A1, and IL1A for overall survival in EAC patients. EAC patients were divided into low- and high-expression groups according to the median of each DEG expression. Among them, FAM46A, RAB15, and SLC20A1 were upregulated in EAC tissue, while IL1A was downregulated in EAC tissue. |
 | Figure 6 Prognostic values of FAM46A, RAB15, SLC20A1, and ACSL1 for relapse-free survival in EAC patients. EAC patients were divided into low- and high-expression groups according to the median of each DEG expression. Among them, FAM46A, RAB15, and SLC20A1 were upregulated in EAC tissue, while ACSL1 was downregulated in EAC tissue. |
Cox proportional hazard analysis
Based on overall survival, alcohol history, the presence of lymph-node metastasis, and higher pathological stage were associated with a higher hazard of death in the univariate analysis, while alcohol history, pathological stage, and expression of FAM46A and IL1A were found to be independent prognostic indicators in multivariate analysis (Table 3). Based on relapse-free survival, only higher pathological stage was associated with a higher hazard of relapse or death in the univariate analysis, FAM46A, RAB15, and SLC20A1 were considered as independent prognostic indicators in multivariate analysis (Table 4).
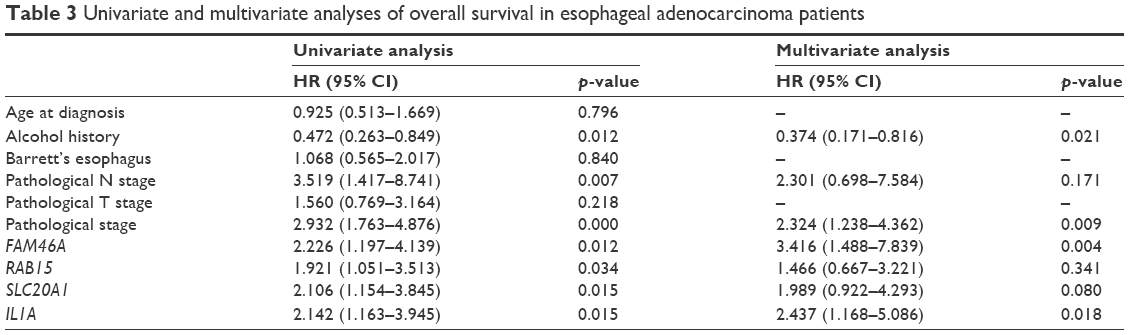 | Table 3 Univariate and multivariate analyses of overall survival in esophageal adenocarcinoma patients |
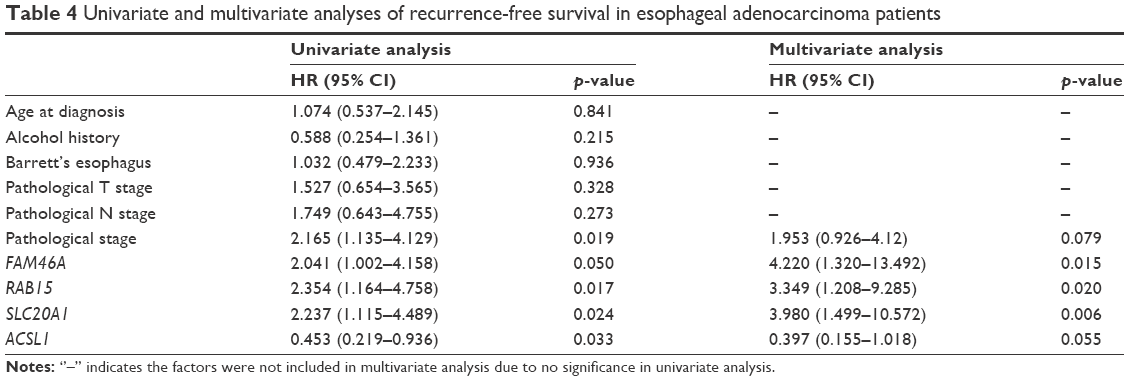 | Table 4 Univariate and multivariate analyses of recurrence-free survival in esophageal adenocarcinoma patients |
Validation of differential expression of prognosis-related genes
Figure 7 demonstrates that RAB15, SLC20A1, and IL1A, but not FAM46A, significantly increased expression levels in EAC tissue compared to normal esophageal squamous epithelium tissue, expressed as mean (standard deviation), (EAC vs normal, FAM46A, 10.53 (0.41) vs 10.75 (1.28), p=0.66; RAB15, 9.87 (0.94) vs 8.87 (0.84), p=0.04; SLC20A1, 11.06 (0.88) vs 9.65 (0.64), p=0.003; IL1A, 5.93 (2.35) vs 3.09 (2.67), p=0.04), while ACSL1 had significantly decreased expression levels in EAC tissue (EAC vs normal, 10.72 (0.62) vs 11.45 (0.43), p=0.016).
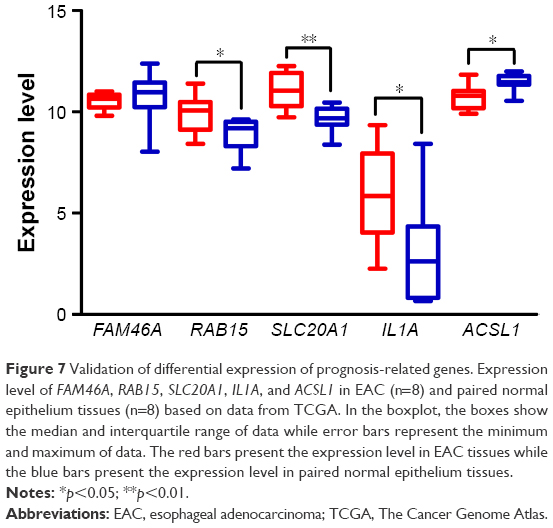 | Figure 7 Validation of differential expression of prognosis-related genes. Expression level of FAM46A, RAB15, SLC20A1, IL1A, and ACSL1 in EAC (n=8) and paired normal epithelium tissues (n=8) based on data from TCGA. In the boxplot, the boxes show the median and interquartile range of data while error bars represent the minimum and maximum of data. The red bars present the expression level in EAC tissues while the blue bars present the expression level in paired normal epithelium tissues. |
Discussion
Despite advances in early diagnostic methods and medical therapy, the overall survival rate of EAC patients remains unsatisfactory. Thus, understanding of the molecular mechanisms underlying EAC progression is necessary. Microarray technology has developed rapidly in recent years and has been widely used to uncover genetic alteration in tumors. Thus, microarray analysis enables researchers to reveal biomarkers for the diagnosis, therapy, and prognosis of tumors.
In our study, a total of 715 genes were identified, comprising 313 upregulated genes and 402 downregulated genes. For the miRNA microarray, 25 DEMs were identified, consisting of 12 upregulated miRNA and 13 down-regulated miRNA. In total, 1,708 genes were targeted by DEMs. According to the intersection between DEM-targeted genes and DEGs, only 44 genes and 56 miRNA–mRNA pairs were identified, comprising 19 upregulated and 25 downregulated DEGs. Among them, 4 upregulated genes, COL1A1, COL5A2, COL3A1, and COL1A2, were included in functional Module 2, which was significantly associated with ECM-organized and catabolic processes. Kaplan–Meier analysis of these 44 genes revealed that high expression of FAM46A, RAB15, SLC20A1, and IL1A was significantly associated with worse overall survival, while high expression of FAM46A, RAB15, and SLC20A1, and low expression of ACSL1 were significantly associated with relapse-free survival. Among them, FAM46A and IL1A were found to be independent prognostic indicators for overall survival, while FAM46A, RAB15, and SLC20A1 were considered as independent prognostic indicators for relapse-free survival in multivariate Cox proportional hazard analysis. Notably, overexpression of RAB15 and SLC20A1 and lower expression of ACSL1 were not only correlated with worse prognosis but also identified in EAC tissue based on TCGA database and mRNA microarray. In addition, all enriched GO BP and KEGG pathways, especially the pathway enriched by DEGs in functional modules, may participate in mechanisms underlying EAC progression, while DEGs in functional modules or targeted by DEMs, notably overlapping DEGs, need high attention.
The ECM regulates tissue homeostasis, and its dysregulation contributes to tumor progression by directing cell growth, survival, and migration, and modulating immune function and vascular development. Tumor progression in tissues is associated with an increase in rigidity due to the accumulation of cross-linked collagen matrix.20 Many types of research demonstrate that the stiffened ECM is correlated with cell proliferation, invasion, and metastasis via intracellular ERK, PI3K, FAK, and RhoA/Rac signaling pathway, probably activated by collagen-receptor binding,21 while a collagen-rich ECM promotes pro-tumorigenic M2 polarization macrophage proliferation and activation, possibly by diminishing M1 macrophage regulator TNF-α.22 Type I collagen increases in various types of tumor, such as pancreatic carcinoma,23 breast cancer,24 and medulloblastoma,25 and fragments of type I collagen produced as a result of matrix metalloproteinase cleavage may promote tumor invasion, metastasis, and survival.26 Type IV collagen expression is altered in many types of tumor tissues, such as colorectal cancer,27 pancreatic cancer,28 and gastric cancer.29 The minor type IV collagen α5 has been shown to support lung cancer development via cancer cell autonomous and non-autonomous mechanisms activated by collagen IV–discoidin domain receptor-1 (DDR1) binding. The loss of collagen IV α5 contributes toward delaying tumor progression and decreasing DDR1. However, both types of collagen have rarely been investigated in EAC, while the other types of collagen mentioned here have hardly been researched in this tumor. Therefore, it is speculated that these collagens may be gene signatures of EAC and play an essential role in the progression of EAC through ECM–receptor interaction; however, further research into collagens and EAC is required.
RAB15, a member of the RAS oncogene family, is a protein-coding gene located at chromosome 14.23.3. Initially, RAB15 was identified as a brain-tissue specific RAB protein regulating the endocytic recycling pathway.30 Moreover, RAB15 is associated with the retinoic acid-induced differentiation of neuroblastoma cells.31 In addition, RAB15 was significantly upregulated by early growth factor-4 overexpression, which plays a critical role in cell proliferation in small cell lung cancer, while knocking down RAB15 contributes to significant suppression of cell proliferation in small cell lung cancer.32 Solute carrier family 20 member 1, SLC20A1, is a protein-coding gene located at chromosome 2q14.1, which imports phosphate into cells and maintains cellular phosphate homeostasis. It has been reported that SLC20A1 plays a crucial role in cell proliferation and tumor cell growth by its phosphate transport activity.33 Research has found SLC20A1 to be a powerful prognostic biomarker in estrogen receptor-positive breast cancer by information-theoretical analysis.34 However, the oncogenic role and clinical significance of RAB15 and SLC20A1 for EAC have rarely been researched. Thus, further study of these 2 genes may reveal novel biomarkers for EAC.
Conclusion
The results of our study demonstrated that a total of 718 DEGs and 25 DEMs were screened out. Among them, 44 DEM-targeted DEGs and 56 DEM–DEG pairs were identified. The enriched pathway, ECM–receptor interaction, may be closely related to EAC progression. RAB15, SLC20A1, and ACSL1, and their paired miRNA, such as has-let-7c, may be critical genes and miRNAs related to EAC. However, additional experiments including Western blot analysis and reverse transcription–polymerase chain reaction were not performed to verify the protein, miRNA, and mRNA expression of these signatures. Thus, further studies are needed to focus on the clinical application of these gene and miRNA signatures.
Acknowledgments
This study was supported by the National Science Foundation of China (grant numbers 81370491, 8157040827, and 81502041).
Disclosure
The authors report no conflicts of interest in this work.
References
Hongo M, Nagasaki Y, Shoji T. Epidemiology of esophageal cancer: Orient to Occident. Effects of chronology, geography and ethnicity. J Gastroenterol Hepatol. 2009;24(5):729–735. | ||
Pennathur A, Gibson MK, Jobe BA, Luketich JD. Oesophageal carcinoma. Lancet. 2013;381(9864):400–412. | ||
Wang KL, Wu TT, Choi IS, et al. Expression of epidermal growth factor receptor in esophageal and esophagogastric junction adenocarcinomas: association with poor outcome. Cancer. 2007;109(4):658–667. | ||
Tan C, Qian X, Guan Z, et al. Potential biomarkers for esophageal cancer. SpringerPlus. 2016;5:467. | ||
Kilic A, Schuchert MJ, Luketich JD, et al. Use of novel autoantibody and cancer-related protein arrays for the detection of esophageal adenocarcinoma in serum. J Thorac Cardiovasc Surg. 2008;136(1):199–204. | ||
Hemmatzadeh M, Mohammadi H, Karimi M, Musavishenas MH, Baradaran B. Differential role of microRNAs in the pathogenesis and treatment of Esophageal cancer. Biomed Pharmacother. 2016;82:509–519. | ||
Bus P, Kestens C, Ten Kate FJ, et al. Profiling of circulating microRNAs in patients with Barrett’s esophagus and esophageal adenocarcinoma. J Gastroenterol. 2016;51(6):560–570. | ||
Barrett T, Wilhite SE, Ledoux P, et al. NCBI GEO: archive for functional genomics data sets – update. Nucleic Acids Res. 2013;41(Database issue):D991–D995. | ||
Kimchi ET, Posner MC, Park JO, et al. Progression of Barrett’s metaplasia to adenocarcinoma is associated with the suppression of the transcriptional programs of epidermal differentiation. Cancer Res. 2005;65(8):3146–3154. | ||
Wang Q, Ma C, Kemmner W. Wdr66 is a novel marker for risk stratification and involved in epithelial-mesenchymal transition of esophageal squamous cell carcinoma. BMC Cancer. 2013;13(1):137. | ||
Yang H, Gu J, Wang KK, et al. MicroRNA expression signatures in Barrett’s esophagus and esophageal adenocarcinoma. Clin Cancer Res. 2009;15(18):5744–5752. | ||
Smyth GK. limma: Linear Models for Microarray Data. New York: Springer; 2005. | ||
Ashburner M, Ball CA, Blake JA, et al. Gene ontology: tool for the unification of biology. The Gene Ontology Consortium. Nat Genet. 2000;25(1):25–29. | ||
Kanehisa M, Goto S. KEGG: Kyoto Encyclopedia of Genes and Genomes. Nucleic Acids Res. 2000;28(1):27–30. | ||
Huang DW, Sherman BT, Tan Q, et al. The DAVID Gene Functional Classification Tool: a novel biological module-centric algorithm to functionally analyze large gene lists. Genome Biol. 2007;8(9):R183. | ||
Shannon P, Markiel A, Ozier O, et al. Cytoscape: a software environment for integrated models of biomolecular interaction networks. Genome Res. 2003;13(11):2498–2504. | ||
Xiao F, Zuo Z, Cai G, Kang S, Gao X, Li T. miRecords: an integrated resource for microRNA–target interactions. Nucleic Acids Res. 2009;37(Database issue):D105–D110. | ||
Cancer Genome Atlas Research Network, Weinstein JN, Collisson EA, et al. The Cancer Genome Atlas Pan-Cancer analysis project. Nat Genet. 2013;45(10):1113–1120. | ||
Therneau TM, Grambsch PM. Modeling survival data: extending the Cox model. New York: Springer-Verlag; 2013. | ||
Tilghman RW, Cowan CR, Mih JD, et al. Matrix rigidity regulates cancer cell growth and cellular phenotype. PLoS One. 2010;5(9):e12905. | ||
Pickup MW, Mouw JK, Weaver VM. The extracellular matrix modulates the hallmarks of cancer. EMBO Rep. 2014;15(12):1243–1253. | ||
Patel NR, Bole M, Chen C, et al. Cell elasticity determines macrophage function. PLoS One. 2012;7(9):e41024. | ||
Koenig A, Mueller C, Hasel C, Adler G, Menke A. Collagen type I induces disruption of E-cadherin-mediated cell-cell contacts and promotes proliferation of pancreatic carcinoma cells. Cancer Res. 2006;66(9):4662–4671. | ||
Cloos PA, Christgau S, Lyubimova N, Body JJ, Qvist P, Christiansen C. Breast cancer patients with bone metastases are characterised by increased levels of nonisomerised type I collagen fragments. Breast Cancer Res. 2003;5(4):R103–R109. | ||
Liang Y, Diehn M, Bollen AW, Israel MA, Gupta N. Type I collagen is overexpressed in medulloblastoma as a component of tumor microenvironment. J Neurooncol. 2008;86(2):133–141. | ||
Werb Z, Lu P. The Role of Stroma in Tumor Development. Cancer J. 2015;21(4):250–253. | ||
Oka Y, Naito I, Manabe K, et al. Distribution of collagen type IV alpha1-6 chains in human normal colorectum and colorectal cancer demonstrated by immunofluorescence staining using chain-specific epitope-defined monoclonal antibodies. J Gastroenterol Hepatol. 2002;17(9):980–986. | ||
Öhlund D, Franklin O, Lundberg E, Lundin C, Sund M. Type IV collagen stimulates pancreatic cancer cell proliferation, migration, and inhibits apoptosis through an autocrine loop. BMC Cancer. 2013;13:154. | ||
Baba Y, Iyama K, Ikeda K, et al. Differential expression of basement membrane type IV collagen alpha chains in gastric intramucosal neoplastic lesions. J Gastroenterol. 2007;42(11):874–880. | ||
Zuk PA, Elferink LA. Rab15 differentially regulates early endocytic trafficking. J Biol Chem. 2000;275(35):26754–26764. | ||
Nishimura N, Van Huyen Pham T, Hartomo TB, et al. Rab15 expression correlates with retinoic acid-induced differentiation of neuroblastoma cells. Oncol Rep. 2011;26(1):145–151. | ||
Matsuo T, Dat le T, Komatsu M, et al. Early growth response 4 is involved in cell proliferation of small cell lung cancer through transcriptional activation of its downstream genes. PLoS One. 2014;9(11):e113606. | ||
Beck L, Leroy C, Salaün C, Margall-Ducos G, Desdouets C, Friedlander G. Identification of a novel function of PiT1 critical for cell proliferation and independent of its phosphate transport activity. J Biol Chem. 2009;284(45):31363–31374. | ||
Sato K, Akimoto K. Expression levels of KMT2C and SLC20A1 identified by information-theoretical analysis are powerful prognostic biomarkers in estrogen receptor-positive breast cancer. Clin Breast Cancer. 2017;17(3):e135–e142. |
 © 2018 The Author(s). This work is published and licensed by Dove Medical Press Limited. The full terms of this license are available at https://www.dovepress.com/terms.php and incorporate the Creative Commons Attribution - Non Commercial (unported, v3.0) License.
By accessing the work you hereby accept the Terms. Non-commercial uses of the work are permitted without any further permission from Dove Medical Press Limited, provided the work is properly attributed. For permission for commercial use of this work, please see paragraphs 4.2 and 5 of our Terms.
© 2018 The Author(s). This work is published and licensed by Dove Medical Press Limited. The full terms of this license are available at https://www.dovepress.com/terms.php and incorporate the Creative Commons Attribution - Non Commercial (unported, v3.0) License.
By accessing the work you hereby accept the Terms. Non-commercial uses of the work are permitted without any further permission from Dove Medical Press Limited, provided the work is properly attributed. For permission for commercial use of this work, please see paragraphs 4.2 and 5 of our Terms.