Back to Journals » International Journal of General Medicine » Volume 15
Identification of Prognostic Genes in Hepatocellular Carcinoma
Authors Bai W, Cheng L, Xiong L, Wang M, Liu H, Yu K, Wang W
Received 26 November 2021
Accepted for publication 11 February 2022
Published 11 March 2022 Volume 2022:15 Pages 2895—2904
DOI https://doi.org/10.2147/IJGM.S347535
Checked for plagiarism Yes
Review by Single anonymous peer review
Peer reviewer comments 3
Editor who approved publication: Dr Scott Fraser
Wenhui Bai,1,* Li Cheng,2,* Liangkun Xiong,1 Maoming Wang,1 Hao Liu,1 Kaihuan Yu,1,* Weixing Wang3,*
1Department of Hepatobiliary Surgery, Eastern Campus, Renmin Hospital of Wuhan University, Wuhan, 430060, People’s Republic of China; 2Department of Intensive Care Unit, Eastern Campus, Renmin Hospital of Wuhan University, Wuhan, 430060, People’s Republic of China; 3Department of Hepatobiliary Surgery, Renmin Hospital of Wuhan University, Wuhan, 430060, People’s Republic of China
*These authors contributed equally to this work
Correspondence: Weixing Wang; Kaihuan Yu, Email [email protected]; [email protected]
Background: Previous studies have demonstrated the important role of tumor stem cells (TSCs) in the development of hepatocellular carcinoma (HCC); however, TSC-related genetic markers have not been investigated.
Aim: The aim of the present study was to identify stem cell-related signature genes to predict the prognosis of HCC, using The Cancer Genome Atlas (TCGA) and Gene Expression Omnibus (GEO) databases.
Methods: In total, 423 liver HCC tissue samples, including 373 tumor and 50 adjacent normal tissue samples from TCGA, and 115 primary tumor and 52 adjacent non-tumor tissue samples from the GEO GSE76427 database, were used in the present study. The non-negative matrix factorization (NMF) algorithm, t-distributed stochastic neighbor embedding (t-SNE) algorithm and Cox regression analysis were combined for model construction and validation.
Results: Overall, six clusters were identified using the NMF and t-SNE algorithms with 470 stem cell-related genes. The results demonstrated that patients in cluster 5 had the worst prognosis. For multivariate Cox survival analysis, 15 genes with optimal lambda values were chosen and eight genes were incorporated into the final regression model using the optimal Akaike information criterion value. Validation of the risk model using the aforementioned eight signature genes demonstrated the models strong reliability and stable predictive performance.
Conclusion: The results of the present study indicated that the eight-gene (Hes family BHLH transcription factor 5, KIT ligand, methyltransferase-like 3, proteasome 26S subunit non-ATPase 1, Ras-related protein Rab-10, treacle ribosome biogenesis factor 1, YTH N6-methyladenosine RNA binding protein 2 and Zinc Finger CCCH-Type Containing 13) signature constructed by the model may be reliable in predicting the prognosis of patients with HCC.
Keywords: hepatocellular carcinoma, stem cell, prognosis, signature
Introduction
Hepatocellular carcinoma (HCC) is the most common primary cancer of the liver and is the fifth most common malignancy worldwide.1 However, HCC distribution differs between regions. Most cases of HCC occur in Asia, particularly in East Asia, and have a high incidence rate of>20 cases/100,000 people. The Urban Employee Basic Medical Insurance Claims Database, between 2003–2017, in Tianjin, China, covers 5.95 million individuals and reports on HCC prevalence.2 The HCC prevalence rate increased by 5.13% annually from 20.12/100,000 people in 2008 to 30.49/100,000 people in 2017.The prevalence rate increased from 25 years, peaking at 60 years and decreased at ≥70 years. A variety of contributors have been investigated as risk factors for HCC, including hepatitis B virus (HBV), hepatitis C virus (HCV), alcohol and aflatoxin.3 Regional differences also exist between these aforementioned risk factors. More than 60% of liver cancers are caused by HBV infection, while in neighboring Japan, the main cause is HCV infection.4
Research on the mechanisms underlying the development and progression of HCC have been widely investigated, but so far no genetic or molecular biomarkers have been identified.Previous study have focused primarily on adult tumor cells and have not investigated the source of these cells.5 Due to the absence of highly specific and sensitive biomarkers, the early diagnosis and treatment of HCC is difficult. Previous study have reported that the sensitivity and specificity of genes or molecules used to diagnose HCC is currently~60–70%. If liver cancer stem cells can be identified and isolated, then it can be hypothesized that they may infer a higher specificity and sensitivity for the diagnosis of liver malignancies.6
At present, fluorescence-activated cell sorting is widely used for the separation of tumor stem cells (TSCs). This technology requires cell surface markers to identify certain types of cells;however most solid TSC surface markers have not yet been elucidated. Furthermore, TSCs are small in size and are therefore difficult to isolate. The identification of TSCs mostly relies upon mouse allograft transplantation. The mice themselves may retain immune function,which can impact the outcome of the tumor experiments. The TSC theory provides a new interpretation of the tumorigenesis and development process and provides a new direction for future tumor research. It is of great significance for cancer prevention, early detection, grade evaluation and prognosis. Although the existence of certain TSCs has been experimentally confirmed, it is unclear whether all tumors originate from TSCs. Identifying other types of TSCs molecularly or morphologically remains a difficult task. Due to the similarity between TSCs and stem cells, finding a treatment which can selectively kill TSCsremains a challenge. In the process of liver cancer stem cell research, evidence indicates that cancer stem cells do exist in liver cancer tissues.7 Therefore, identifying an innate marker, beyond surface markers, in HCC is important to further explore the mechanism of liver tumor occurrence, development and metastasis, and to provide a theoretical basis for the study of liver cancer diagnosis and treatment. The present study aimed to identify stem cell-related signature genes to predict HCC prognosis. This was achieved usingTheCancerGenome Atlas (TCGA) and Gene Expression Omnibus (GEO) databases.
Materials and Methods
Data Collection
The data shown here are in part based upon data generated using TCGA Research Network (https://www.cancer.gov/tcga). Liver hepatocellular carcinoma (LIHC) data was downloaded from TCGA. Clinical, RNA-sequencing (seq) and pathological data were provided by the Genomic Data Commons Data Portal. Matched TCGA patient identifiers allowed for clustering of the data and for correlations to be drawn between cluster type and clinical characteristics. In total, approximately 423 TCGA-LIHC tissue samples were collected, mainly from white populations. This study was conducted with the approval of the ethics committee of the Renmin Hospital of Wuhan University.
Validation data for risk model construction were downloaded from the GEO database (https://www.ncbi.nlm.nih.gov/geo/). The GSE76427 dataset contained results from patients with HCC following liver resection, based on common prognostic factors for primary tumors (PTs) and adjacent non-tumor tissues (ANTTs). Overall, global mRNA expression profiles from 115 PT tissue samples and 52 ANTT samples were derived from 115 patients with HCC. Clinical characteristics included age, sex, overall survival, recurrence free survival, Barcelona-Clinic Liver Cancer (BCLC) stage and pathological stage. In total,470 genes from 32 pathways in the Gene Ontology database and from the Molecular Signature Database v7.4 were selected for further analysis (Supplementary Table 1).
Data Processing
Data preprocessing was as follows: (1) Standardized TCGA RNA-seq data (fragments per kilobase million) was used for further analysis; (2) in total 470 stem cell-related genes were filtered for clustering in all tumor samples, with the exception of matched paracancerous tissues; (3) in total 115 PT tissue samples in the GSE76427 dataset were identified and validated; (4) samples without clinical information were excluded.
Model Construction and Statistical Analysis
The non-negative matrix factorization (NMF) algorithm is useful when there are numerous attributes, which are ambiguous or have weak predictability.8 By combining attributes, the NMF algorithm can produce meaningful patterns, topics or themes. Each feature created by the NMF algorithm is a linear combination of the original attribute set. Each feature consists of a set of coefficients, which are a measure of the weight of each attribute in the feature. Data classification was achieved using the t-distributed stochastic neighbor embedding (t-SNE) algorithm. t-SNE is a non-linear dimensionality reduction algorithm used for exploring high-dimensional data.9 This algorithm maps multi-dimensional data to two or more dimensions suitable for human observation. The Tumor IMmune Estimation Resource (TIMER, https://timer.cistrome.org/) is a comprehensive resource for systematic analysis of immune infiltrates across a range of cancer types. This tool provides immune infiltrate abundance estimates using multiple immune deconvolution methods and allows users to generate high-quality figures to explore immunological, clinical and genomic features of tumors. Immune infiltration estimates were provided using expression profiles produced by TIMER, CIBERSORT, quanTIseq, xCell, MCP-counter and EPIC algorithms (https://timer.cistrome.org/). A Kruskal–Wallis one-way ANOVA test was performed using GraphPad Prism version 6.04 for Windows (GraphPad Software, Inc; www.graphpad.com). R software (r-project.org/) was employed for further statistical analysis. Univariate and multivariateCox regression analysis was performed using R with the help of R packages (“survival”, “survminer” and “survivalROC”). Venny plot was also used (bioinforgp.cnb.csic.es/tools/venny/index.html).
Results
Identifying LIHC Subtype Based on Stem Cell-Related Gene Expression
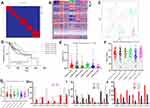
In total 423 LIHC patients from the TCGA database and 470 stem cell-related genes (Supplementary Table 1) were downloaded for clustering. Six clusters were identified using the NMF algorithm (Figure 1A) and K=6 was determined to be the optimal number. The association matrix between gene expression and cluster type is presented in Figure 1B. t-SNE analysis of all patient data also corresponded to the results of the NMF algorithm, which indicated consistency between different methods (Figure 1C). Progression-free survival prognostic analysis determined that patients in cluster 5 had the worst prognosis (Figure 1D).Immune infiltration estimations for 470 stem cell-related expression profiles were calculated using TIMER2.0 and significant immune scores were distributed among the different clusters (Figure 1E; P<0.001). Further analysis of the relationship between clinical characteristics and cluster types demonstrated that age (Figure 1F), histological grade (Figure 1I) and pathological stage, (Figure 1J) were significantly different (P<0.05) among the clusters, whereas BMI (Figure 1G) and sex (Figure 1H) were not statistically significant.
Gene Expression Profiles Among Clusters
Potential marker genes in specific clusters were assessed based on expression levels. In total 105 genes in cluster 1, 75 genes in cluster 2, 52 genes in cluster 3, 40 genes in cluster 4, 46 genes in cluster 5 and 50 genes in cluster 6, were identified as potential marker genes (Supplementary Table 2). The Kyoto Encyclopedia of Genes and Genomes pathway database was used to analyze these potential marker genes. Cluster 1 marker genes were enriched mainly in the terms’Huntington’s disease’ and’proteasome’ (Supplementary Figure 1A). Cluster 2 marker genes were mainly enriched in “axon guidance” and the’Hippo signaling pathway’ (Supplementary Figure 1B). Cluster 3 marker genes were enriched in “axon guidance” and’breast cancer’ (Supplementary Figure 1C). Cluster 4 marker genes were enriched in “thyroid hormone signaling” and’prion disease’ (Supplementary Figure 1D). Cluster 5 marker genes were enriched in “microRNAs in cancer” and’EGFR tyrosine kinase inhibitor resistance’ (Supplementary Figure 1E). Cluster 6 marker genes were mainly enriched in “breast cancer”,“cellular senescence” and’Epstein-Barr virus infection’ (Supplementary Figure 1F).
Finding Signature Genes Linked to Prognosis and Survival
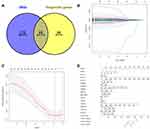
The Mann–Whitney U-test was performed to statistically compare differences between 373 liver tumor tissues and 50 para-tumor tissues. In total, 235 genes were found to be statistically significant (P<0.05). Subsequently, univariate Cox proportional hazards regression was performed. These results are presented in Supplementary Table 3. In total, 87 genes with a log rank value of <0.05 were selected for further analysis (Figure 2A). A Venny plot of 63 common overlapping genes displayed differentially expressed genes and survival differences (Figure 2A) and subsequently 63 key gene interaction pathways were created using theSearch Tool for the Retrieval of Interacting Genes/Proteins database (Supplementary Figure 2). Lasso-Cox regression analysis was also used to filter significant signature genes. Independent variance Cox regression analysis was performed for each gene (Supplementary Table 4) and the results demonstrated that 36 positive genes and eight negative genes were correlated with survival (P<0.05). The optimal lambda value was selected based on the independent variable and was determined to be λ=0.058, which was used for further calculations (Figure 2B). The 95% confidence interval(CI) at different levels of lambda is presented in Figure 2C. In total, 15 genes with the optimal lambda value were identified and analyzed usingmultivariateCox survival analysis, from which eight genes, includingHes family BHLH transcription factor 5(HES5), KIT ligand (KITLG), methyltransferase-like 3 (METTL3), proteasome 26S subunit non-ATPase 1 (PSMD1), Ras-related protein Rab-10 (RAB10), treacle ribosome biogenesis factor 1 (TCOF1), YTH N6-methyladenosine RNA binding protein 2 (YTHDF2) and Zinc Finger CCCH-Type Containing 13(ZC3H13), were included in the final regression model with the optimal Akaike information criterion value (1277.65). Multivariate step regression results are presented in Supplementary Table 5. The nomogram plot demonstrated prognosis predicting of five genes in 1-year, 3-years and 5-years (Figure 2D).
Risk Model Construction Using the Eight Signature Genes
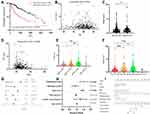
The risk score of each sample was calculated using multivariateCox survival analysis of the aforementioned 15 optimal lambda genes.Subsequently, a comparison of risk scores and clinical characteristics was performed. Statistically significant differences in the overall survival analysis were determined between patients with high and low risk scores (Figure 3A; P<0.001), whereby patients with high risk scores were determined to have a poorer prognosis. No statistically significant differences were reported between risk scores and age (Figure 3B; R2=−0.04, P=0.46), or sex (Figure 3C; P=0.32).However, a marked negative correlation was identified between risk scores and BMI (Figure 3D; R2=−0.144, P=0.08). The risk score gradually increased with histological grade (Figure 3E) and pathological stage (Figure 3F). Univariate (Figure 3G) and multivariate Cox regression analysis (Figure 3H) demonstrated that risk scores were the most influential in the prognosis of patients with LIHC. The nomogram in Figure 3I plot presents the survival rate at 1, 3 and 5-years. In total, the risk score of each sample from the expression data of eight signature genes was determined to be the most reliable marker for predicting the prognosis of patients with LIHC.
Validation of the Risk Model with External HCC Cohorts
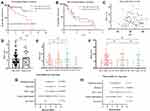
External HCC cohorts from the GEO dataset, GSE76427, were investigated to validate the robustness of the aforementioned risk model. Global mRNA expression profiles were collated from 115 primary tumor tissue samples and 52 adjacent non-malignant tissue samples, derived from a total of 115 patients with LIHC.10 The expression data from the previously identified 8 signature genes were extracted for further Cox regression analysis and risk scores were predicted for further comparisons. Statistically significant overall survival (Figure 4A; P<0.001) but not recurrence free survival (Figure 4B; P=0.204), was determined between patients with high and low risk scores, which further supported the aforementioned results. No significant differences were demonstrated between risk scores and age (Figure 4C; R2=0.07, P=0.477), or sex (Figure 4D; P=0.365). The risk score gradually increased among pathological stage (Figure 4E) and BCLC stage (Figure 4F). The classification system sorted patients withLIHCintothree categories: 1) Stage A (early stage); 2) stage B (intermediate stage);and 3) stage C (advanced stage). Univariate (Figure 4G) and multivariate Cox regression analysis (Figure 4H) revealed risk scores were the most influential in determining the prognosis of patients with LIHC. Moreover, the eight signature genes. Including HES5, KITLG, METTL3, PSMD1, RAB10, TCOF1, YTHDF2 and ZC3H13 displayed higher expression levels in 115 primary tumor tissue samples compared with 52 adjacent non-malignant tissue samples (Figure 5A–H). In summary, these results indicated that these aforementionedeightstem cell development-related signature genes may potentially be used to predict the prognosis of LIHC.
Discussion
As with other types of cancer, HCC displays a high level of heterogeneity.11 HCC occurs as a result of complex genetic and cellular disorders, which drive the formation of primary liver cancer. For numerous types of cancer, molecular-driven therapies for specific patient groups can be successful; however, the treatment options for HCC are limited. Heterogeneous HCC tumors lack representative molecular and cellular markers and therefore targeted treatment among patients is difficult.12 The advancement and widespread application of next-generation sequencing technology has enabled researchers to not only examine the details of genetic changes within HCC cells, but also to investigate the precise composition of different cell types in the tumor microenvironment and their interactions with HCC cells. The information generated and deposited in large public databases provides new insights and better defines the heterogeneity of tumors among patients and the plasticity of HCC cells. In the present study clustering for patients with HCC was performed based on RNA-seq data.The results identified six clusters, which in terms of genetic makeup and immune cell infiltration, demonstrated that certaintumorsamplesdisplayed high levels of similarity, whereas others were considerably different. These results therefore suggested that biopsies from the same tumor may produce different information according to the location of the sample, which could affect the clinical decisions made. Therefore, the present study aimed to understand how tumors were clustered according to genetic markers, which is important for future cancer research and effective cancer therapeutics.
At present, the identification method forTSCs is not fully developed and the proportion of TSCs is very small and are therefore difficult to detect. Furthermore, it is impossible to identify TSCs from their morphology, and functional methods must be used to identify their two main biological characteristics: 1) Self-renewal ability; and 2) differentiation potential.13 Consequently,researchers are attempting to identify the characteristic biomarkers of solid tumor stem cells. Previous study have mainly focused on the screening of cell surface markers. Certain highly expressed markers have been screened, including oval cell marker 6, cytokeratin(CK)7 and CK19, and with continuous focus on liver stem cell research, other new markers have been discovered. A previous study reported that different pathological tissue types of primary liver cancer can express CK7, CK19, AFP, tyrosine-protein kinase Kit and cell surface antigen Thy-1, multiple hepatic stem cell markers that may be related to heterogeneity and differentiation of hepatic stem cells.14 The key to determining liver cancer stem cell markers is to be able to distinguish liver cancer stem cells from normal cells or precancerous cells and to isolate them from HCC. However, to the best of our knowledge liver cancer stem cells have not previously been isolated from any liver source. Moreover, there is no morphological difference between liver cancer stem cells and other liver-derived cells. Villanueva et al reviewed the recent genomics and signaling pathways of HCC. However, most of those listed are similar to those of HCC.15 Furthermore, related gene products are non-specific and it is therefore difficult to determine gene products that are specifically related to HCC. Current study are attempting to identify signature genes to enable the prediction of HCC prognosis. As an alternative to cell surface markers, the present study demonstrated that the eight identified signature genes, including HES5, KITLG, METTL3, PSMD1, RAB10, TCOF1, YTHDF2 and ZC3H13,exhibited high performance levels in predicting HCC prognosis.
The role of METTL3 in the development of HCC has previously been elucidated. METTL3 is a pivotal methyltransferase and essential to the performance of m6A modification.16 METTL3 can regulate RNA expression in a m6A-dependent manner and contributes to the carcinogenesis, tumor progression and drug resistance of HCC. YTHDF2, which is also known as an m6A “reader”,is capable of recognizing and binding to m6A modified sequences. The function of YTHDF2 is associated with mRNA degradation. Moreover, METTL3 is involved in YTHDF2 downstream regulation in an m6A-dependent manner.17 Increased RAB10 expression has also been linked to a poor HCC prognosis and is accompanied by pathological complications, including distant metastasis.18 Moreover, RAB10 has been identified as an oncogene, whereby shRNA-mediated knockdown of RAB10 results in the reduction of HCC cell proliferation and colony formation. Previous study have also reported that high expression levels of HES5 are tightly associated with histological grade and HCC metastasis, as well as being positively correlated with the proliferation nuclear marker protein Ki-67.19 The other signature markers also discovered in the present study are thought to be indirectly associated with the development of HCC.
Conclusion
The results of the present study demonstrated that the eight-gene (HES5, KITLG, METTL3, PSMD1, RAB10, TCOF1, YTHDF2 and ZC3H13) signature used in the current model may be reliable in predicting prognosis in patients with HCC.
Funding
The study was supported by Renmin Hospital of Wuhan University.
Disclosure
The authors declare that they have no conflicts of interest in this work.
References
1. Shariff MI, Cox IJ, Gomaa AI, et al. Hepatocellular carcinoma: current trends in worldwide epidemiology, risk factors, diagnosis and therapeutics. Expert Rev Gastroenterol Hepatol. 2009;3(4):353–367. doi:10.1586/egh.09.35
2. Liu C, Wu J, Chang Z. Trends and age-period-cohort effects on the prevalence, incidence and mortality of hepatocellular carcinoma from 2008 to 2017 in Tianjin, China. Int J Environ Res Public Health. 2021;18(11):6034.
3. Ashtari S, Pourhoseingholi MA, Sharifian A, et al. Hepatocellular carcinoma in Asia: prevention strategy and planning. World J Hepatol. 2015;7(12):1708. doi:10.4254/wjh.v7.i12.1708
4. Yang T, Lu J, Wu M. Hepatocellular carcinoma in China. Student BMJ. 2010;18:C1026. doi:10.1136/sbmj.c1026
5. Collins AT, Berry PA, Hyde C, et al. Prospective identification of tumorigenic prostate cancer stem cells. Cancer Res. 2005;65(23):10946–10951. doi:10.1158/0008-5472.CAN-05-2018
6. Liu YC, Yeh CT, Lin KH. Cancer stem cell functions in hepatocellular carcinoma and comprehensive therapeutic strategies. Cells. 2020;9(6):1331. doi:10.3390/cells9061331
7. Chiba T, Iwama A, Yokosuka O. Cancer stem cells in hepatocellular carcinoma: therapeutic implications based on stem cell biology. Hepatol Res. 2016;46(1):50–57. doi:10.1111/hepr.12548
8. Cheung VC, Tresch MC. Non-negative matrix factorization algorithms modeling noise distributions within the exponential family. Conf Proc IEEE Eng Med Biol Soc. 2005;2005:4990–4993. doi:10.1109/IEMBS.2005.1615595
9. Van der Maaten L, Hinton G. Visualizing data using t-SNE. J Mach Learn Res. 2008;9:11.
10. Grinchuk OV, Yenamandra SP, Iyer R, et al. Tumor-adjacent tissue co-expression profile analysis reveals pro-oncogenic ribosomal gene signature for prognosis of resectable hepatocellular carcinoma. Mol Oncol. 2018;12(1):89–113. doi:10.1002/1878-0261.12153
11. Friemel J, Rechsteiner M, Frick L, et al. Intratumor heterogeneity in hepatocellular carcinoma. Clin Cancer Res. 2015;21(8):1951–1961. doi:10.1158/1078-0432.CCR-14-0122
12. Lin DC, Mayakonda A, Dinh HQ, et al. Genomic and epigenomic heterogeneity of hepatocellular carcinoma. Cancer Res. 2017;77(9):2255–2265. doi:10.1158/0008-5472.CAN-16-2822
13. Tomuleasa C, Soritau O, Rus Ciuca D, et al. Isolation and characterization of hepatic cancer cells with stem-like properties from hepatocellular carcinoma. J Gastrointestin Liver Dis. 2010;19(1):61–67.
14. Lingala S, Cui YY, Chen X, et al. Immunohistochemical staining of cancer stem cell markers in hepatocellular carcinoma. Exp Mol Pathol. 2010;89(1):27–35. doi:10.1016/j.yexmp.2010.05.005
15. Villanueva A, Newell P, Chiang DY, et al. Genomics and signaling pathways in hepatocellular carcinoma. Semin Liver Dis. 2007;27(1):55–76. doi:10.1055/s-2006-960171
16. Pan F, Lin X, Hao L, et al. The role of RNA methyltransferase METTL3 in hepatocellular carcinoma: results and perspectives. Front Cell Dev Biol. 2021;9:1191. doi:10.3389/fcell.2021.674919
17. Chen M, Wei L, Law CT, et al. RNA N6‐methyladenosine methyltransferase‐like 3 promotes liver cancer progression through YTHDF2‐dependent posttranscriptional silencing of SOCS2. Hepatology. 2018;67(6):2254–2270. doi:10.1002/hep.29683
18. Zhang YJ, Pan Q, Yu Y, et al. microRNA-519d induces autophagy and apoptosis of human hepatocellular carcinoma cells through activation of the AMPK signaling pathway via Rab10. Cancer Manag Res. 2020;12:2589. doi:10.2147/CMAR.S207548
19. Zhu G, Shi W, Fan H, et al. HES5 promotes cell proliferation and invasion through activation of STAT3 and predicts poor survival in hepatocellular carcinoma. Exp Mol Pathol. 2015;99(3):474–484. doi:10.1016/j.yexmp.2015.09.002
 © 2022 The Author(s). This work is published and licensed by Dove Medical Press Limited. The full terms of this license are available at https://www.dovepress.com/terms.php and incorporate the Creative Commons Attribution - Non Commercial (unported, v3.0) License.
By accessing the work you hereby accept the Terms. Non-commercial uses of the work are permitted without any further permission from Dove Medical Press Limited, provided the work is properly attributed. For permission for commercial use of this work, please see paragraphs 4.2 and 5 of our Terms.


