")
Back to Journals » International Journal of General Medicine » Volume 14
Identification of Prognosis-Associated Biomarkers in Thyroid Carcinoma by a Bioinformatics Analysis
Authors Qin Y
Received 6 July 2021
Accepted for publication 2 September 2021
Published 16 September 2021 Volume 2021:14 Pages 5737—5747
DOI https://doi.org/10.2147/IJGM.S327497
Checked for plagiarism Yes
Review by Single anonymous peer review
Peer reviewer comments 2
Editor who approved publication: Dr Scott Fraser
Yong Qin
Department of Thyroid Surgery, Bishan Hospital of Chongqing, Chongqing, 402760, People’s Republic of China
Correspondence: Yong Qin
Department of Thyroid Surgery, Bishan Hospital of Chongqing, 9 Shuang Xing Avenue, Bishan District, Chongqing, 402760, People’s Republic of China
Tel +8615123202002
Email [email protected]
Background: This study aimed to identify the key genes associated with prognosis in thyroid cancer (TC), and to explore potential pathways.
Methods: GSE66783, GSE58545, and GSE129562 datasets were used to identify differentially expressed genes (DEGs) between tumor and normal tissues, followed by KEGG analyses on DEGs. The protein–protein interaction (PPI) network of DEGs was subsequently constructed to find the top 10 hub genes and seed genes in the whole network. Furthermore, the mRNA expressions of hub genes and prognostic values were explored. Regarding the seed gene, pathway activity score and GSEA analyses were conducted as well.
Results: 1) A total of 183 DEGs were consistently expressed in three datasets comprising 76 up-regulated and 107 down-regulated genes. DEGs were mainly enriched in the p53 signaling pathway, complement and coagulation cascades, and hedgehog signaling pathway. 2) The top 10 hub genes, including CCND1, TIMP1, ICAM1, MET, PLAU, LDLR, PLAUR, ITGA2, ITGA3, and LGALS3, were identified. All hub genes were highly expressed in TC compared with normal samples. 3) High expression of CCND1, TIMP1, MET, and LGALS3 statistically correlated with a favorable prognosis of patients. Poor survival was observed in patients with ITGA2 and ITGA3 high expression. There was no association between ICAM1, PLAU, and PLAUR expression and survival of patients. LGALS3 and TIMP1 were further identified as independent prognostic factors in TC. 4) Among 10 hub genes, TIMP1 was determined as the seed gene, indicating its significance in the whole network. We further found that in most of the famous cancer-related pathways, TIMP1 higher expression caused a lower pathway activity, suggesting its inhibitory effect to these pathways in TC. In addition, TIMP1 positively correlated with the p53 signaling pathway, complement, and coagulation cascades involved in TC.
Conclusion: The present study provided seven prognosis-associated genes in TC and revealed several significant pathways, which contributed to elucidate the pathogenesis of TC.
Keywords: thyroid cancer, differentially expressed genes, prognosis, TIMP1
Introduction
Thyroid cancer (TC) is a common endocrine malignancy with a rapidly increasing incidence worldwide, and the estimated new cases and deaths are notably higher in women than in men.1 Papillary thyroid carcinoma (PTC) is identified as the most common pathological type of TC, and accounts for approximately 80–85% of all cases. Due to the treatability and excellent survival rates, TC has been regarded as a good cancer.2 However, some patients still face the risk of dedifferentiating into more aggressive disease such as metastatic differentiated thyroid cancer, which is insensitive to conventional therapies and ultimately caused poor patient survival.3 Thus, it is essential to clarify the mechanisms of TC and identify unknown biomarkers.
Recently, accumulating evidence demonstrated the participation of multiple genes and cellular pathways in the occurrence and development of thyroid cancer. A previous study suggested that down-regulation of Cyclin D1 (CCND1) induced the G1-phase arrest, and then suppressed the proliferation of thyroid cancer cells.4 In addition, CCND1 polymorphism contributed to the susceptibility of cancer, especially in older subjects and female patients.5 Related research has demonstrated that tissue inhibitor of metalloproteinases (TIMP1) might be helpful for the development of gene panel for thyroid nodules diagnosis.6 TIMP1 gene and protein were also involved in the regulation of cancer cell proliferation and metastasis.7 Although a great deal of genes and pathways have been reported in deciphering molecular mechanisms of thyroid cancer, more crucial genes and pathways still need to be identified to give the full view of the progression of thyroid cancer.
In the present study, we proposed to explore the key pathways and genes involved in TC with the aid of bioinformatics analysis. Three GEO datasets, including GSE66783, GSE58545, and GSE129562, were obtained, and in total 183 consistent differentially expressed genes (DEGs) from three datasets were selected for functional enrichment analysis, followed by protein–protein interaction (PPI) network construction and hub genes identification. Furthermore, the potential value of hub genes in thyroid cancer were investigated. This study provided a better understanding of the underlying mechanisms, and was conducive to find new biomarkers for TC.
Methods
GEO Datasets Selection
The gene expression profiles associated with TC were obtained from the GEO database (https://www.ncbi.nlm.nih.gov/geo/). The screening criteria were as follows: 1) the key word was papillary thyroid carcinoma OR PTC; 2) samples contained cancer and normal tissues; 3) experiment type was expression profiling by array; and 4) organism was homo sapiens. We finally selected three GEO datasets including GSE66783, GSE58545, and GSE129562. The GSE66783 dataset included 10 samples with five PTC tissues and five noncancerous thyroid tissue samples. GSE58545 consisted of 27 TC tissues and 18 normal samples. In the GSE129562 dataset, 16 samples were included with eight PTC tissues and eight noncancerous tissues.
Identification of Differentially Expressed Genes
The online program of GEO2R (https://www.ncbi.nlm.nih.gov/geo/geo2r/) was applied to find the differentially expressed genes (DEGs) between PTC and normal tissues. In addition, a volcano plot for visualization of DEGs in each dataset was generated as well. We identified the differentially expressed genes (DEGs) as the threshold of |Log2FC|> 1 and the adjusted P-value<0.01. The consistent DEGs from three datasets were integrated using Venn analysis (http://bioinformatics.psb.ugent.be/webtools/Venn/).
Protein–Protein Network Construction among DEGs
To characterize the functional roles of the above DEGs, we used the String database (https://string-db.org/) to construct the protein–protein network (PPI) among DEGs with setting the required minimum interaction score as medium confidence, followed by visualization by Cytoscape version 3.7.2. Subsequently, we used the ClueGO plug-in of Cytoscape to perform the GO annotation including molecular function (MF), biological process (BP), cellular component (CC), and KEGG pathway analysis. P<0.05 was set as the cut‐off value. At the same time, the top 10 hub genes in the whole network were determined with the plug-in cytoHubba of Cytoscape, and the degree method was selected among 12 computing methods. Especially, a seed gene among 10 hub genes can be found.
Expression Analysis on 10 Hub Genes
The mRNA expression of 10 hub genes in TC and normal groups were analyzed in the GSCA database (http://bioinfo.life.hust.edu.cn/GSCA/). The fold change is calculated by mean (Tumor)/mean (Normal), P-value was estimated by t-test and was further adjusted by FDR. In addition, the difference of gene mRNA expression between stages and expression trend from early stage to late stage were also performed. The stage subgroup was compared through ANOVA test. Trend analysis was performed by Mann-Kendall Trend Test. Subsequently, KEGG enrichment analysis was performed by R package cluster Profiler version 2.4.3, and P-value was adjusted to get FDR (Benjamini & Hochberg) and Q value. Only terms with FDR <0.05 remained.
Prognosis Analysis on 10 Hub Genes
The prognostic impact of 10 hub gene expressions on TC patients was analyzed in the Kaplan-Meier Plotter database (http://kmplot.com/). The method of dividing patients was set according to auto select best cutoff, and subjects were divided into high and low expression groups. The clinical outcome analyzed of patients was overall survival, and the follow-up threshold was 240 months. The significance threshold was set at P=0.05 and FDR=10%. Taking the clinical characteristics and immune cell into consideration, we performed Cox regression analysis to explore the independent prognostic value of survival-related hub genes in TC.
Pathway Enrichment Analysis on Seed Gene TIMP1
Among the 10 hub genes, TIMP1 was determined as the seed gene. We then assessed the potential effect of TIMP1 on 10 important cancer related pathways in GSCA. The pathway in GSCA included TSC/mTOR, RTK, RAS/MAPK, PI3K/AKT, Hormone ER, Hormone AR, EMT, DNA Damage Response, Cell Cycle, and Apoptosis pathways. Samples were divided into two groups (High and Low) by median gene expression, the difference of pathway activity score (PAS) between groups is defined by Student t-test, P-value was adjusted by FDR, FDR≤0.05 was considered as significant. When PAS (Gene A High expression) > PAS (Gene A Low expression), we consider gene A may have an activated effect to a pathway, otherwise have an inhibitory effect to a pathway. We also performed gene set enrichment analysis (GSEA) to investigate the potential function of TIMP1 in thyroid cancer. Nominal P‑value<0.05 and FDR q‑value<25% were considered as significant terms.
Results
Identification of DEGs in GEO Datasets
According to the screening criteria, three GEO datasets were selected. In total, 40 thyroid tumor tissues and 31 normal tissues were enrolled in our study. We extracted 821, 350, and 760 up-regulated DEGs and 628, 377, and 480 down-regulated DEGs from GSE66783, GSE129562, and GSE58545, respectively. The volcano plots of DEGs distribution in each dataset were shown in Figure 1A. In total, 183 DEGs consistently expressed in three datasets were identified by Venn analysis, and 76 genes were up-regulated while 107 genes were down-regulated (Figure 1B).
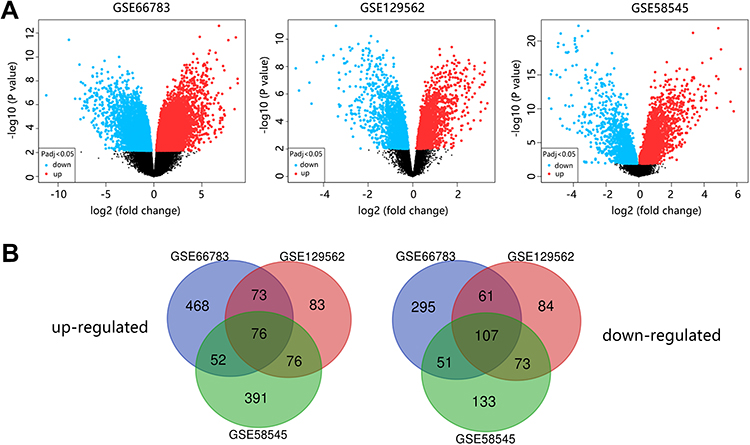 |
Figure 1 Identification of 183 DEGs in three GEO datasets. (A) Volcano plots of the distribution of DEGs in each dataset. (B) Venn diagram of up-regulated and down-regulated DEGs. |
Protein–Protein Network Construction and Hub Genes Identification
We obtained a PPI network from String and Cytoscape to describe protein interactions. There were 139 nodes and 258 edges in the PPI network (Figure 2A). Regarding the DEGs, we performed the GO annotation and KEGG pathway analysis (Figure 3). Functional enrichment analysis indicated that biological process (BP) that DEGs significantly participated in included amyloid-beta clearance by cellular catabolic process, melanocyte differentiation, retinoic acid receptor signaling pathway and regulation of cell adhesion mediated by integrin. The enriched cellular component (CC) of DEGs mainly contained invadopodium membrane, lamellar body and invadopodium. The molecular function (MF) associated with DEGs mainly included low-density lipoprotein particle receptor activity, peptidase activator activity involved in the apoptotic process, and virus receptor activity.
 |
Figure 2 Protein–protein interaction (PPI) network construction of DEGs. (A) PPI networks. Green nodes represented the down-regulated genes, while red nodes represented the up-regulated genes. (B) The top 10 hub genes ranked by Degree method. Abbreviation: DEGs, differentially expressed genes. |
 |
Figure 3 GO annotation and KEGG pathway analyses on DEGs. Abbreviations: BP, biological process; CC, cellular component; MF, molecular function. |
Several significant KEGG pathways associated with DEGs were predicted as well, including Tyrosine metabolism, p53 signaling pathway, Hedgehog signaling pathway, Complement and coagulation cascades, Focal adhesion and ECM-receptor interaction. Through plug-in cytoHubba of Cytoscape, we detected 10 significant nodes from the PPI network, namely CCND1, TIMP1, ICAM1, MET, PLAU, LDLR, PLAUR, ITGA2, ITGA3, LGALS3, and they were considered as the hub genes in the whole network (Figure 2B). Additionally, TIMP1 was determined as the seed gene among 10 hub genes, suggesting its important regulation on other genes.
The mRNA Expression and Pathway Activity of 10 Hub Genes in TC
Subsequently, we assessed the mRNA expression of the top 10 hub genes in normal and thyroid cancer tissues. Differential expression analysis (Figure 4A) showed that all hub genes were highly expressed in TC compared with the normal group (all P<0.05). We also explored the mRNA expression of hub genes in TC based on clinical stages. Results suggested that the expression of CCND1 was not associated with cancer stages (Figure 4B, P=0.27), and mRNA expression of the remaining hub genes correlated with clinical stage (all P<0.001). Expression tendency analysis (Figure 4C) found that higher expression was observed in patients with advanced stage for each hub gene. We also performed gene set enrichment analysis on 10 hub genes, and we found that 10 hub genes mainly participated in proteoglycans in cancer, the PI3K-AKT signaling pathway, and focal adhesion (Figure 4D).
 |
Figure 4 The mRNA expression and pathway activity of 10 hub genes in TC. (A) Differential expression of hub genes between tumor and normal tissues in TCHA. Bubble color from purple to red represent the fold change between tumor versus normal. The size of dots are positively correlated with the FDR significance. (B) Difference of 10 hub gene mRNA expression between stages in TC. Bubble color from blue to red represents the significance of FDR; the bubble size is positively correlated with the statistical significance. The black outline border of bubbles indicates FDR <0.05. (C) Trend of mRNA expression from early stage to late stage. (D) Potential effect of 10 hub genes on pathway activity. |
Prognostic Value of 10 Hub Genes in TC
We then explored the prognostic impacts of 10 hub genes on the prognosis of TC patients. The clinical characteristics of TC patients are presented in Table 1. The results showed that the patient’s age and clinical stage were significantly correlated with the progression-free survival of TC patients. However, patient’s and cancer subtypes did not influence the prognosis of TC patients.
 |
Table 1 The Clinical Characteristics of the TC Patients |
The influence of 10 hub genes expression on the prognosis of TC patients was then analyzed by Kaplan-Meier Plotter database. Figure 5 indicates that a favorable prognosis was observed in patients with mRNA high expression of CCND1 (HR=0.28, P=0.0066), TIMP1 (HR=0.33, P=0.021), MET (HR=0.32, P=0.02), and LGALS3 (HR=0.24, P=0.0026). However, high expression of LDLR (HR=2.76, P=0.013), ITGA2 (HR=3.32, P=0.0027), and ITGA3 (HR=3.09, P=0.0025) caused a poor prognosis of patients. The association of patient prognosis with ICAM1 (HR=0.54, P=0.23), PLAU (HR=0.39, P=0.061), and PLAUR (HR=2.02, P=0.068) expressions was not observed.
 |
Figure 5 The influence of 10 hub genes expression on the prognosis of thyroid cancer patients. |
Survival analysis indicated that mRNA expression of six hub genes, including CCND1, TIMP1, MET, LDLR, ITGA2, ITGA3, and LGSLS3, was statistically associated with the prognosis of TC patients. Therefore, we predicted the potential independent prognostic value of six genes in TC after taking clinical characteristics and immune cells into consideration. Cox regression analysis indicated that among six prognosis-related hub genes, LGALS3 (Table 2, P=0.039) and TIMP1 (Table 3, P=0.016) were determined as independent prognostic factors in TC. We found no independent prognostic value of the remaining four hub genes (data was not shown).
 |
Table 2 Cox Regression Analysis for Predicting the Independent Prognostic Value of LGALS3 in TC |
 |
Table 3 Cox Regression Analysis for Predicting the Independent Prognostic Value of TIMP1 in TC |
Enrichment Analysis on TIMP1
Due to the important role of TIMP1 as the seed gene and significant independent prognostic value in TC, we further explored its potential effect on 10 important cancer related pathways (Figure 6). We found that pathway activity of Hormone ER and Apoptosis was not different between TIMP1 high and low expression groups (all FDR>0.05). Regarding the remaining pathways, lower pathway activity score was observed in TIMP1 higher expression group (all FDR<0.05) other than EMT pathway. The above result suggested that TIMP1 may be considered and has a potential inhibitory effect on these pathway activities, while exerting a promoting effect on EMT in TC.
 |
Figure 6 Potential effect of TIMP1 expression on pathway activity of 10 important cancer related pathways in TC. P-value was adjusted by FDR, FDR≤0.05 was considered as significant. |
Finally, we performed GSEA analysis on TIMP1 to reveal the potential mechanism involved in TC. A total of 33 positive pathways and 28 negative pathways associated with TIMP1 were found. Due to the favorable prognostic impact of TIMP1 high expression on the patient’s survival, we were inclined to explore the TIMP1-positive pathways. Two pathways, including Complement and coagulation cascades, and p53 signaling pathway, were also predicted by GSEA analysis (Table 4). In addition, GSEA analysis indicated that TIMP1 was significantly associated with the Autoimmune thyroid disease and Chemokine signaling pathway.
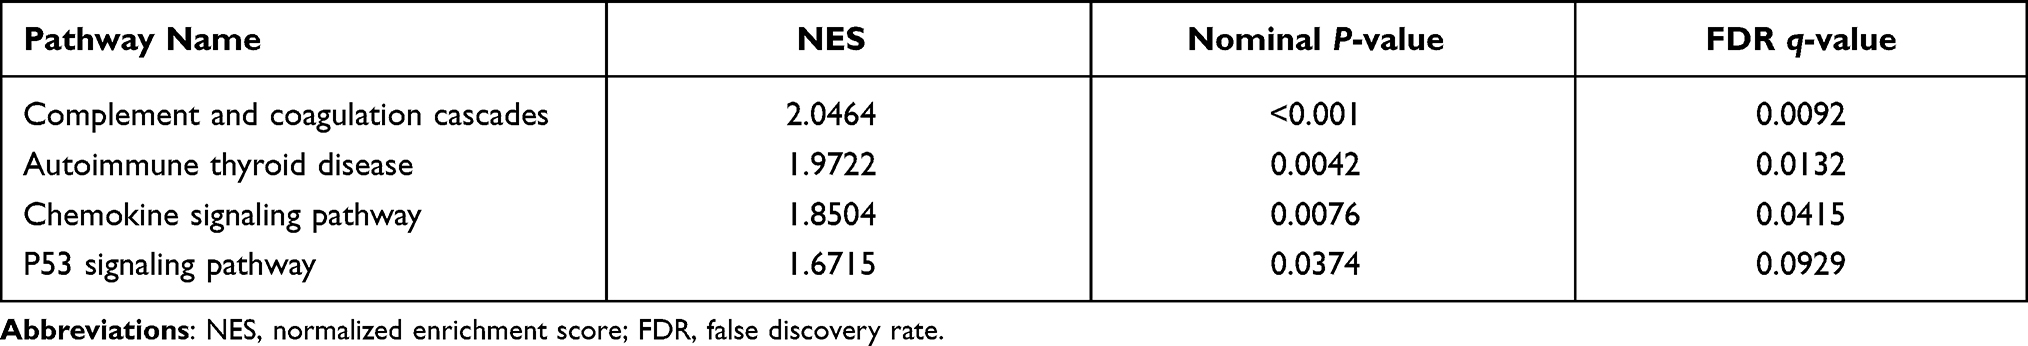 |
Table 4 GSEA Analysis on TIMP1 Involved in Thyroid Carcinoma |
Discussion
Most TC cases were concealed and characterized by slow progression and a good overall prognosis, but a small number of cases showed increased invasiveness and recurrence after surgery. Therefore, it was of great importance to identify the pivotal genes and pathways associated with the development of TC. In our study, three GEO datasets, including GSE66783, GSE129562, and GSE58545, were obtained and further analyzed by bioinformatics methods. A total of 183 DEGs were identified, including 76 up-regulated genes and 107 down-regulated genes.
KEGG pathway analysis showed that 183 DEGs were significantly associated with Tyrosine metabolism, p53 signaling pathway, Hedgehog signaling pathway, Complement and coagulation cascades, Focal adhesion and ECM-receptor interaction. Recently, several tyrosine kinase inhibitors, such as sorafenib and lenvatinib, have been used to treat patients with TC through restoring sodium iodide symporter expression and function, and radioactive iodine uptake capacity.8 Another study indicated that sorafenib lenvatinib alternating treatment was more effective than individual treatment with sorafenib or lenvatinib in inhibiting thyroid cancer progression by inducing cell cycle arrest.9 The P53 gene was commonly mutated, especially in anaplastic thyroid cancer. The study indicated that transfection with wild-type p53 increased the radioiodine uptake and induced the apoptotic cell death by regulating the expression of the NIS.10 The p53 tumor suppressor pathway can block the carcinogenesis by triggering apoptosis and cellular senescence. Another study implied that p53 mutant reactivation, which aimed to restore the tumor-suppressor activity of p53 mutants, might be a novel antitumor strategy in TC.11 A previous study has indicated that hedgehog signaling components were markedly up-regulated in thyroid carcinoma.12 The Hedgehog pathway was widely activated in thyroid neoplasms, and knockdown of sonic hedgehog expression led to the inhibition of cell proliferation.13 Therefore, hedgehog inhibitors have potential as a novel therapeutic target for thyroid cancer treatment. Complement and coagulation cascades signaling was one of the most frequently enriched functional pathways in the bioinformatic studies.14 The DEGs in this pathway correlated with chemotherapy resistance and survival of sarcoma patients.15 Dysregulation of this pathway was usually triggered by dysfunctions of the innate immune system.16 The complement and coagulation cascades signaling pathway, focal adhesion, and ECM-receptor interaction played an important role in the pathogenesis of cancers.
From the PPI network, we identified the top 10 hub genes among 183 DEGs, including CCND1, TIMP1, ICAM1, MET, PLAU, LDLR, PLAUR, ITGA2, ITGA3, and LGALS3. Further, we found that 10 hub genes were all highly expressed in TC compared with the normal group. Gene set enrichment analysis indicated that 10 hub genes mainly participated in proteoglycans in cancer, the PI3K-AKT signaling pathway, and focal adhesion. Among 10 hub genes, CCND1, TIMP1, MET, LDLR, ITGA2, ITGA3, and LGSLS3 were statistically associated with the prognosis of TC patients.
Cyclin D1 (CCND1) was abnormally overexpressed in thyroid cancers, but mutations of the gene were rare. No genetic alteration of CCND1 was observed in this study as well. It has been demonstrated that CCND1 splice variant acted as a novel diagnostic and predictive biomarker for thyroid cancer.17 Enhancement of CCND1 may be a potential mechanism for recurrence and aggressiveness of papillary thyroid carcinoma.18 Tissue inhibitor of metalloproteinases (TIMP-1) bound its surface receptor CD63 and led to Akt activation, which exerted anti-apoptotic behavior and promoted cell invasion.19 In this study, we found that high expression of TIMP1 inhibited the pathway activity of the PI3K-Akt pathway, which might be associated with the good prognosis of patients. In thyroid cancer tissues, MET mRNA and protein levels were up-regulated, and MET closely correlated with the PI3K and AKT signaling.20 Circular low-density lipoprotein receptor (Circ LDLR) knockdown decelerated the progression of papillary thyroid carcinoma by regulating lipase H.21 Our study found that ITGA2 and ITGA3 high expression were significantly associated with the poor prognosis of TC patients. A previous study suggested that ropivacaine inhibited the proliferation, invasion and migration, as well as promoted apoptosis of thyroid cancer cells via regulating ITGA2 expression.22 Targeting on ITGA3 could prevent thyroid cancer progression through disturbing cell cycling and autophagy.23 A recent study indicated that galectin-3, encoded by LGALS3, has functioned as a serum marker for thyroid cancer diagnosis, and as a target for cancer imaging and therapy in the pre-clinical setting.24 Whether these candidate genes could become the potential molecular targets requires further study and clinical trial.
Among seven prognosis related genes, TIMP1 and LGALS3 were determined as independent prognostic factors in TC. High expression of TIMP1 and LGALS3 led to a good prognosis of patients. In addition, TIMP1 was defined as the seed gene among 10 hub genes. A previous study has indicated epigenetic regulation of the TIMP1/MMP9 pathway was related to the tumor migration suppression in PTC.25 We further explored the potential effect of TIMP1 expression on the pathway activity of 10 famous cancer related pathways in TC. We found that almost all the pathway types showed a lower pathway activity score in the TIMP1 higher expression group except the EMT pathway. GSEA analysis also indicated that TIMP1 was related to complement, coagulation cascades, p53 signaling pathway, autoimmune thyroid disease, and the chemokine signaling pathway with positive correlation. Above all, we speculated that TIMP1 might exert an important role in TC, possibly through regulating these cancer related pathways. The detained function of TIMP1 in TC needs further experimental verification.
Conclusion
In this study, we screened out 183 DEGs between TC and normal tissues, and predicted potential pathways. Importantly, we identified six key hub genes associated with survival of patients which may play a vital role in thyroid cancer pathogenesis. Particularly, ITGA2 and ITGA3 over-expression were associated with a poor prognosis of patients, and may therefore be novel reliable biomarkers for diagnosis, survival, and prognosis in thyroid cancer. However, high expression of CCND1, TIMP1, MET, and LGALS3 was conducive to the patient’s survival. Among six survival-related hub genes, TIMP1 and LGALS3 were determined as independent prognostic factors in TC. Our results provided a more detailed molecular mechanism of tumorigenesis, shedding light on the potential biomarkers and therapeutic targets. However, the interacting mechanism and function of identified genes in TC need to be confirmed further by molecular biological experiments.
Data Sharing Statement
The datasets used and/or analyzed during the current study are available from the corresponding authors upon reasonable request.
Disclosure
The author report no conflicts of interest in this work.
References
1. Siegel RL, Miller KD, Jemal A. Cancer statistics, 2020. CA Cancer J Clin. 2020;70:7–30. doi:10.3322/caac.21590
2. Randle RW, Bushman NM, Orne J, et al. Papillary thyroid cancer: the good and bad of the “good cancer”. Thyroid. 2017;27:902–907. doi:10.1089/thy.2016.0632
3. Shobab L, Gomes-Lima C, Zeymo A, et al. Clinical, pathological, and molecular profiling of radioactive iodine refractory differentiated thyroid cancer. Thyroid. 2019;29:1262–1268. doi:10.1089/thy.2019.0075
4. Sun J, Shi R, Zhao S, et al. E2F8, a direct target of miR-144, promotes papillary thyroid cancer progression via regulating cell cycle. J Exp Clin Cancer Res. 2017;36:40. doi:10.1186/s13046-017-0504-6
5. Aytekin T, Aytekin A, Maralcan G, et al. A cyclin D1 (CCND1) gene polymorphism contributes to susceptibility to papillary thyroid cancer in the Turkish population. Asian Pac J Cancer Prev. 2014;15:7181–7185. doi:10.7314/APJCP.2014.15.17.7181
6. Zhang K, Liu J, Li C, Peng X, Li H, Li Z. Identification and validation of potential target genes in papillary thyroid cancer. Eur J Pharmacol. 2019;843:217–225. doi:10.1016/j.ejphar.2018.11.026
7. Ma X, Pietsch J, Wehland M, et al. Differential gene expression profile and altered cytokine secretion of thyroid cancer cells in space. FASEB J. 2014;28:813–835. doi:10.1096/fj.13-243287
8. Oh JM, Baek SH, Gangadaran P, et al. A novel tyrosine kinase inhibitor can augment radioactive iodine uptake through endogenous sodium/iodide symporter expression in anaplastic thyroid cancer. Thyroid. 2020;30:501–518. doi:10.1089/thy.2018.0626
9. Kim SY, Kim SM, Chang HJ, et al. SoLAT (sorafenib lenvatinib alternating treatment): a new treatment protocol with alternating sorafenib and lenvatinib for refractory thyroid cancer. BMC Cancer. 2018;18:956. doi:10.1186/s12885-018-4854-z
10. Liu L, Li D, Chen Z, et al. Wild-type P53 induces sodium/iodide symporter expression allowing radioiodide therapy in anaplastic thyroid cancer. Cell Physiol Biochem. 2017;43:905–914. doi:10.1159/000481640
11. Messina RL, Sanfilippo M, Vella V, et al. Reactivation of p53 mutants by prima-1 [corrected] in thyroid cancer cells. Int J Cancer. 2012;130:2259–2270. doi:10.1002/ijc.26228
12. Bohinc B, Michelotti G, Diehl AM. Hedgehog signaling in human medullary thyroid carcinoma: a novel signaling pathway. Thyroid. 2013;23:1119–1126. doi:10.1089/thy.2012.0474
13. Xu X, Ding H, Rao G, et al. Activation of the Sonic Hedgehog pathway in thyroid neoplasms and its potential role in tumor cell proliferation. Endocr Relat Cancer. 2012;19:167–179. doi:10.1530/ERC-11-0305
14. Chen L, Yue J, Han X, Li J, Hu Y. Ouabain rescues rat nephrogenesis during intrauterine growth restriction by regulating the complement and coagulation cascades and calcium signaling pathway. J Dev Orig Health Dis. 2016;7:91–101. doi:10.1017/S2040174415007242
15. Zhang J, Chen M, Zhao Y, et al. Complement and coagulation cascades pathway correlates with chemosensitivity and overall survival in patients with soft tissue sarcoma. Eur J Pharmacol. 2020;879:173121. doi:10.1016/j.ejphar.2020.173121
16. Castiblanco-Valencia MM, Fraga TR, Pagotto AH, et al. Plasmin cleaves fibrinogen and the human complement proteins C3b and C5 in the presence of Leptospira interrogans proteins: a new role of LigA and LigB in invasion and complement immune evasion. Immunobiology. 2016;221:679–689. doi:10.1016/j.imbio.2016.01.001
17. Jeon S, Kim Y, Jeong YM, Bae JS, Jung CK. CCND1 splice variant as a novel diagnostic and predictive biomarker for thyroid cancer. Cancers. 2018;10:437. doi:10.3390/cancers10110437
18. Sanjari M, Kordestani Z, Safavi M, Mashrouteh M, FekriSoofiAbadi M, Ghaseminejad Tafreshi A. Enhanced expression of Cyclin D1 and C-myc, a prognostic factor and possible mechanism for recurrence of papillary thyroid carcinoma. Sci Rep. 2020;10:5100. doi:10.1038/s41598-020-61985-1
19. Bommarito A, Richiusa P, Carissimi E, et al. BRAFV600E mutation, TIMP-1 upregulation, and NF-kappaB activation: closing the loop on the papillary thyroid cancer trilogy. Endocr Relat Cancer. 2011;18:669–685. doi:10.1530/ERC-11-0076
20. Liu H, Deng H, Zhao Y, Li C, Liang Y. LncRNA XIST/miR-34a axis modulates the cell proliferation and tumor growth of thyroid cancer through MET-PI3K-AKT signaling. J Exp Clin Cancer Res. 2018;37(1):279. doi:10.1186/s13046-018-0950-9
21. Gui X, Li Y, Zhang X, Su K, Cao W. Circ_LDLR promoted the development of papillary thyroid carcinoma via regulating miR-195-5p/LIPH axis. Cancer Cell Int. 2020;20:241. doi:10.1186/s12935-020-01327-3
22. Qin A, Liu Q, Wang J. Ropivacaine inhibits proliferation, invasion, migration and promotes apoptosis of papillary thyroid cancer cells via regulating ITGA2 expression. Drug Dev Res. 2020;81:700–707. doi:10.1002/ddr.21671
23. Liu H, Chen X, Lin T, Chen X, Yan J, Jiang S. MicroRNA-524-5p suppresses the progression of papillary thyroid carcinoma cells via targeting on FOXE1 and ITGA3 in cell autophagy and cycling pathways. J Cell Physiol. 2019;234:18382–18391. doi:10.1002/jcp.28472
24. Li J, Vasilyeva E, Wiseman SM. Beyond immunohistochemistry and immunocytochemistry: a current perspective on galectin-3 and thyroid cancer. Expert Rev Anticancer Ther. 2019;19:1017–1027. doi:10.1080/14737140.2019.1693270
25. Zhang WQ, Sun W, Qin Y, et al. Knockdown of KDM1A suppresses tumour migration and invasion by epigenetically regulating the TIMP1/MMP9 pathway in papillary thyroid cancer. J Cell Mol Med. 2019;23(8):4933–4944. doi:10.1111/jcmm.14311
 © 2021 The Author(s). This work is published and licensed by Dove Medical Press Limited. The full terms of this license are available at https://www.dovepress.com/terms.php and incorporate the Creative Commons Attribution - Non Commercial (unported, v3.0) License.
By accessing the work you hereby accept the Terms. Non-commercial uses of the work are permitted without any further permission from Dove Medical Press Limited, provided the work is properly attributed. For permission for commercial use of this work, please see paragraphs 4.2 and 5 of our Terms.
© 2021 The Author(s). This work is published and licensed by Dove Medical Press Limited. The full terms of this license are available at https://www.dovepress.com/terms.php and incorporate the Creative Commons Attribution - Non Commercial (unported, v3.0) License.
By accessing the work you hereby accept the Terms. Non-commercial uses of the work are permitted without any further permission from Dove Medical Press Limited, provided the work is properly attributed. For permission for commercial use of this work, please see paragraphs 4.2 and 5 of our Terms.