")
Back to Journals » Journal of Inflammation Research » Volume 16
Identification of Potential Diagnostic Genes of HIV-Infected Immunological Non-Responders on Bioinformatics Analysis
Authors Ding Y, Pu C, Zhang X, Tang G , Zhang F, Yu G
Received 3 November 2022
Accepted for publication 28 March 2023
Published 14 April 2023 Volume 2023:16 Pages 1555—1570
DOI https://doi.org/10.2147/JIR.S396055
Checked for plagiarism Yes
Review by Single anonymous peer review
Peer reviewer comments 2
Editor who approved publication: Professor Ning Quan
Yanhong Ding,1,* Cheng Pu,2,* Xiao Zhang,3 Gaoyan Tang,1 Fengjuan Zhang,3 Guohua Yu1
1Department of Medical Oncology, the First Affiliated Hospital of Weifang Medical University, Weifang, 261032, People’s Republic of China; 2Key Laboratory of Animal Disease and Human Health of Sichuan Province, College of Veterinary Medicine, Sichuan Agricultural University, Wenjiang District, 611130, People’s Republic of China; 3Department of Microbiology, Weifang Center for Disease Control and Prevention, Weifang, 261061, People’s Republic of China
*These authors contributed equally to this work
Correspondence: Guohua Yu, Email [email protected]
Purpose: HIV-infected immunological non-responders (INRs) failed to achieve the normalization of CD4+ T cell counts despite their undetectable viral load. INRs have an increased risk of clinical progressions of Acquired Immunodeficiency Syndrome (AIDS) and non-AIDS events, accompanied by higher mortality rates than immunological responders (IRs). This study aimed to discover the genes, which help to distinguish INRs from IRs and explore the possible mechanism of INRs.
Methods: Screening DEGs between INRs and IRs using GEO microarray dataset GSE143742. DEG biological functions were investigated using GO and KEGG analysis. DEGs and WGCNA linked modules were intersected to find common genes. Key genes were identified using SVM-RFE and LASSO regression models. ROC analysis was done to evaluate key gene diagnostic effectiveness using GEO database dataset GSE106792. Cytoscape created a miRNA-mRNA-TF network for diagnostic genes. CIBERSORT and flow cytometry examined the INRs and IRs immune microenvironments. In 10 INR and 10 IR clinical samples, diagnostic gene expression was verified by RT-qPCR and Western blot.
Results: We obtained 190 DEGs between the INR group and IR group. Functional enrichment analysis found a significant enrichment in mitochondria and apoptosis-related pathways. CD69 and ZNF207 were identified as potential diagnostic genes. CD69 and ZNF207 shared a transcription factor, NCOR1, in the miRNA-mRNA-TF network. Immune microenvironment analysis by CIBERSORT showed that IRs had a higher level of resting memory CD4+ T cells, lower level of activated memory CD4+ T cells and resting dendritic cells than INRs, as confirmed by flow cytometry analysis. In addition, CD69 and ZNF207 were correlated with immune cells. Experiments confirmed the expression of the diagnostic genes in INRs and IRs.
Conclusion: CD69 and ZNF207 were identified as potential diagnostic genes to discriminate INRs from IRs. Our findings offered new clues to diagnostic and therapeutic targets for INRs.
Keywords: HIV, immunological non-responder, immunological responder, diagnostic genes, bioinformatic analysis
Introduction
CD4+ T cells are continuously killed by human immunodeficiency virus (HIV) infection, which results in progressive immunodeficiency, opportunistic diseases, and mortality.1 HIV infection-related morbidity and mortality are drastically reduced with a combination of antiretroviral treatment (cART).2–4 However, a minority of treated individuals failed to restore their cluster of differentiation 4+ (CD4+) T cell counts to the levels observed in uninfected subjects despite the HIV viral load being suppressed to undetectable levels.5,6 These HIV-infected individuals referred to as inadequate immunological responders or immunological non-responders (INRs) remain at greater risk of disease progression and mortality than immune responders (IRs) in whom the CD4+ T cell count is restored.7–9 Therefore, it is critical to investigate INR diagnostic indicators in order to create the groundwork for understanding immunological non-response and clinical diagnosis.
Immune non-response occurs for a variety of reasons in HIV-infected people, including altered immune activation, disrupted cytokine secretion, decreased hematopoiesis of bone marrow, decreased thymic output, residual viral replication, polymorphisms in the cluster of differentiation 14 (CD14) and toll-like receptor genes, and accumulation of lipid metabolites in plasma.10,11 Some specific genetic or metabolic characteristics such as age, baseline CD4+ T lymphocyte levels, and hepatitis C virus (HCV) co-infection12,13 used to predict the immune non-response after cART in HIV-infected individuals, were limited and imprecise. In order to enhance the quality of life of HIV-INRs, it is an essential job to investigate the mechanisms behind the occurrence and development of INR and to identify the factors that might serve as predictors of INR.
In order to decrease the prevalence of these phenomena and enhance the clinical symptoms of INRs, it is necessary to investigate the underlying processes and predicting factors of poor immune responses to cART. Herein, many bioinformatics approaches are utilized to produce diagnostic indicators that may assess immune response and immune non-response based on samples of IRs and INRs received from the Gene Expression Omnibus (GEO) database. Our study aims to explore fundamental mechanisms of INRs by bioinformatics analysis to propose new supplementary targets for defining immune non-response.
Materials and Methods
Data Source
The GSE143742 and GSE106792 datasets were downloaded from the Gene Expression Omnibus (GEO) (http://www.ncbi.nlm.nih.gov/geo) database.14 The GSE143742 dataset contains gene expression profiles between 17 IRs and 44 INRs samples of whole blood. INRs were defined as the CD4+ T cell counts below 350 cells/μL and IRs were defined as the CD4+ T cell counts above 500 cells/μL after receiving cART with virologic control for at least 3 years. The GSE106792 sample included 12 INRs and 12 IRs receiving cART with virologic control for at least 2 years. The detailed information of the datasets was displayed in Table S1.
Identification and Analysis of Differentially Expressed Genes (DEGs)
The DEGs between the IR group and INR group were obtained by “limma” package. Genes without a corresponding gene symbol are separately removed. Genes with more than one probe set are averaged for analysis. The values for statistical significance were set as adjusted p value<0.05 and the |log2 fold change (FC)|>0.5. The results of DEGs were displayed by the heatmap and volcano map. Gene Ontology (GO) and Kyoto Encyclopedia of Genes and Genomes (KEGG) analysis for DEGs were constructed by R package “clusterProfiler”.15 The threshold p-value <0.05 was considered significant for GO and KEGG analysis.
Gene Set Enrichment Analysis (GSEA)
GSEA software (v4.1.0) was used to analyze the whole-genome expression. The enrichment scores (ES) were calculated from weighted Kolmogorov–Smirnov-like statistics and their magnitude reflected the correlation between a gene set and phenotype. The higher ES of the gene set means the higher possibility that this gene set was expected enriched in a particular phenotype.
Weighted Gene Co-Expression Network Analysis (WGCNA)
The elements in the gene matrix of the GSE143742 series were used to construct a scale-free gene co-expression network using the “WGCNA” package.16 The soft-thresholding function was applied to calculate the power parameter. A dynamic tree cut method was utilized to identify co-expressed gene modules, and a dendrogram of genes was produced via a hierarchical clustering approach based on the dissimilarity of the unsigned topological overlap matrix (TOM). Finally, genes with similar expression profiles were grouped into network modules.17
Screening of the Diagnostic Genes
By constructing a penalty function, analyses of Least Absolute Shrinkage and Selection Operator (LASSO) can compress variable coefficients and make some regression coefficients become zero, thereby achieving the purpose of variable selection.18 To screen the key genes, the 26 common genes from the intersection of correlated modules and DEGs were performed the LASSO regression analysis in the “glmnet” package in R. Support Vector Machine-Recursive Feature Elimination (SVM-RFE) is a supervised machine learning technique widely used in pattern recognition and classification problems, which have been used in medical applications to predict whether a new gene falls into one category or the other, thereby classifying the genes.19 The gene signatures were screened by SVM. Subsequently, the common genes obtained by LASSO and SVM-RFE analyses were evaluated by receiver operating characteristic (ROC) curve analysis using “pROC” package.20 To be specific, the genes with an area under the curve (AUC) >0.75 in the GSE143742 dataset and validated in the GSE106792 dataset were considered the diagnostic genes.
Cell-Type Identification by Estimating Relative Subsets of RNA Transcripts (CIBERSORT) Analysis
CIBERSORT used to analyze the gene expression profiles in different immune cell types of tissues was adopted to analyze the normalized GSE143742 expression data. The CIBERSORT analysis was used to estimate the percentage of LM22 (22 immune cell types) in each sample and compare the difference between the INR group and IR group in immune cells. Moreover, a heat map of the 22 immune cells was visualized by the “pheatmap” package. The levels of 22 immune cells between the two groups were compared by the “vioplot” package. The correlation heatmap of 22 kinds of immune cells was performed by the “corrplot” package in R software. P<0.05 was considered significant between the two groups.
Correlation Analysis Between Immune Cells and Diagnostic Genes
The relationship between immune cells and diagnostic genes was performed using Spearman’s rank correlation analysis using R software. The results were visualized by “ggplot2” package, and P-value <0.05 was considered statistically significant.
Prediction of the miRNA-mRNA-TF Regulatory Network
The target microRNAs (miRNAs) of the diagnostic gene were acquired from the miRWalk (http://mirwalk.uni-hd.de/) and miRDB databases (http://mirdb.org). The intersection of miRNAs obtained from the two databases was considered target miRNAs. Network Analyst database was used to predict the target TFs of the diagnostic genes. The miRNA-mRNA, mRNA-TF and miRNA-mRNA-TF internetwork were constructed with Cytoscape software.
Flow Cytometry Analysis
CD45RA-FITC and CD45RO-PE antibodies were obtained from BD Biosciences (San Diego, CA). CD38-APC and CD4-PerCP antibodies were obtained from BioLegend (San Diego, CA). Fresh peripheral blood mononuclear cells were stained using antibodies cocktail in 20 min at room temperature, and then, red cells were lysed in 15 min with Versalyse (Beckman Coulter, Brea, CA). Flow cytometry and data analysis were, respectively, performed on a BD CANTO II (BD Biosciences, San Diego, CA).
Western Blot
Protein was extracted from PBMCs with lysis buffer on ice. SDS/PAGE gels were used to sort protein samples, which were then transferred to PVDF membranes. PVDF membranes were blocked with nonfat milk powder before being treated with primary antibodies overnight.
Anti-ZNF207 and anti-GAPDH antibodies were purchased from ImmunoWay Biotechnology (Plano, TX). Anti-CD69 and was purchased from Abcam (Cambridge, UK). Finally, the membranes were incubated with a secondary antibody and treated with ECL (Thermo, Waltham, USA). Protein bands were visualized using Gel image system (Tanon 2500, Shanghai Tianneng science, China).
Clinical Samples Collection, RNA Extraction, and Real-Time Reverse Transcription-Polymerase Chain Reaction (RT-qPCR)
The HIV-infected patients receiving cART treatment with virologic control (HIV-RNA <40 copies/mL) for more than 3 years, including 10 HIV-IRs (CD4+ T cells counts above 500 cells/μL) and 10 HIV-INRs (CD4+ T cells counts below 350 cells/μL)21 were recruited from Centers for Disease Control and Prevention of Weifang.
Participants in this research were voluntary and have been informed and signed informed consent. This project was approved by the ethical committee of Weifang Medical University, Weifang, China (reference number 2021YX017). Our study complies with the Declaration of Helsinki. Participants coinfected with hepatitis B virus (HBV) and HCV, and pregnant women were excluded from the experiment. The detailed information of patients was displayed in Table S2. RNA was immediately extracted using TRIzol reagent (Life Technologies, USA) after 5 mL of the patient’s blood was collected in ethylenediamine tetraacetic acid (EDTA) tubes (BD Vacutainer, USA). TransScript One-Step gDNA Removal and cDNA Synthesis Supermix (TransGen Biotech, Beijing, China) were used to generate complementary DNA from total RNA. TransStart Green qPCR Super Mix (TransGen Biotech, Beijing, China) was used for RT-qPCR. The sequence of primers is listed in Table S3. The following thermocycling conditions were used for qPCR: 45 cycles, each lasting 10 s at 95°C for denaturation, 20 s at 58°C for annealing and 30 s at 72°C (extension). The relative mRNA level of the diagnostic genes was normalized to the endogenous control GAPDH and 18S rRNA calculated by applying the 2 −ΔΔCq method. The variance between groups was analyzed by Student’s t-test. P < 0.05 indicated statistical significance.
Results
Identification and Analysis of DEGs
Based on the high throughput analysis, we obtained 190 DEGs between the INR group and IR group in the GSE143742 microarray dataset after the chip result was normalized (Figure S1), including 71 up-regulated genes and 119 down-regulated genes in INRs (Table S4). The volcano plot and heatmap plot show the respective gene distribution (Figure 1A and B). We explored the underlying mechanisms of DEGs by functional enrichment analysis (Table S5). The results of KEGG analysis showed that the apoptosis pathway was enriched by DEGs (Figure 1C). Go annotation of DEGs was illustrated with the biological process (BP), cellular component (CC), and molecular function (MF) categories (Table S5) and the top 10 terms by p-value were displayed (Figure 1D-F). Reactive oxygen species metabolism, mitochondrial transport, oxidative phosphorylation, adenosine triphosphate (ATP) metabolism, and innate apoptosis signalling pathways that were highlighted in the BP ontology. DEGs were correlated with mitochondrial inner membrane and cortical cytoskeleton in the CC ontology. Oxygen carrier activity, oxygen binding, and antioxidant activity were significantly enriched in the MF ontology. Meanwhile, the results of GSEA on whole-genome expression revealed that lipid synthesis-related terms: BURTON_ADIPOGENESIS_12 and mitochondrial-related terms: MITOCHONDRIAL_TRANSLATION, MTOCHONDRIAL_PROTEIN_IMPORT, and MITCHONDRIAL_CALCIUM_ION_TRANSPORT were enriched in IRs (Figure 2A-D).
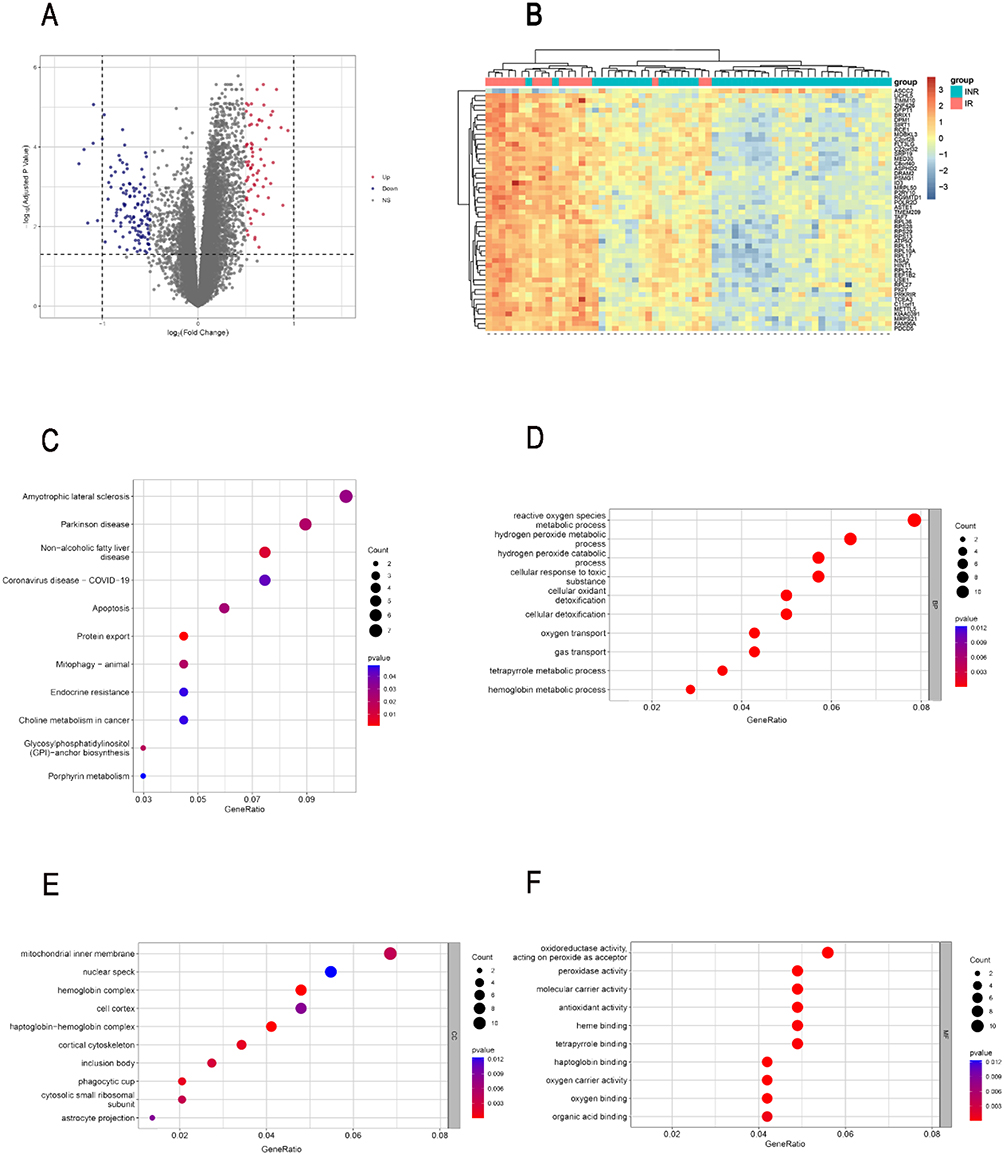 |
Figure 1 Identification of DEGs between INRs and IRs. The volcano (A) and heatmap (B) presented the expression of DEGs in GSE143742. (C)The KEGG pathways enriched by DEGs. The top 10 terms of BP (D), CC (E), MF (F) of GO annotation were enriched by DEGs. Abbreviations: DEG, Differentially Expressed Gene; KEGG, Kyoto Encyclopedia of Genes and Genomes; BP, Biological Process; CC, Cellular Component; MF, Molecular Function; GO, Gene Ontology. |
 |
Figure 2 The results of GSEA on whole-genome expression. The BURTON_ADIPOGENESIS_12 pathway (A), REACTOME_MITOCHONDRIAL_TRANSLATION pathway (B), REACTOME_MTOCHONDRIAL_PROTEIN_IMPORT pathway (C), and REACTOME_MITCHONDRIAL_CALCIUM_ION_TRANSPORT pathway (D) were enriched in IRs. Abbreviation: GSEA, Gene Set Enrichment Analysis. |
Construction of Co-Expression Network
We conducted a weighted gene co-expression network analysis to explore the co-expression relationship between the whole-genome data. With the correlation coefficient threshold selected as 0.86, the soft-thresholding power was set to 3 to satisfy the scale-free topology of the network (Figure 3A). The adjacency matrix and topological overlap matrix were constructed after obtaining the soft-thresholding power to check how well the network fits the scale freeness (Figure 3B). We identified 19 gene co-expression modules with internal relationships, and each of these was independent of other modules (Figure 3C). Three modules “lightyellow”, “greenyellow” and “cyan” have a high association with the INR group (P<0.05) (Figure 3D).
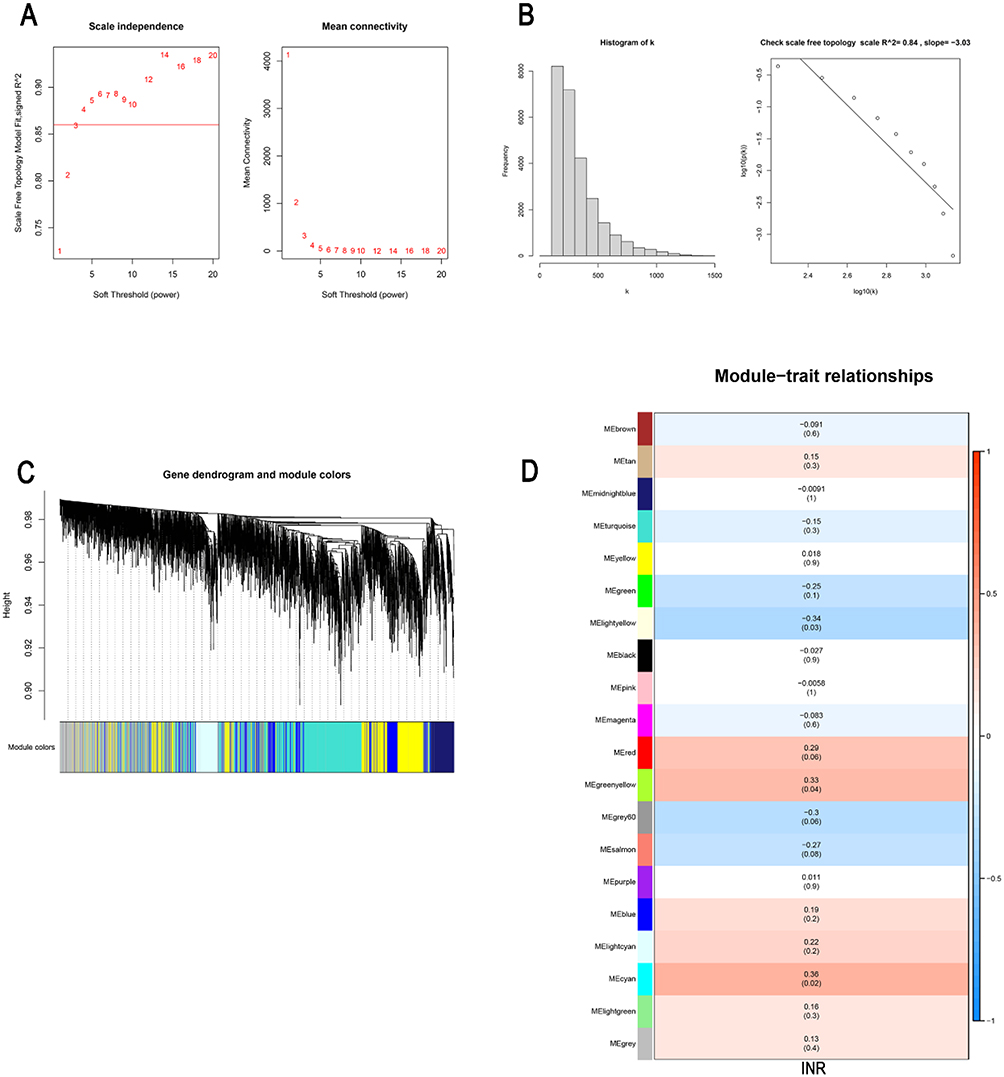 |
Figure 3 Weighted gene co-expression network analysis (WGCNA). (A) Analysis of the scale-free index for various soft-threshold powers (β). (B) The scale free topology whenβ= 3. (C) The clustering of genes among different modules by the dynamic tree cut and merged dynamic method. The gray modules represent unclassified genes. (D) The average correlations between multiple modules and clinical features. The colors of the cells indicate the strength of the correlation, and the numbers in parentheses represent the P value of the correlation test. |
The Diagnostic Genes That Affect Immune Non-Response in HIV Infected Individuals Receiving cART
To identify the diagnostic genes, we obtained 26 common genes from the intersection of DEGs and the genes in three correlated modules of the INR group (Figure 4A). Then, from the 26 common genes, we selected 12 gene signatures using LASSO regression analysis (Figure 4B) and 19 gene signatures using SVM (Figure 4C). Subsequently, ROC analysis was used to investigate the sensitivity and specificity of 10 genes (AK057879, CD69, CD83, CLDND1, FBXO33, GP9, NFE2, TESC, TMEM158, ZNF207) derived from the overlap of the gene signature studied by LASSO and SVM (Figure 4D). The results showed that the AUC values of 10 genes were all above 0.75 in the GSE143742 dataset (Figure S2, Figure 5A and B); however, CD69 and ZNF207 were validated to have the capability to discriminate INR samples from IR samples in GSE106792 dataset (Figure S3, Figure 5C and D). Thus, CD69 and ZNF207 were considered as diagnostic genes for further investigation.
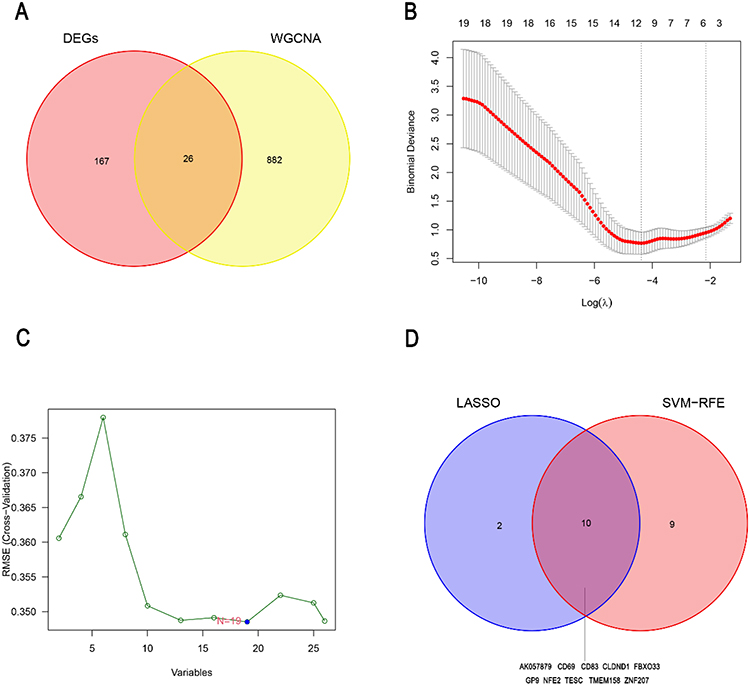 |
Figure 4 Identification of the diagnostic genes for the immune non-response in HIV-infected individuals treated with cART. (A) The overlapped genes between the DEGs and the three INR associated modules of WGCNA. The LASSO(B) and SVM-RFE (C) analysis for the 26 common genes were performed to screen the gene signatures. (D) The Venn diagram shows the diagnostic genes obtained by the LASSO and SVM-RFE. Abbreviations: LASSO, Least Absolute Shrinkage and Selection Operator; SVM-RFE, Support Vector Machine-Recursive Feature Elimination. |
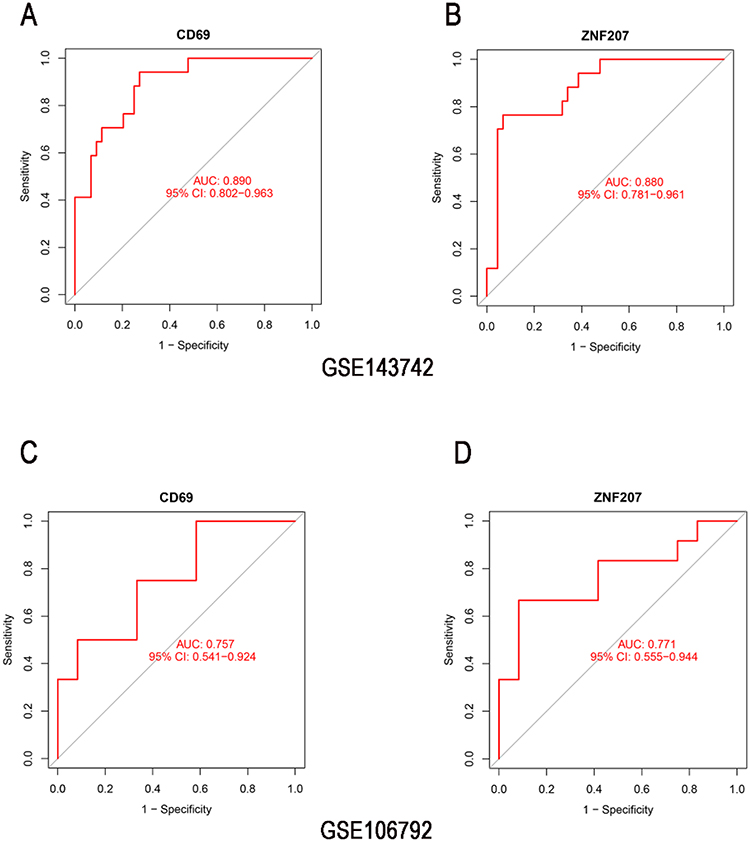 |
Figure 5 Identification of the diagnostic genes by ROC analysis. The AUC values of CD69 and ZNF207 showed by ROC curves in GSE143742 (A and B), and validated by GSE106792 (C and D). Abbreviations: AUC, Area Under the Curve; ROC, Receiver Operating Characteristic. |
miRNA-mRNA-TF Regulatory Network Analysis
To explore the regulatory mechanisms of INR occurrence, 55 overlapped miRNAs targeting the hub gene were obtained using the miRDB and miRWalk databases. The gene-miRNAs regulatory network was contrasted by Cytoscape (Figure 6A). Sixty-three TFs of the two diagnostic genes were predicted by the Network Analyst database, and the TF-mRNA regulatory network was constructed by Cytoscape (Figure 6B). Meanwhile, the TF-mRNA-miRNA regulatory co-expression network was built as well (Figure 6C, Table 1). According to the regulatory network, CD69 and ZNF207 were the most commonly targeted genes of the NCOR1 transcription factor.
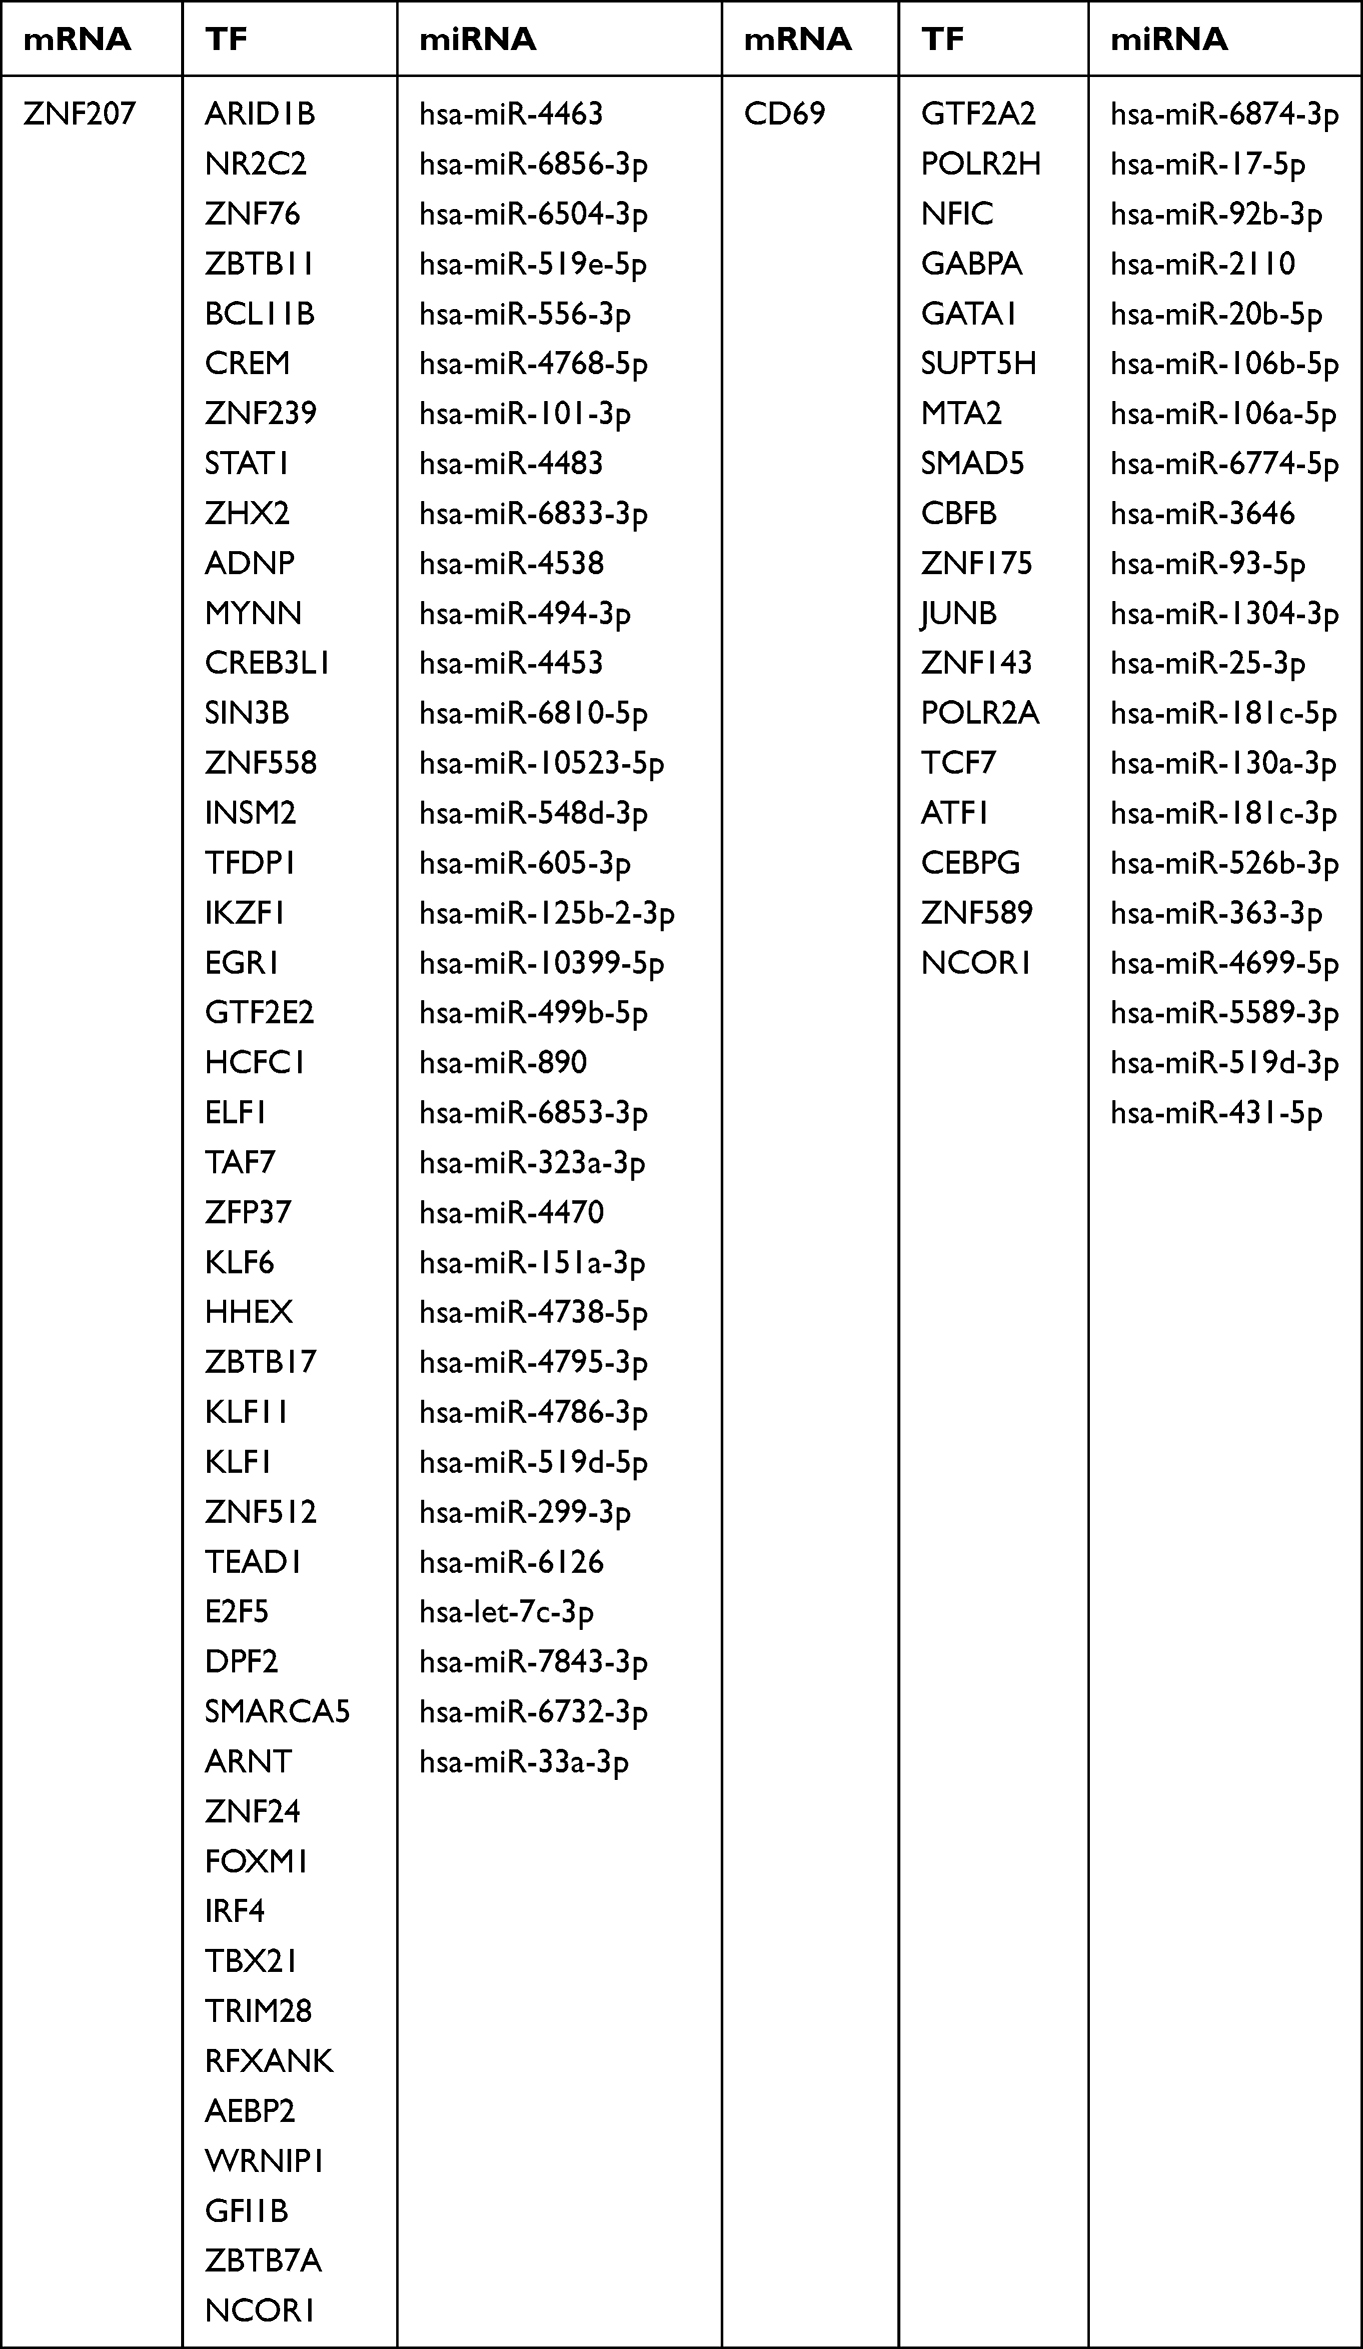 |
Table 1 Detailed Information on the TF-mRNA-miRNA Regulatory Network |
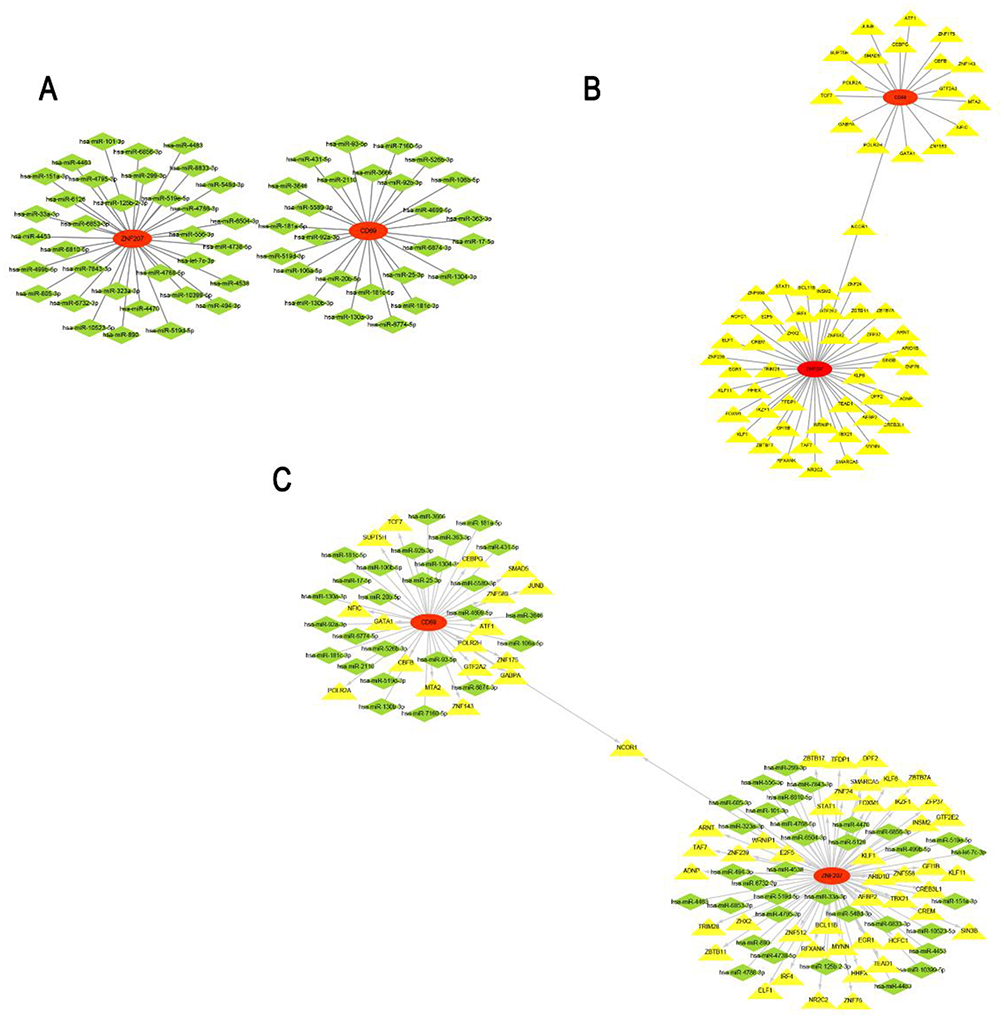 |
Figure 6 The regulating mechanisms of the diagnostic genes. (A) The miRNAs-mRNA regulatory network. (B) The mRNA-TF regulatory network. (C) The TF-mRNA-miRNA regulatory network. Abbreviation: TFs, Transcription Factors. |
Immune Microenvironment Analysis
To identify the absolute content of 22 immune cells in each sample, we obtained the CIBERSORT absolute score for the analysis of immune cells based on the CIBERSORT algorithm. The percentage of each of the 22 types of immune cells in each sample was shown in the bar plot (Figure 7A). A correlation heatmap of immune cells showed that neutrophils were positively related to resting dendritic cells (r=0.53, p<0.001) and M1 macrophages (r=0.45, p<0.001), while eosinophils were positively related with activated memory CD4+ T cells (r=0.48, p<0.001). In contrast, monocytes had a negative relationship with CD8+ T cells (r=−0.59, p<0.001) and M2 macrophage (r=−0.57, p<0.001), delta gamma T cells had a negative relationship with resting NK cells (r=−0.54, p<0.001), and memory B cells had a negative relationship with naïve B cells (r=−0.54, p<0.001) (Figure 7B). The vioplot of the immune cells showed that, in comparison to the INR group, the IR group had greater levels of resting memory CD4+ T cells, reduced levels of activated memory CD4+ T cells and resting dendritic cells (Figure 7C). Flow cytometry confirmed that the INR group had a higher level of activated memory CD4+ T cells (CD4+CD45RO+CD38+) (2.98±0.30%), lower level of resting memory CD4+ T cells (CD4+CD45RO+CD38-) (97.01±0.30%) than the IR group (6.44±1.88%, 93.55±1.88%) (Figure 7D-F).
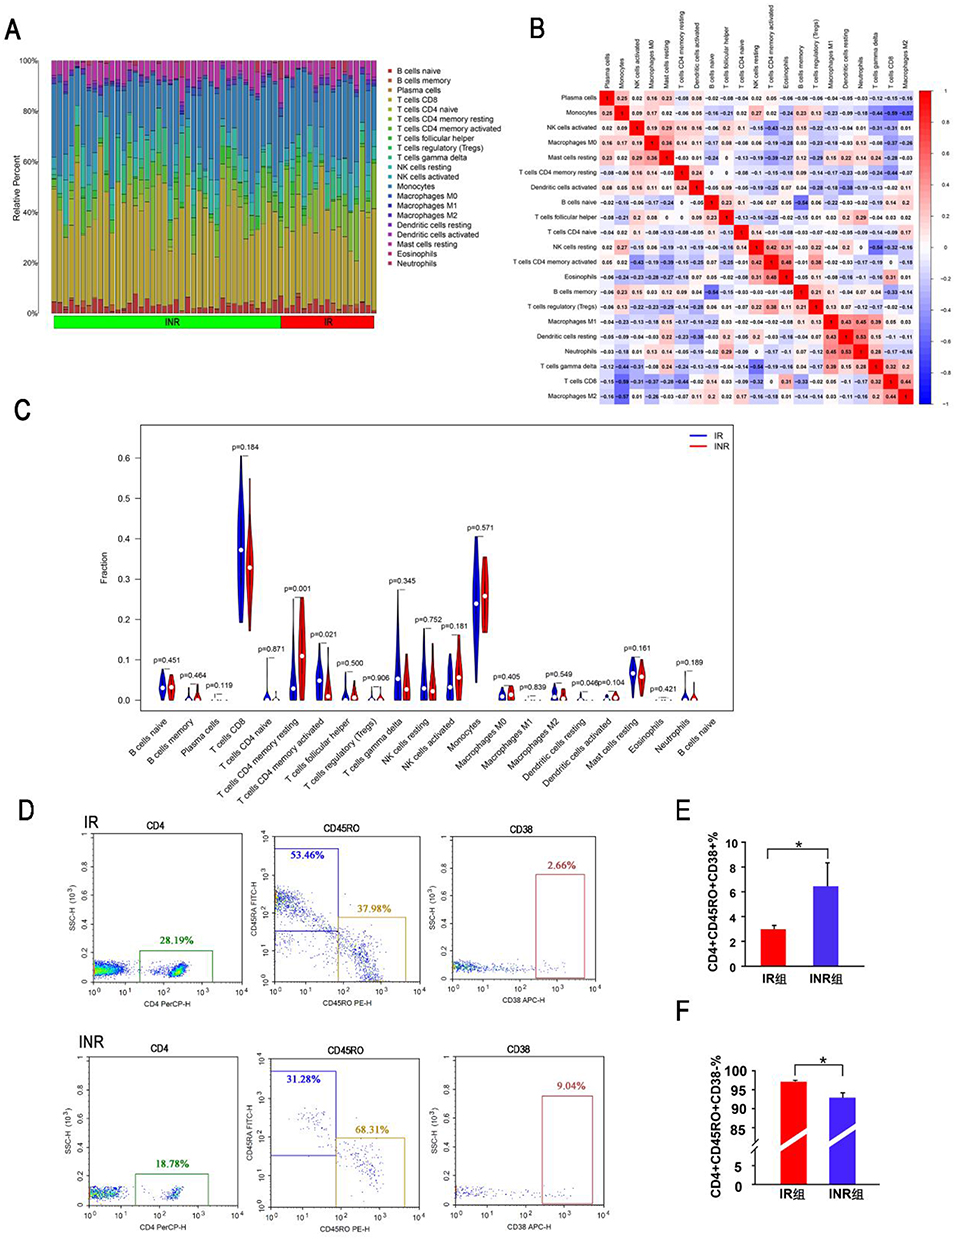 |
Figure 7 The Immune Infiltration Analysis. (A) The relative percentage of 22 types of immune cells. (B) The correlation heatmap of the 22 types of immune cells. (C) The difference of immune cells between IR group and INR group. (D-F) The proportion of activated and resting CD4+ T memory cells detected by flow cytometry in the INR and IR group. *, p<0.05. |
The correlation analysis between the diagnostic genes with immune cells revealed that CD69 had a positive correlation with resting memory CD4+ T cells (r=0.48, p<0.001), and negatively correlation with M2 macrophages (r=−0.28, p=0.038) (Figure 8A). Meanwhile, ZNF207 had a positive correlation with resting memory CD4+ T cells (r=0.41, p=0.002), activated dendritic cells (r=0.28, p=0.035), and negatively correlation with resting mast cells (r=−0.28, p=0.040), resting dendritic cells (r=−0.37, p=0.004) (Figure 8B).
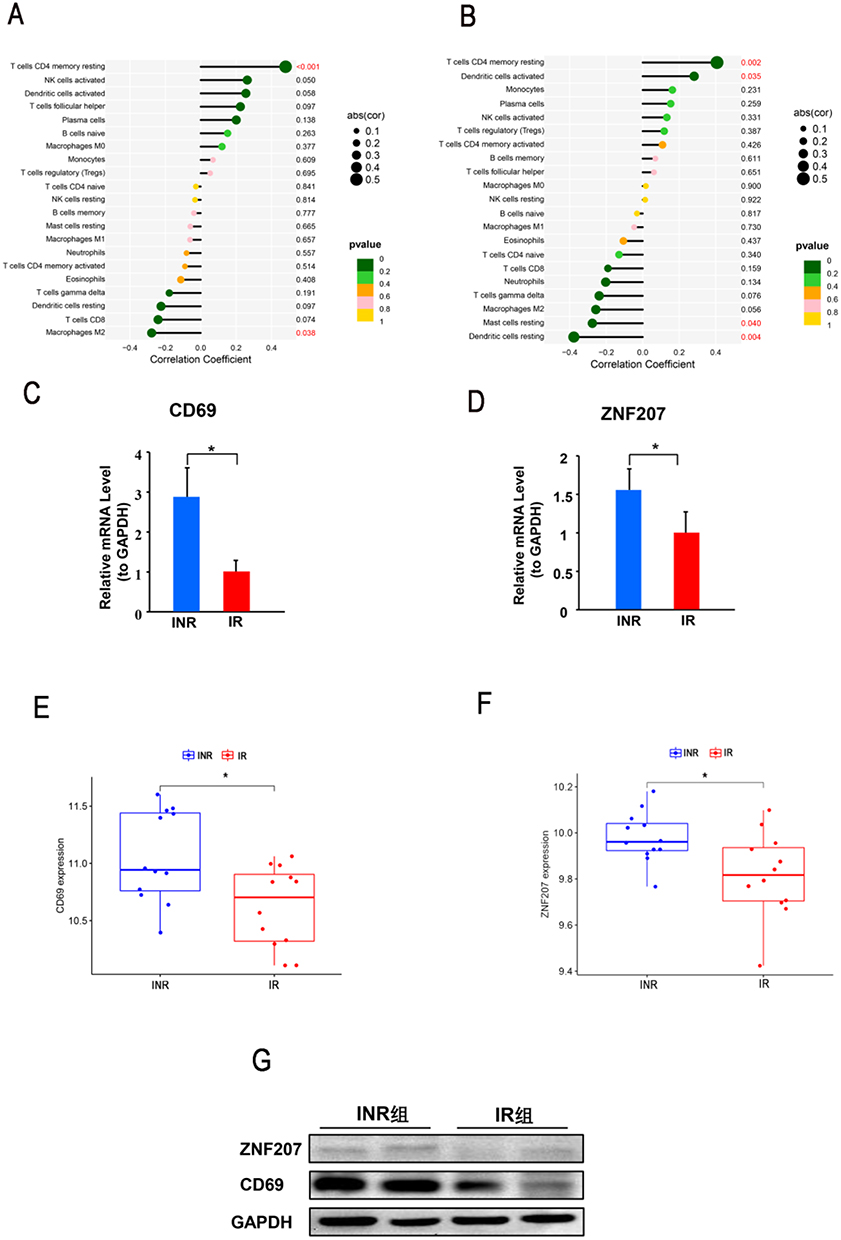 |
Figure 8 The verification of the diagnostic gene expression. (A) The correlation between ZNF207 with immune cells. (B) The correlation between CD69 with immune cells. (C-D) The relative mRNA expression of CD69 and ZNF207 to GAPDH was detected by RT-qPCR in INRs samples and IRs samples. (E-F) The gene expression of CD69 and ZNF207 in GSE106792. (G) The protein expression of CD69 and ZNF207 was detected by Western blot in the INR and IR group. *, p<0.05. Abbreviation: RT-qPCR, Real-time Reverse Transcription-Polymerase Chain Reaction. |
Validation of the Expression of the Diagnostic Genes Between INR and IR Group in HIV-Infected Individuals Receiving cART
To validate the expression of the diagnostic genes in clinical INRs and IR blood samples, the mRNAs and protein levels were detected by performing RT-qPCR and Western blot. The relative mRNA expression of CD69 and ZNF207 to GAPDH and 18s rRNA (Figure S4) was significantly elevated in the INR group (2.80±0.80, 1.55±0.30) compared with the IR group (1±0.31, 1±0.29) (Figure 8C and D). Furthermore, the up-regulated expression of diagnostic genes in the INR group was validated in the GSE106792 database (Figure 8E and F). The protein level of CD69 and ZNF207 to GAPDH was significantly elevated in the INR group than the IR group (Figure 8G).
Discussion
cART has significantly improved the clinical outcomes of HIV-infected patients. However, there are still 20–30% of HIV-infected patients termed as INRs,13,22 remaining at higher risk of non-AIDS-related (such as metabolic syndrome, cardiovascular disease, nephropathy, and neurocognitive disorders) and AIDS-related (such as infections and malignant tumors) events than IRs.1,23,24 Thus, early prediction and diagnostic genes may help to early identify INRs and develop clinical approaches to improve the clinical outcomes of HIV infected individuals.
In our study, 190 differentially expressed genes between the INR group and IR group were obtained and enriched in mitochondrial and apoptotic-related pathways by functional enrichment analysis. Mitochondria, as energy powerhouse organelles, play an important role in cell survival, apoptosis, and differentiation, and mitochondrial dysfunction was related to the occurrence of INRs.25–27 For instance, INRs have the more activated, exhausted, senescent, and apoptotic CD4+ T cells, with compromised mitochondrial functions, characterized by a decline in glycolytic activity, decrease in mitochondrial respiration, diminish in mitochondrial fitness, and low expression of the mitochondrial biogenesis regulators peroxisome proliferator–activated receptor γ coactivator 1-α (PGC1α) and transcription factor A for mitochondria (TFAM).28–30 Besides, mitochondrial defects in INRs could affect all metabolic pathways (such as glycolysis, amino acid metabolism, lipids synthesis, and fatty acid oxidation), owing to the mitochondrial network providing the essential co-factors to these major metabolic pathways,31,32 consistent with adipogenesis pathway enriched in IRs by GSEA in our studies. Specifically, the results of functional enrichment analysis revealed that HIV-INRs who failed to restore CD4+ T cells display an apoptotic gene signature accompanied by mitochondrial dysfunction.
In order to get the gene more pertinent to INRs, we conducted differential expressed gene analysis on the GSE143742 dataset from GEO. WGCNA offers a useful technique for identifying gene groups with similar expression for phenotype correlation.33 This suggests that module genes might be connected to the progression of INRs. We discovered reliable dysregulated genes that are closely associated with INRs through the overlap of differential expressed genes and WGCNA-related module genes. Machine learning algorithms were used to filter these genes linked with the development of INR. Finally, using ROC analysis, CD69 and ZNF207 were verified as being able to distinguish INRs from IRs and confirmed in the GSE106792 dataset. CD69 is an early activation biomarker induced by T cell activation and the mRNA level of CD69 was detected within 30 to 60 min after activation, and then degraded rapidly after 4 to 6 h.34,35 Furthermore, it is expressed by several types of leukocytes and has the potential to exert an impact on inflammatory responses. For instance, CD69 could participate in immune and inflammatory responses by regulating T helper 17 (Th17) cell differentiation.36 Meanwhile, CD69 acting as a metabolic gatekeeper modulates the immune response through regulating aryl hydrocarbon receptor activation under specific environmental cues, such as amino acid abundance.37,38 ZNF207, a zinc finger protein with the gle2-binding-sequence (GLEBS) motif, could participate in the self-renewal, pluripotency, and differentiation processes in human embryonic stem cells.39–41 ZNF207 depletion results in the senescence of primary fibroblasts and the apoptosis of cancer cells by preventing the formation of RNA-DNA hybrids, reducing DNA damage, and activating P53.42 The silencing of ZNF207 has been shown to impede the transcription of indoleamine 2,3- dioxygenase 1 (IDO1) and the production of kynurenine, both of which are important metabolites in the tryptophan signaling pathway and have been shown to speed up T cell exhaustion. Meanwhile, plasma indoleamine 2,3-dioxygenase activity correlates with the amount of the human immunodeficiency virus reservoir in patients receiving antiretroviral therapy.43,44 In brief, we hypothesize that CD69 may influence the development of Th17 cells or the metabolic route and that ZNF207 influences the transcription of IDO1 and the synthesis of kynurenine, resulting in CD4+ T cell exhaustion and immunological non-response in HIV-infected patients. We verified the expression of these two genes in the blood of INRs and IRs, and additional experimental research is required to understand their biological processes.
According to the miRNA-mRNA-TF regulatory network, NCOR1 as the common transcription factor of the CD69 and ZNF207 could regulate the vast majority of the nuclear receptors, which participate in the process of mitochondrial biogenesis, fatty acid oxidation, and oxidative phosphorylation and attenuates the expression of genes involved in energy metabolism.45 It will take further experiments to prove the regulatory mechanisms of NCOR1 on HIV-INRs.
Using CIBERSORT analysis, various immune cells and immunological processes were compared between the IR group and INR group. The vioplot of immune cells and flow cytometry results showed that INRs have a higher level of activated memory CD4+ T cells than IRs, in spite of the fact that resting memory CD4+ T cells were drastically decreased in INRs. This conclusion is consistent with earlier studies,28,30,46,47 which found that microbial translocation and inflammation caused CD4+ T cells to become activated, which was followed by increased cell cycling, particularly in the memory compartment. Besides, the number of CD4+ T cells decreased by 45 cells/µL accompanied by a 5% increase in the percentage of activated CD4+ T cells in the first 3 months of cART treatment.48 The level of resting dendritic cells is higher in HIV-INRs analyzed by CIBERSORT; however, studies about resting dendritic cells on the immune response in HIV individuals receiving cART are rare and need further research. Meanwhile, CD69 and ZNF207 may regulate the level of resting memory CD4+ T cells, resting mast cells, M2 macrophages, and activated resting dendritic cells, leading to different therapy outcomes in HIV individuals.
Conclusion
We obtained two genes, CD69 and ZNF207, discriminating INR from IR and explored the possible mechanisms by bioinformatic analysis. Our studies offered potential clues for improving the therapy outcomes of INRs; however, in-depth experiments are needed to verify the regulatory mechanisms of the diagnostic genes.
Acknowledgments
This work was supported by the Shandong Medical and Health Technology Development Project (Grant No. 2019WS248).
Disclosure
The authors declare that the research was conducted in the absence of any commercial or financial relationships that could be construed as a potential conflict of interest.
References
1. Takuva S, Maskew M, Brennan AT, Long L, Sanne I, Fox MP. Poor CD4 recovery and risk of subsequent progression to AIDS or death despite viral suppression in a South African cohort. J Int AIDS Soc. 2014;17(1):18651. doi:10.7448/IAS.17.1.18651
2. Saag MS, Gandhi RT, Hoy JF, et al. Antiretroviral Drugs for Treatment and Prevention of HIV Infection in Adults: 2020 Recommendations of the International Antiviral Society-USA Panel. JAMA. 2020;324(16):1651–1669.
3. Yang X, Su B, Zhang X, Liu Y, Wu H, Zhang T. Incomplete immune reconstitution in HIV/AIDS patients on antiretroviral therapy: challenges of immunological non-responders. J Leukoc Biol. 2020;107(4):597–612.
4. Prabhu S, Harwell JI, Kumarasamy N. Advanced HIV: diagnosis, treatment, and prevention. Lancet HIV. 2019;6(8):e540–e51.
5. Corbeau P, Reynes J. Immune reconstitution under antiretroviral therapy: the new challenge in HIV-1 infection. Blood. 2011;117(21):5582–5590.
6. Baker JV, Peng G, Rapkin J, et al. CD4+ count and risk of non-AIDS diseases following initial treatment for HIV infection. Aids. 2008;22(7):841–848.
7. Lapadula G, Cozzi-Lepri A, Marchetti G, et al. Risk of clinical progression among patients with immunological nonresponse despite virological suppression after combination antiretroviral treatment. Aids. 2013;27(5):769–779.
8. Pacheco YM, Jarrin I, Rosado I, et al. Increased risk of non-AIDS-related events in HIV subjects with persistent low CD4 counts despite cART in the CoRIS cohort. Antiviral Res. 2015;117:69–74.
9. Engsig FN, Zangerle R, Katsarou O, et al. Long-term mortality in HIV-positive individuals virally suppressed for >3 years with incomplete CD4 recovery. Clin Infect Dis. 2014;58(9):1312–1321.
10. Yong YK, Shankar EM, Solomon A, et al. Polymorphisms in the CD14 and TLR4 genes independently predict CD4+ T-cell recovery in HIV-infected individuals on antiretroviral therapy. Aids. 2016;30(14):2159–2168.
11. Qian S, Chen X, Wu T, et al. The accumulation of plasma acylcarnitines are associated with poor immune recovery in HIV-infected individuals. BMC Infect Dis. 2021;21(1):808.
12. Utay NS, Hunt PW. Role of immune activation in progression to AIDS. Curr Opin HIV AIDS. 2016;11(2):131–137.
13. Massanella M, Negredo E, Clotet B, Blanco J. Immunodiscordant responses to HAART--mechanisms and consequences. Expert Rev Clin Immunol. 2013;9(11):1135–1149.
14. Wang Z, Monteiro CD, Jagodnik KM, et al. Extraction and analysis of signatures from the Gene Expression Omnibus by the crowd. Nat Commun. 2016;7:12846.
15. Yu G, Wang LG, Han Y, He QY. clusterProfiler: an R package for comparing biological themes among gene clusters. j Integrative Biol. 2012;16(5):284–287.
16. Langfelder P, Horvath S. WGCNA: an R package for weighted correlation network analysis. BMC Bioinform. 2008;9:559.
17. Huang L, Ye T, Wang J, et al. Identification of Survival-Associated Hub Genes in Pancreatic Adenocarcinoma Based on WGCNA. Front Genet. 2021;12:814798.
18. Zeng H, Luo M, Chen L, Ma X, Ma X. Machine learning analysis of DNA methylation in a hypoxia-immune model of oral squamous cell carcinoma. Int Immunopharmacol. 2020;89(Pt B):107098.
19. Wang ZL, Zhou ZG, Chen Y, Li XT, Sun YS. Support Vector Machines Model of Computed Tomography for Assessing Lymph Node Metastasis in Esophageal Cancer with Neoadjuvant Chemotherapy. J Comput Assist Tomogr. 2017;41(3):455–460.
20. Robin X, Turck N, Hainard A, et al. pROC: an open-source package for R and S+ to analyze and compare ROC curves. BMC Bioinform. 2011;12:77.
21. Liu X, Lin L, Lu L, et al. Comparative Transcriptional Analysis Identified Characteristic Genes and Patterns in HIV-Infected Immunological Non-Responders. Front Immunol. 2022;13:807890.
22. Zhang Y, Jiang T, Li A, et al. Adjunct Therapy for CD4(+) T-Cell Recovery, Inflammation and Immune Activation in People Living With HIV: a Systematic Review and Meta-Analysis. Front Immunol. 2021;12:632119.
23. Young J, Psichogiou M, Meyer L, et al.; Opportunistic Infections Project Team of the Collaboration of Observational HIVERiEiE. CD4 cell count and the risk of AIDS or death in HIV-Infected adults on combination antiretroviral therapy with a suppressed viral load: a longitudinal cohort study from COHERE. PLoS Med. 2012;9(3):e1001194.
24. Baker JV, Peng G, Rapkin J, et al. Poor initial CD4+ recovery with antiretroviral therapy prolongs immune depletion and increases risk for AIDS and non-AIDS diseases. J Acquir Immune Defic Syndr. 2008;48(5):541–546.
25. van der Windt GJ, Everts B, Chang CH, et al. Mitochondrial respiratory capacity is a critical regulator of CD8+ T cell memory development. Immunity. 2012;36(1):68–78.
26. Buck MD, O’Sullivan D, Klein Geltink RI, et al. Mitochondrial Dynamics Controls T Cell Fate through Metabolic Programming. Cell. 2016;166(1):63–76.
27. Ron-Harel N, Sharpe AH, Haigis MC. Mitochondrial metabolism in T cell activation and senescence: a mini-review. Gerontology. 2015;61(2):131–138.
28. Zhao J, Schank M, Wang L, et al. Mitochondrial Functions Are Compromised in CD4 T Cells From ART-Controlled PLHIV. Front Immunol. 2021;12:658420.
29. Vlasova VV, Saidakova EV, Korolevskaya LB, Shmagel NG, Chereshnev VA, Shmagel KV. Metabolic Features of Activated Memory CD4(+) T-Cells Derived from HIV-Infected Immunological Non-responders to Highly Active Antiretroviral Therapy. Doklady biol sci. 2021;501(1):206–209.
30. Younes SA, Talla A, Pereira Ribeiro S, et al. Cycling CD4+ T cells in HIV-infected immune nonresponders have mitochondrial dysfunction. J Clin Invest. 2018;128(11):5083–5094.
31. O’Neill LA, Kishton RJ, Rathmell J. A guide to immunometabolism for immunologists. Nat Rev Immunol. 2016;16(9):553–565.
32. Ferrari B, Da Silva AC, Liu KH, et al. Gut-derived bacterial toxins impair memory CD4+ T cell mitochondrial function in HIV-1 infection. J Clin Invest. 2022;132(9):543.
33. Huang H, Lv J, Huang Y, et al. IFI27 is a potential therapeutic target for HIV infection. Ann Med. 2022;54(1):314–325.
34. Gonzalez-Amaro R, Cortes JR, Sanchez-Madrid F, Martin P. Is CD69 an effective brake to control inflammatory diseases? Trends Mol Med. 2013;19(10):625–632.
35. Okhrimenko A, Grun JR, Westendorf K, et al. Human memory T cells from the bone marrow are resting and maintain long-lasting systemic memory. Proc Natl Acad Sci U S A. 2014;111(25):9229–9234.
36. Martin P, Gomez M, Lamana A, et al. CD69 association with Jak3/Stat5 proteins regulates Th17 cell differentiation. Mol Cell Biol. 2010;30(20):4877–4889.
37. Conde M, Montano R, Moreno-Aurioles VR, et al. Anti-CD69 antibodies enhance phorbol-dependent glucose metabolism and Ca2+ levels in human thymocytes. J Leukocyte Biol. 1996;60(2):278–284.
38. Labiano S, Meléndez-Rodríguez F, Palazón A, et al. CD69 is a direct HIF-1α target gene in hypoxia as a mechanism enhancing expression on tumor-infiltrating T lymphocytes. Oncoimmunology. 2017;6(4):e1283468.
39. Jiang H, He X, Wang S, et al. A microtubule-associated zinc finger protein, BuGZ, regulates mitotic chromosome alignment by ensuring Bub3 stability and kinetochore targeting. Dev Cell. 2014;28(3):268–281.
40. Fang F, Xia N, Angulo B, et al. A distinct isoform of ZNF207 controls self-renewal and pluripotency of human embryonic stem cells. Nat Commun. 2018;9(1):4384.
41. Pahl PM, Hodges YK, Meltesen L, Perryman MB, Horwitz KB, Horwitz LD. ZNF207, a ubiquitously expressed zinc finger gene on chromosome 6p21.3. Genomics. 1998;53(3):410–412.
42. Wan Y, Zheng X, Chen H, et al. Splicing function of mitotic regulators links R-loop-mediated DNA damage to tumor cell killing. J Cell Biol. 2015;209(2):235–246.
43. Wang X, Zhou T, Chen X, et al. System analysis based on the cancer-immunity cycle identifies ZNF207 as a novel immunotherapy target for hepatocellular carcinoma. J Immunother Cancer. 2022;10(3):85.
44. Chen J, Xun J, Yang J, et al. Plasma Indoleamine 2,3-Dioxygenase Activity Is Associated With the Size of the Human Immunodeficiency Virus Reservoir in Patients Receiving Antiretroviral Therapy. Clin Infect Dis. 2019;68(8):1274–1281.
45. Yamamoto H, Williams EG, Mouchiroud L, et al. NCoR1 is a conserved physiological modulator of muscle mass and oxidative function. Cell. 2011;147(4):827–839.
46. Lederman MM, Calabrese L, Funderburg NT, et al. Immunologic failure despite suppressive antiretroviral therapy is related to activation and turnover of memory CD4 cells. J Infect Dis. 2011;204(8):1217–1226.
47. Piconi S, Trabattoni D, Gori A, et al. Immune activation, apoptosis, and Treg activity are associated with persistently reduced CD4+ T-cell counts during antiretroviral therapy. Aids. 2010;24(13):1991–2000.
48. Bai R, Li Z, Hou Y, et al. Identification of Diagnostic Markers Correlated With HIV(+) Immune Non-response Based on Bioinformatics Analysis. Front Mol Biosci. 2021;8:809085.
 © 2023 The Author(s). This work is published and licensed by Dove Medical Press Limited. The full terms of this license are available at https://www.dovepress.com/terms.php and incorporate the Creative Commons Attribution - Non Commercial (unported, v3.0) License.
By accessing the work you hereby accept the Terms. Non-commercial uses of the work are permitted without any further permission from Dove Medical Press Limited, provided the work is properly attributed. For permission for commercial use of this work, please see paragraphs 4.2 and 5 of our Terms.
© 2023 The Author(s). This work is published and licensed by Dove Medical Press Limited. The full terms of this license are available at https://www.dovepress.com/terms.php and incorporate the Creative Commons Attribution - Non Commercial (unported, v3.0) License.
By accessing the work you hereby accept the Terms. Non-commercial uses of the work are permitted without any further permission from Dove Medical Press Limited, provided the work is properly attributed. For permission for commercial use of this work, please see paragraphs 4.2 and 5 of our Terms.