Back to Journals » OncoTargets and Therapy » Volume 11
Identification of PGAM1 as a putative therapeutic target for pancreatic ductal adenocarcinoma metastasis using quantitative proteomics
Authors Liu X ![]() , Weng Y, Liu P
, Weng Y, Liu P ![]() , Sui Z, Zhou L, Huang Y, Zhang L, Zhang Y, Tan X
, Sui Z, Zhou L, Huang Y, Zhang L, Zhang Y, Tan X
Received 13 January 2018
Accepted for publication 26 March 2018
Published 6 June 2018 Volume 2018:11 Pages 3345—3357
DOI https://doi.org/10.2147/OTT.S162470
Checked for plagiarism Yes
Review by Single anonymous peer review
Peer reviewer comments 4
Editor who approved publication: Prof. Dr. Geoffrey Pietersz
Xinlu Liu,1 Yejing Weng,2 Peng Liu,1 Zhigang Sui,2 Lei Zhou,1 Yinpeng Huang,1 Lihua Zhang,2 Yukui Zhang,2 Xiaodong Tan,1
1First Department of General Surgery, Shengjing Hospital, China Medical University, Shenyang, China; 2CAS Key Laboratory of Separation Science for Analytical Chemistry, National Chromatographic Research and Analysis Center, Dalian Institute of Chemical Physics, Chinese Academy of Science, Dalian 116023, China
Background: Pancreatic ductal adenocarcinoma (PDAC) is an aggressive gastrointestinal cancer characterized by an extremely low survival rate because of early metastasis. Identifying satisfactory therapeutic targets associated with metastasis is crucial to improve the treatment effect of PDAC.
Materials and methods: In this research, we used stable isotope labeling by amino acids in cell culture, 1-dodecyl-3-methylimidazolium chloride-assisted sample preparation method preparing protein sample and nano-reversed-phase liquid chromatography-mass spectrometry/mass spectrometry analysis to perform the comparative proteomics of two homologous hamster pancreatic cancer cell lines that are different in metastatic ability: PC-1.0 (highly metastatic) and PC-1 (weakly metastatic). Verifications are through immunohistochemistry on clinical human PDAC pathologic tissues as well as by Western blot of human pancreatic cancer cell lines. siRNA silencing methods were used to study the effect of molecules on invasion and metastasis of pancreatic cancer cell lines.
Results: Bioinformatic analysis indicated that a total of 141 differentially expressed proteins (82 upregulated and 59 downregulated in PC-1.0 cells) were identified showing obviously differential expression (>1.5-fold change). These differentially expressed proteins were involved in a number of different biologic functions, metabolic pathways, and pathophysiologic processes. Phosphoglycerate mutase 1 (PGAM1) and HSPE1 are the top two upregulated proteins, and PDIA3 and CALR are the top two downregulated proteins in PC-1.0 cells compared to PC-1 cells. PGAM1 and HSPE1 showed higher expressions in PDAC tissue with clinical metastasis and highly metastatic pancreatic cancer cell lines PC-1.0 and Aspc-1. PDIA3 and CALR showed higher expressions in weakly metastatic pancreatic cancer cell lines PC-1 and Capan-2. The Western blot results were consistent with the MS quantification data. Silencing PGAM1 was found to decrease the migration and invasion of pancreatic cancer cell lines with statistical significance, especially in highly metastatic PC-1.0 and Aspc-1 cell lines.
Conclusion: These data indicated that PGAM1 may be a potential therapeutic target for PDAC metastasis.
Keywords: SILAC, PDAC, metastasis, PGAM1
Introduction
Pancreatic ductal adenocarcinoma (PDAC) is one of the most malignant gastrointestinal cancers characterized by rapid progression and frequent metastasis. The overall survival rate is <6%1 and for patients with complete surgical resection, the 5-year survival is 18%–24%.2 Surgery is the main treatment of PDAC, but the effect is not very satisfactory either. Only 5%–10% cases with localized and resectable tumors have a chance of cure by surgery; however, among these cases, about 80%–90% patients do not survive longer than 5 years,3 primarily due to early local invasion and distant metastasis, either before or after surgery. Therefore, to clarify the mechanism of PDAC metastasis and identify the involved key proteins as new therapeutic targets is very necessary for improving the prognosis of PDAC patients. However, although a topic of heightened research focus in recent years, the key proteins that modulate PDAC malignant behaviors remain unclear.
In this study, we evaluated two hamster pancreatic cancer cell lines with different metastatic ability. PC-1 cell line was established from pancreatic cancer induced by N-nitrosobis(2-oxopropyl)amine in a Syrian golden hamster.4 Then, PC-1 cells were implanted into another Syrian hamster, and PC-1.0 cells were established from the liver metastasis.5,6 In vitro, PC-1.0 cells were isolated-like growth with highly metastatic ability, whereas PC-1 cells were island-like growth with weakly metastatic ability. In previous reports, we have investigated the alterations of this pair of cell lines at the genomic, phosphoproteomic, and secretomic levels,7–9 respectively. However, the complete comparative proteomics that are primarily associated with the metastasis of PDAC and are of clinical importance to the prognosis have never been experimentally performed.
Stable isotope labeling by amino acids in cell culture (SILAC) is a powerful proteomic technique based on incorporating specific amino acids labeled by nonradioactive isotope into cellular proteins to detect differentially expressed proteins.10,11 It is a very stable and accurate proteomic method that can be used in any cell culture system. Recently, many new methods for protein fractionation have been developed to obtain a broader scope of protein information. The 1-dodecyl-3-methylimidazolium chloride-assisted sample preparation method12 is a newly developed protein fractionation method capable of extracting more comprehensive proteins including membrane proteins. In this research, we used SILAC combined with the 1-dodecyl-3-methylimidazolium chloride-assisted sample preparation method to prepare the protein samples.
Here, we performed the comparative proteomics of the PC-1.0 and PC-1 cells using SILAC and nano-RPLC-MS/MS (nanoflow reversed-phase liquid chromatography coupled with tandem mass spectrometry). All the obviously differentially expressed proteins were subjected to multiple bioinformatics tools to understand the various biologic functions and pathways. Verifications were through immunohistochemistry (IHC) and Western blot. As an obviously upregulated protein in PC-1.0 cells, phosphoglycerate mutase 1 (PGAM1) was further found overexpressed in PDAC tissues with clinical metastasis and highly metastatic pancreatic cancer cell lines. Silencing PGAM1 by siRNA decreased the migration and invasion of pancreatic cancer cell lines obviously. From all findings in this research, PGAM1 is suggested as a potential therapeutic target for PDAC metastasis.
Materials and methods
Cell lines and cell culture
Two homologous hamster pancreatic cancer cell lines PC-1.0 (highly metastatic) and PC-1 (weakly metastatic), and two human pancreatic cancer cell lines Aspc-1 (highly metastatic)13–15 and Capan-2 (weakly metastatic)16–18 were used. PC-1.0 and PC-1 cells were given friendly by Kumamoto University Medical School (Kumamoto, Japan) and the use of these cell lines was approved by China Medical University Affiliated Shengjing Hospital Medical Research and New Technology Ethics Committee. Aspc-1 and Capan-2 cells were purchased from the Institute of Biochemistry and Cell Biology, Chinese Academy of Sciences (Shanghai, P.R. China). All cell lines were incubated in RPMI 1640 (Gibco, Thermo Fisher Scientific, Waltham, MA, USA), supplemented with 10% fetal bovine serum (FBS; Gibco, Thermo Fisher Scientific), 100 U/mL penicillin G and 100 μg/mL streptomycin (Gibco, Thermo Fisher Scientific) at 37°C and 5% CO2/95% air.
Cell culture and metabolic labeling
PC-1.0 and PC-1 cells were cultured in complete growth medium. For the SILAC experiment, PC-1.0 cells were labeled with heavy [13C6, 15N2] L-lysine and [13C6, 15N4] L-arginine, and PC-1 cells were labeled with light [4, 4, 5, 5-D4] L-lysine and [13C6] L-arginine (Thermo Fisher Scientific) in RPMI 1640 medium. Cells were supplemented with 10% dialyzed FBS (Thermo Fisher Scientific) and cultured for eight passages to achieve maximum labeling efficiency. Three technical replicates were performed.
Preparation of protein samples (1-dodecyl-3-methylimidazolium chloride-assisted sample preparation method)
After the cells were cultured to nearly 80% confluence, media were replaced with fresh media and the cells were incubated for an additional 24 h. Then, cells were collected and suspended in 4% C12Im-Cl (m/v, 1% (v/v)) protease inhibitor cocktail and agitated for 5 min. Then, the extracting solutions were ultrasonicated for 120 s (10 s intervals every 5 s). After centrifugation (20,000× g for 5 min), the supernatant was collected and the bicinchoninic acid assay was employed for protein concentration measurement. The protein samples were further processed using the filter-aided sample preparation method with minor modifications.19 In brief, proteins were reduced and denatured by adding dithiothreitol and boiling at 95°C for 3 min. Then, the proteins were transferred to 10 kDa filter devices and sequentially washed with 200 μL of 8 M urea three times to remove the ionic liquids (C12Im-Cl). Afterwards, samples were alkylated with iodoacetic acid (IAA) for 30 min in darkness at room temperature and washed with 200 μL of 25 mM ammonium bicarbonate (ABC) two times. Next, tryptic digestion was performed by adding 1 μg of trypsin (Gibco, Thermo Fisher Scientific) in 100 μL ABC of 25 mM and incubating at 37°C for 16 h. Finally, the digests were obtained through centrifugation and dried in a SpeedVac Concentrator (Thermo Fisher Scientific).
Nano-RPLC-MS/MS analysis
Peptides were analyzed on a Q-Exactive MS (Thermo Fisher Scientific) coupled with an Dionex Ultimate 3000 (Thermo Fisher, Dreieich, Germany) nano-LC system. Protein digests were loaded on a home-packed C18 trap column and separated using a homemade capillary C18 analytical column (75 μm i.d.×15 cm). Each sample was analyzed in triplicate. Mobile phases consisted of phases A (98% H2O and 2% acetonitrile with 0.1% formic acid) and B (2% H2O and 98% acetonitrile with 0.1% formic acid). The gradient of the mobile Phase B was set as follows: 2%–6% B in 10 min, then to 6%–22% B in 83 min, to 35% B in 15 min, then to 80% B in 10 min, maintained at 80% B for 10 min, then to 2% B in 0.1 min, and maintained at 2% B for 12 min at a flow rate of 250 nL/min. The temperature of the ion transfer capillary was set at 275°C with a spray voltage of 2.5 kV. The Q-Exactive, performed at a resolution of 70,000 (MS1) and 17,500 (MS2), was performed in the positive ion data-dependent mode using one MS scan followed by 15 MS/MS scans with a 20 s exclusion window and a normalized collision energy of 28% for fragmentation. The automatic gain control was set to 1×10⁶ and 1×10⁵ for MS/MS. Total ion chromatograms and mass spectra were recorded at a range of 300–1,800 m/z with Xcalibur software (ver. 2.1.0; Thermo Fisher Scientific).
Data searching
Raw data files generated from nano-RPLC-MS/MS Mass Spectrometry Original documents were searched using Mascot (2.3.2) for automated peptide identification using UniProtKB (www.uniprot.org, 201705) proteome sequence databases. The Mascot settings were as follows: carbamidomethylation was specified as a fixed modification and methionine oxidation was specified as a variable modification; light (Lys4, +4.0251 Da and Arg6, +6.0201 Da) and heavy labels (Lys8, +8.0142 Da and Arg10, +10.0083 Da) were also considered fixed modifications; mass tolerances for Q-Exactive were set at 7 ppm for parent ions and 20 ppm for fragments. The other search parameters were set as follows: enzyme, trypsin; two missing cleavages sites. The false discovery rate was set as <1%. For protein quantification, default parameters were used.
Bioinformatic analysis
After three replicates, all proteins were reliably identified and quantified based on P-value <0.05. Protein ratios with >1.5-fold change were considered to be differentially expressed. To assemble the compendium, we mapped differentially expressed hamster proteins to their human homologs in the human Uniprot database on the basis of protein names. For cell component, biologic process and molecular function were identified using OmicsBean Analysis Tool (http://www.omicsbean.com) for gene ontology (GO) annotation. Pathway analysis of differentially expressed proteins was annotated from the Kyoto Encyclopedia of Genes and Genomes (KEGG) database (http://www.genome.jp/kegg/pathway). The enrichment analysis was determined by a two-tailed Fisher’s exact test to identify the enrichment of the differentially expressed proteins against the background of all identified proteins with a corrected P-value <0.05. Interaction between differentially expressed proteins was performed by Funrich software (version 3.0).20
Sample collection and IHC
Forty-two PDAC samples were retrospectively selected from the pathologic database of China Medical University Affiliated Shengjing Hospital, China, between 2010 and 2016, for IHC analysis. All patients received routine preoperative preparation and surgical therapy. There are 19 cases combined with clinically and pathologically diagnosed metastasis including liver metastasis, ascites metastasis, and regional lymph node metastasis (45.2%), and 23 cases without metastasis (54.8%). Twenty-eight cases (66.7%) were in stage I/II and 14 cases (33.3%) in stage III/IV. The study was approved by China Medical University Affiliated Shengjing Hospital Medical Research and New Technology Ethics Committee (Ethics Number: 2017PS11K). Written informed consents were obtained from all patients prior to tissue acquisitions. The clinical stage of patients was defined according to the American Joint Committee on Cancer tumor/node/metastasis staging system.21
The paraffin-embedded tissue sections were deparaffinized and dehydrated through graded alcohols and subjected to antigen retrieval using citrate buffer (pH 6.0) for 7 min on high heat. Sections were washed with PBS and then blocked with 0.3% hydrogen peroxide. Slides were incubated at 4°C with primary antibodies as follows: anti-PGAM1 (1:100; Abcam, Cambridge, UK), anti-HSPE1 (1:500; Abcam), anti-PDIA3 (1:100; Proteintech, Rosemont, IL, USA), and anti-CALR (1:20; Proteintech). The slides were visualized by diaminobenzidine chromogen solution (Dako, Glostrup, Denmark) and counterstained with routine hematoxylin, followed by dehydration through graded ethanol and mounting of the slides. The immunostaining densities of proteins were quantitatively assessed by NIS-Elements BR 3.0 (Nikon, Tokyo, Japan). In brief, after placing the sections on the microscope (Nikon E800), the images were transferred from a digital camera (Nikon 80i) to a computer. Three visual fields were randomly inspected on all slides under high-power magnification. The mean optical density of the positive areas was measured. The results are expressed as the exact value of the relative optical density units.
Western blot
Western blot was performed to verify the expressions of the top four proteins in two pairs of cell lines (PC-1.0 versus PC-1 and Aspc-1 versus Capan-2). Forty micrograms of protein of each cell line was resolved by 10% sodium dodecyl sulfate polyacrylamide gel electrophoresis and the antibodies were diluted as follows: anti-PGAM1 (1:1,000), anti-HSPE1 (1:5,000), anti-PDIA3 (1:1,000), anti-CALR (1:200), and anti-β-actin (1:2,000). Proteins were detected using enhanced chemiluminescence reagent (Santa Cruz Biotechnology, Dallas, TX, USA). Western blot signals were quantified using Amersham Imager 600 (GE Healthcare, Little Chalfont, UK), and band signals were expressed as relative protein amounts compared to β-actin.
siRNA transfection
siRNA was purchased from GenePharma (GenePharma Co., Ltd., Shanghai, China). The sequence of siRNA for PGAM1 was 5′-CCA CAU CUG UAG ACA UCU UTT-3′. Cells were transfected with 50 nM scramble siRNA (negative control), or PGAM1-siRNA by lipofectamine iMAX (Invitrogen, Carlsbad, CA, USA; Thermo Fisher Scientific) according to the manufacturer’s instructions. The silence efficiency was verified by Western blot.
3-phosphoglycerate (3-PG) and 2-phosphoglycerate (2-PG) concentrations
Cells (1×10⁶) were homogenized in 200 mL of ice-cold assay buffer (Sigma-Aldrich Co. LLC, St. Louis, MI, USA). The samples were centrifuged at 12,000× g for 5 min to remove the insoluble material, and the supernatant was transferred to a fresh tube. The reaction mixtures were set up and were mixed with an appropriate volume of the sample to a final 50 μL for each well according to the manufacturer’s instructions. The wells were mixed using a horizontal shaker and the plate incubated at room temperature for 40 min. The plate was protected from light during the incubation, and the absorbance was measured at 570 nm to measure cellular 2-PG and 3-PG concentrations.
Migration and invasion assay
Cell migration and invasion were measured with Transwell assay. Cells were transfected with siRNA or not treated, for 24 h. For migration assay, 50,000 cells in 400 μL of serum-free 1640 medium were loaded into the upper chambers, and the lower chambers (Millipore, Burlington, MA, USA) were supplemented with 0.6 mL of 1640 medium with 10% fetal bovine serum (FBS). For invasion assay, 50,000 cells were incubated in the upper chambers that were coated with Matrigel (1:6 dilution, BD Biosciences, San Jose, CA, USA). After 24 h incubation, the insert plates were rinsed with PBS 1× and fixed by methyl alcohol. They were stained with crystal violet at room temperature and the cells in the lower chamber were counted under light microscope in five random visual fields (×200).
Statistical analysis
Statistical analyses and graphics were conducted using GraphPad Prism 6.0 (GraphPad Software, San Diego, CA, USA). Comparisons of quantitative data were made using Student’s t-test (two-tailed; P<0.05 were considered statistically significant). Results are presented as mean±standard error of mean.
Results
Identification and quantification of differentially expressed proteins in PC-1.0 and PC-1 cell lines
Differentially expressed proteins between PC-1.0 and PC-1 cells were analyzed. In total, 3,972 proteins were identified, among which 3,254 proteins were quantified in all three replicates and searched against the database. By setting quantification ratio >1.5-fold change as threshold, 141 differentially expressed proteins (>1.5-fold change, P<0.05) were identified including 82 upregulated and 59 downregulated proteins in PC-1.0 cells. Table 1 lists the top five upregulated proteins with >1.5-fold change in expression in PC-1.0 cell line including PGAM1, HSPE1, WASF1, RPS27L, and MAK16. Table 2 lists the top five downregulated proteins with >1.5-fold change in expression in PC-1.0 cell line including PDIA3, CALR, LAMC1, FGD4, and LRPAP1 (Table S1 lists all 82 upregulated proteins with >1.5-fold change in expression and Table S2 lists all 59 downregulated proteins with >1.5-fold change in expression).
 | Table 1 List of top five upregulated proteins in PC-1.0 cells with >1.5-fold change in expression |
 | Table 2 List of top five downregulated proteins in PC-1.0 cells with >1.5-fold change in expression |
Biologic function, KEGG pathway, and protein–protein interaction (PPI) network analysis
To characterize the functions and subcellular locations of the differentially expressed proteins between this pair of cell lines, bioinformatic analysis on GO annotation, KEGG pathway analysis, and PPI network analysis were carried out. The GO annotation analysis included biologic process, cellular component, and molecular function. For the biologic process classification in GO annotation, the largest group was the proteins associated with the cell death (36%) and apoptotic process (36%), followed by nicotinamide adenine dinucleotide (NADH) metabolic process (10%), canonical glycolysis process (10%), glucose catabolic process to pyruvate (10%), and NADH regeneration (10%) (Figure 1A). The top three in the list of the cellular components were cytoplasm (90%), extracellular vesicle (76%), and membrane-bounded vesicle (74%) (Figure 1A). The differentially expressed proteins involved in binding (95%), protein binding (94%), and RNA binding (36%) accounted for the main proportion of proteins enriched by molecular function analysis (Figure 1A). This result indicated the GO analysis of all the differentially expressed proteins.
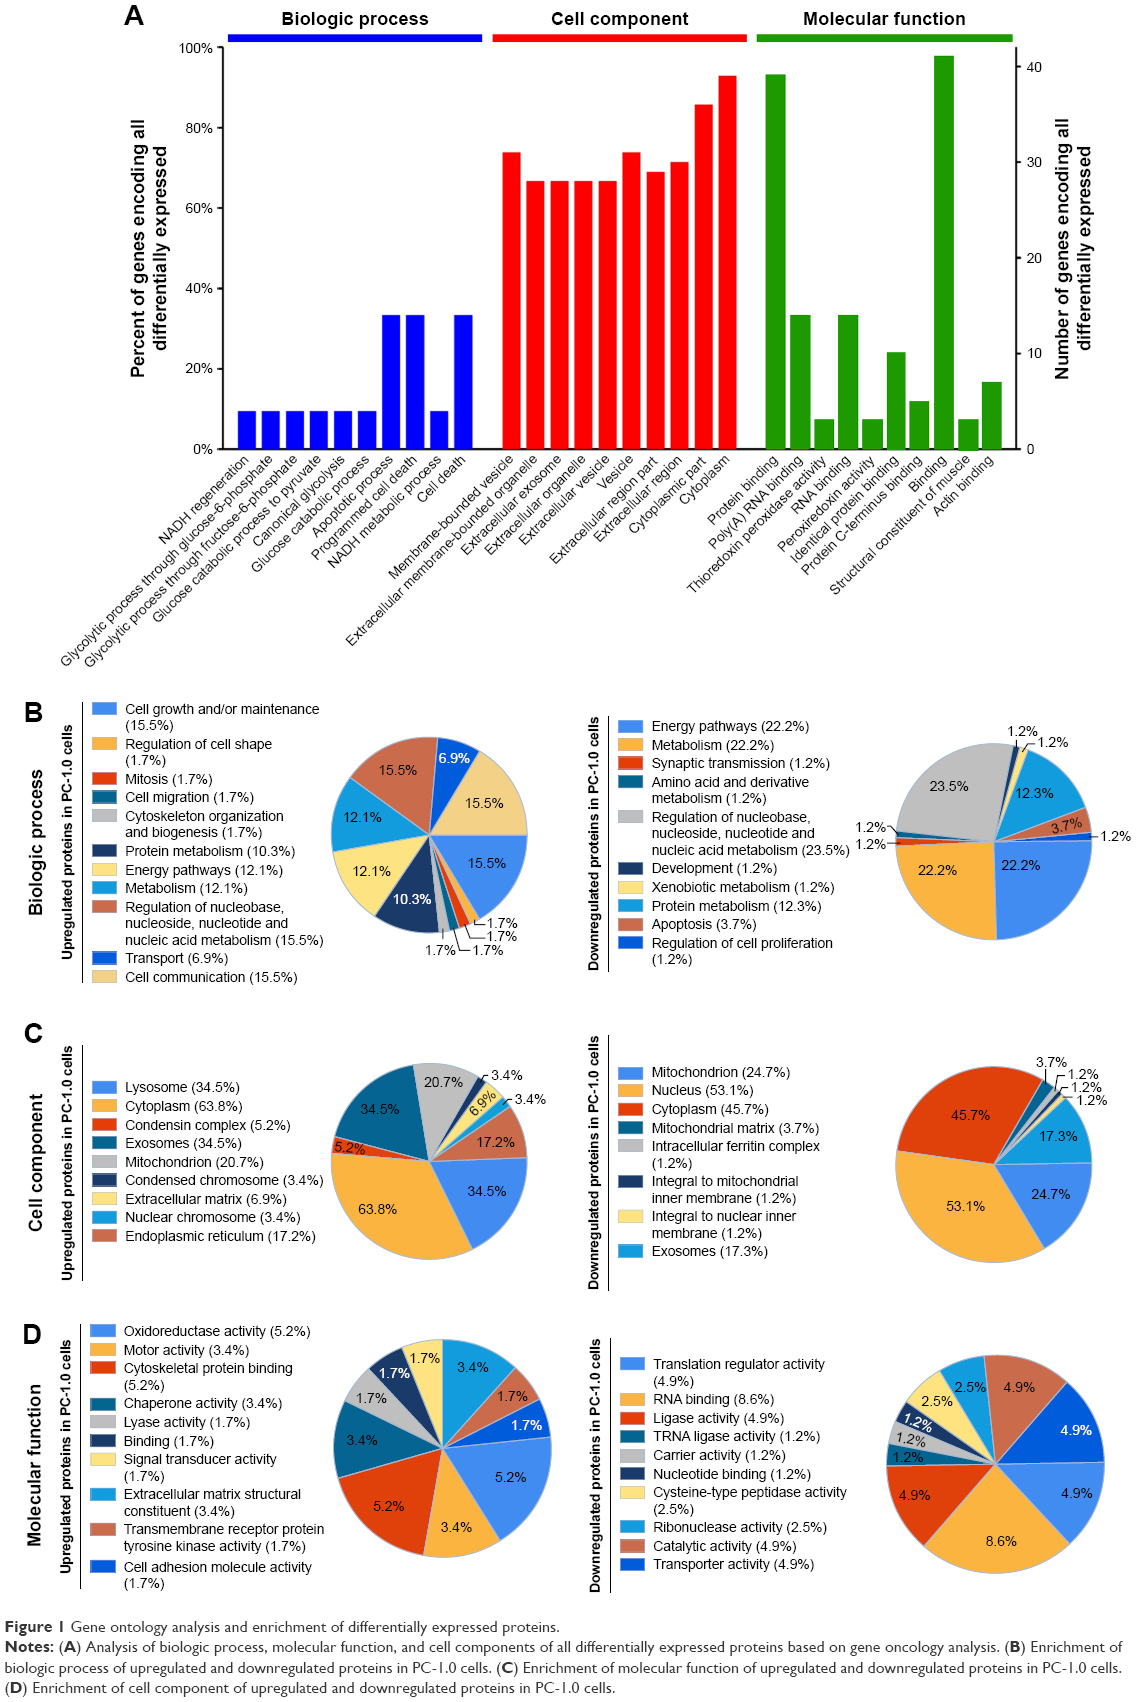 | Figure 1 Gene ontology analysis and enrichment of differentially expressed proteins. |
To reveal the nature of the upregulated and downregulated proteins in PC-1.0 cells compared with PC-1 cells, GO enrichment-based clustering analysis was performed. The biologic process enrichment-based clustering analysis showed that several processes were enriched in the upregulated proteins, including cell communication (15.5%), cell growth and/or maintenance (15.5%), metabolism (12.1%), transport (6.9%), and cell migration (1.7%). The processes enriched in the downregulated proteins were energy pathway (22.2%), protein metabolism (12.3%), apoptosis (3.7%), and regulation of cell proliferation (1.2%) (Figure 1B). In the cell component category, upregulated proteins were mainly distributed in cytoplasm (63.8%), exosome (34.5%), endoplasmic reticulum (17.2%), and extracellular matrix (6.9%). In contrast, downregulated proteins were located on nucleus (53.1%), cytoplasm (45.7%), mitochondrion (24.7%), and exosomes (17.3%) (Figure 1C). The molecular function enrichment-based clustering analysis indicated oxidoreductase activity (5.2%), extracellular matrix structure (3.4%), chaperone activity (3.4%), and cell adhesion molecule activity (1.7%). Functions enriched in the downregulated proteins correlated with RNA binding (8.6%), transporter activity (4.9%), catalytic activity (4.9%), and carrier activity (1.2%) (Figure 1D). This result indicated the GO analysis of the upregulated and downregulated differentially expressed proteins.
To identify cellular pathways, we performed clustering analysis based on the KEGG pathway. After analyzing all the differentially expressed proteins, the most active pathways include metabolic pathway, carbon metabolism, glycolysis, and HIF-1α signaling pathway (Figure 2A). Further enrichment-based clustering analysis showed that several pathways were enriched in the upregulated proteins including activator (uPA) and uPAR-mediated signaling (9.9%), epidermal growth factor (EGF) receptor (ErbB1) signaling pathway (9.9%), mammalian target of rapamycin (mTOR) signaling pathway (9.9%), Class 1 PI3K signaling events (9.9%), C-MYC pathway (6.2%), integrin-linked kinase signaling (3.7%), HIF-1α transcription factor network (1.2%), and glucose metabolism (1.2%) (Figure 2B). The signaling pathways enriched in downregulated proteins include nucleoside, nucleotide, and nucleic metabolism (23.5%), energy metabolism (22.2%), apoptosis (3.7%), and synaptic transmission (1.2%) (Figure 2C). This result indicated the pathway analysis of overall differentially expressed proteins as well as the pathway analysis of upregulated and downregulated differentially expressed proteins, respectively.
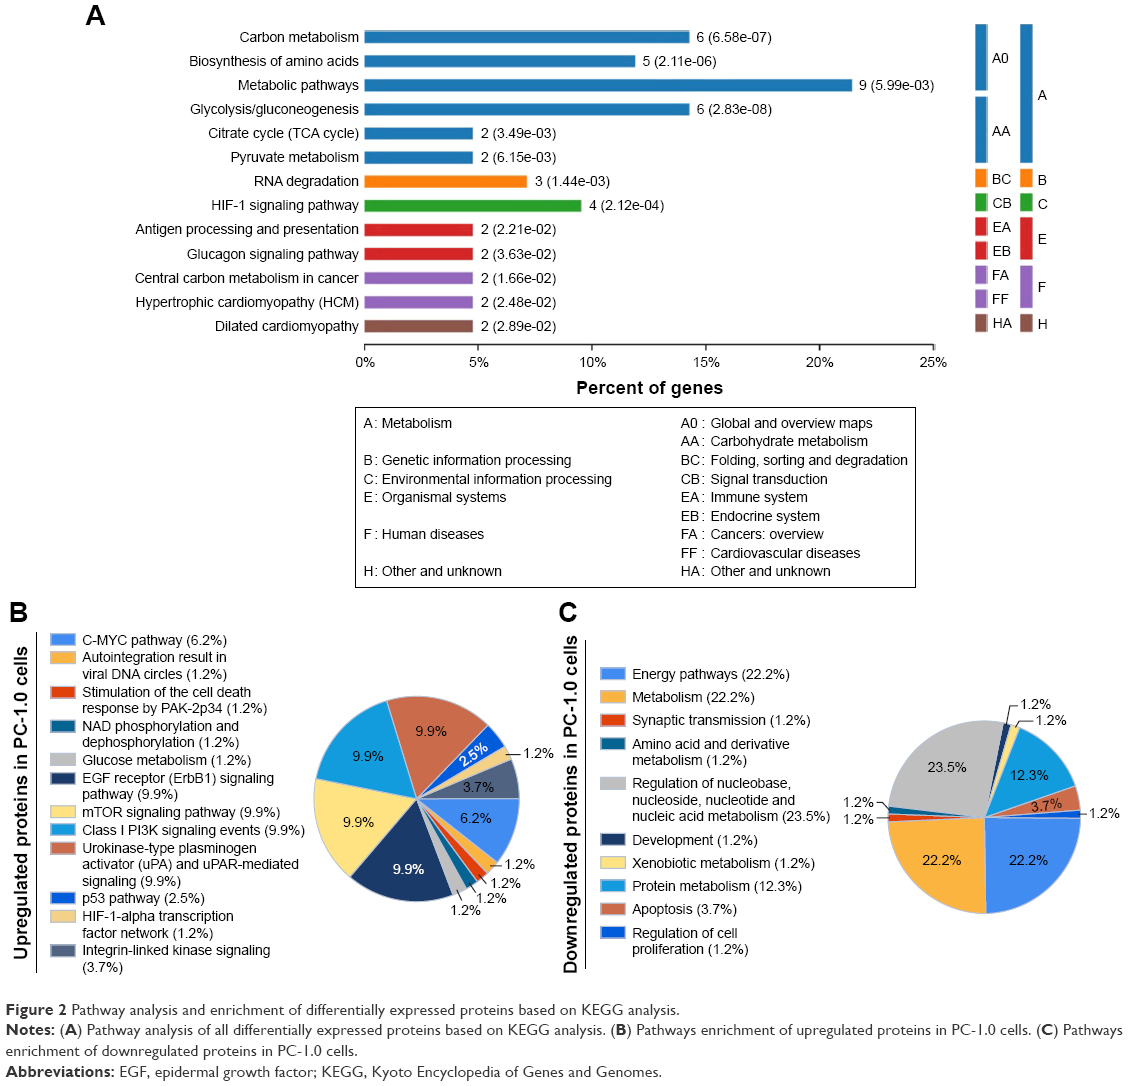 | Figure 2 Pathway analysis and enrichment of differentially expressed proteins based on KEGG analysis. |
To identify the chief nodes and important connectors among the differentially expressed proteins, we performed the PPI network analysis by Funrich software. There were 43 upregulated proteins that had at least one known interaction with other proteins in the PPI network (P-value=3.22e-15; Figure 3A). The highest active proteins with three or more interactions were TFAP2A, CASP3, RPS27L, PRPF8, SHMT2, PSPC1, GNL3, MDRG1, HSPE1, ETHE1, NUDT5, and RBCK1. Twenty-four downregulated proteins have at least one known interaction with other proteins in the PPI network (P-value=4.57e-07) (Figure 3B). The highest active proteins with three or more interactions were PDIA3, MYO1B, MPR1P, CBR1, SMC2, BAIAP2, CLIP1, EGFR, STAT3, STMN1, CDK1, KPNA2, LRPAP1, and CALR. The direct interactions between these highest active proteins and the active proteins in enriched pathways are also shown. The PPI result indicated the close cooperation among these differentially expressed proteins.
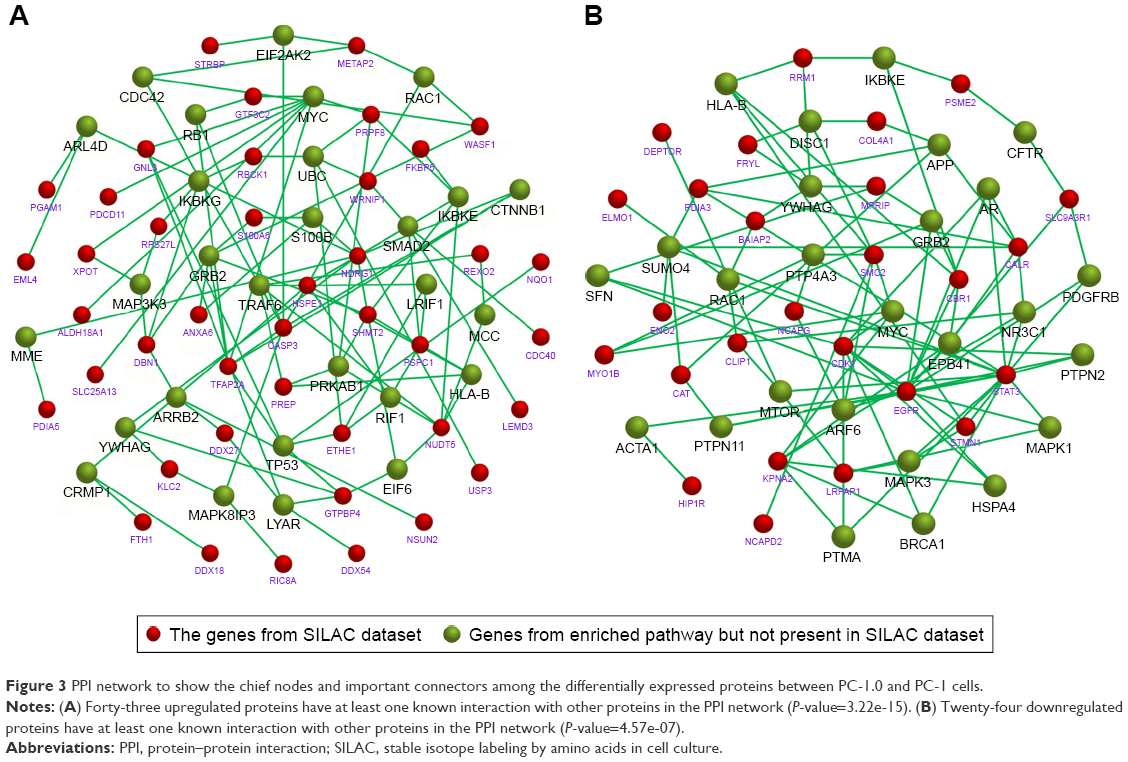 | Figure 3 PPI network to show the chief nodes and important connectors among the differentially expressed proteins between PC-1.0 and PC-1 cells. |
Validation of differentially expressed proteins by IHC on clinical human PDAC pathologic tissues and Western blot on pancreatic cancer cell lines
We chose the top two upregulated proteins (PGAM1 and HSPE1) and top two downregulated proteins (PDIA3 and CALR) in PC-1.0 cells to verify their expression levels on clinical human PDAC pathologic tissues by IHC. The results (Figure 4A) showed that PGAM1 and HSPE1 showed higher expressions on PDAC tissues with clinical metastasis, compared to the tissue without clinical metastasis. However, there were no statistical differences of the expressions of PDIA3 and CALR on clinical tissues. We performed Western blot in two pairs of cell lines (PC-1.0 versus PC-1 and Aspc-1 versus Capan-2). The results (Figure 4B) indicated that PGAM1 and HSPE1 were upregulated in highly metastatic PC-1.0 and Aspc-1 cells, while PDIA3 and CALR were upregulated in weakly metastatic PC-1 and Capan-2 cells. These results were consistent with the MS quantification data.
 | Figure 4 Verification of top four differentially expressed proteins by immunohistochemistry and Western blot. |
Silencing PGAM1 altered the intracellular levels of 3-PG and 2-PG
To further investigate the role of PGAM1 on pancreatic cancer cells’ biologic functions, we decreased the expression of PGAM1 by siRNA silencing, and the silencing efficiencies were >70%, which was verified by Western blot (Figure 5A). Furthermore, to evaluate the changes of intracellular 3-PG and 2-PG after silencing PGAM1, we tested the intracellular concentrations of 3-PG and 2-PG. Silencing PGAM1 by siRNA led to the increase of 3-PG and the decrease of 2-PG in PC-1.0, Aspc-1, PC-1, and Capan-2 cell lines (Figure 5B and C).
 | Figure 5 The changes in the intracellular levels of 3-PG and 2-PG, the cellular morphologies, and the migration and invasion abilities of pancreatic cancer cells after silencing PGAM1 by siRNA. |
Silencing PGAM1 inhibited the migration and invasion of the pancreatic cancer cell lines
First, after PGAM1 was silenced, we found the morphologic changes of cells. Normally, PC-1.0 and Aspc-1 cells grow in a scattered pattern, while both PC-1 and Capan-2 grow in a pattern of island-like cell colonies. After silencing PGAM1 for 24–48 h, light microscopic images showed that the growth patterns of PC-1.0 and Aspc-1 cells became less dispersed with the contraction of pseudopodia, and the intercellular space also decreased. However, not many changes were observed in the island-like growth patterns of PC-1 and Capan-2 (Figure 5D).
To investigate the role of PGAM1 on migration and invasion of pancreatic cancer cell lines, we next performed the Transwell assays. Results showed that, after silencing PGAM1, the migration and invasion ability of PC-1.0 and Aspc-1 cells were significantly inhibited by >80% and 75%, respectively (Figure 5E). The migration and invasion abilities of PC-1 and Capan-2 cells were also inhibited, but the inhibitory effect was just >35% and 30%, respectively (Figure 5F). The results indicated that the promoting role of PGAM1 on cell migration and invasion was much more obvious in highly metastatic pancreatic cancer cells compared with weakly metastatic pancreatic cancer cells.
Discussion
In this research, we used SILAC and nano-RPLC-MS/MS to perform the comparative proteomics of two homologous hamster pancreatic cancer cell lines PC-1.0 and PC-1, which are different in metastatic ability. A total of 141 differentially expressed proteins (82 upregulated and 59 downregulated in PC-1.0 cells) were identified showing obvious differential expression (>1.5-fold change). These proteins mainly exist in the cytoplasm and membrane-bounded vesicle and are involved in a wide variety of metabolic pathways and biologic functions, such as glycolytic process, apoptosis, and intracellular binding. By analyzing the whole differentially expressed proteins, we found that many biologic processes were much more active in the highly metastatic pancreatic cancer cell line (PC-1.0), including glycolytic process and cell communication (Figure 1B). The proteins involved in extracellular matrix structure constitution, cell adhesion molecule activity, and cell binding were also enriched in molecular function (Figure 1C). These results allow us to recognize the several important aspects of the tumor cells dissociation from the in situ and free localization in the target organ. Correspondingly, pathways enrichment showed us the most active pathways associated with PDAC invasion and metastasis process, including C-MYC, mTOR, PI3K-Akt pathway, integrin-linked kinase, and glucose metabolism pathways (Figure 2B). C-MYC pathway plays an important role in cell-cycle progression, apoptosis, and cellular transformation.22 The mTOR pathway and PI3K signaling pathway were the central pathways modulating the metabolism, proliferation, and invasion of tumor cells.23–25 Integrins play important roles in intracellular junctions and modulate the detachment of tumor cells.26 These pathways are thought to modulate the molecular functions and the biologic processes mentioned above and have interactions between each other. These results provided us with a very precise and comprehensive examination of proteins involved in invasion and metastasis of PDAC.
The verifications of the top two upregulated proteins PGAM1 and HSPE1 and top two downregulated proteins PDIA3 and CALR in PC-1.0 cells were performed by IHC on clinical human PDAC pathologic tissues and Western blot of pancreatic cancer cell lines. PGAM1 and HSPE1 showed overexpressions in PDAC tissues with clinical metastasis compared to the tissues without clinical metastasis, and in highly metastatic pancreatic cancer cell lines.
Chaperonin 10 (HSPE1), also known as Hsp10, was the second obvious upregulated protein in PC-1.0 cells. Although it was found to be overexpressed in various types of cancers such as leukemia, prostate cancer, large bowel cancer, and cervical cancer,27–30 the role of HSPE1 in tumor progression is still unclear. Rappa et al31 reported that HSPE1 might be involved in carcinogenesis from very early stages, and also during the progression of tumor. HSPE1 was also found to downregulate immune response and facilitate immune escape of cancer.32 In our study, we verified the overexpression of HSPE1 in PDAC tissue with clinical metastasis and in highly metastatic pancreatic cancer cell lines (Figure 4A and B). This is the first time an association between HSPE1 and metastasis of pancreatic cancer has been found. Further research on HSPE1 is needed.
The top two downregulated proteins are PDIA3 and CALR, which are both endoplasmic reticulum chaperones and with similar function and close interactions. CALR, also known as calregulin or ERp60, is primarily localized to the endoplasmic reticulum to regulate Ca2+ homeostasis and induce transcriptional regulation. It has been found to be upregulated in various kinds of human cancers, including liver cancer, colon cancer, and oral squamous cell carcinoma.33–36 Some research has indicated that CALR promotes cancer progression and malignant behavior.33 PDIA3, also known as glucose-regulated protein (GRP58), acts as a thiol oxidoreductase. It is located in endoplasmic reticulum and interacts with CALR to modulate folding of newly synthesized glycoproteins.37 Chung et al demonstrate that downregulation of PDIA3 is correlated with poor prognosis in early-stage cervical cancer.38 In this research, PDIA3 and CALR were found to be upregulated in weakly metastatic pancreatic cancer cell lines, which means that PDIA3 and CALR may have no positive roles on promoting the progression of PDAC. Further research on these two proteins are needed.
In this research, PGAM1 ranks the first of the upregulated proteins in PC-1.0 cells. PGAM1 is a glycolytic enzyme, catalyzing the reversible reaction of 3-PG to 2-PG, which is a crucial step in glycolysis. Although PGAM1 is a crucial protein in glycolysis, the relationship between PGAM1 and cancer has only recently been discovered. Several studies reported the overexpression of PGAM1 in lung cancer, hepatocellular carcinoma, and oral squamous cell carcinoma.39–41 According to the “Warburg effect”, tumor cells often choose glycolysis to generate energy even in an oxygen-sufficient environment, although the energy production of glycolysis is lower compared to the tricarboxylic acid cycle.42 Therefore, the upregulation of PGAM1 in PDAC is understandable and thought to be associated with malignant change of tumor cells. Previous studies on PGAM1 mostly centered on the regulation of metabolism. For example, in a review from Jiang et al,43 PGAM1 was indicated to have roles on promoting cancer proliferation through elevating the energy production by glycolysis. However, the role of PGAM1 associated with tumor invasion and metastasis has seldom been reported. In this research, we confirmed the promoting role of PGAM1 in PDAC invasion and metastasis. We found that PGAM1 was overexpressed in PDAC tissue with clinical metastasis and highly metastatic pancreatic cancer cell lines (Figure 4A and B). Silencing PGAM1 decreased the pseudopodium extension of highly metastatic pancreatic cancer cells and made the cells less dispersed (Figure 5A). Transwell analysis confirmed the promoting role of PGAM1 on migration and invasion in pancreatic cancer cell lines. And, this promoting role is more pronounced in highly metastatic cell lines compared to weakly metastatic cell lines (Figure 5B and C). Although its distinguished roles on highly metastatic cell lines may be associated with a higher energy production from glycolysis, the promotion of PGAM1 on PDAC metastasis seems difficult to explain solely in terms of metabolism. It cannot be ruled out that the function of PGAM1 is diverse and correlates with other nonglycolytic proteins or pathways. In a recent research from Zhang et al, PGAM1 was demonstrated to promote cancer cell migration through interaction with α-smooth muscle actin (ACTA2) regardless of intact metabolic activity.44 This means that a potential nonglycolytic function of PGAM1 may exist, which can also explain its promoting role in PDAC metastasis. The potential multiple functions of individual glycolytic enzymes certainly bring us new ideas and warrant further investigation.
As PGAM1 has been suggested to have potential promoting roles in cancer, several PGAM1 inhibitors have been developed. MJE3 is a small-molecule compound that inhibits PGAM1 by hydrolyzing in situ to produce an acid product, which decreases breast cancer cell proliferation.39 PGMI-004A is a small-molecule inhibitor that increases 3-PG and decreases 2-PG levels in cancer cells, leading to significantly decreased glycolysis, pentose-phosphate pathway flux, and biosynthesis.45 PGMI-004A attenuates primary leukemia cell proliferation and tumor growth; however, it was not reported to influence tumor invasion or metastasis. With the progress of understanding the roles of PGAM1 in tumor, more effective inhibitors targeting on PGAM1 will also be developed.
In summary, the present study offers a complete mapping of comparative proteomics between a pair of homologous pancreatic cancer cell lines with different metastatic abilities. Many differentially expressed proteins were screened out from the study and analyzed by bioinformatics analysis. These proteins provided us precise and comprehensive information of PDAC invasion and metastasis. PGAM1 is suggested as a potential therapy target on PDAC invasion and metastasis.
Disclosure
The authors report no conflicts of interest in this work.
References
Bailey P, Chang DK, Nones K, et al. Genomic analyses identify molecular subtypes of pancreatic cancer. Nature. 2016;531(7592):47–52. | ||
Pancreatic Cancer Treatment (PDQ(R)): Health Professional Version. PDQ Cancer Information Summaries. Bethesda, MD; 2002. | ||
Deplanque G, Demartines N. Pancreatic cancer: are more chemotherapy and surgery needed? Lancet. 2017;389(10073):985–986. | ||
Egami H, Takiyama Y, Cano M, Houser WH, Pour PM. Establishment of hamster pancreatic ductal carcinoma cell line (PC-1) producing blood group-related antigens. Carcinogenesis. 1989;10(5):861–869. | ||
Hirota M, Egami H, Corra S, et al. Production of scatter factor-like activity by a nitrosamine-induced pancreatic cancer cell line. Carcinogenesis. 1993;14(2):259–264. | ||
Egami H, Tomioka T, Tempero M, Kay D, Pour PM. Development of intrapancreatic transplantable model of pancreatic duct adenocarcinoma in Syrian golden hamsters. Am J Pathol. 1991;138(3):557–561. | ||
Tan X, Zhou L, Wang W, et al. Genomic analysis of invasion-metastasis-related factors in pancreatic cancer cells. Exp Ther Med. 2010;1(1):211–216. | ||
Tan X, Liu P, Huang Y, et al. Phosphoproteome analysis of invasion and metastasis-related factors in pancreatic cancer cells. PLoS One. 2016;11(3):e0152280. | ||
Liu P, Weng Y, Sui Z, et al. Quantitative secretomic analysis of pancreatic cancer cells in serum-containing conditioned medium. Sci Rep. 2016;6:37606. | ||
Jiang H, English AM. Quantitative analysis of the yeast proteome by incorporation of isotopically labeled leucine. J Proteome Res. 2002;1(4):345–350. | ||
Ong SE, Blagoev B, Kratchmarova I, et al. Stable isotope labeling by amino acids in cell culture, SILAC, as a simple and accurate approach to expression proteomics. Mol Cell Proteomics. 2002;1(5):376–386. | ||
Zhao Q, Fang F, Liang Y, et al. 1-Dodecyl-3-methylimidazolium chloride-assisted sample preparation method for efficient integral membrane proteome analysis. Anal Chem. 2014;86(15):7544–7550. | ||
Singh SK, Mishra MK, Eltoum IA, Bae S, Lillard JW Jr, Singh R. CCR5/CCL5 axis interaction promotes migratory and invasiveness of pancreatic cancer cells. Sci Rep. 2018;8(1):1323. | ||
Xiong J, Wang D, Wei A, et al. Deregulated expression of miR-107 inhibits metastasis of PDAC through inhibition PI3K/Akt signaling via caveolin-1 and PTEN. Exp Cell Res. 2017;361(2):316–323. | ||
Yang JC, Zhang Y, He SJ, et al. TM4SF1 promotes metastasis of pancreatic cancer via regulating the expression of DDR1. Sci Rep. 2017;7:45895. | ||
Belvedere R, Bizzarro V, Popolo A, et al. Role of intracellular and extracellular annexin A1 in migration and invasion of human pancreatic carcinoma cells. BMC Cancer. 2014;14:961. | ||
Yuan XP, Dong M, Li X, Zhou JP. GRP78 promotes the invasion of pancreatic cancer cells by FAK and JNK. Mol Cell Biochem. 2015;398(1–2):55–62. | ||
Yu C, Zhan L, Jiang J, et al. KAP-1 is overexpressed and correlates with increased metastatic ability and tumorigenicity in pancreatic cancer. Med Oncol. 2014;31(7):25. | ||
Wisniewski JR, Zougman A, Nagaraj N, Mann M. Universal sample preparation method for proteome analysis. Nat Methods. 2009;6(5):359–362. | ||
Pathan M, Keerthikumar S, Ang CS, et al. FunRich: an open access standalone functional enrichment and interaction network analysis tool. Proteomics. 2015;15(15):2597–2601. | ||
Chatterjee D, Katz MH, Foo WC, et al. Prognostic significance of new AJCC tumor stage in patients with pancreatic ductal adenocarcinoma treated with neoadjuvant therapy. Am J Surg Pathol. 2017;41(8):1097–1104. | ||
Pourteimoor V, Paryan M, Mohammadi-Yeganeh S. microRNA as a systemic intervention in the specific breast cancer subtypes with C-MYC impacts; introducing subtype-based appraisal tool. J Cell Physiol. Epub 2017 Feb 27. | ||
Fresno Vara JA, Casado E, de Castro J, Cejas P, Belda-Iniesta C, Gonzalez-Baron M. PI3K/Akt signalling pathway and cancer. Cancer Treat Rev. 2004;30(2):193–204. | ||
Hou T, Zhou L, Wang L, Kazobinka G, Zhang X, Chen Z. CLCA4 inhibits bladder cancer cell proliferation, migration, and invasion by suppressing the PI3K/AKT pathway. Oncotarget. 2017;8(54):93001–93013. | ||
Beevers CS, Li F, Liu L, Huang S. Curcumin inhibits the mammalian target of rapamycin-mediated signaling pathways in cancer cells. Int J Cancer. 2006;119(4):757–764. | ||
Pandolfi F, Franza L, Altamura S, et al. Integrins: integrating the biology and therapy of cell-cell interactions. Clin Ther. 2017;39(12):2420–2436. | ||
Cappello F, Rappa F, David S, Anzalone R, Zummo G. Immunohistochemical evaluation of PCNA, p53, HSP60, HSP10 and MUC-2 presence and expression in prostate carcinogenesis. Anticancer Res. 2003;23(2B):1325–1331. | ||
Cappello F, Bellafiore M, David S, Anzalone R, Zummo G. Ten kilodalton heat shock protein (HSP10) is overexpressed during carcinogenesis of large bowel and uterine exocervix. Cancer Lett. 2003;196(1):35–41. | ||
Cappello F, Tripodo C, Farina F, Franco V, Zummo G. HSP10 selective preference for myeloid and megakaryocytic precursors in normal human bone marrow. Eur J Histochem. 2004;48(3):261–265. | ||
Ghobrial IM, McCormick DJ, Kaufmann SH, et al. Proteomic analysis of mantle-cell lymphoma by protein microarray. Blood. 2005;105(9):3722–3730. | ||
Rappa F, Pitruzzella A, Marino Gammazza A, et al. Quantitative patterns of Hsps in tubular adenoma compared with normal and tumor tissues reveal the value of Hsp10 and Hsp60 in early diagnosis of large bowel cancer. Cell Stress Chaperones. 2016;21(5):927–933. | ||
Corrao S, Campanella C, Anzalone R, et al. Human Hsp10 and Early Pregnancy Factor (EPF) and their relationship and involvement in cancer and immunity: current knowledge and perspectives. Life Sci. 2010;86(5–6):145–152. | ||
Feng R, Ye J, Zhou C, et al. Calreticulin down-regulation inhibits the cell growth, invasion and cell cycle progression of human hepatocellular carcinoma cells. Diagn Pathol. 2015;10:149. | ||
Peng RQ, Chen YB, Ding Y, et al. Expression of calreticulin is associated with infiltration of T-cells in stage IIIB colon cancer. World J Gastroenterol. 2010;16(19):2428–2434. | ||
Chiang WF, Hwang TZ, Hour TC, et al. Calreticulin, an endoplasmic reticulum-resident protein, is highly expressed and essential for cell proliferation and migration in oral squamous cell carcinoma. Oral Oncol. 2013;49(6):534–541. | ||
Sheng W, Chen C, Dong M, et al. Overexpression of calreticulin contributes to the development and progression of pancreatic cancer. J Cell Physiol. 2014;229(7):887–897. | ||
Leach MR, Cohen-Doyle MF, Thomas DY, Williams DB. Localization of the lectin, ERp57 binding, and polypeptide binding sites of calnexin and calreticulin. J Biol Chem. 2002;277(33):29686–29697. | ||
Chung H, Cho H, Perry C, et al. Downregulation of ERp57 expression is associated with poor prognosis in early-stage cervical cancer. Biomarkers. 2013;18(7):573–579. | ||
Evans MJ, Saghatelian A, Sorensen EJ, Cravatt BF. Target discovery in small-molecule cell-based screens by in situ proteome reactivity profiling. Nat Biotechnol. 2005;23(10):1303–1307. | ||
Ren F, Wu H, Lei Y, et al. Quantitative proteomics identification of phosphoglycerate mutase 1 as a novel therapeutic target in hepatocellular carcinoma. Mol Cancer. 2010;9:81. | ||
Zhang D, Wu H, Zhang X, et al. Phosphoglycerate mutase 1 predicts the poor prognosis of oral squamous cell carcinoma and is associated with cell migration. J Cancer. 2017;8(11):1943–1951. | ||
Ward PS, Thompson CB. Metabolic reprogramming: a cancer hallmark even warburg did not anticipate. Cancer cell. 2012;21(3):297–308. | ||
Jiang X, Sun Q, Li H, Li K, Ren X. The role of phosphoglycerate mutase 1 in tumor aerobic glycolysis and its potential therapeutic implications. Int J Cancer. 2014;135(9):1991–1996. | ||
Zhang D, Jin N, Sun W, et al. Phosphoglycerate mutase 1 promotes cancer cell migration independent of its metabolic activity. Oncogene. 2017;36(20):2900–2909. | ||
Hitosugi T, Zhou L, Elf S, et al. Phosphoglycerate mutase 1 coordinates glycolysis and biosynthesis to promote tumor growth. Cancer Cell. 2012;22(5):585–600. |
 © 2018 The Author(s). This work is published and licensed by Dove Medical Press Limited. The
full terms of this license are available at https://www.dovepress.com/terms
and incorporate the Creative Commons Attribution
- Non Commercial (unported, 3.0) License.
By accessing the work you hereby accept the Terms. Non-commercial uses of the work are permitted
without any further permission from Dove Medical Press Limited, provided the work is properly
attributed. For permission for commercial use of this work, please see paragraphs 4.2 and 5 of our Terms.
© 2018 The Author(s). This work is published and licensed by Dove Medical Press Limited. The
full terms of this license are available at https://www.dovepress.com/terms
and incorporate the Creative Commons Attribution
- Non Commercial (unported, 3.0) License.
By accessing the work you hereby accept the Terms. Non-commercial uses of the work are permitted
without any further permission from Dove Medical Press Limited, provided the work is properly
attributed. For permission for commercial use of this work, please see paragraphs 4.2 and 5 of our Terms.